
 Submit a Paper
 Propose a Special lssue
 Open Access
ARTICLE

Anomaly Detection Using Data Rate of Change on Medical Data
1 AI Convergence Research Institute, Chosun University, Gwangju, 61452, Republic of Korea
2 Interdisciplinary Program of Architectural Studies, Chonnam University, Gwangju, 61186, Republic of Korea
3 AINTCHAIN SOFT Co., Ltd., Mokpo-si, 58750, Republic of Korea
4 BK21 Human Resources Development Project Group, Chosun University, Gwangju, 61452, Republic of Korea
* Corresponding Author: Jeong-In Kim. Email:
Computers, Materials & Continua 2024, 80(3), 3903-3916. https://doi.org/10.32604/cmc.2024.054620
Received 03 June 2024; Accepted 02 August 2024; Issue published 12 September 2024
 View Full Text
 Download PDF
Abstract
The identification and mitigation of anomaly data, characterized by deviations from normal patterns or singularities, stand as critical endeavors in modern technological landscapes, spanning domains such as Non-Fungible Tokens (NFTs), cyber-security, and the burgeoning metaverse. This paper presents a novel proposal aimed at refining anomaly detection methodologies, with a particular focus on continuous data streams. The essence of the proposed approach lies in analyzing the rate of change within such data streams, leveraging this dynamic aspect to discern anomalies with heightened precision and efficacy. Through empirical evaluation, our method demonstrates a marked improvement over existing techniques, showcasing more nuanced and sophisticated result values. Moreover, we envision a trajectory of continuous research and development, wherein iterative refinement and supplementation will tailor our approach to various anomaly detection scenarios, ensuring adaptability and robustness in real-world applications.Keywords
Nomenclature
| Term 1 | Interpretation 1 |
| Term 2 | Interpretation 2 |
| e.g., | |
| Porosity | |
| s | Skin factor |
In statistics, anomalies are data that deviate from general patterns or exhibit unexpected characteristics. Anomalous data appear in a wide variety of forms, including local outliers, which occur in specific areas or segments of data series; global outliers, which represent unusual values that deviate from an entire dataset; and contextual outliers, which occur due to changes in specific states or situations at specific times [1,2].
Anomaly detection is the process of classifying given data as normal or anomalous. Outlier analysis is typically performed using statistical methods, machine learning, or deep learning. Statistical methods find outliers based upon original data—such as the mean, standard deviation, and quantiles—whereas machine-learning-based approaches can be classified as supervised or unsupervised. Currently, the use of unsupervised learning is predominant. In the context of deep learning, recurrent neural networks (RNNs), variational autoencoders (VAEs), and generative adversarial networks (GANs) are used to detect anomalies in complex and dynamic data [3–6].
Efforts are being made to obtain more accurate results by fusing various methods to identify data characteristics and direction, as well as to capture insights present within data, instead of using singular methods. Anomaly detection of medical data also plays an important role. Due to the nature of medical data, the number of anomaly patient data is significantly insufficient compared to normal patient data. As a result, a data imbalance occurs, a phenomenon in which the number of anomaly patient data is insufficient compared to normal patient data. In fact, if model learning is performed with a dataset in which a data imbalance occurs, overfitting may occur, resulting in unreliable prediction results. For this reason, anomality detection in medical data often relies on unsupervised learning.
Fig. 1 is a diagram showing the main steps related to the processing of medical data and how each step relates to anomaly detection. Once the medical data is generated, it is first used for prediction and diagnosis. The task of prediction involves predicting physiological conditions, such as heart rate or blood flow. Through anomaly detection, unique characteristics of physiological data can be captured and medical implementations using them can provide very important information to patients [7–11].
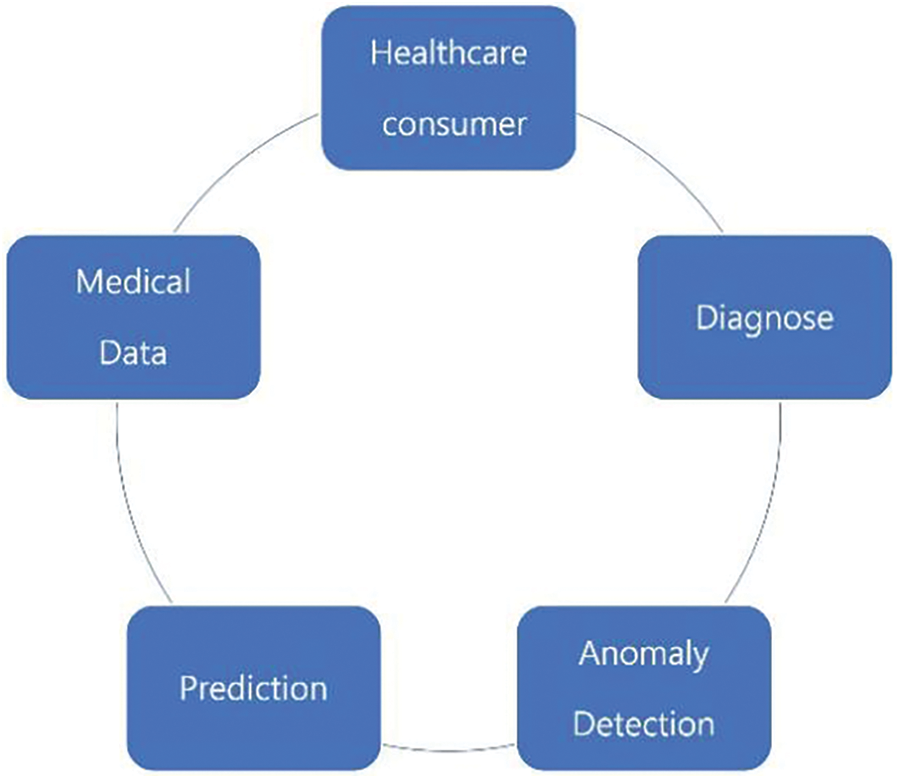
Figure 1: Medical data structure in anomaly detection
However, if abnormal detection is not performed properly in determining medical data, it can have fatal consequences for patients. Therefore, it is very important to detect abnormal data even in small changes rather than malfunctions in abnormal data detection in medical data. Medical data prediction and diagnosis require more rigorous and sensitive abnormality detection performance than general data. The present study proposes an anomaly detection method for time-series data. Whereas conventional methods for time-series data primarily employ density analysis using the mean and variance to find statistical outliers, the proposed method does not directly use raw data when generating the time series, instead statistically analyzing the amount of data change between the pre-data and post-data. The anomaly detection effect of the proposed method is equivalent for local, global, and contextual outliers, maintaining effectiveness even for datasets containing a mixture of different outlier types.
2 Anomalies in Time-Series Data
Anomaly detection methods typically involve a pre-processing stage and can be classified as supervised or unsupervised. Supervised learning can be regarded as a machine learning technique that uses artificial intelligence (AI) and applies labels that simultaneously include the data to be learned and indicate whether the result is normal. Machine learning requires large quantities of data, wherein ground-truth labels are paired with normal data. Data must also be reliably collected and evenly distributed among various classes.
In contrast, unsupervised learning is performed on data without corresponding ground-truth labels. Instead, data are clustered and summarized according to their characteristics. The clustering process necessitates dimensionality reduction; here, cluster analysis and principal component analysis (PCA) are typically used. Unlike supervised learning, unsupervised learning does not require data to be even, allowing for efficient and stable learning even with unbalanced data. However, it has suboptimal anomaly detection capabilities in data groups where anomalies are frequent.
When dealing with non-time-series data, anomaly detection does not guarantee evenness between normal and abnormal data. To solve this, after setting the standard for normal data, abnormal data are detected separately. Density-based methods can be used to divide the data area into normal and abnormal sectors. The normal data area can be determined by methods such as Gaussian distribution, support vector machine, Gaussian mixture models, Density-based spatial clustering of applications with noise (DBSCAN), and local outlier factors (LOFs). The Gaussian distribution method assumes a unimodal region and utilizes a minimum covariance determinant, with the Gaussian covariance matrix approximated through maximum likelihood estimation [12–15].
Anomaly detection data is also a very important factor in the Non-Fungible Token (NFT) environment. Outliers in signals coming and going from the trading environment of the NFT market and the implementation of communication for NFT authentication are important factors that satisfy system integrity [16–18].
Anomalous data are typically detected in real time using gated recurrent units (GRUs), convolutional neural networks (CNNs), VAEs, and GANs. Because these methods employ the AI techniques of deep learning, they have the disadvantage of requiring prior data processing until sufficient learning is achieved.
Although statistical normality is generally considered satisfied when the size N of the input data exceeds 30, deep learning techniques require a much larger amount of data.
Point anomalies are errors that indicate values outside the normal range at one or two specific points, signifying values that deviate from other observations at a specific point in time. As shown in Fig. 2, point anomalies can be defined in both univariate and multivariate data. Such anomalies can stem from the characteristics of time-series data, such as temporary sensor errors and instantaneous noise, and appear outside the upper or lower control limits (UCLs or LCLs), which are pre-designated as reference values for a normal range. One disadvantage is that point anomalies occurring within the reference range cannot be detected, and continuous point anomalies are also frequently not detected.
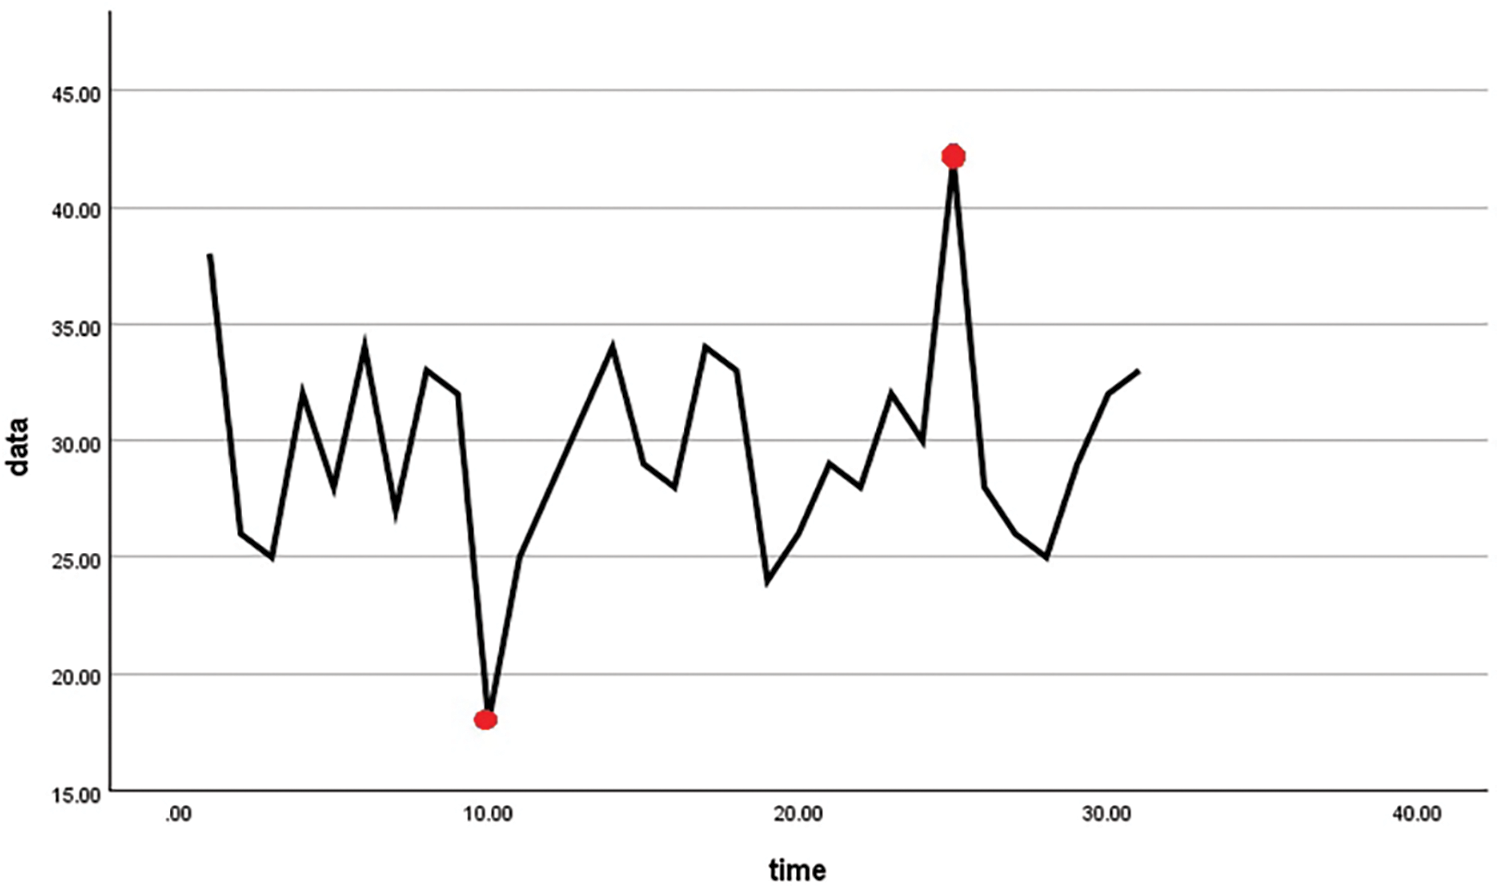
Figure 2: Point anomalies
The representative format of point anomaly detection in time series data is as follows. At a certain point in time t, n normal data sequences preceding the data sequence
Finally,
is calculated by performing a variance analysis on the difference between each component. The calculated value
2.2 Contextual and Collective Anomalies
Contextual anomalies occur similarly to point anomalies, but at specific times rather than in general situations. These anomalies do not fall outside the normal range but still affect the data pattern, making their detection difficult.
Collective anomalies occur in situations where the flow of time-series data is continuous for a certain period. Due to the continuous nature of such data, it is difficult to detect anomalous and normal signals in a single detection, and a certain period of time must pass for detection to succeed. As shown in Fig. 3, abnormal data, denoted in red, appear continuously within the normal data. The left graph in Fig. 3 is a flow chart of univariate data, whereas the right graph is a flow chart of multivariate data.
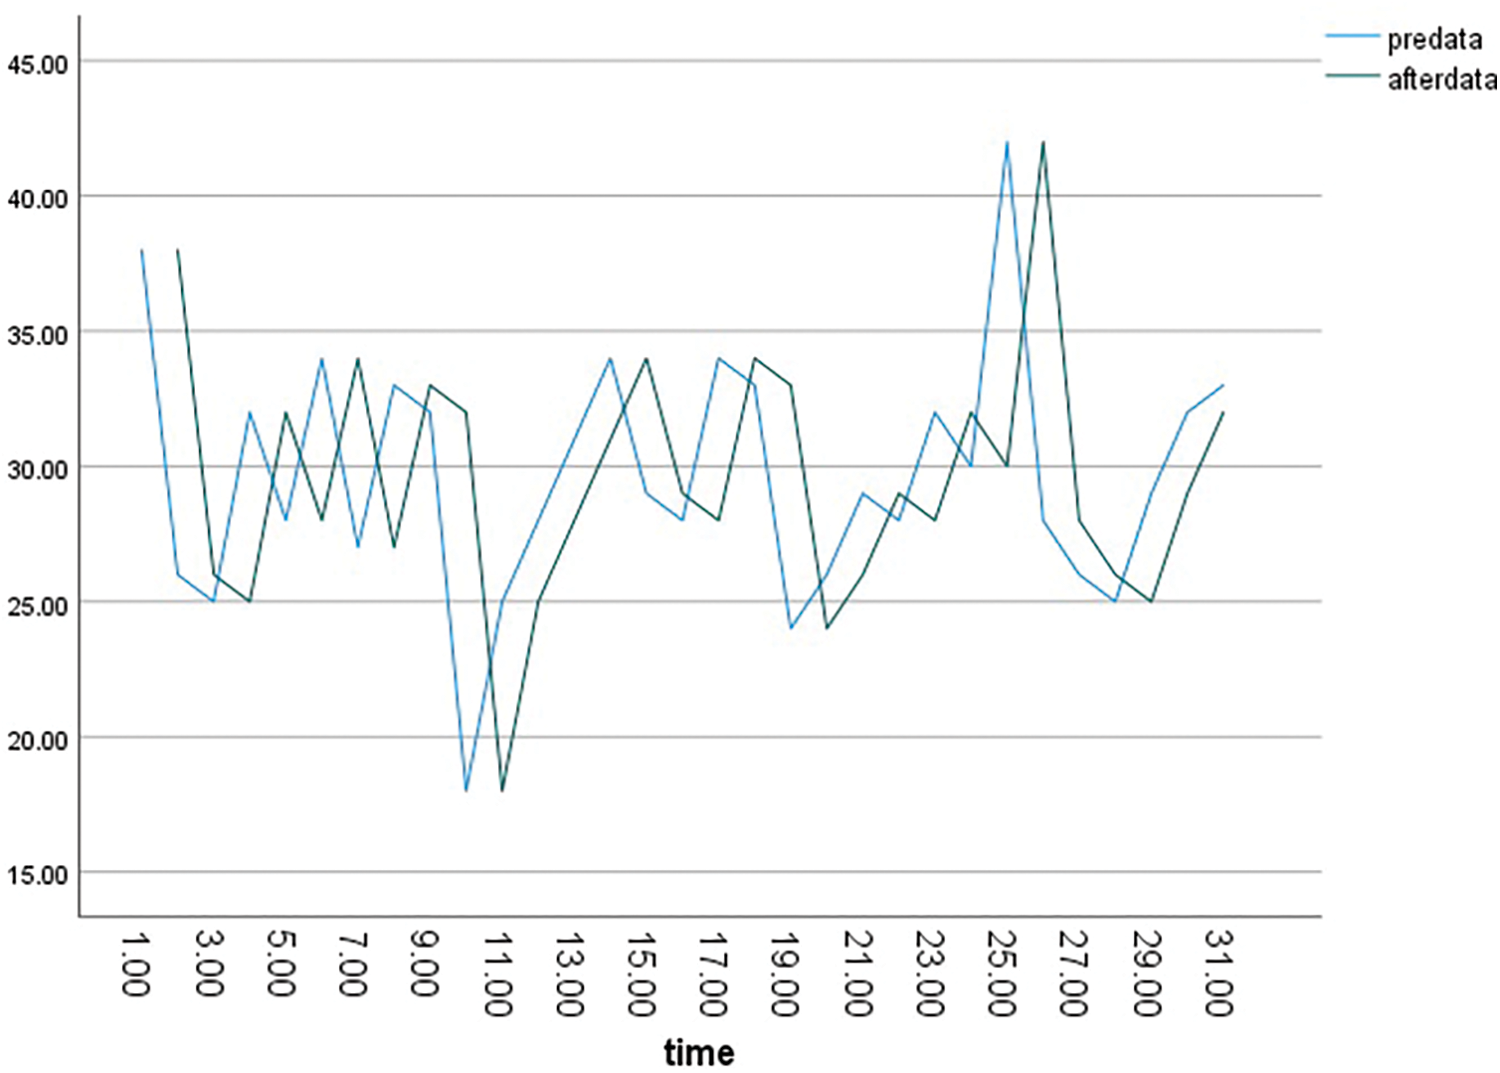
Figure 3: Paired t-test data
3 Anomaly Detection Using Rate of Change
The proposed method is designed for the detection of anomalies within time-series data generated in real time. Whereas conventional real-time anomaly detection techniques use direct statistical calculations and density differences in the distance space for given data, the proposed method utilizes the characteristic of closeness between data at close distances. Specifically, it analyzes the variability of the magnitude of change between consecutive data inputs.
Real-time data satisfy normality when the variability of real-time magnitude change is sufficiently negligible to not affect the total variance. Therefore, we implemented a verification method through a paired t-test using one or two points of the input data.
Because the independent t-test verifies the difference in means between two groups, it is necessary to test whether the two groups themselves follow a normal distribution using a normality test. In contrast, the paired t-test extracts data from before and after a specific point from the same group, omitting the need to test the group’s normality. Instead, the paired t-test requires a normality test for the differences between data before and after the point of interest.
Although the paired and independent t-tests are both used to determine the mean difference between two groups, the two techniques are used in different situations. Specifically, the paired t-test is used when the two groups are not mutually independent.
The paired t-test uses the t-distribution for testing, with the test results expressed as t-values, degrees of freedom, p-values, or in another format. Because this test essentially uses a normal distribution, data must satisfy normality as a prerequisite. The basis of all normality tests is to evaluate based on an N value of 30; i.e., if N exceeds 30, the data can be considered to satisfy normality. When the N value is 30 or less, normality must be further verified through a normality test.
Type 1 and type 2 errors are important concepts in statistical hypothesis testing. These errors are related to the outcomes of hypothesis testing.
Type I Error (alpha error):
o The null hypothesis is actually true, but it is incorrectly rejected.
o In other words, it is an error that falsely identifies a negative outcome as positive.
o For example, this occurs when an electrocardiogram without errors is mistakenly deemed to have an error.
o This error is also called a false positive or alpha error (α) in statistical terms.
Type II Error (beta error):
o If the null hypothesis is actually false, it cannot be rejected.
o In other words, it is an error that fails to identify a positive outcome as positive.
o For example, if there is an error on an electrocardiogram but it is erroneously determined to be error-free.
o This error is less commonly discussed but often occurs in situations where a condition exists but is not detected, also known as a false negative or beta error.
Table 1 is expressed around electrocardiography (ECG) data for type 1 and type 2 errors. These two errors are in a trade-off relationship with each other, and their importance varies depending on the purpose and criteria of the study. In general, type 1 error is more dangerous, so it is verified by setting the significance level, and if you want to minimize type 2 error while controlling type 1 error, consider expanding the sample size 1.

This allows for more accurate conclusions from statistical hypothesis tests. However, things are different in medical data. Since abnormal signs detected through abnormal detection in medical data are directly related to the patient’s life, it is more dangerous when a type 2 error occurs than when a type 1 error occurs. For example, a type 2 error that has an error in time series analysis of ECG data but determines that there is no error may not proceed with treatment and may pose a very high risk to the patient’s life. On the other hand, a type 1 error that indicates no errors in the heart, which causes more cost but does not interfere with the patient’s life. For this reason, data should be handled more carefully in medical data.
The proposed anomaly detection method uses the paired t-test to analyze the magnitude of change between the preceding and following data series. This is achieved by shifting the relationship between the preceding and following input data back by one click, ensuring that the statistical normality condition
As for the data used, 31 data were randomly generated as shown in Table 2. It adopted a method that appeared as time series data and generated all statistical normality satisfactorily.

In addition, for the point anomaly situation, abnormal data of negative and positive directions were used in the 10th and 25th data, respectively.
Among the existing anomaly detection methods, the point anomaly method detects that among normal data for time series data generation, abnormal data occurs once or twice. The degree to which the occurrence of abnormal data affects the average and variance of all data can be seen as a major factor in determining the efficiency of anomaly detection.
As shown in Fig. 2, when two abnormal data point are generated, the abnormal data on the left side does not change significantly in the process of returning to normal data after the occurrence of the abnormal data.
On the other hand, it can be seen that the abnormal data on the right side returns to normal data rapidly after the occurrence of the abnormal data. Therefore, it can be seen that the abnormal data on the right side of the data in Fig. 2 is more reliable as abnormal data.
However, as shown in Table 3, the p-value of 0.263 is the output value that cannot be considered to act as abnormal data and significantly change the variance value of the total data.

As for the abnormality detection method using the proposed rate of change, as shown in Fig. 3, since the data generated by abnormal data on the right side are determined by the pre-data and after-data rate of change, two abnormal data point are calculated. This leads to meaningful results for the average value and variance value of all data. As shown in Table 3, the abnormality detection method using the rate of change is expressed as pre-delta data, and the result is a t-value of 16.268 and a p-value of 0.001, which are reliable numerical values for abnormal data.
As shown in Fig. 3, local anomalies in consecutive data are detected by finding points that deviate from the reference point set by the user. As shown in Fig. 4, local outliers can clearly be detected using the rate of change.
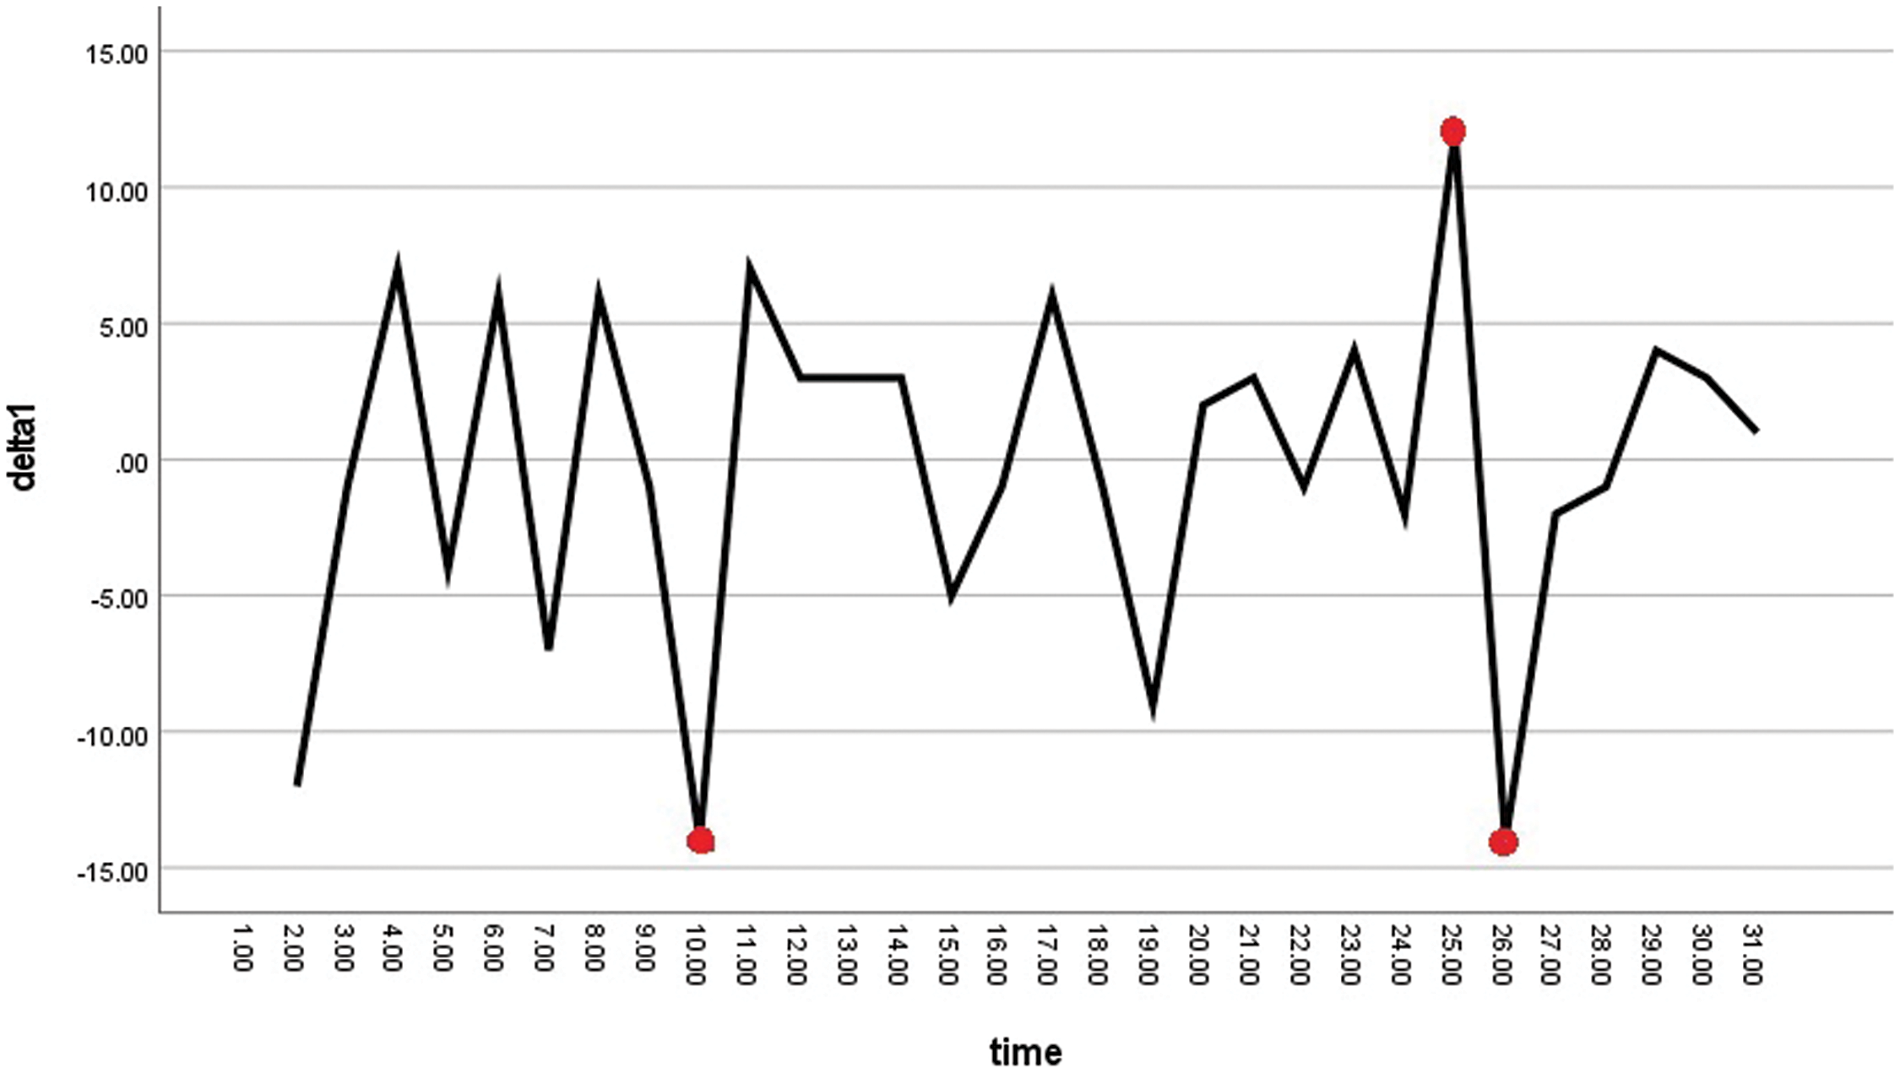
Figure 4: One time rate
Considering statistical normality and consistency, the variance must be calculated after the rate of change in the input data. The data configuration and variance are found using the following formulas:
Database
Then,
Because the rate of change of general data typically converges to 0, the average rate of change of the interval to be measured cannot be used. Instead, we apply the average rate of change using variance, calculated as follows:
Then,
To detect anomalies stemming from global outliers, we must use contextual and collective anomaly detection methods. The rate of change can be used to address this issue by generating the variance of the rate of change over two or more clicks and then applying the paired t-test.
The variance for the rate of change over two clicks is calculated as
Generated at the one point that deviates from the normal range, changing the overall variance and t-value. However, as shown in Fig. 4, data that deviate from the normal range correspond to two abnormal rates of change—above and below the normal range, respectively—as shown in the outlier data on the right side of Fig. 4. This has a stronger impact on the variance and t-value.
In the case of collective anomalies, the anomaly detection method using the rate of change exhibits the same performance as the existing method. In the first outlier situation in Fig. 2, after the outlier is shown, the time to return to normal is reduced. If the difference between the first and second rate-of-change outliers is equal for outliers that do not exhibit a large degree of change, a collective anomaly can be said to occur. Thus, the proposed anomaly detection method detects both point and collective anomalies, with improved performance on the former.
The anomaly detection method using the rate of change exhibits strong detection capabilities for point anomalies. As shown in Fig. 2, when a general point anomaly occurs, outlier data are generated at the point that deviates from the normal range, changing the overall variance and t-value. Example data on the proposed anomaly detection method are shown in Figs. 2 and 4. The values expressed by applying the existing anomaly detection method to the outliers in Fig. 1 are shown in the pre-after records in Table 2. In addition, the t-value and p-value for the anomaly detection method using the rate of change are shown in the pre-delta record in Table 2. The abnormal signals shown in Fig. 2 are shown in Table 2, with the average and standard errors of about 30 data points in the time series, and the t-value, and p-value. As shown in Fig. 4, when the rate of change is applied, the change at the outlier appears back and forth, so it can be seen that the t-value and p-value are meaningful like the pre-delta record in Table 3.
Fig. 5 shows a comparison of data changes and results for the previous point detection and the presented point detection. In the graph on the left, two outliers are created, and in the graph on the right, three outliers are created by the change, indicating that the ability to detect outliers has improved.
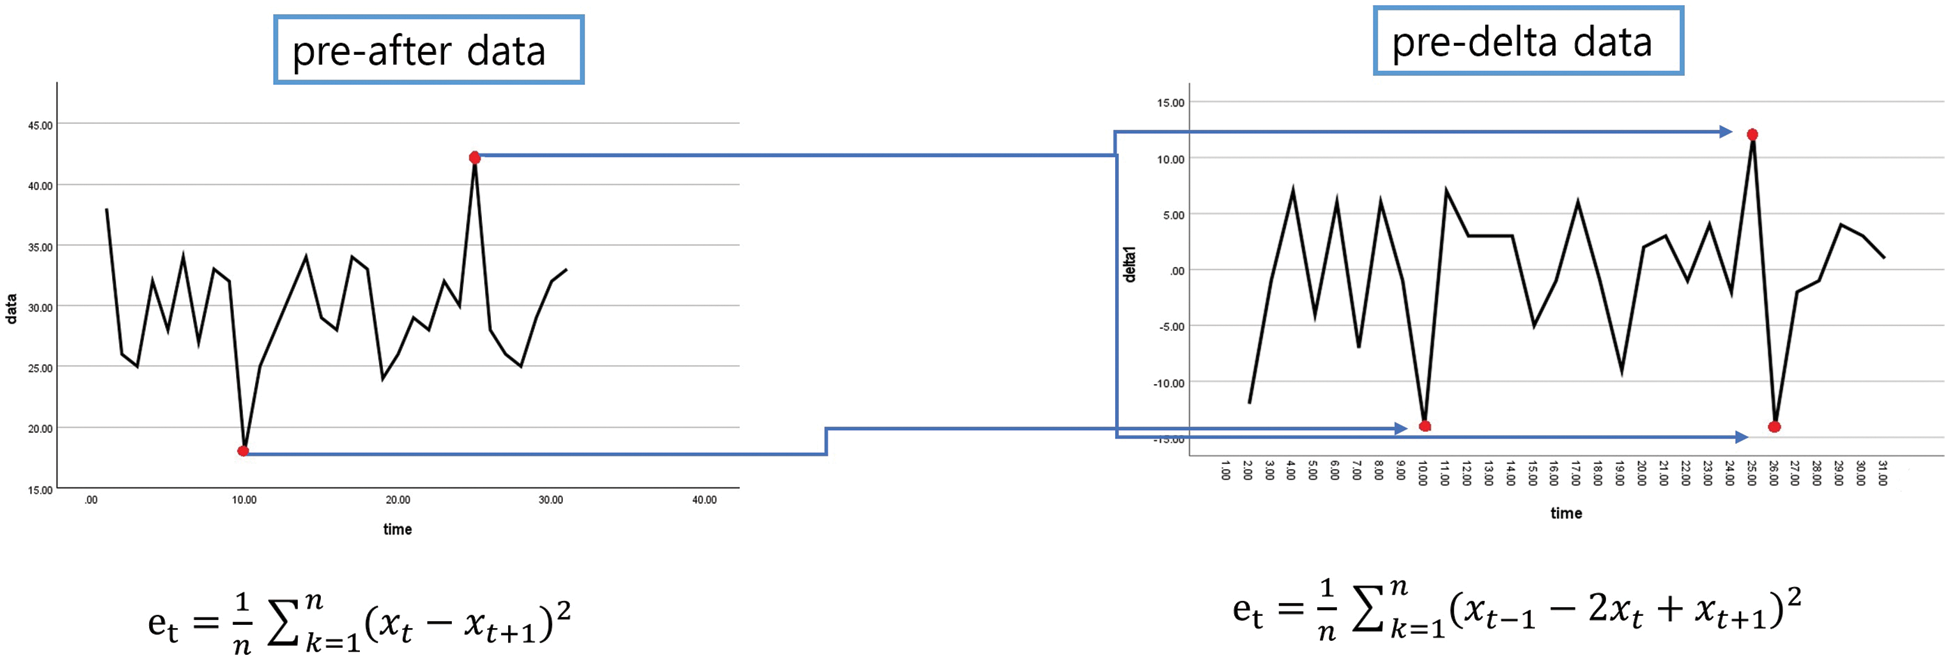
Figure 5: Change data style
The conventional approach to point analysis involves scrutinizing specific data points that deviate from the average trend line after organizing the actual data generated over time. In contrast, our proposed methodology seeks to delve deeper into the dynamics of change within the generated data. This entails a meticulous examination of the singularity of the rate of change within the sequences of data, denoted as delta. Essentially, we aim to identify meaningful patterns within these delta changes.
Through the application of a t-test and meticulous calculation of delta variations, we are able to discern sequences of significant singular values, as evidenced in Table 4. Table 4 shows the data movement of the amount of change without showing the movement of the existing data. As shown in the table, it can be seen that it shows a sharp movement at No. 9 and No. 23. It can be seen that it is detected more sensitively than the existing point random detection.

As visually demonstrated in Fig. 5, our methodology leveraging delta for analysis yields a greater number of singularities compared to the traditional point analysis method, thereby influencing the resultant p-value. This nuanced approach is particularly valuable for anomaly detection, especially in datasets where type 1 errors, such as those encountered in medical data, demand heightened sensitivity and accuracy.
The contents of the existing anomaly detection and the comparative analysis of the proposed anomaly detection are summarized in Table 5, and the contents are as follows:

Data Processing Methodology: Previous studies primarily relied on the utilization of specific statistical metrics derived from static or time-series medical data to detect abnormal patterns. These methodologies were centered around the analysis and prediction of patterns based on historical data. In contrast, the present study adopts a more dynamic and real-time approach by leveraging the rate of change in data. The rate of change serves to quantify the volatility of data over time, facilitating a more dynamic pattern analysis, which proves advantageous for anomaly detection.
Accuracy and Performance: Both previous and current research exhibit similar outcomes regarding accuracy and performance. Nonetheless, the present study achieves a more precise detection of abnormal patterns through the utilization of the data rate of change, and enhances security and efficiency through the NFT system. In these regards, the present research demonstrates superior performance compared to previous endeavors.
Applicability and Relevance: Both previous and current research are applicable within the medical domain. Given the high sensitivity and importance of medical data, there exists a constant demand for novel detection methodologies and security systems. Thus, both prior and current studies underscore their applicability and significance within the medical domain.
Utilization of the NFT System: Previous studies lacked dedicated discussions concerning the security aspects of medical data. However, the current study proposes the integration of a NFT system into medical data for the purpose of secure transmission and storage. The NFT system, built upon blockchain technology, uniquely identifies each datum and ensures data integrity, thereby fortifying data security.
Strengths in Comparison: Previous research demonstrated a lack of specific proposals for novel approaches or performance enhancements. Conversely, the present study introduces a more accurate detection of abnormal patterns by leveraging the data rate of change and suggests security enhancements through the NFT system, thereby introducing novel approaches and performance improvements. Consequently, the current research yields superior results compared to its predecessors.
AI and the metaverse have profoundly integrated into our daily lives, shaping what can be termed the era of AI and the metaverse in modern society. These technologies have transcended mere experimental applications in laboratory settings, now playing pivotal roles in ensuring human safety and enhancing quality of life across diverse domains such as electric vehicles, factory automation, weapon control, and aviation management. Despite the convenience offered by automation and AI-driven control systems, significant challenges persist, particularly in effectively discerning between normal and abnormal data—a critical factor for instilling trust in machine-controlled processes.
In this study, we extend the existing anomaly detection methodologies for real-time data, specifically focusing on time-series data, by transitioning from conventional data processing techniques to an approach that emphasizes the analysis of data changes. Anomaly detection in time-series data traditionally relies on unsupervised learning methods. However, ensuring the reliability of machine learning models necessitates training on datasets with balanced distributions of normal and abnormal data, which can be challenging.
To address this, we propose a novel method that identifies anomalies solely based on the t-value derived from the variance of the data change rate, leveraging the assumption of normality with a minimum of 30 data points. Furthermore, our method is designed to detect abnormal data by fine-tuning the parameters governing the extent of change in both local and global anomalies. Our proposed anomaly detection approach exhibits superior detection performance compared to existing methods for point anomalies and comparable performance for collective anomalies.
The weak point of this study is that abnormality detection can operate too sensitively, which can result in higher costs. This is considered efficient if the method presented in this paper is applied to the sensitive data analysis that is directly connected to the patient’s life among medical data and the existing abnormality detection techniques are used in parallel for data with low urgency. For future research endeavors, it is imperative to validate our findings through the implementation of real-world datasets and rigorous experimentation across a spectrum of time-series data applications. Moreover, concrete empirical evidence and case studies are essential for further elucidating the efficacy and applicability of our methodology in diverse practical scenarios.
Acknowledgement: The authors are grateful to all the editors and anonymous reviewers for their comments and suggestions and thank all the members who have contributed to this work with us.
Funding Statement: This work was supported by the Ministry of Education of the Republic of Korea and the National Research Foundation of Korea (NRF-2019S1A5B5A02041334).
Author Contributions: Kwang-Cheol Rim: conceptualization of this study and methodology; Young-Min Yoon: project administration; Sung-Uk Kim, Jeong-In Kim: data curation. All authors reviewed the results and approved the final version of the manuscript.
Availability of Data and Materials: Not applicable.
Ethics Approval:: Not applicable.
Conflicts of Interest: Author Sung-Uk Kim is employed by the AINTCHAIN SOFT Co., Ltd. The remaining authors declare that the research was conducted in the absence of any commercial or financial relationships that could be construed as a potential conflict of interest.
References
1. A. Blázquez-García, A. Conde, U. Mori, and J. A. Lozano, “A review on outlier/anomaly detection in time series data,” ACM Comput. Surv., vol. 54, no. 3, pp. 1–33, 2021. doi: 10.1145/3444690. [Google Scholar] [CrossRef]
2. K. Choi, J. Yi, C. Park, and S. Yoon, “Deep learning for anomaly detection in time-series data: Review, analysis, and guidelines,” IEEE Access, vol. 9, pp. 120043–120065, 2021. doi: 10.1109/ACCESS.2021.3107975. [Google Scholar] [CrossRef]
3. S. Byeong-jin, J. H. Lee, S. -J. Han, and C. -S. Park, “A study of anomaly detection for ICT infrastructure using conditional multimodal autoencoder,” in Proc. Korea Intell. Inform. Syst. Soc., 2021. [Google Scholar]
4. Y. D. He and J. B. Zhao, “Temporal convolutional networks for anomaly detection in time series,” J. Phys.: Conf. Ser., vol. 1213, no. 4, 2019, Art. no. 042050. doi: 10.1088/1742-6596/1213/4/042050. [Google Scholar] [CrossRef]
5. M. Teng, “Anomaly detection on time series,” in 2010 IEEE Int. Conf. Progress Inform. Comput., Shanghi China, IEEE, 2010, pp. 603–608. [Google Scholar]
6. T. Fernando, H. Gammulle, S. Denman, S. Sridharan, and C. Fookes, “Deep learning for medical anomaly detection—A survey,” ACM Comput. Surv., vol. 54, no. 7, pp. 1–37, 2021. doi: 10.1145/3464423. [Google Scholar] [CrossRef]
7. J. Wolleb, F. Bieder, R. Sandkühler, and P. C. Cattin, “Diffusion models for medical anomaly detection,” in Int. Conf. Med. Image Comput. Comput.-Assist. Interv., Singapore, Cham, Springer Nature Switzerland, 2022, pp. 35–45. [Google Scholar]
8. N. Shvetsova, B. Bakker, I. Fedulova, H. Schulz, and D. V. Dylov, “Anomaly detection in medical imaging with deep perceptual autoencoders,” IEEE Access, vol. 9, pp. 118571–118583, 2021. doi: 10.1109/ACCESS.2021.3107163. [Google Scholar] [CrossRef]
9. R. Siddalingappa and S. Kanagaraj, “Anomaly detection on medical images using autoencoder and convolutional neural network,” Int. J. Adv. Comput. Sci. Appl., vol. 12, no. 7, pp. 148–156, 2021. [Google Scholar]
10. A. A. Khalil et al., “Efficient anomaly detection from medical signals and images with convolutional neural networks for Internet of medical things (IoMT) systems,” Int. J. Numer. Methods Biomed. Eng., vol. 38, no. 1, 2022, Art. no. e3530. doi: 10.1002/cnm.3530. [Google Scholar] [PubMed] [CrossRef]
11. H. Zhao et al., “Anomaly detection for medical images using self-supervised and translation-consistent features,” IEEE Trans. Med. Imaging, vol. 40, no. 12, pp. 3641–3651, Dec. 2021. doi: 10.1109/TMI.2021.3093883. [Google Scholar] [PubMed] [CrossRef]
12. R. Hansheng et al., “Time-series anomaly detection service at microsoft,” in Proc. 25th ACM SIGKDD Int. Conf. Knowl. Discov. Data Mining, Anchorage, AK, USA, 2019, pp. 3009–3017. [Google Scholar]
13. S. Schmidl, P. Wenig, and T. Papenbrock, “Anomaly detection in time series: A comprehensive evaluation,” Proc. VLDB Endow., vol. 15, no. 9, pp. 1779–1797, 2022. doi: 10.14778/3538598.3538602. [Google Scholar] [CrossRef]
14. S. Kamran et al., “A review of time-series anomaly detection techniques: A step to future perspectives,” in Adv. Inf. Commun.: Proc. 2021 Future Inf. Commun. Conf. (FICC), Vancouver BC, Canada, Springer International Publishing, 2021, vol. 1, pp. 865–877. [Google Scholar]
15. M. Braei and S. Wagner, “Anomaly detection in univariate time-series: A survey on the state-of-the-art,” arXiv preprint arXiv:2004.00433, 2004. [Google Scholar]
16. J. Li, H. Izakian, W. Pedrycz, and I. Jamal, “Clustering-based anomaly detection in multivariate time series data,” Appl. Soft Comput., vol. 100, no. 4, 2021, Art. no. 106919. doi: 10.1016/j.asoc.2020.106919. [Google Scholar] [CrossRef]
17. Y. An, Y. He, F. R. Yu, J. Li, J. Chen and V. C. M. Leung, “An HTTP anomaly detection architecture based on the internet of intelligence,” IEEE Trans. Cogn. Commun. Netw., vol. 8, no. 3, pp. 1552–1565, 2022. doi: 10.1109/TCCN.2022.3176636. [Google Scholar] [CrossRef]
18. T. Adam and F. Babič, “Anomaly detection on distributed ledger using unsupervised machine learning,” in 2023 IEEE Int. Conf. Omni-Layer Intell. Syst. (COINS), Berlin, Germany, IEEE, 2023, pp. 1–4. [Google Scholar]
Cite This Article
 Copyright © 2024 The Author(s). Published by Tech Science Press.
This work is licensed under a Creative Commons Attribution 4.0 International License , which permits unrestricted use, distribution, and reproduction in any medium, provided the original work is properly cited.
 Downloads
 Citation Tools