
 Submit a Paper
 Propose a Special lssue
 Open Access
ARTICLE

Heart-Net: A Multi-Modal Deep Learning Approach for Diagnosing Cardiovascular Diseases
1 Department of Computer Science and Information Technology, Applied College, Princess Nourah bint Abdulrahman University, Riyadh, 84428, Saudi Arabia
2 College of Engineering and Technology, American University of the Middle East, Egaila, 15453, Kuwait
3 Faculty of Computers Science, Misr International University, Cairo, 11800, Egypt
4 University Institute of Information Technology—PMAS Arid Agriculture University, Rawalpjndi, 46000, Pakistan
5 Department of Computer Science, International Islamic University, Islamabad, 04436, Pakistan
6 Jadara Research Center, Jadara University, Irbid, 21110, Jordan
7 Information System Department, Faculty of Computers and Artificial Intelligence, Benha University, Banha, 13511, Egypt
8 MEU Research Unit, Middle East University, Amman, 11831, Jordan
* Corresponding Author: Asif Nawaz. Email:
(This article belongs to the Special Issue: Deep Learning in Medical Imaging-Disease Segmentation and Classification)
Computers, Materials & Continua 2024, 80(3), 3967-3990. https://doi.org/10.32604/cmc.2024.054591
Received 02 June 2024; Accepted 17 July 2024; Issue published 12 September 2024
 View Full Text
 Download PDF
Abstract
Heart disease remains a leading cause of morbidity and mortality worldwide, highlighting the need for improved diagnostic methods. Traditional diagnostics face limitations such as reliance on single-modality data and vulnerability to apparatus faults, which can reduce accuracy, especially with poor-quality images. Additionally, these methods often require significant time and expertise, making them less accessible in resource-limited settings. Emerging technologies like artificial intelligence and machine learning offer promising solutions by integrating multi-modality data and enhancing diagnostic precision, ultimately improving patient outcomes and reducing healthcare costs. This study introduces Heart-Net, a multi-modal deep learning framework designed to enhance heart disease diagnosis by integrating data from Cardiac Magnetic Resonance Imaging (MRI) and Electrocardiogram (ECG). Heart-Net uses a 3D U-Net for MRI analysis and a Temporal Convolutional Graph Neural Network (TCGN) for ECG feature extraction, combining these through an attention mechanism to emphasize relevant features. Classification is performed using Optimized TCGN. This approach improves early detection, reduces diagnostic errors, and supports personalized risk assessments and continuous health monitoring. The proposed approach results show that Heart-Net significantly outperforms traditional single-modality models, achieving accuracies of 92.56% for Heartnet Dataset I (HNET-DSI), 93.45% for Heartnet Dataset II (HNET-DSII), and 91.89% for Heartnet Dataset III (HNET-DSIII), mitigating the impact of apparatus faults and image quality issues. These findings underscore the potential of Heart-Net to revolutionize heart disease diagnostics and improve clinical outcomes.Keywords
Heart disease is a leading cause of death worldwide, responsible for an estimated 18 million deaths each year according to the World Health Organization [1]. This accounts for approximately 32% of all global deaths, highlighting the critical nature of this health issue [2]. The most common causes of heart disease include unhealthy lifestyle factors such as poor diet, lack of physical activity, excessive alcohol consumption, and smoking [3]. Additionally, high blood pressure, high cholesterol, diabetes, and genetic predispositions significantly contribute to the development of heart disease [4]. Stress and obesity also play a crucial role in exacerbating heart-related conditions [5]. The widespread impact of heart disease underscores the need for effective prevention strategies and improved diagnostic and treatment methods to reduce its global mortality rate [6–10].
Traditional methods for diagnosing heart disease include electrocardiograms (ECGs), echocardiograms, stress tests, and blood tests. ECGs measure the heart’s electrical activity to identify abnormalities [11]. Fig. 1 shows the ECG graph of normal heart disease. Echocardiograms use ultrasound to create images of the heart, assessing its structure and function, but their accuracy can be affected by image quality and operator interpretation. Stress tests evaluate heart function under physical or pharmacological stress, yet they may not be suitable for all patients, can miss less severe disease, and also yield false positives or negatives [12–15]. Blood tests measure levels of substances like cholesterol and troponin to indicate heart disease presence, but they might not provide a complete picture on their own. These limitations highlight the need for more accurate and comprehensive diagnostic methods.
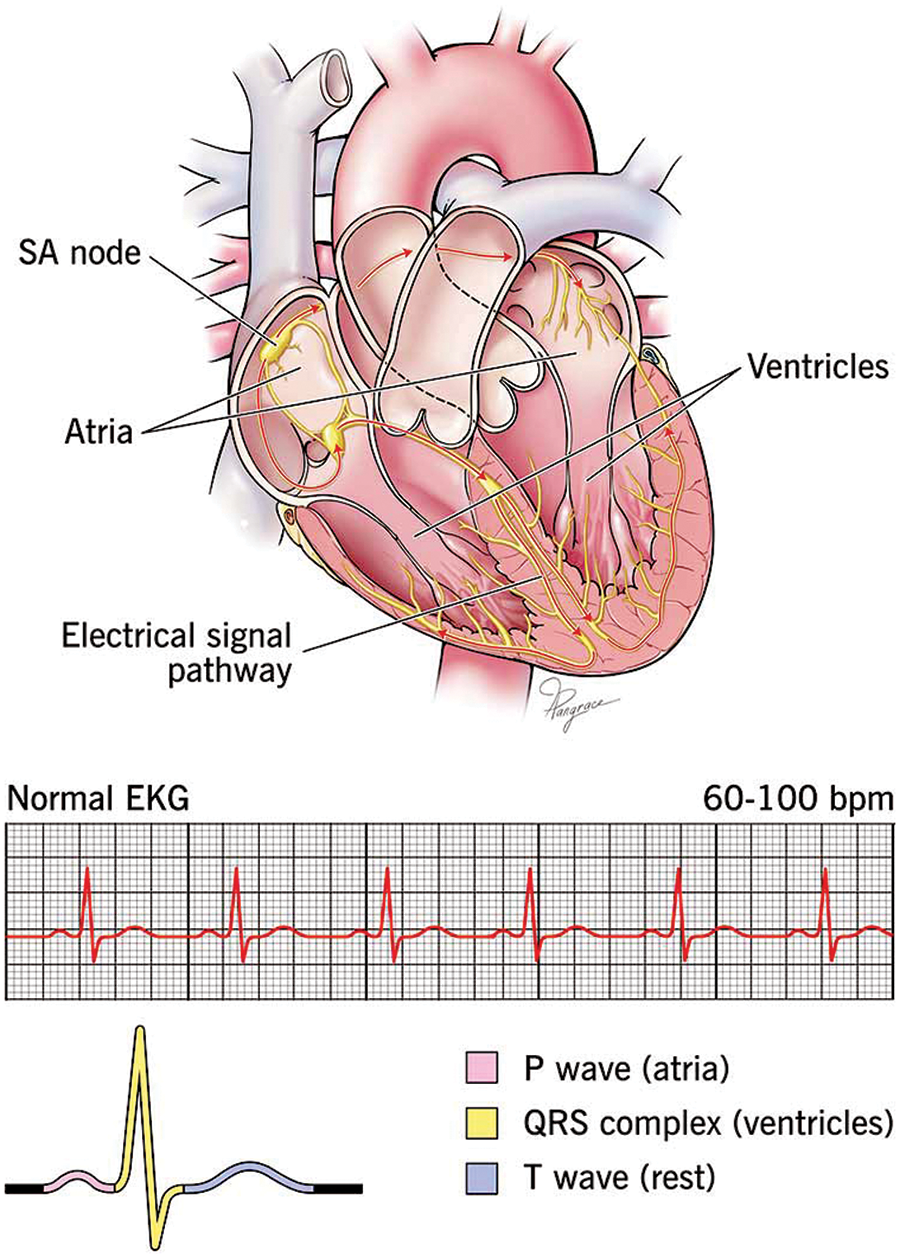
Figure 1: The normal ECG with heart architecture adopted from [16]
Computer-based methods for diagnosing heart disease utilize advanced algorithms and machine-learning techniques to improve diagnostic accuracy and efficiency [17]. Machine learning algorithms analyze patterns in large datasets to predict heart disease, but they require extensive and high-quality data for training and can suffer from bias if the data is not representative. Artificial Neural Networks (ANNs) mimic the human brain’s neural networks to process data and identify relationships, yet they can be computationally intensive and require significant tuning to avoid overfitting [18]. Support Vector Machines (SVMs) classify data points by finding the optimal hyperplane that separates different classes, but their performance depends on the choice of kernel and parameters, and they can be less effective with noisy data. Decision Trees and Random Forests use tree-like models to classify data based on decisions and consequences. But these approaches are complex and may overfit the training data if not properly managed. Despite these limitations, computer-based methods hold promise for improving the accuracy and reliability of heart disease diagnosis.
The justification for combining MRI and ECG data in Heart-Net is based on addressing specific limitations in traditional single-modality diagnostic methods. Traditional approaches often rely on either structural imaging (MRI) or functional data (ECG) alone, which can miss critical diagnostic information. For instance, MRI provides detailed spatial resolution of cardiac structures but may not capture transient electrical anomalies detectable in ECG. Conversely, ECG excels at identifying electrical abnormalities but lacks spatial context.
Empirical studies support the efficacy of multi-modal approaches in various medical applications. For example, research has demonstrated that integrating MRI and ECG data can improve the detection of complex cardiac conditions like arrhythmogenic right ventricular cardiomyopathy (ARVC) and hypertrophic cardiomyopathy (HCM). These conditions may present subtle structural changes detectable in MRI and specific electrical patterns identifiable in ECG, highlighting the complementary nature of the two modalities.
A comprehensive literature review reveals gaps in current diagnostic methods, particularly in the combined analysis of MRI and ECG data. Studies have shown that multi-modal frameworks can enhance diagnostic accuracy, reduce false positives, and improve patient outcomes compared to single-modality approaches. By addressing these gaps, Heart-Net aims to leverage the strengths of both MRI and ECG to provide a more holistic and accurate assessment of cardiac health, ultimately leading to better clinical decision-making and patient care.
This work introduces Heart-Net, an innovative multi-modal deep learning framework designed to enhance the accuracy and comprehensiveness of heart disease diagnosis. Heart-Net integrates data from cardiac MRI and heart ECG to leverage the unique strengths of each modality. Utilizing a 3D U-Net for volumetric MRI analysis and a sequential network for ECG feature extraction, Heart-Net captures a holistic view of a patient’s cardiac health. The fusion of these diverse data types is achieved through an attention mechanism, emphasizing the most relevant features, followed by classification using an optimized sequential network. This integrated approach improves early detection and reduces diagnostic errors, supports personalized risk assessments, and facilitates continuous health monitoring. The model’s scalability and adaptability ensure it can evolve with emerging medical knowledge, making it a versatile tool in clinical settings.
Research Contributions
The summarized contribution of this work is as follows:
• This study identifies a critical gap in the existing literature by addressing the limitations of single-modality heart disease diagnosis methods, paving the way for more comprehensive solutions.
• It introduces novel feature extraction techniques, leveraging 3D U-Net for MRI and a sequential neural network for ECG, significantly enhancing the integration of diverse data types.
• Developed Heart-Net, a highly accurate multi-modal deep learning model, which markedly improves diagnostic reliability and early detection of heart disease, setting a new standard in the field.
• Experimental evaluation indicated that the proposed model archived an accuracy of 92.56% for HNET-DSI, 93.45% for HNET-DSII, and 91.89% for HNET-DSIII.
The remainder of the paper is organized as follows: Section 2 reviews the current literature, while Section 3 details the proposed methodology. Section 4 describes the experimental setup and presents the findings to evaluate the efficacy of the proposed method. Finally, Section 5 provides the conclusion and outlines future work.
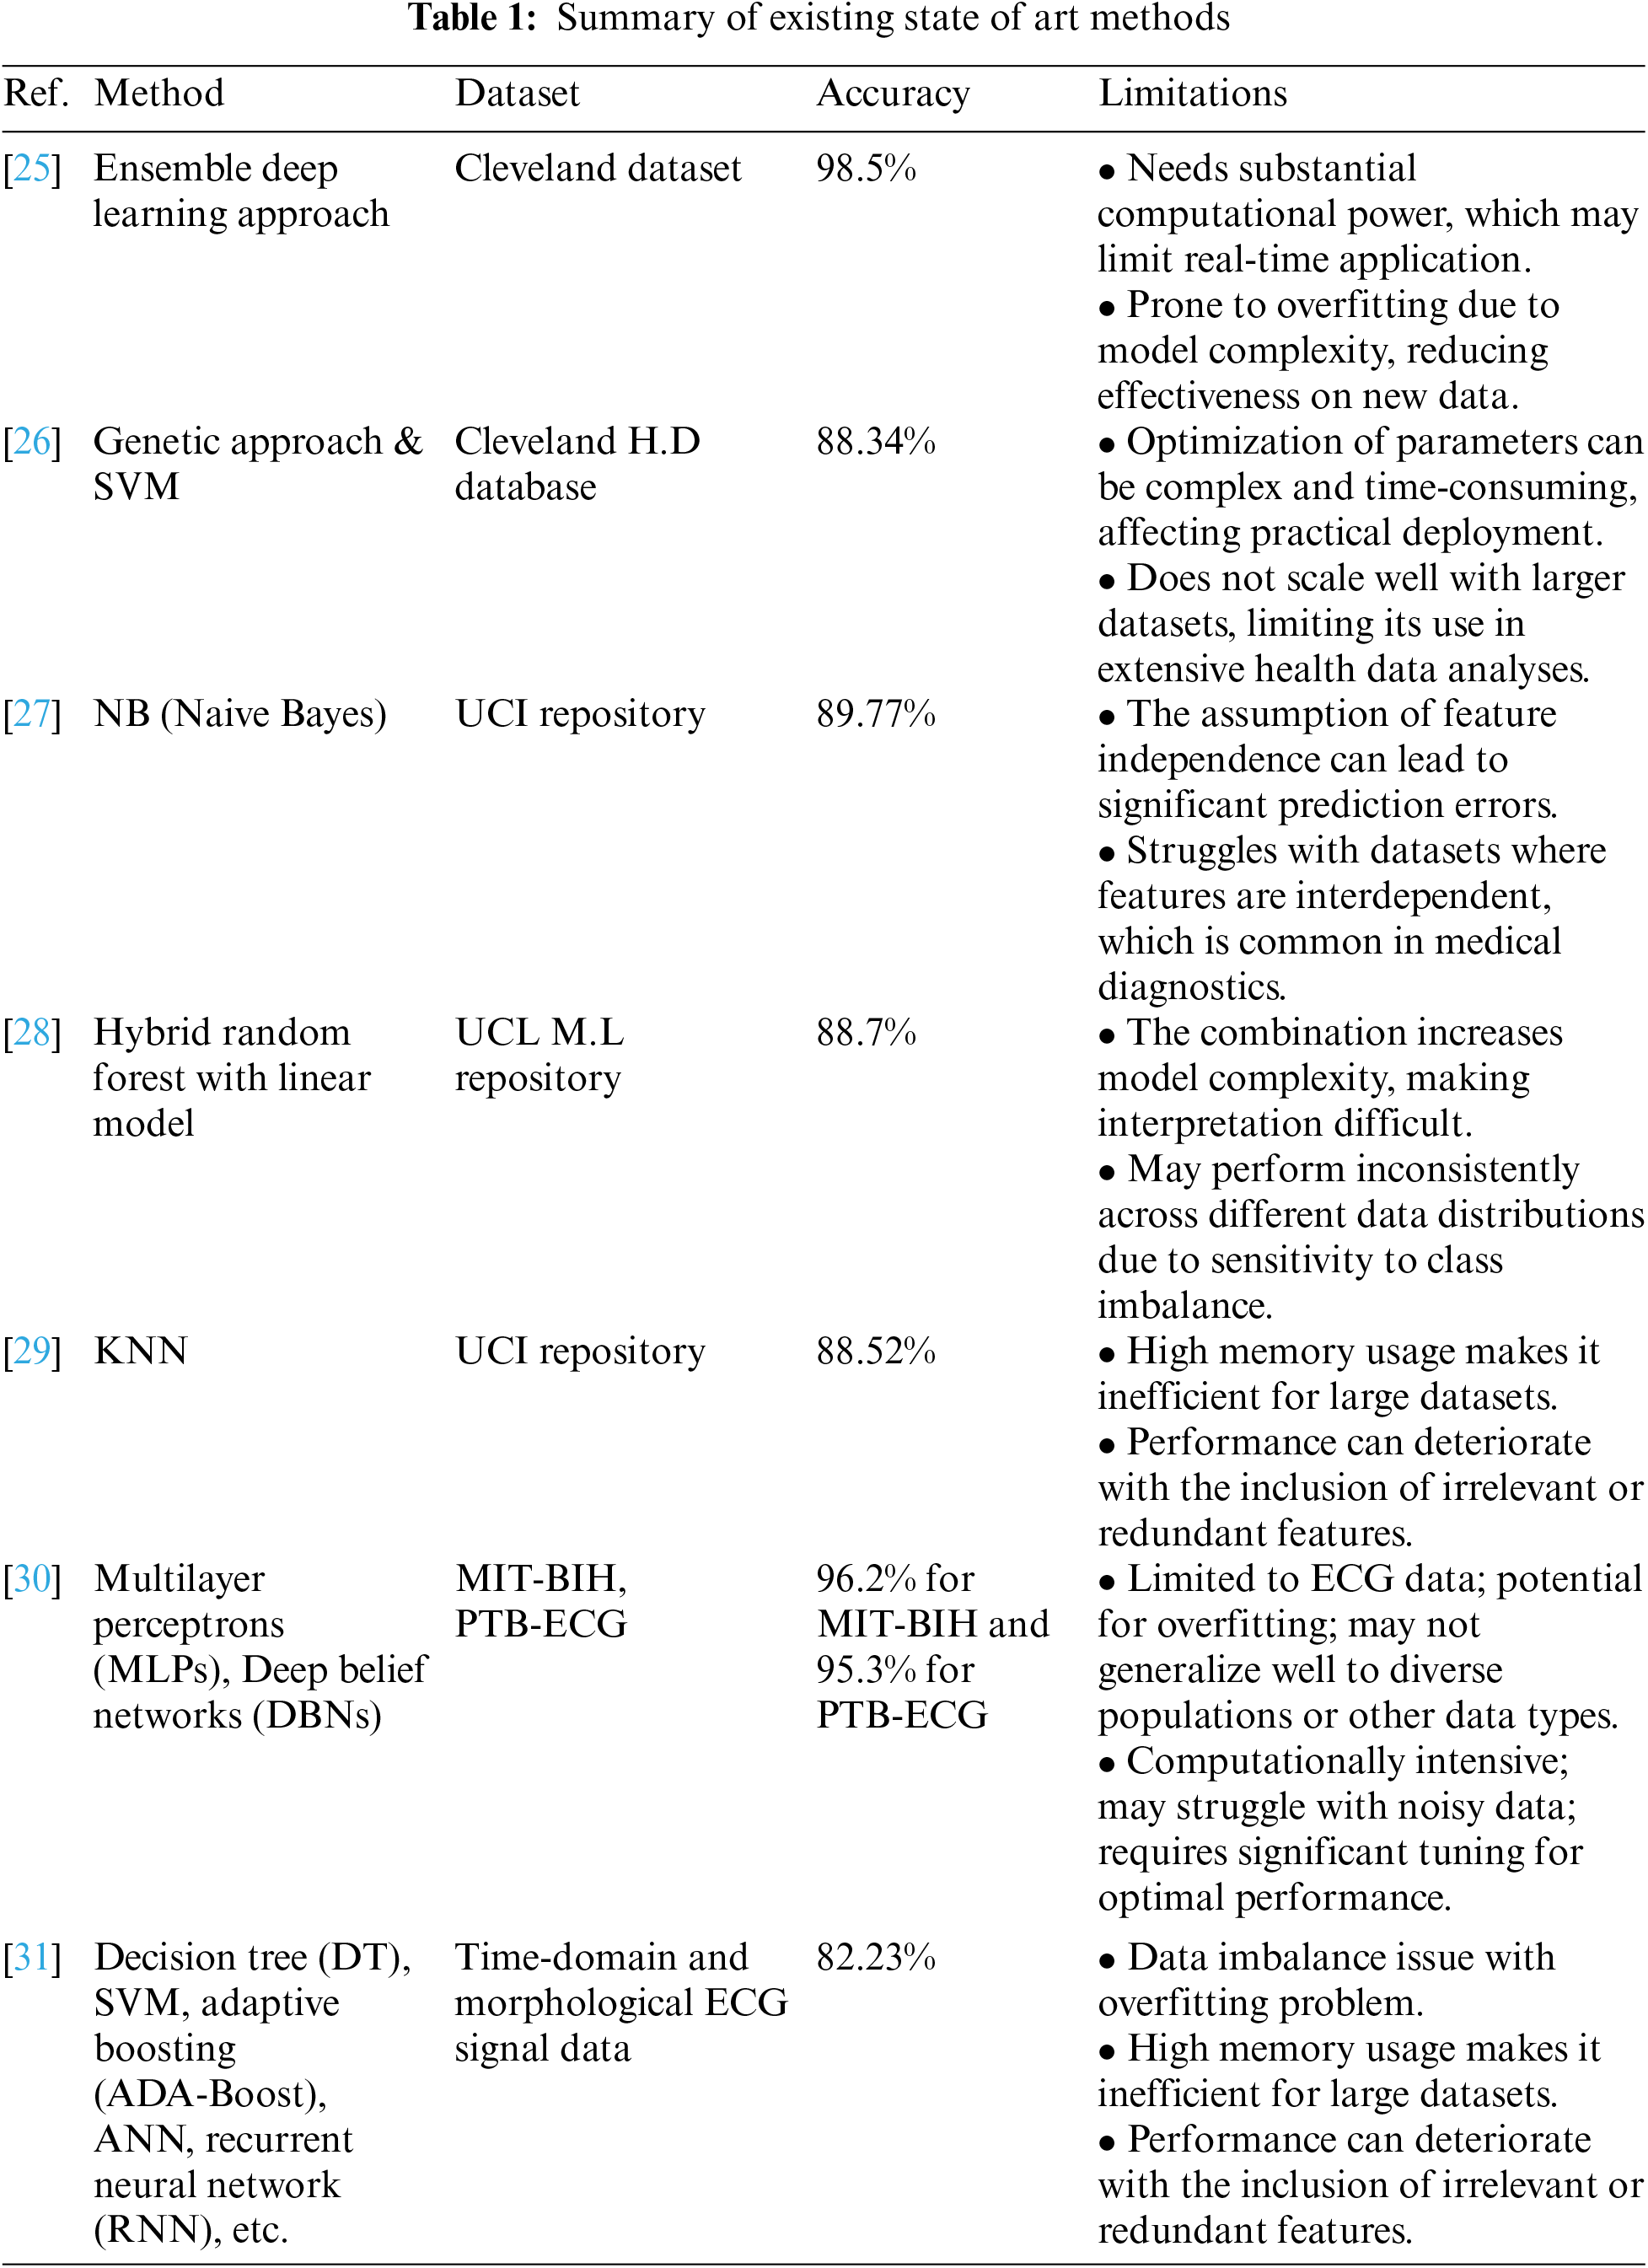
Many researchers, some of which are also described in Table 1, have added their contributions to the field of diagnosis of heart disease. The work of Reddy et al. [19] highlighted the prevalence of heart disease in developing countries over the past two decades has increased significantly. They also discussed that timely detection of heart diseases can help to recover mortality rates and treatment costs. In addition to this, they proposed a model named adaptive genetic algorithm with fuzzy logic used to predict heart disease in its early stages. Their proposed model included rough set-based feature selection and fuzzy rule-based classification modules. Their adaptive genetic algorithm optimized the rules of fuzzy classifier-generated. The foremost step in their approach was the selection of essential features that influence heart disease using the rough set theory that further led to the prediction of heart disease using the hybrid Adaptive genetic algorithm with a fuzzy logic classifier. They conducted different experiments on known University of California Irvine (UCI) heart disease datasets. The outcomes showed that their proposed method exceeded existing methods. In the end, they concluded that their proposed AGAFL model has the potential for accurately predicting heart disease at an early stage.
Amin et al. [20] employed various techniques to predict heart disease, highlighting the importance of identifying key features that significantly influence cardiovascular disease predictions. They emphasized that choosing the right combination of features is crucial for enhancing the accuracy of prediction models. Their analysis aimed to identify critical features and assess different data mining techniques to refine the prediction accuracy for cardiovascular diseases. Their findings revealed that the combination of specific influential features and the Vote method yielded a high prediction precision of 87.4%, underscoring the potential of targeted feature selection and hybrid classification approaches in improving diagnostic models for heart disease.
Similar work, as detailed in [21], the study explores the effectiveness of ensemble classification, a strategy designed to enhance the precision of weaker algorithms through the integration of multiple classifiers. The investigation involved conducting experiments using a dataset specifically focused on heart disease. The primary objective of this research was to assess how ensemble techniques, particularly bagging and boosting, could refine the predictive capabilities for heart disease. The findings indicated that these ensemble techniques significantly improved the accuracy of weaker classifiers, effectively identifying heart disease risk. By employing ensemble classification, there was a notable increase in accuracy by 7%. Additionally, the precision of this method was further augmented through the implementation of feature selection, leading to a substantial improvement in prediction accuracy.
Alex et al. [22] discussed the challenges associated with diagnosing heart diseases without traditional medical tests, particularly in a context where changes in daily routines have increased the risk of such conditions. Cardiovascular diseases can lead to severe outcomes, including heart failure, aneurysms, and sudden cardiac arrest. Although various medical tests are typically required for diagnosis, this study aims to leverage data mining techniques to predict and diagnose heart diseases early, thereby enhancing affordability and accessibility. The approach involves feeding attributes into several algorithms, including SVM, K-Nearest Neighbor (KNN), and ANN, to predict heart diseases. The preliminary results of this technique show promise in early detection and accurate diagnosis, potentially leading to complete cures. This project underscores the potential to enhance the accuracy of heart disease predictions, thus mitigating risk and improving individual medical care.
Bharti et al. [23] focused on heart disease, a major cause of mortality, and emphasized the importance of accurate prediction to prevent life-threatening outcomes. The research involved a comparative analysis of various machine learning algorithms and deep learning techniques applied to the UCI Machine Learning Heart Disease dataset, which includes 14 main attributes. The findings were promising, and validated through accuracy metrics and a confusion matrix. Additionally, the study explored the integration of these predictive approaches with multimedia technology, such as mobile devices, to enhance accessibility and utility. The results indicated that the deep learning approach achieved a significant improvement in accuracy, reaching 94.2%, which surpassed previous results obtained with machine learning algorithms like SVM and decision trees. These findings underscored the potential of deep learning to enhance the accuracy of heart disease predictions, thus playing a crucial role in clinical decision-making and improving patient care.
Sekar et al. [24] highlighted the increased prevalence of heart disease and the corresponding need for early diagnosis and treatment. To facilitate this, the utilization of tele-diagnostic equipment has become increasingly vital. Nevertheless, the prediction process of heart disease was impeded by the challenge of feature extraction due to the high-dimensional nature of the data. The study utilized a neuro-fuzzy interference system, achieving an accuracy of approximately 99.7%, which represented a significant improvement of up to 5.4% over existing algorithms. This high level of accuracy was attributed to the optimized tuning parameters of the proposed classifier. The use of the proposed classifier in heart disease prediction provided a more accurate system, enhancing the effectiveness of diagnostic processes.
Based on the reviewed literature, it has been concluded that most of the techniques are good and have good accuracy and time prediction in the heart prediction technique but have limitations, as shown in Table 1. The development of Heart-Net is conclusively vital due to the increasing necessity for accurate and early diagnosis of heart disease. The studies emphasize the limitations of traditional diagnostic methods and even some computer-based techniques, which often struggle with issues like high-dimensional data and the need for precise feature extraction. Heart-Net, with its multi-modal deep learning framework, addresses these challenges by integrating robust algorithms such as 3D U-Net and sequential neural networks, improving the accuracy of predictions significantly, as seen in comparative analyses. Furthermore, the integration of such advanced technologies aligns with the current shift towards enhancing tele-diagnostic capabilities and utilizing machine learning to achieve higher predictive accuracies, ultimately aiming to reduce mortality rates and improve patient care outcomes. This highlights the pressing need for advanced solutions like Heart-Net in the clinical field.
This section presents a detailed discussion of the proposed model, including schematic diagrams to illustrate its operation. The model consists of four main components: data collection, preliminary preprocessing, feature extraction, and final classification. Fig. 2 displays the architecture and workflow of the proposed model.
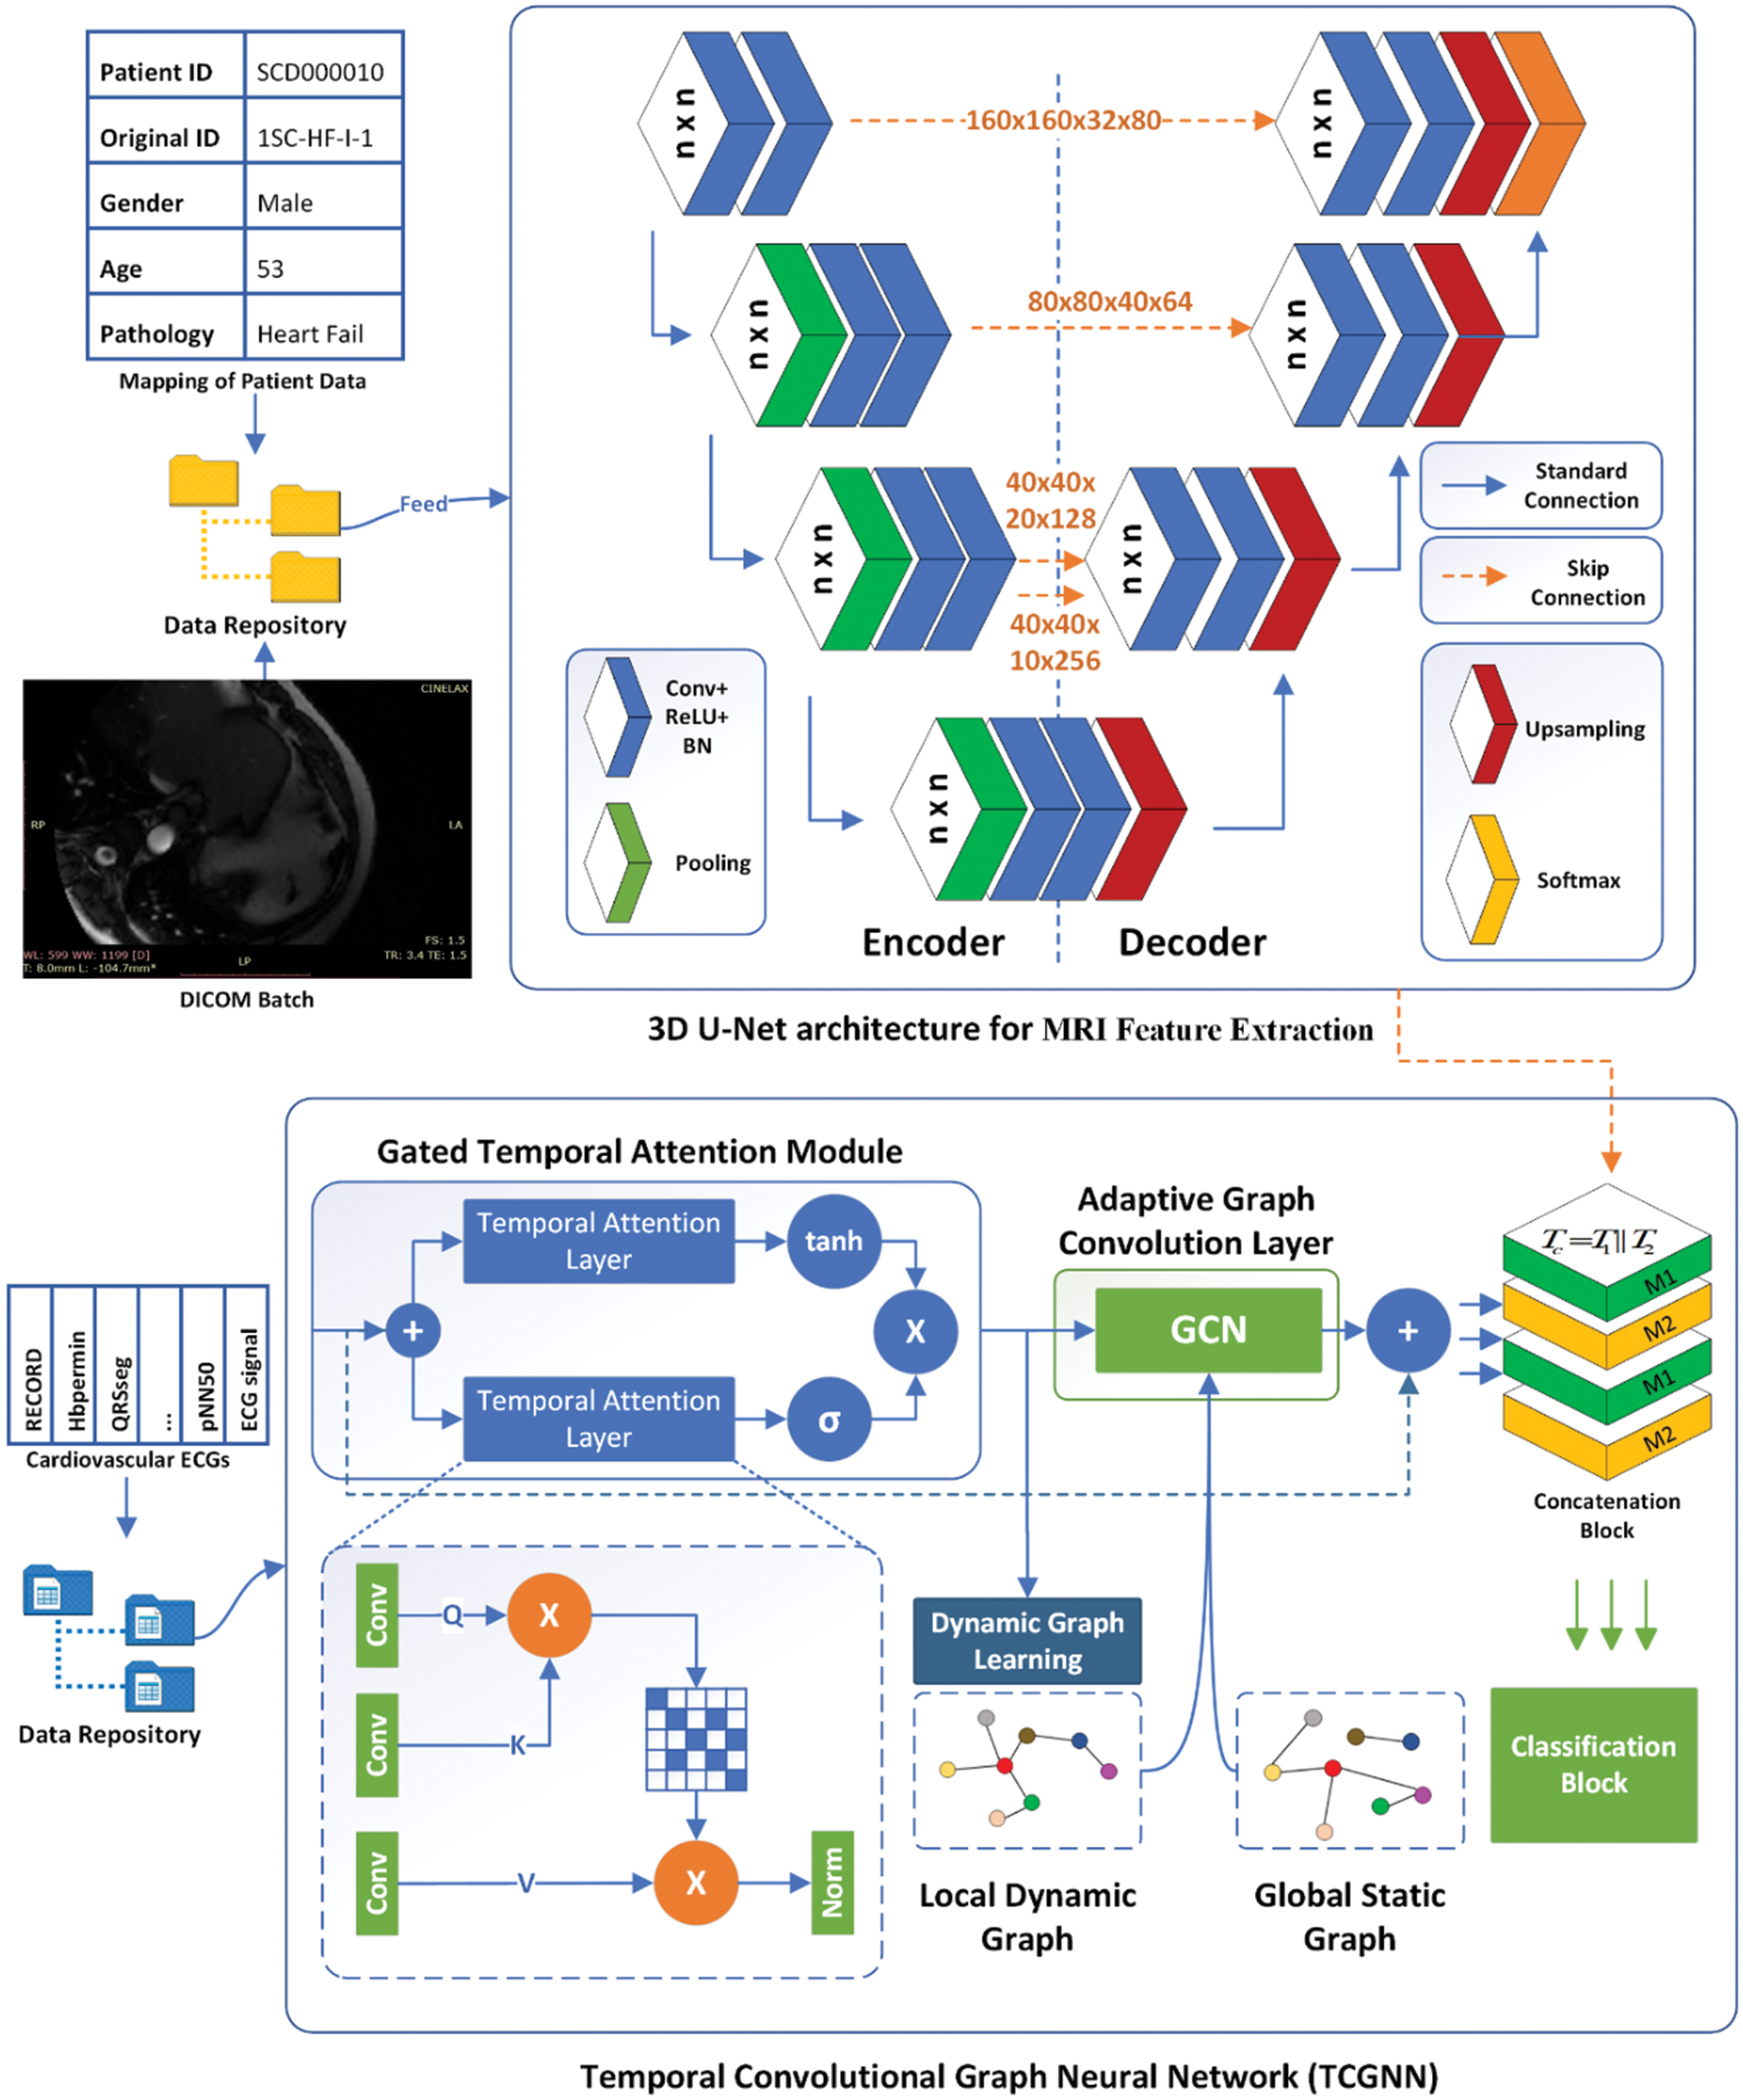
Figure 2: The proposed architecture of heart-net
Three benchmark datasets, as depicted in Table 2, have been collected for the evaluation of the proposed work. The first dataset is Sunnybrook Cardiac Data (SCD) abbreviated as HNET-DSI in this research, and also known as the 2009 Cardiac MR Left Ventricle Segmentation Challenge data.
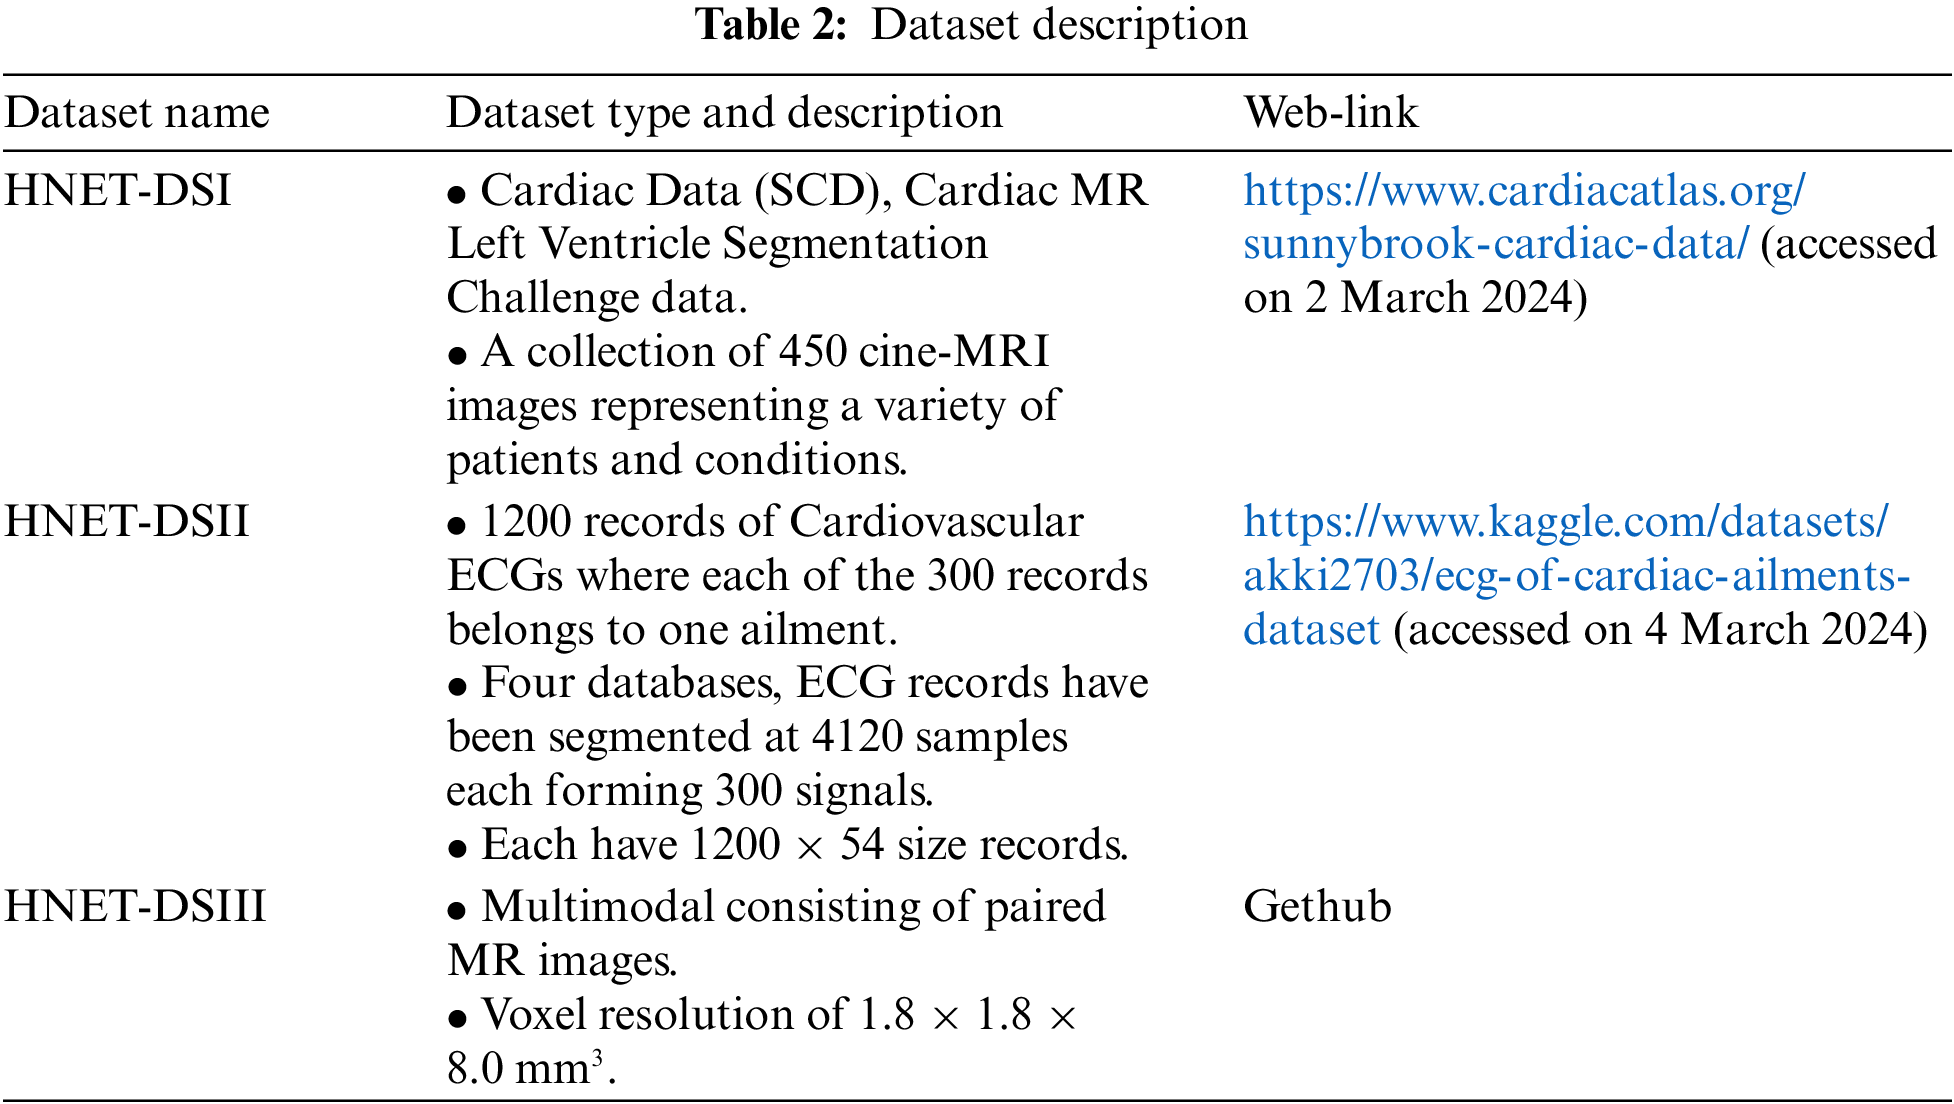
The very next is abbreviated as HNET-DSII, consisting of 1200 records of cardiovascular ECGs, with 300 records for each of the four considered ailments. The original signals are sourced from the MIT-BIH PhysioNet Database. From these four databases, ECG records have been segmented into 4120 samples each, forming 300 signals per ailment. These signals are normalized according to the specified gain for each database and preprocessed using bandpass filters. The MODWPT (Multiscale Discrete Wavelet Packet Transform) technique was used to extract 54 features, which are provided as columns in the Comma-Separated Value (CSV) file uploaded here. The resulting file contains records with dimensions of 1200 × 54. Graphical Visualization of Cardiac MRI Data representing different heart conditions is given in Fig. 3.
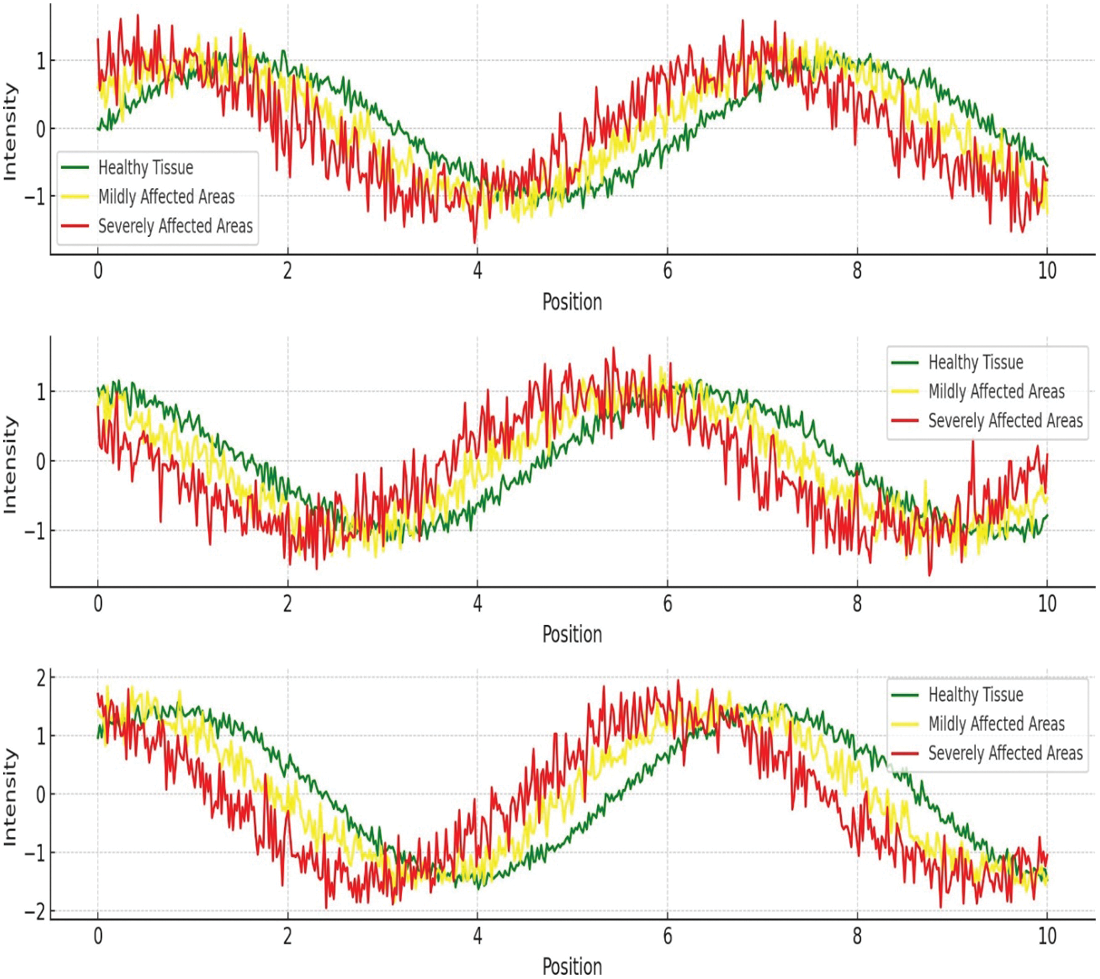
Figure 3: Graphical visualization of cardiac MRI data representing different heart conditions
The final dataset, HNET-DSIII, is a hybrid collection specifically curated from published studies. It includes data from 1300 subjects from the UK Biobank imaging study featuring paired cardiac cine MRI images and electrocardiograms. Of the 1300 subjects, 1150 were presumed healthy, while 150 had at least one cardiovascular pathology. Graphical Visualization of Cardiac EEG Data representing different heart conditions is given in Fig. 4.
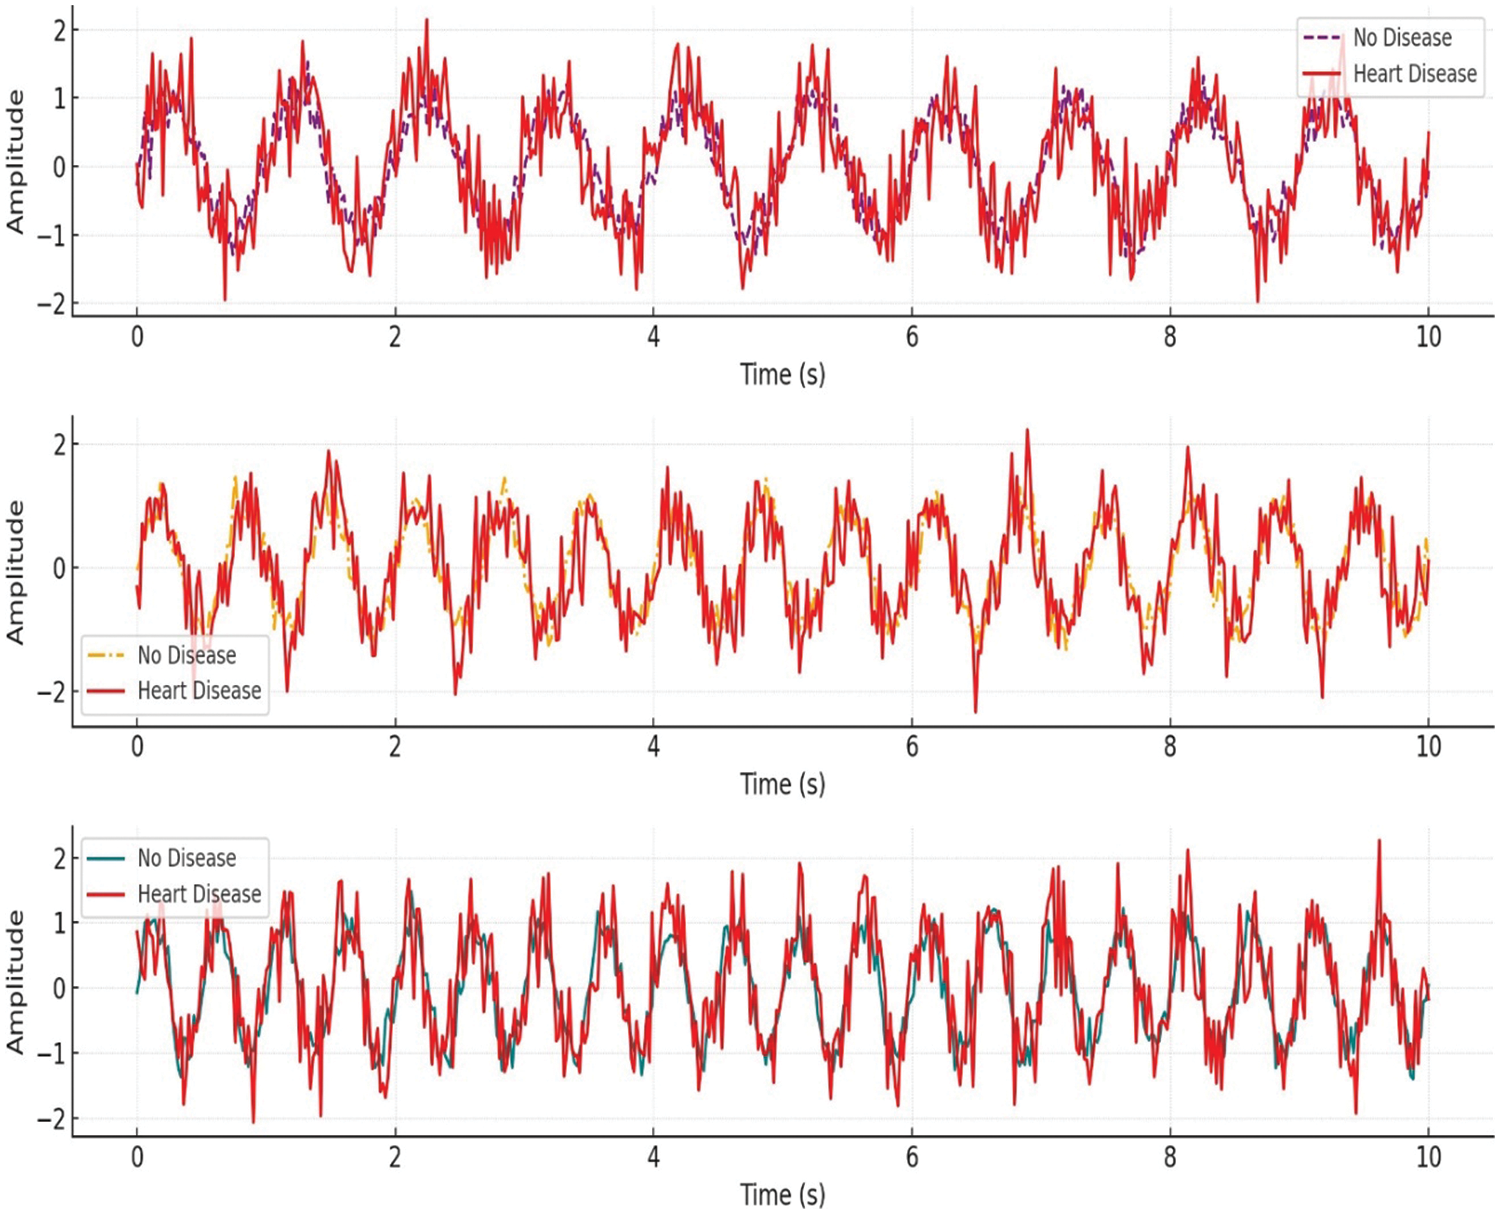
Figure 4: Graphical visualization of ECG data representing different heart conditions
3.2 Preprocessing and Data Balancing
To preprocess the multi-modal data consisting of MRI images and ECG numerical data for heart disease diagnosis, we follow a comprehensive approach. For the MRI images, we normalize the pixel intensity values to a range of [0, 1] [0, 1], ensuring consistency across all images. Mathematically, for an image I, the normalized pixel value I′ at each pixel i, is computed as:
After which, we resize or crop all images to a uniform shape, say 256 × 256 pixels, to maintain consistency in input dimensions for the model. Data augmentation techniques such as rotation, flipping, and zooming are applied to increase the variability in the training set, enhancing the model’s ability to generalize.
Alternative to this, the ECG numerical data has been normalized where each feature column x to have zero mean and unit variance using:
where
Adaptive Synthetic Sampling (ADASYN) is a powerful technique designed to address class imbalances by generating synthetic samples for the minority class in a data-driven manner. This approach is particularly useful for a multi-modal heart disease dataset comprising cardiac MRI and ECG data, where the minority class (e.g., patients with a rare heart condition) is underrepresented. Here is the complete procedure for applying ADASYN to balance such a dataset:
Firstly, preprocess the cardiac MRI and ECG data to extract relevant features. For MRI images, this may involve normalization, resizing, and extracting texture or structural features using techniques such as convolutional neural networks (CNNs). For ECG signals, preprocessing steps might include filtering, segmentation, and feature extraction using wavelet transforms or Fourier analysis.
Let
For each minority class sample
The number of synthetic samples
where G is the total number of synthetic samples needed, typically set as
For each minority class sample
where δ is a random number drawn from the uniform distribution
Integrate the generated synthetic samples with the original dataset to form a balanced training set. Train machine learning models on this balanced dataset to improve the detection of heart diseases. The models can benefit from the complementary features provided by the cardiac MRI and ECG data.
Feature extraction is fundamental for heart disease diagnosis as it enables the identification and quantification of relevant patterns within the raw data, which are often not immediately apparent. Extracting key features significantly reduces the dimensionality of the data while preserving the critical information needed for accurate diagnosis.
3.3.1 Cardiac MRI-Based Feature Extraction
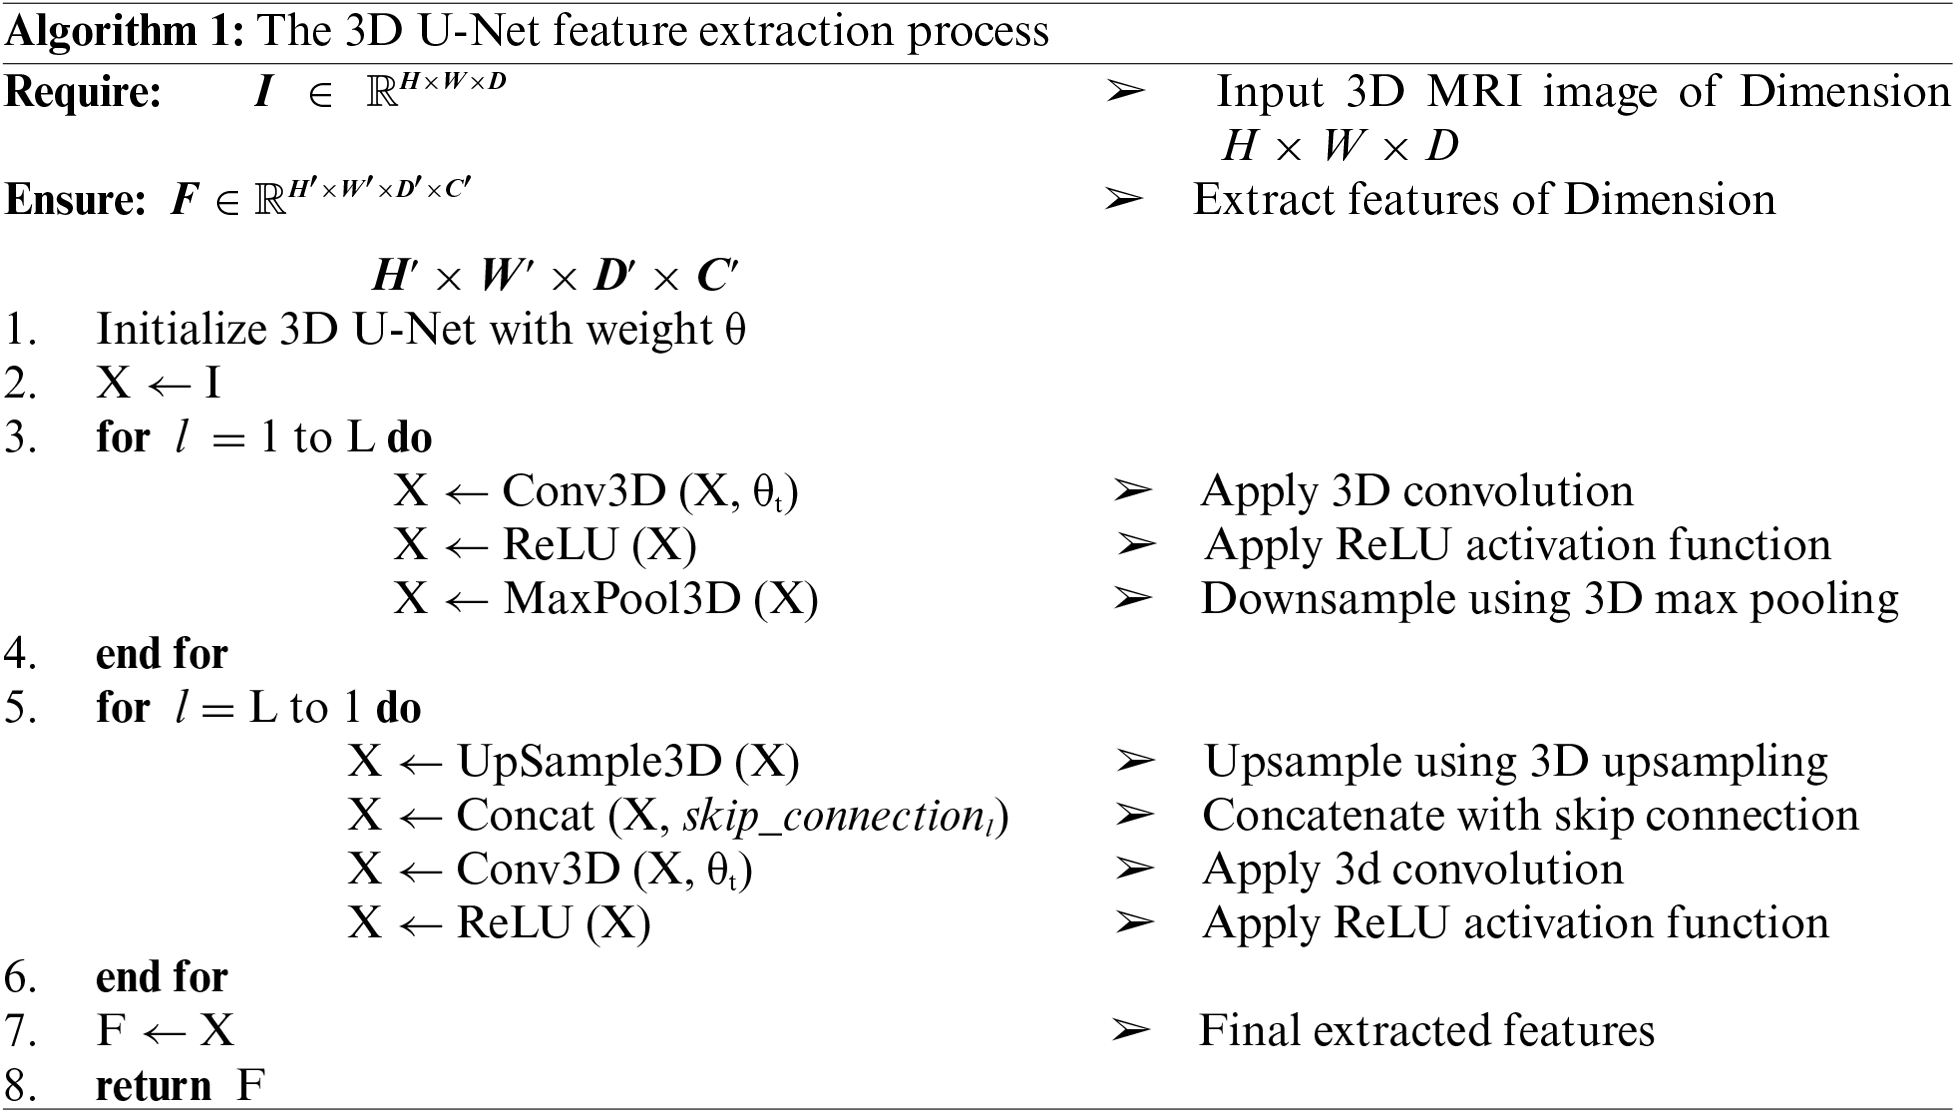
Although CNN could be considered as better option for MRI based feature extraction, but this work uses 3D U-Net for cardiac MRI feature extraction because it captures the complete 3D spatial context of the heart, preserving important anatomical details across slices. Algorithm 1 shows the working flow of 3D U-Net for cardiac MRI feature extraction, where, its 3D convolutional layers provide richer feature representations, leading to more accurate and detailed segmentations. This is essential for precise diagnosis and assessment of cardiac conditions.
In 3D convolution, the operation involves a 3D kernel sliding over the input volume. For an input volume X of size D × H × W × C (depth, height, width, and channels), and a kernel 𝐾 of size kd × kh × kw × C × F (kernel depth, height, width, input channels, and output channels), the convolution operation is defined as:
where Y is the output feature map, and d, h, w, f are the depth, height, width, and feature channel indices of the output, respectively.
The architecture consists of an encoder-decoder structure with skip connections that preserve high-resolution features during the down-sampling and up-sampling processes. In the encoder path, the network captures contextual information and reduces the spatial dimensions of the input while increasing the number of feature channels. Each layer in the encoder performs a 3D convolution followed by a Rectified Linear Unit (ReLU) activation function and max pooling operation.
At the bottleneck layer, where the features have the smallest spatial dimensions but the highest number of channels, the operation is defined:
In the decoder path, feature maps are up-sampled and convolved to reconstruct the spatial dimensions. The up-sampling is often done using transposed convolutions:
where Wl, t denotes the transposed convolutional weights. Skip connections are used to concatenate features from the encoder with the up-sampled features in the decoder, preserving spatial information and enhancing the reconstruction process:
The final output of the 3D U-Net is a segmentation map of the same size as the input, highlighting regions of interest such as the left ventricle, right ventricle, and myocardium. The segmentation probabilities are computed using a softmax function:
where P is the probability map, Y is the output from the last layer, and 𝑐 represents the class index.
From the segmentation maps, various clinical features can be extracted. For instance, the volume of a particular region (e.g., the left ventricle) is calculated by summing the number of voxels classified into that region and multiplying by the voxel volume:
Wall thickness can also be measured by analyzing the distance between the inner and outer boundaries of the myocardium. These extracted features are crucial for diagnosing heart diseases, assessing cardiac function, and planning treatment. The 3D U-Net based feature extraction from cardiac MRI is a powerful method for detailed and accurate cardiac structure analysis, leveraging 3D spatial context, ReLU activations, skip connections, and softmax functions to provide comprehensive and clinically relevant features essential for heart disease diagnosis.
3.3.2 ECG Based Feature Extraction
The Temporal Convolutional Graph Neural Network (TCGNN) is employed for EEG (Electroencephalogram) feature extraction in the Heart-Net model, leveraging its ability to capture both temporal dependencies and structural relationships in EEG data. The EEG signals are represented as a sequence of graph-structured data, where each node corresponds to an EEG channel, and edges represent the connections or correlations between channels.
Given an EEG signal X ∈ RC × T, where C is the number of channels and T is the number of time steps, we construct a graph G = (V, E), where V is the set of nodes (EEG channels) and E is the set of edges (connections between channels). The adjacency matrix A ∈ RC × C represents the connections between nodes, typically defined based on functional connectivity. The temporal convolutional layers in TCGNN capture the temporal dependencies within each EEG channel. For a given layer l, the temporal convolution operation is defined:
Here X ∈ RC × T is the output feature map at time step tt for layer l, (l) and 𝑏(l) are the learnable weights and biases, Xt is the input EEG signal, ∗ denotes the convolution operation, and 𝜎 is the activation function. The graph convolutional layers in TCGNN capture the spatial dependencies among EEG channels. For a given node i in the graph, the graph convolution operation at layer l is defined as:
where is the output feature of node ii at layer l + 1, N(i) denotes the neighbors of node i, Aij is the adjacency matrix element representing the connection between nodes i and j, H j(l) is the feature of node j at layer l, and W(l) is the learnable weight matrix.
Combining temporal and graph convolutions, the TCGNN layer at time step tt for node ii can be expressed as:
This combined operation allows TCGNN to simultaneously capture temporal dynamics and spatial dependencies in EEG data, providing a rich feature representation for downstream tasks such as heart disease diagnosis.
The attention mechanism in Heart-Net operates by dynamically focusing on the most relevant features from the integrated cardiac MRI and ECG data during the diagnostic process. This mechanism assigns varying levels of importance to different features based on their contribution to the overall diagnosis. By highlighting critical information and diminishing less relevant data, the attention mechanism enhances the model’s ability to detect subtle and significant indicators of heart disease. This targeted emphasis ensures that the most pertinent features are prioritized in the final analysis, leading to improved accuracy and reliability in heart disease diagnostics.
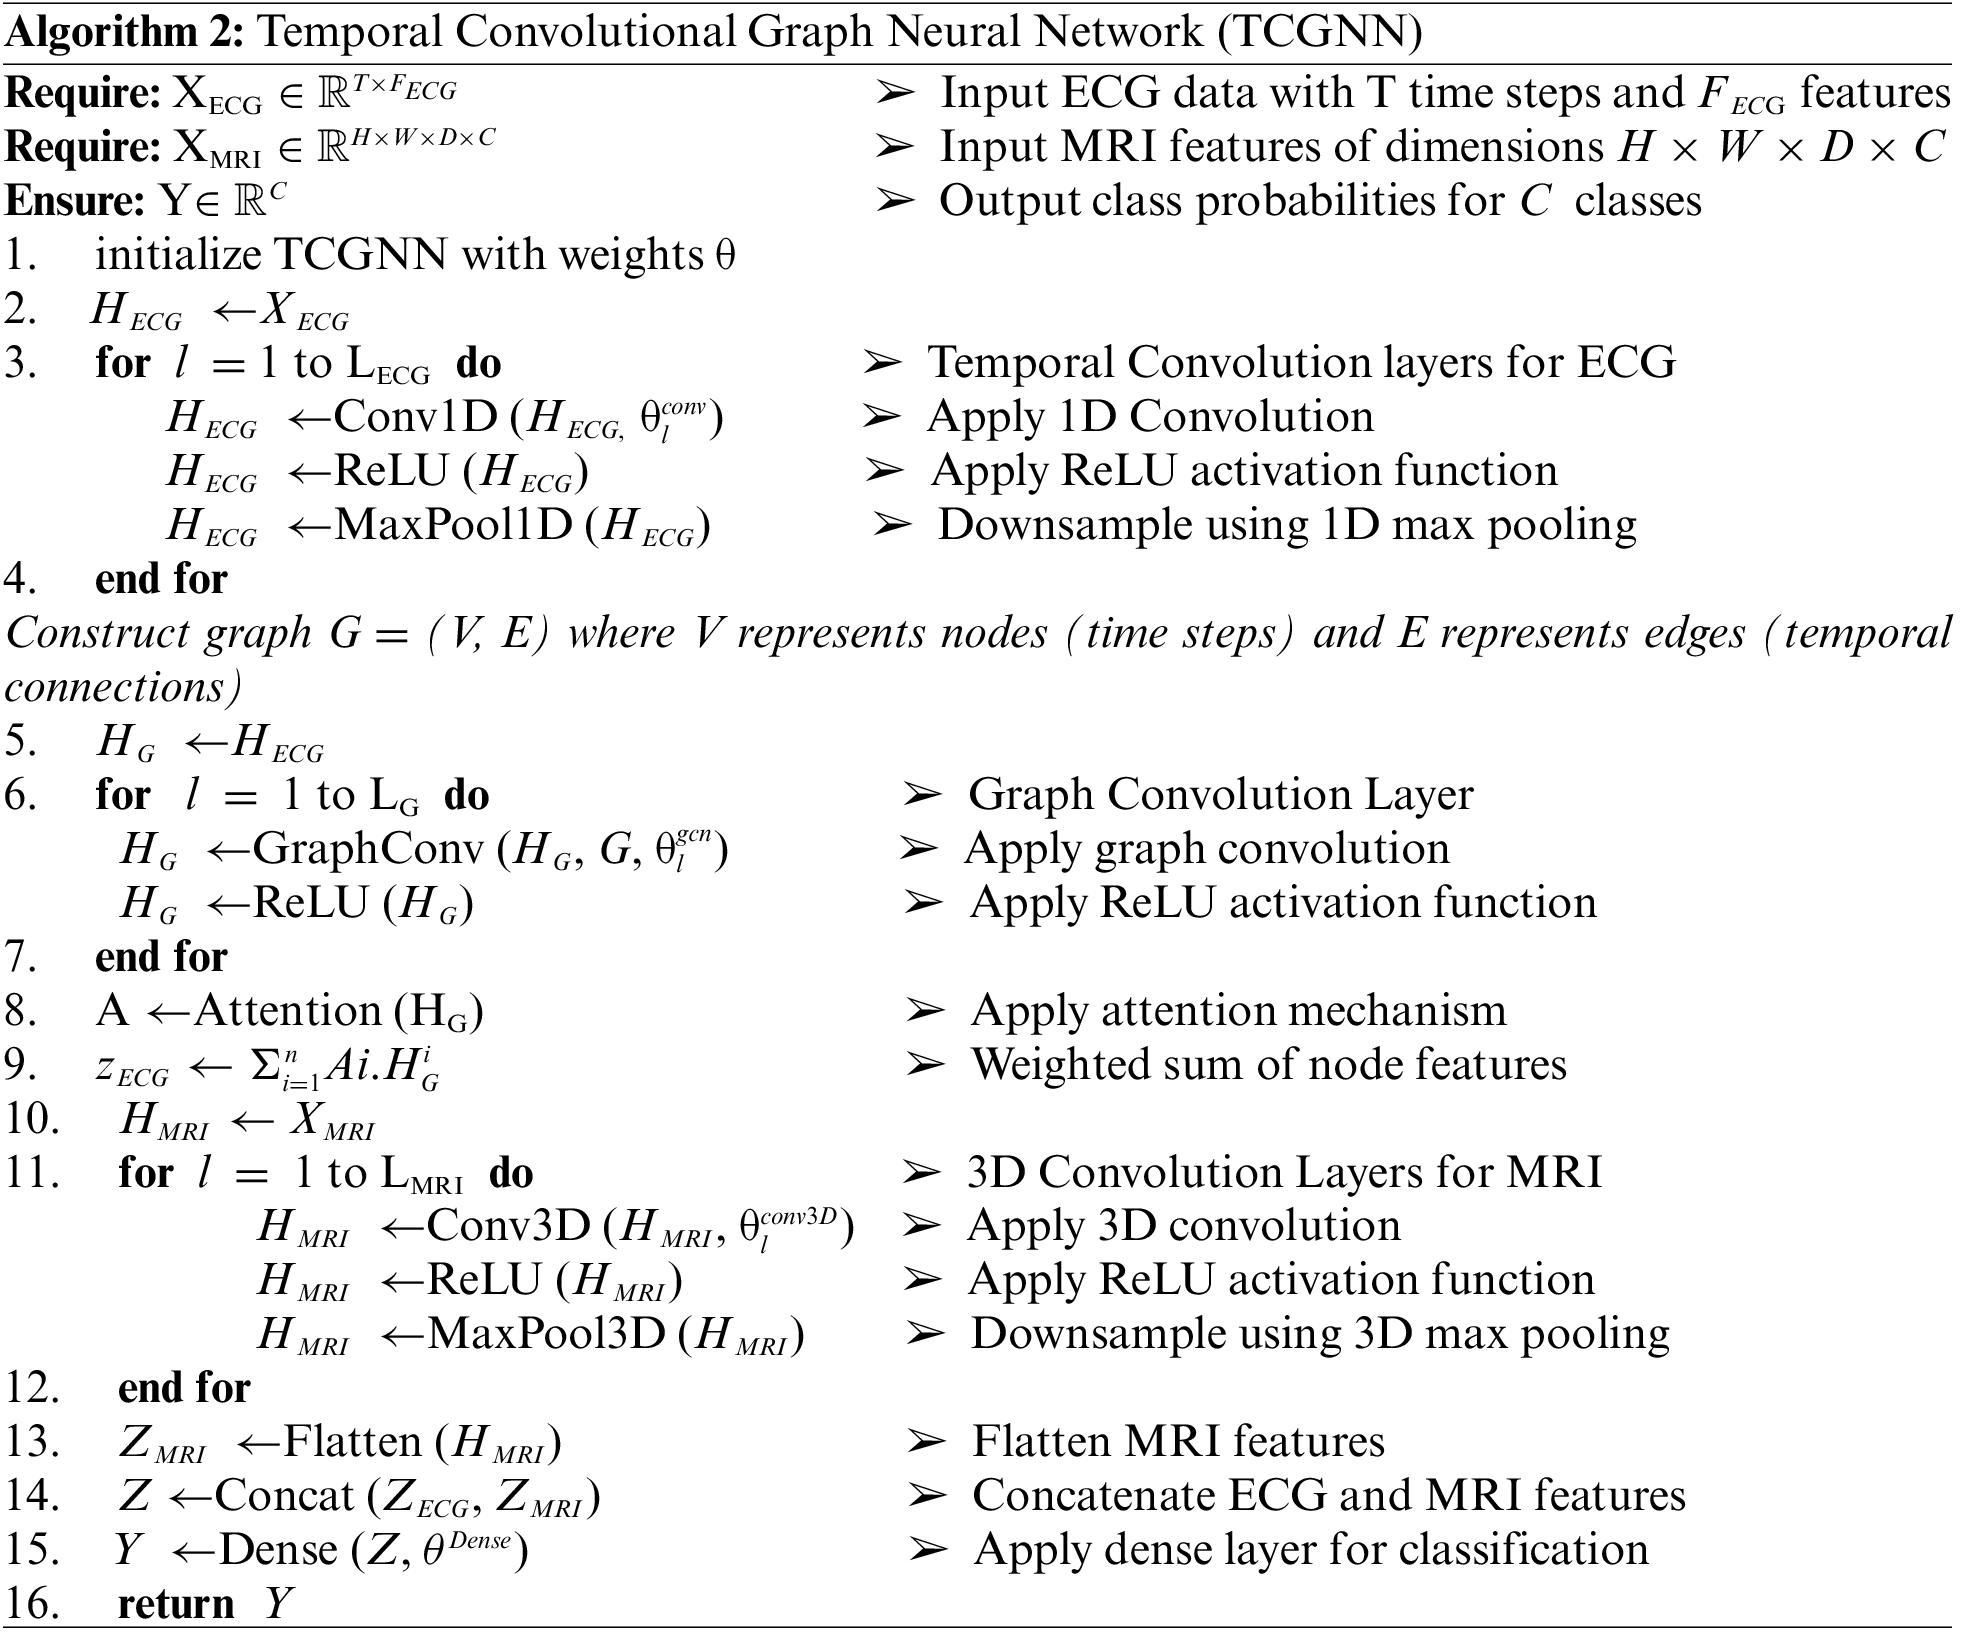
The features extracted from MRI and EEG data are concatenated to form a combined feature vector:
where Concat denotes the concatenation operation. The concatenated feature vector 𝐹c𝑜𝑚𝑏i𝑛𝑒 is fed into a dense layer for final disease diagnosis. The dense layer applies a linear transformation followed by a softmax activation function [32]:
where Wd and bd are the weights and biases of the dense layer, respectively, and y is the output vector representing the probability of each disease class. Algorithm 2 shows the working process of Temporal Convolutional Graph Neural Network for feature extraction and diseases diagnosis.
The entire Heart-Net is trained end-to-end involves minimizing a loss function, typically categorical cross-entropy for the final diagnosis:
where yi is the true label and
The working of Heart-Net is based on integrating features from MRI and EEG data, the proposed methodology leverages the strengths of both modalities, capturing detailed spatial information from MRI and temporal-spatial dependencies from EEG. The combined features, processed through a dense layer, enable accurate and robust disease diagnosis, enhancing the overall performance of the Heart-Net model.
This section describes the experimental results and evaluates how much the method proposed really works. Many different experiments were carried out to test the accuracy and efficiency of the developed system. Experimental evaluation showed that the proposed method significantly outperforms current cutting-edge methods.
4.1 Performance Evaluation Measure
Precision, recall, F1 score, and ultimate accuracy are utilized as standard benchmarks to assess the effectiveness of the proposed model. Eqs. (20)–(23) mentioned the corresponding measures in which (TP, TN, FN, and FP) stand for (True Positive), (False Negative) and (False Positive), respectively [26].
where it has been standard practice to use a Receiver Operating Characteristic (ROC) Curve in measuring the effectiveness of a classifier [27], display the formula for an indicator of performance.
The baseline method establishes a starting point for evaluating advanced algorithms. It is simple and transparent, providing a basic level of performance. It guides research, highlights limitations, and sets a minimum threshold for success, fostering fairness in comparisons and driving innovation.
• Baseline 1: Sohaib et al. [32] proposed a technique that was based on the CNN and Long Short-Term Memory (LSTM) classifier.
• Baseline 2: Ogunpola et al. [33] used different machine-learning algorithms to enhance the accuracy of heart disease predictions.
• Baseline 3: Raviprakash et al. [34] proposed a technique that were based on the Support Vector Machines (SVM) and Random Forests have demonstrated notable success in identifying cardiac abnormalities.
• Baseline 3: Islam et al. [35] presented a technique that was based on Recursive Feature Extraction (RFE) and Principal Component Analysis (PCA) for heart disease prediction
K-Fold Cross Validation is a resampling technique used to evaluate the performance of a model. This process is repeated K times, with each fold used once as the validation data, and the results are averaged for a final performance estimate. In experiments, we take K as 5, meaning the dataset is divided into 5 equal subsets. The model is trained and validated 5 times, each time using 4 of the subsets for training and the remaining subset for validation. This process ensures each subset is used once for validation, providing a more reliable performance estimate by averaging the results from all 5 iterations. In the very first step, the experiment performed the efficacy of a novel method, by measuring its precision, accuracy, and recall. The experimental results are presented graphically in Fig. 5 which depicts the performance of the proposed approach across different datasets in terms of precision, accuracy, and recall. Fig. 5 demonstrates that the proposed technique achieved high scores on all datasets, indicating impressive results in terms of precision, accuracy, and recall across each dataset.
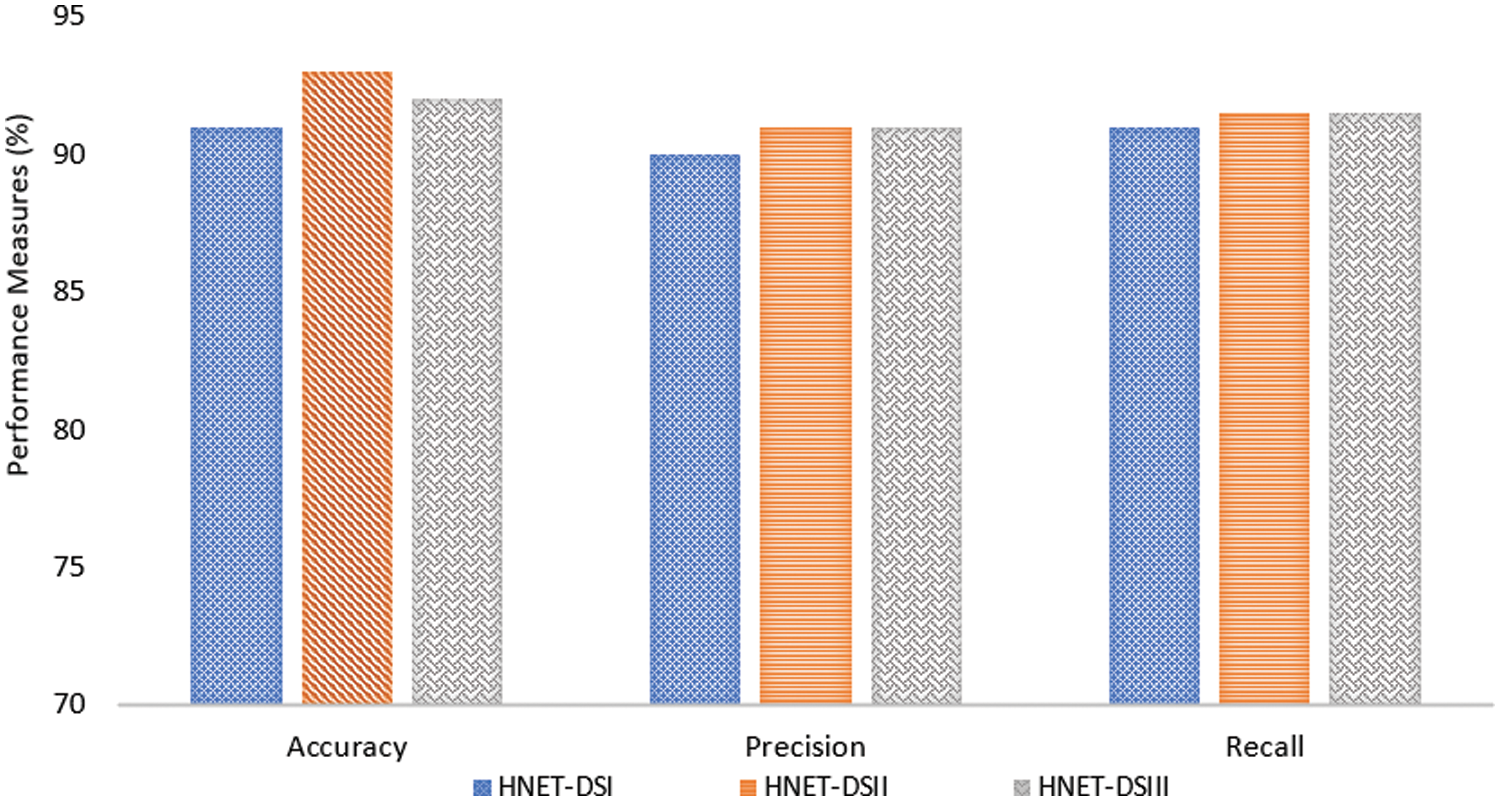
Figure 5: Performance measure of the proposed model in terms of precision, recall, and F1 score
The graphical representation in Fig. 6 indicates that the proposed technique achieved high precision, recall, and accuracy scores across the different datasets. The accuracy, precision and recall of the suggested technique were specifically 91.74%, 90.15%, and 91.45% when used on the HNET-DSI, demonstrating outstanding results.

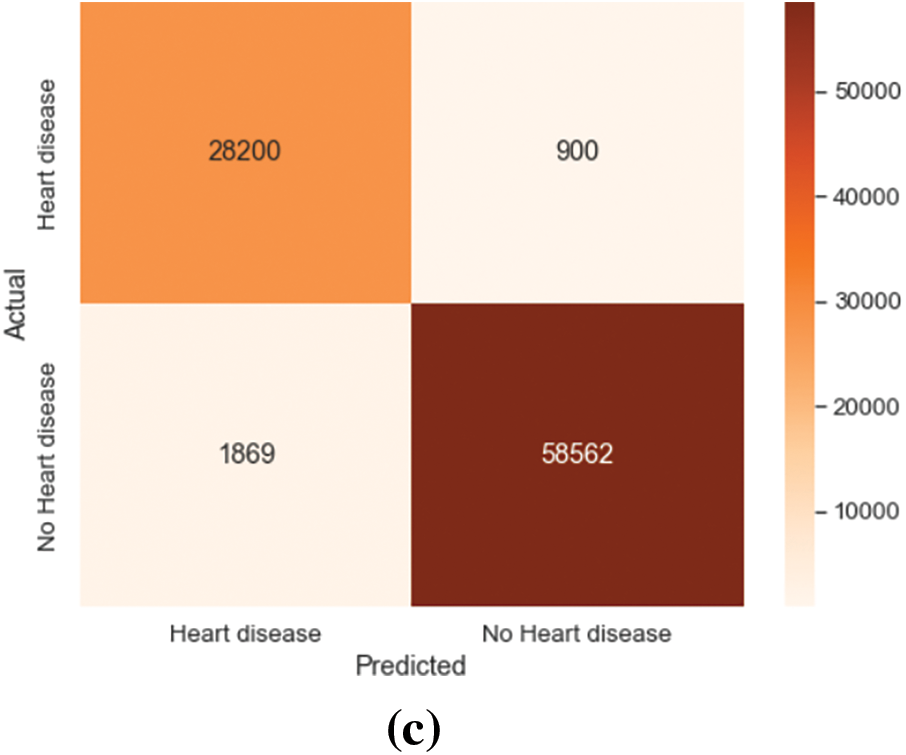
Figure 6: Confusion matrix on HNET-DSI, HNET-DSII and HNET-DSIII. (a) Actual-predicted response rate of the proposed model on HNET-DSI. (b) Actual-predicted response rate of the proposed model on HNET-DSII. (c) Actual-predicted response rate of the proposed model on HNET-DSIII
Similar results were obtained when the suggested method was applied to the HNET-DSII, yielding impressive accuracy, precision, and recall of 93.47%, 91.2%, and 92.24%. On the HNET-DSIII achieved an accuracy of 92.25 precision of 91.45 and recall of 92.05. Another experiment was conducted to observe the confusion matrix for the prediction of the top three breeds as numbered (1, 2, 3) in the matrix. The results of HNET-DSI, HNET-DSII, and HNET-DSIII in Fig. 7a–c demonstrate the confusion matrix of each dataset, respectively.

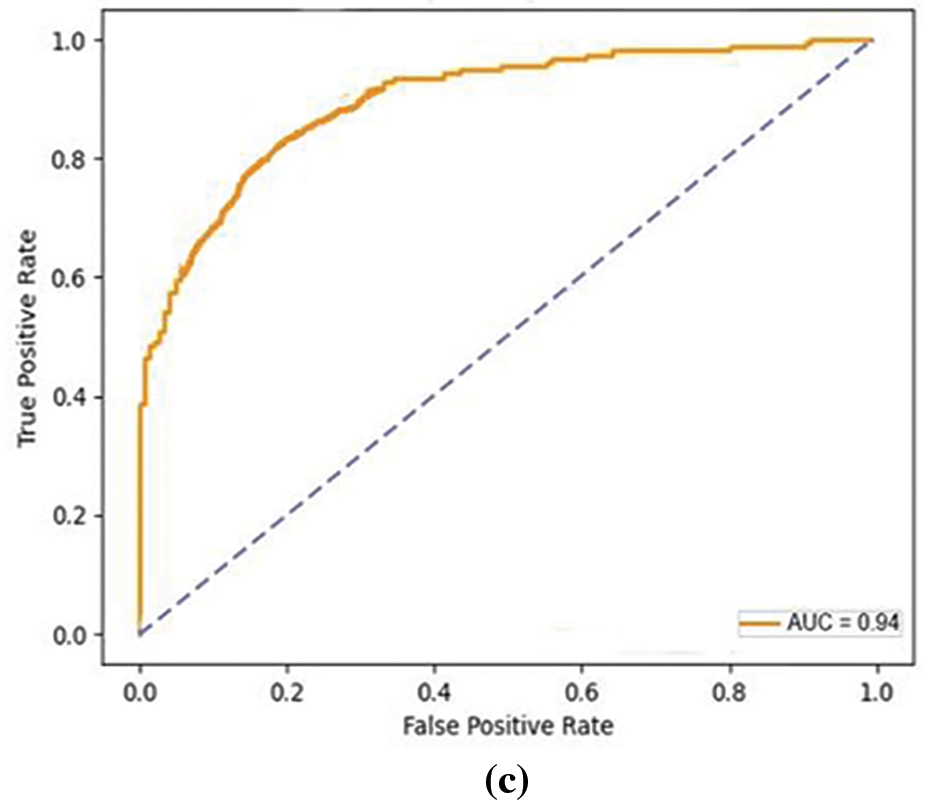
Figure 7: ROC curves on HNET-DSI, HNET-DSII and HNET-DSIII. (a) The true positive and false positive rate of proposed mode on HNET-DSI. (b) The true positive and false positive rate of proposed model on HNET-DSII. (c) The true positive and false positive rate of proposed model on HNET-DSIII
In another experiment, ROC curves were utilized to assess the effectiveness of the proposed approach in distinguishing between True and False instances as shown in Fig. 7. Across all datasets, an average Area Under Curve (AUC) of 0.93 indicates that the model attains a notable true positive rate while simultaneously keeping a low false positive rate across various classification thresholds. The comparative analysis of the proposed model presented in Fig. 8 highlights incremental improvements across three baseline models, culminating in superior performance by the proposed model. Baseline 1 sets a moderate foundation with uniform metrics of accuracy, precision, and recall ranging from 84.56% to 85.96%, indicating adequate but improvable performance in emotion detection. Progressing to Baseline 2, there is a slight improvement in all performance indicators accuracy rises to 87.56%, precision to 86.14%, and recall to 85.5%. This reflects subtle refinements in the model’s capacity to accurately identify and classify emotional expressions. Baseline 3 marks a significant enhancement, achieving 90% across all metrics, suggesting a more robust model that balances the identification of relevant cases with the accuracy of these classifications. The proposed model, however, outstrips all baselines with an accuracy of 92.55%, a precision of 90.67%, and a recall of 91.5%. This superior performance indicates that modifications in the model’s algorithm or underlying technologies potentially including advanced feature extraction methods and improved classification algorithms have markedly boosted its efficacy.
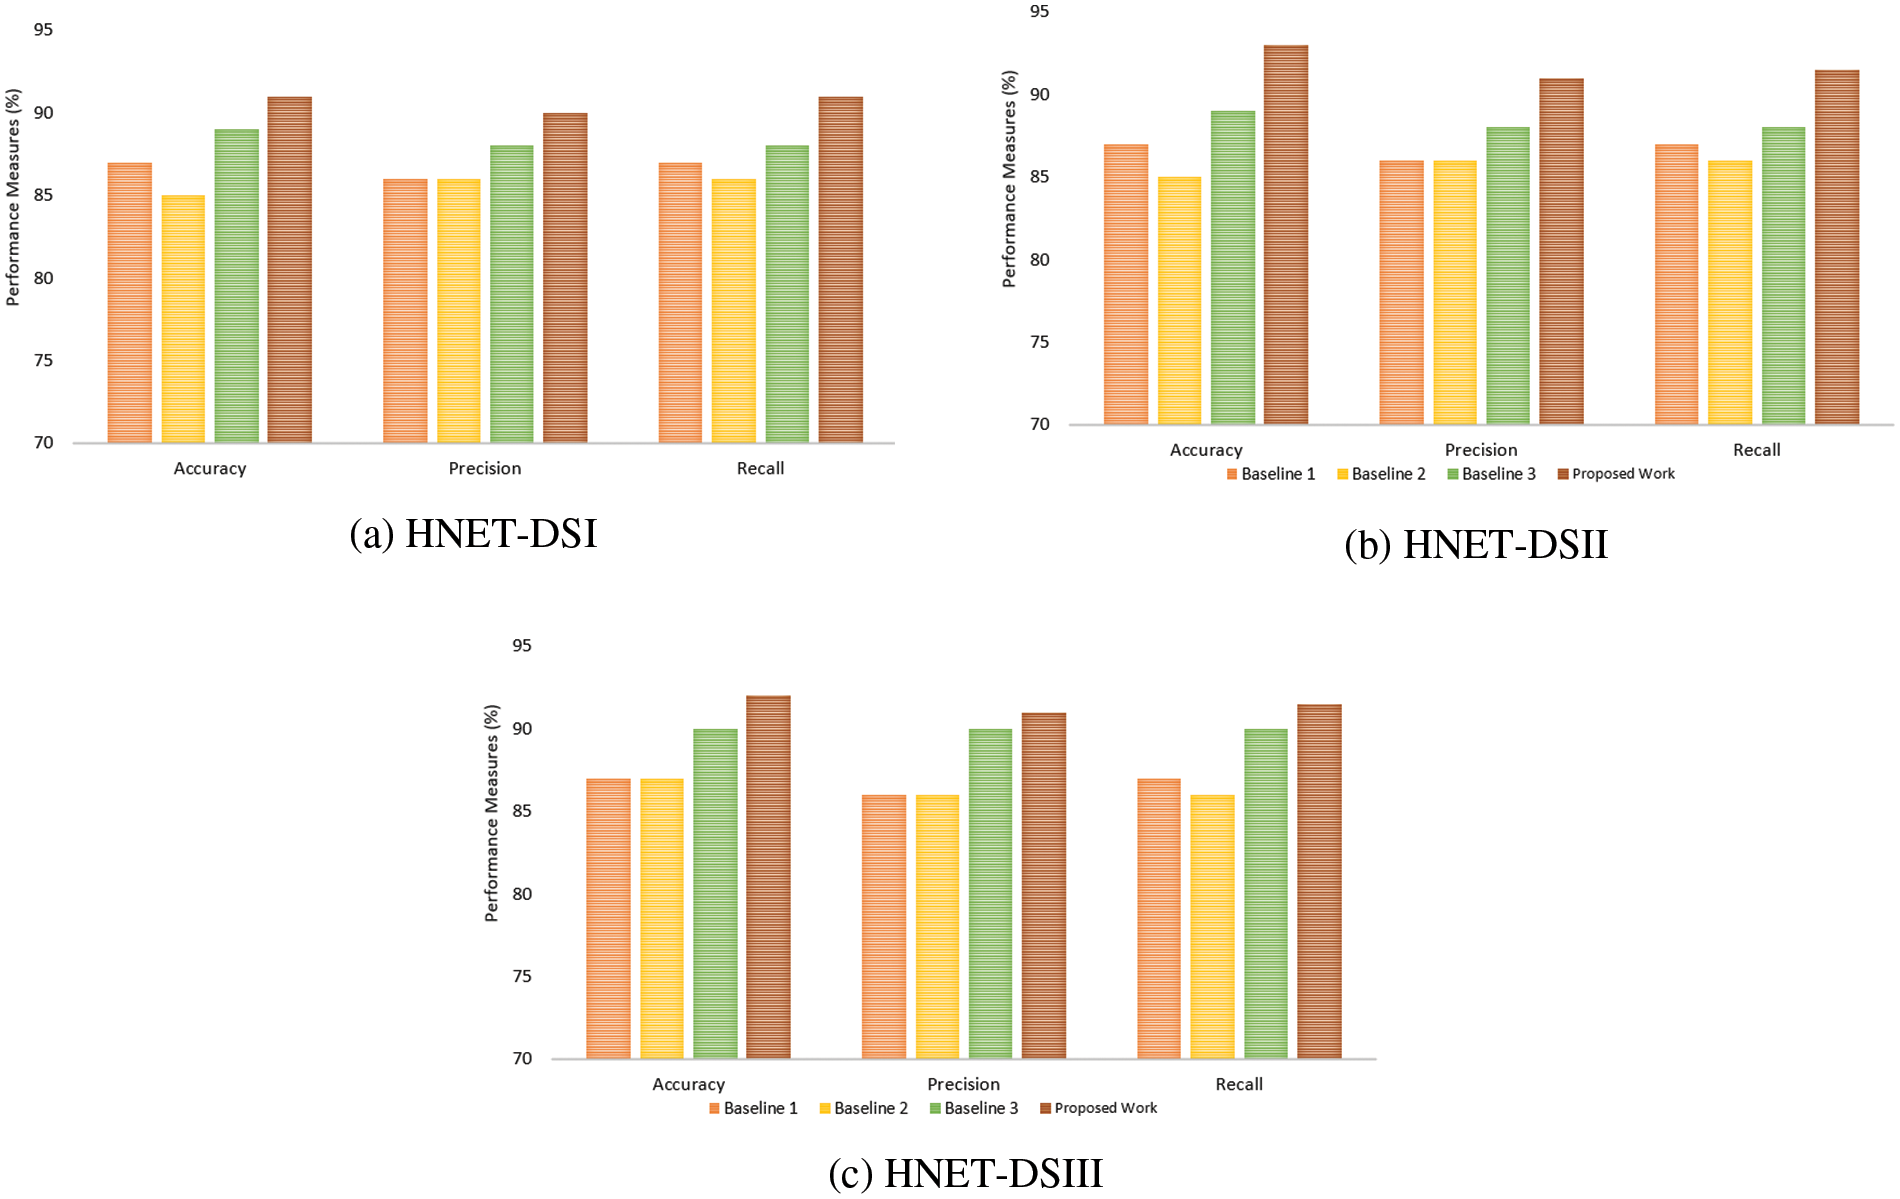
Figure 8: Comparative analysis of the proposed model with existing benchmark methods (a) HNET-DS1 (b) HNET-DSII and (c) HNET-DS-III
Fig. 9 presents a comparison of heart disease prediction results using three different methods (HNNet DSI, HNNet DSII, and HNNet DSIII) between the method proposed by Islam et al. [35] and a new proposed method. For HNNet DSI, the Islam et al. [35] method achieved an accuracy of 91.25%, while the proposed method achieved 92.56%, indicating an improvement of 1.31 percentage points. For HNNet DSII, the Islam et al. [35] method achieved an accuracy of 91.98%, compared to 93.45% for the proposed method, showing an improvement of 1.47 percentage points. Lastly, for HNNet DSIII, the Islam et al. [35] method had an accuracy of 89.02%, whereas the proposed method achieved 91.89%, marking an improvement of 2.87 percentage points. Overall, the proposed method demonstrates consistently better performance across all three methods for heart disease prediction compared to the Islam et al. [35] method.
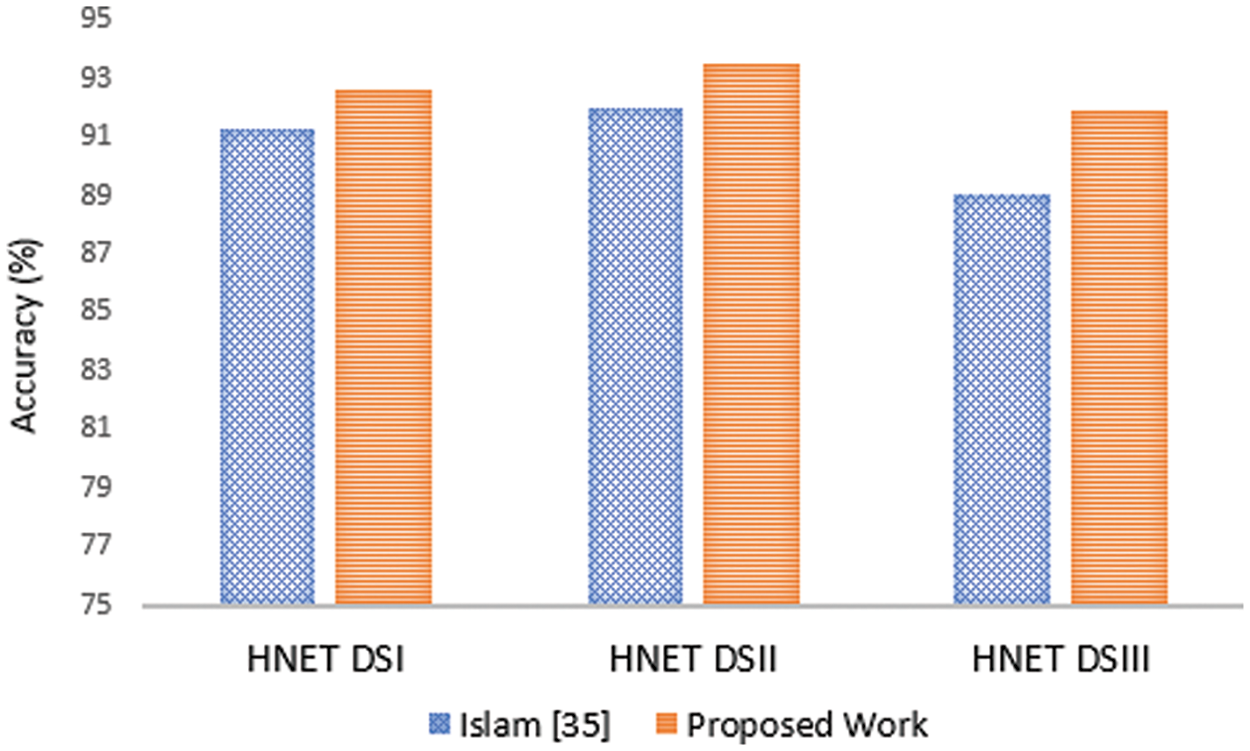
Figure 9: Comparative analysis of the proposed model with Islam et al. [35] approach
Traditional diagnostic methods have inherent limitations, such as dependence on single-modality data and vulnerability to apparatus faults. These constraints can lead to missed diagnoses and false positives, ultimately compromising patient care. In contrast, computer-based models, such as machine learning and deep learning, primarily focus on image data from MRI and X-ray for heart disease diagnostics. However, these methods may also face challenges like reduced accuracy when dealing with poor-quality or blurry images, further affecting diagnostic reliability. This study introduces Heart-Net, an advanced multi-modal deep learning framework designed to enhance the accuracy and comprehensiveness of heart disease diagnosis. Heart-Net integrates data from Cardiac MRI and heart ECG to leverage the unique strengths of each modality. By utilizing a 3D U-Net for volumetric MRI analysis and a Graph Temporal Convolutional Network (GTCN) for ECG feature extraction, Heart-Net captures a holistic view of a patient’s cardiac health. The experimental results demonstrate that Heart-Net significantly outperforms traditional single-modality models, achieving accuracies of 92.56% for HNET-DSI, 93.45% for HNET-DSII, and 91.89% for HNET-DSIII. For future work, we aim to further enhance Heart-Net by incorporating additional modalities and exploring its application in other cardiovascular conditions. We also plan to refine the attention mechanism and classification algorithms to boost performance. Expanding the dataset with diverse and representative samples will ensure the model’s robustness and generalizability across different populations. Finally, integrating real-time data from wearable devices could facilitate continuous health monitoring, making Heart-Net an even more powerful tool in proactive cardiac care.
Acknowledgement: The authors would like to acknowledge the support of Princess Nourah bint Abdulrahman University Researchers Supporting Project Number (PNURSP2024R435), Princess Nourah bint Abdulrahman University, Riyadh, Saudi Arabia.
Funding Statement: This research is funded by Princess Nourah bint Abdulrahman University Researchers Supporting Project Number (PNURSP2024R435), Princess Nourah bint Abdulrahman University, Riyadh, Saudi Arabia.
Author Contributions: All authors contributed equally. The authors confirm their contribution to the paper as follows: Study conception and design: Deema Mohammed Alsekait, Ahmed Younes Shdefat, Asif Nawaz; Data collection: Ayman Nabil, Muhammad Rizwan Rashid Rana; Analysis and interpretation of results: Deema Mohammed Alsekait, Diaa Salama AbdElminaam; Draft manuscript preparation: Zohair Ahmed, Hanaa Fathi, Asif Nawaz; Supervision, Methodology, Conceptualization, Formal analysis, Writing—review & editing: Diaa Salama AbdElminaam. All authors reviewed the results and approved the final version of the manuscript.
Availability of Data and Materials: The data is available with the corresponding author and can be shared on request.
Ethics Approval: Not applicable.
Conflicts of Interest: The authors declare that they have no conflicts of interest to report regarding the present study.
References
1. W. S. R. Hasani et al., “The global estimate of premature cardiovascular mortality: A systematic review and meta-analysis of age-standardized mortality rate,” BMC Public Health, vol. 23, no. 1, pp. 1561, 2023. doi: 10.1186/s12889-023-16466-1. [Google Scholar] [PubMed] [CrossRef]
2. F. Taher, H. Alshammari, L. Osman, M. Elhoseny, A. Shehab and E. Elayat, “Cardiac arrhythmia disease classifier model based on a fuzzy fusion approach,” Comput. Mater. Contin., vol. 75, no. 2, pp. 4485–4499, 2023. doi: 10.32604/cmc.2023.036118. [Google Scholar] [CrossRef]
3. A. Pandey, B. A. Shivaji, M. Acharya, and K. K. Mohbey, “Mitigating class imbalance in heart disease detection with machine learning,” Multimed. Tools Appl., vol. 83, no. 34, pp. 1–26, 2024. doi: 10.1007/s11042-024-19705-8. [Google Scholar] [CrossRef]
4. S. Ghwanmeh, A. Mohammad, and A. Al-Ibrahim, “Innovative artificial neural networks-based decision support system for heart diseases diagnosis,” J. Intell. Learn. Syst. Appl., vol. 5, no. 3, pp. 176–184, 2013. doi: 10.4236/jilsa.2013.53019. [Google Scholar] [CrossRef]
5. H. Ahmed, E. M. G. Younis, A. Hendawi, and A. A. Ali, “Heart disease identification from patients’ social posts, machine learning solution on Spark,” Futur. Gener. Comput. Syst., vol. 92, pp. 76–83, 2019. [Google Scholar]
6. N. Chandrasekhar and S. Peddakrishna, “Enhancing heart disease prediction accuracy through machine learning techniques and optimization,” Processes, vol. 11, no. 4, pp. 1210–1241, 2023. doi: 10.3390/pr11041210. [Google Scholar] [CrossRef]
7. M. Bukhari et al., “A smart heart disease diagnostic system using deep vanilla LSTM,” Comput. Mater. Contin., vol. 77, no. 1, pp. 1251–1279, 2023. doi: 10.32604/cmc.2023.040329. [Google Scholar] [CrossRef]
8. M. Ahmed and I. Husien, “Heart disease prediction using hybrid machine learning: A brief review,” J. Robot. Control (JRC), vol. 5, no. 3, pp. 884–892, 2024. [Google Scholar]
9. S. I. Ansarullah and P. Kumar, “A systematic literature review on cardiovascular disorder identification using knowledge mining and machine learning method,” Int. J. Recent Technol. Eng., vol. 7, no. 6S, pp. 1009–1015, 2019. [Google Scholar]
10. D. Shah, S. Patel, and S. K. Bharti, “Heart disease prediction using machine learning techniques,” SN Comput. Sci., vol. 1, no. 6, pp. 345, 2020. doi: 10.1007/s42979-020-00365-y. [Google Scholar] [CrossRef]
11. S. Rani and S. Masood, “Predicting congenital heart disease using machine learning techniques,” J. Discrete Math. Sci. Cryptogr., vol. 23, no. 1, pp. 293–303, 2020. doi: 10.1080/09720529.2020.1721862. [Google Scholar] [CrossRef]
12. I. Tougui, T. Jilbab, and J. El Mhamdi, “Heart disease classification using data mining tools and machine learning techniques,” Health Technol., vol. 10, no. 5, pp. 1137–1144, 2020. doi: 10.1007/s12553-020-00438-1. [Google Scholar] [CrossRef]
13. S. Palaniappan and R. Awang, “Intelligent heart disease prediction system using data mining techniques,” in Proc. IEEE/ACS Int. Conf. Comput. Syst. Appl., Doha, Qatar, Mar. 30–31, 2008, pp. 30–31. [Google Scholar]
14. E. O. Olaniyi, O. K. Oyedotun, and K. Adnan, “Heart diseases diagnosis using neural networks arbitration,” Int. J. Intell. Syst. Appl., vol. 7, no. 12, pp. 72–77, 2015. doi: 10.5815/ijisa.2015.12.08. [Google Scholar] [CrossRef]
15. R. Das, I. Turkoglu, and A. Sengur, “Effective diagnosis of heart disease through neural networks ensembles,” Expert Syst. Appl., vol. 36, no. 4, pp. 7675–7680, May 2009. [Google Scholar]
16. O. W. Samuel, G. M. Asogbon, A. K. Sangaiah, P. Fang, and G. Li, “An integrated decision support system based on ANN and Fuzzy_AHP for heart failure risk prediction,” Expert. Syst. Appl., vol. 68, no. 3, pp. 163–172, Feb. 2017. doi: 10.1016/j.eswa.2016.10.020. [Google Scholar] [CrossRef]
17. V. S. Kumar, “Diagnosis of heart disease using fuzzy resolution mechanism,” J. Artif. Intell., vol. 5, no. 1, pp. 47–55, Jan. 2012. doi: 10.3923/jai.2012.47.55. [Google Scholar] [CrossRef]
18. J. P. Li, A. U. Haq, S. U. Din, J. Khan, A. Khan and A. Saboor, “Heart disease identification method using machine learning classification in e-healthcare,” IEEE Access, vol. 8, pp. 98557–98569, 2020. doi: 10.1109/ACCESS.2020.3001149. [Google Scholar] [CrossRef]
19. G. T. Reddy, M. P. K. Reddy, K. Lakshmanna, D. S. Rajput, R. Kaluri and G. Srivastava, “Hybrid genetic algorithm and a fuzzy logic classifier for heart disease diagnosis,” Evol. Intell., vol. 13, no. 1, pp. 185–196, 2020. doi: 10.1007/s12065-019-00327-1. [Google Scholar] [CrossRef]
20. M. S. Amin, Y. K. Chiam, and K. D. Varathan, “Identification of significant features and data mining techniques in predicting heart disease,” Telematics Inform., vol. 36, no. 1, pp. 82–93, 2018. doi: 10.1016/j.tele.2018.11.007. [Google Scholar] [CrossRef]
21. C. B. C. Latha and S. C. Jeeva, “Improving the accuracy of prediction of heart disease risk based on ensemble classification techniques,” Inform. Med. Unlocked, vol. 16, pp. 2352–9148, 2019. doi: 10.1016/j.imu.2019.100203. [Google Scholar] [CrossRef]
22. P. M. Alex and S. P. Shaji, “Prediction and diagnosis of heart disease patients using data mining technique,” Int. J. Eng. Adv. Technol., vol. 8, no. 6, pp. 1269–1274, 2019. [Google Scholar]
23. R. Bharti, A. Khamparia, M. Shabaz, G. Dhiman, S. D. Pande and P. Singh, “Prediction of heart disease using a combination of machine learning and deep learning,” J. Healthc. Eng., vol. 2021, pp. 6654380, 2021. doi: 10.1155/2021/8387680. [Google Scholar] [PubMed] [CrossRef]
24. J. Sekar, P. Aruchamy, H. S. L. Abdul, A. S. Mohammed, and S. Khamuruddeen, “An efficient clinical support system for heart disease prediction using TANFIS classifier,” J. King Saud Univ.-Comput. Inf. Sci., vol. 34, no. 1, pp. 109–118, 2022. doi: 10.1111/coin.12487. [Google Scholar] [CrossRef]
25. F. Ali et al., “A smart healthcare monitoring system for heart disease prediction based on ensemble deep learning and feature fusion,” J. Supercomput., vol. 76, pp. 13573–13589, 2020. doi: 10.1016/j.inffus.2020.06.008. [Google Scholar] [CrossRef]
26. C. B. Gokulnath and S. P. Shantharajah, “An optimized feature selection based on genetic approach and support vector machine for heart disease,” J. Med. Syst., vol. 42, no. 8, pp. 145, 2018. [Google Scholar]
27. A. N. Repaka, S. D. Ravikanti, and R. G. Franklin, “Design and implementing heart disease prediction using Naives Bayesian,” Mater. Today: Proc, vol. 42, no. 1, pp. 1002–1008, 2021. [Google Scholar]
28. S. Mohan, C. Thirumalai, and G. Srivastava, “Effective heart disease prediction using hybrid machine learning techniques,” IEEE Access, vol. 7, pp. 81542–81554, 2019. doi: 10.1109/ACCESS.2019.2923707. [Google Scholar] [CrossRef]
29. H. Jindal, S. Agrawal, R. Khera, R. Jain, and P. Nagrath, “Heart disease prediction using machine learning algorithms,” in 1st Int. Conf. Comput. Res. Data Anal. (ICCRDA 2020), Rajpura, India, Oct. 24, 2020. doi: 10.1088/1757-899X/1022/1/012072. [Google Scholar] [CrossRef]
30. C. S. Pandian and A. M. Kalpana, “HybDeepNet: ECG signal based cardiac arrhythmia diagnosis using a hybrid deep learning model,” Inf. Technol. Control., vol. 52, no. 2, pp. 416–432, 2023. doi: 10.5755/j01.itc.52.2.33302. [Google Scholar] [CrossRef]
31. V. J. Prakash and N. K. Karthikeyan, “Dual-layer deep ensemble techniques for classifying heart disease,” Inf. Technol. Control., vol. 51, no. 1, pp. 158–179, 2022. doi: 10.5755/j01.itc.51.1.30083. [Google Scholar] [CrossRef]
32. M. Shoaib et al., “Advanced detection of coronary artery disease via deep learning analysis of plasma cytokine data,” Front Cardiovasc. Med., vol. 11, pp. 1365481, 2024. doi: 10.3389/fcvm.2024.1365481. [Google Scholar] [PubMed] [CrossRef]
33. A. Ogunpola, F. Saeed, S. Basurra, A. M. Albarrak, and S. N. Qasem, “Machine learning-based predictive models for detection of cardiovascular diseases,” Diagnostics, vol. 14, no. 2, pp. 144, 2024. doi: 10.3390/diagnostics14020144. [Google Scholar] [PubMed] [CrossRef]
34. M. L. Raviprakash, H. P. Inchara, S. Pallavi, and K. M. Sheetal, “Heart attack analysis using ensemble machine learning,” Int. J. Adv. Sci. Innov., vol. 6, no. 5, pp. 225–235, 2024. [Google Scholar]
35. M. A. Islam, M. Z. H. Majumder, M. S. Miah, and S. Jannaty, “Precision healthcare: A deep dive into machine learning algorithms and feature selection strategies for accurate heart disease prediction,” Comput. Biol. Med., vol. 176, no. 1, pp. 108432, 2024. doi: 10.1016/j.compbiomed.2024.108432. [Google Scholar] [PubMed] [CrossRef]
Cite This Article
 Copyright © 2024 The Author(s). Published by Tech Science Press.
This work is licensed under a Creative Commons Attribution 4.0 International License , which permits unrestricted use, distribution, and reproduction in any medium, provided the original work is properly cited.
 Downloads
 Citation Tools