
 Submit a Paper
 Propose a Special lssue
 Open Access
ARTICLE

Rail-PillarNet: A 3D Detection Network for Railway Foreign Object Based on LiDAR
1 School of Electrical Engineering and Automation, Jiangxi University of Science and Technology, Ganzhou, 341000, China
2 Jiangxi Provincial Key Laboratory of Maglev Technology, Ganzhou, 341000, China
3 School of Information Engineering, Jiangxi University of Science and Technology, Ganzhou, 341000, China
* Corresponding Author: Jie Yang. Email:
Computers, Materials & Continua 2024, 80(3), 3819-3833. https://doi.org/10.32604/cmc.2024.054525
Received 30 May 2024; Accepted 01 August 2024; Issue published 12 September 2024
 View Full Text
 Download PDF
Abstract
Aiming at the limitations of the existing railway foreign object detection methods based on two-dimensional (2D) images, such as short detection distance, strong influence of environment and lack of distance information, we propose Rail-PillarNet, a three-dimensional (3D) LIDAR (Light Detection and Ranging) railway foreign object detection method based on the improvement of PointPillars. Firstly, the parallel attention pillar encoder (PAPE) is designed to fully extract the features of the pillars and alleviate the problem of local fine-grained information loss in PointPillars pillars encoder. Secondly, a fine backbone network is designed to improve the feature extraction capability of the network by combining the coding characteristics of LIDAR point cloud feature and residual structure. Finally, the initial weight parameters of the model were optimised by the transfer learning training method to further improve accuracy. The experimental results on the OSDaR23 dataset show that the average accuracy of Rail-PillarNet reaches 58.51%, which is higher than most mainstream models, and the number of parameters is 5.49 M. Compared with PointPillars, the accuracy of each target is improved by 10.94%, 3.53%, 16.96% and 19.90%, respectively, and the number of parameters only increases by 0.64 M, which achieves a balance between the number of parameters and accuracy.Keywords
With the rapid development of railway transport and railway network systems, the railway-driving environment has become increasingly complex. In the process of train travel, the foreign objects into the railway boundaries can cause serious traffic accidents, seriously threatening the safety of people’s lives and property, so there is an urgent need to conduct research on railway foreign object detection to ensure the safe operation of the train. However, the existing railway foreign object detection research is basically based on 2D images, and in the case of low light, bad weather, and long-distance small objects, the foreign object features in the image are not obvious, and there will be different degrees of omission and misdetection [1–3]. In addition, 2D images lack distance information, and accurate distance perception is important for improving the level of train automation [4,5]. Unlike optical cameras, LiDAR has the advantages of all-weather operation, wide application environment, and long detection distance, etc. Its 3D point cloud data contains the real size, shape, and distance information of the foreign object, which is more suitable for railway operation characteristics.
Currently, LiDAR-based railway obstacle detection is still mainly based on traditional point cloud filtering and clustering methods. Vatavu et al. [6] designed a grid map estimation method based on particle filtering, which can estimate the speed of the objects, but it is difficult to track the objects when they are occluded. Xie et al. [7] clustered foreign objects by rasterizing and using the eight-neighbour cell clustering method, but it is still difficult to distinguish between neighbouring objects.
In recent years, deep learning-based lidar point cloud 3D object detection methods have achieved great success in the field of automated vehicle driving. The 3D object detection methods can be classified into multi-view-based, voxels or pillars-based [8,9] and point-based [10,11]. Yuan et al. [12] proposed a car detection method, which maps the point cloud onto a 2D image from a bird’s eye view perspective but only achieves the detection of the car. Liu et al. [13] proposed a combined image and point cloud method for Bus Rapid Transit vehicle detection with good detection results. Wang et al. [14] fused cameras and LiDAR to detect targets on railway tracks, but the detection effect depends on the semantic segmentation results of 2D images. Wen et al. [15] used a semantic segmentation network based on Double Spiral Transformer module to achieve the detection of multiple types of obstacles under complex weather conditions by using an obstacle anomaly sensing cross-modal discrimination strategy. Neri et al. [16] produced a virtual railway environment to generate railway point cloud datasets and proposed a VoxelNet-based method for railway 3D object detection. Wisultschew et al. [17] designed a lightweight object detection and embedded detection platform, which realized the detection and tracking of car and pedestrian targets at railway level crossings.
The above methods are only for a single object, a single scene, or rely on the detection results of 2D images, which have certain limitations in terms of generality. In addition, some methods use the computationally heavy Transformer and VoxelNet structures. Recently, the first generic multi-sensor dataset for the railway domain, OSDaR23 [18], has been published by a research group led by German Centre for Rail Traffic Research. Recorded in Hamburg, Germany, the dataset contains data from various sensors, and provides fine-grained data labels that offer a new solution idea for detecting foreign objects in railways.
This paper adopts LiDAR data from the universal multi-sensor dataset OSDaR23 [18] for the study of railway foreign object detection, and proposes a deep learning-based LiDAR railway foreign object 3D detection network, Rail-PillarNet. The main contributions of this paper are as follows:
(1) Based on PointPillars, for the long-range small objects in the railway scenario, we propose Parallel Attention Pillar Encoding (PAPE), which reduces the loss of fine-grained information in the pillars.
(2) Combined the LIDAR point cloud encoding characteristics, the fusion of information at different scales is achieved by a finely designed 2D backbone network.
(3) The model performance is further improved by pre-training on a similar traffic scene dataset, KITTI [19], while using transfer learning for training.
The general structure of this paper as follows. Section 2 describes the general framework of PointPillars. Section 3 describes the structure of Rail-PillarNet. Section 4 conducts the experiments. Section 5 discusses the conclusion of the experimental results. Section 6 gives the conclusion.
PointPillars [9] represents the original point cloud as pillars while extracting the point cloud features using a pillar encoder. Next, the pillars are converted into a sparse pseudo image, feature extraction is performed using a 2D convolutional backbone network, and finally the detection results are output through the detection head as shown in Fig. 1. PointPillars [9] greatly reduces the amount of data to be processed by converting the 3D point cloud into a 2D pseudo image, and detects the object on the pseudo image using the 2D object detection algorithm, avoiding the use of computationally expensive 3D convolutions, making the algorithm lightweight and easy to use.
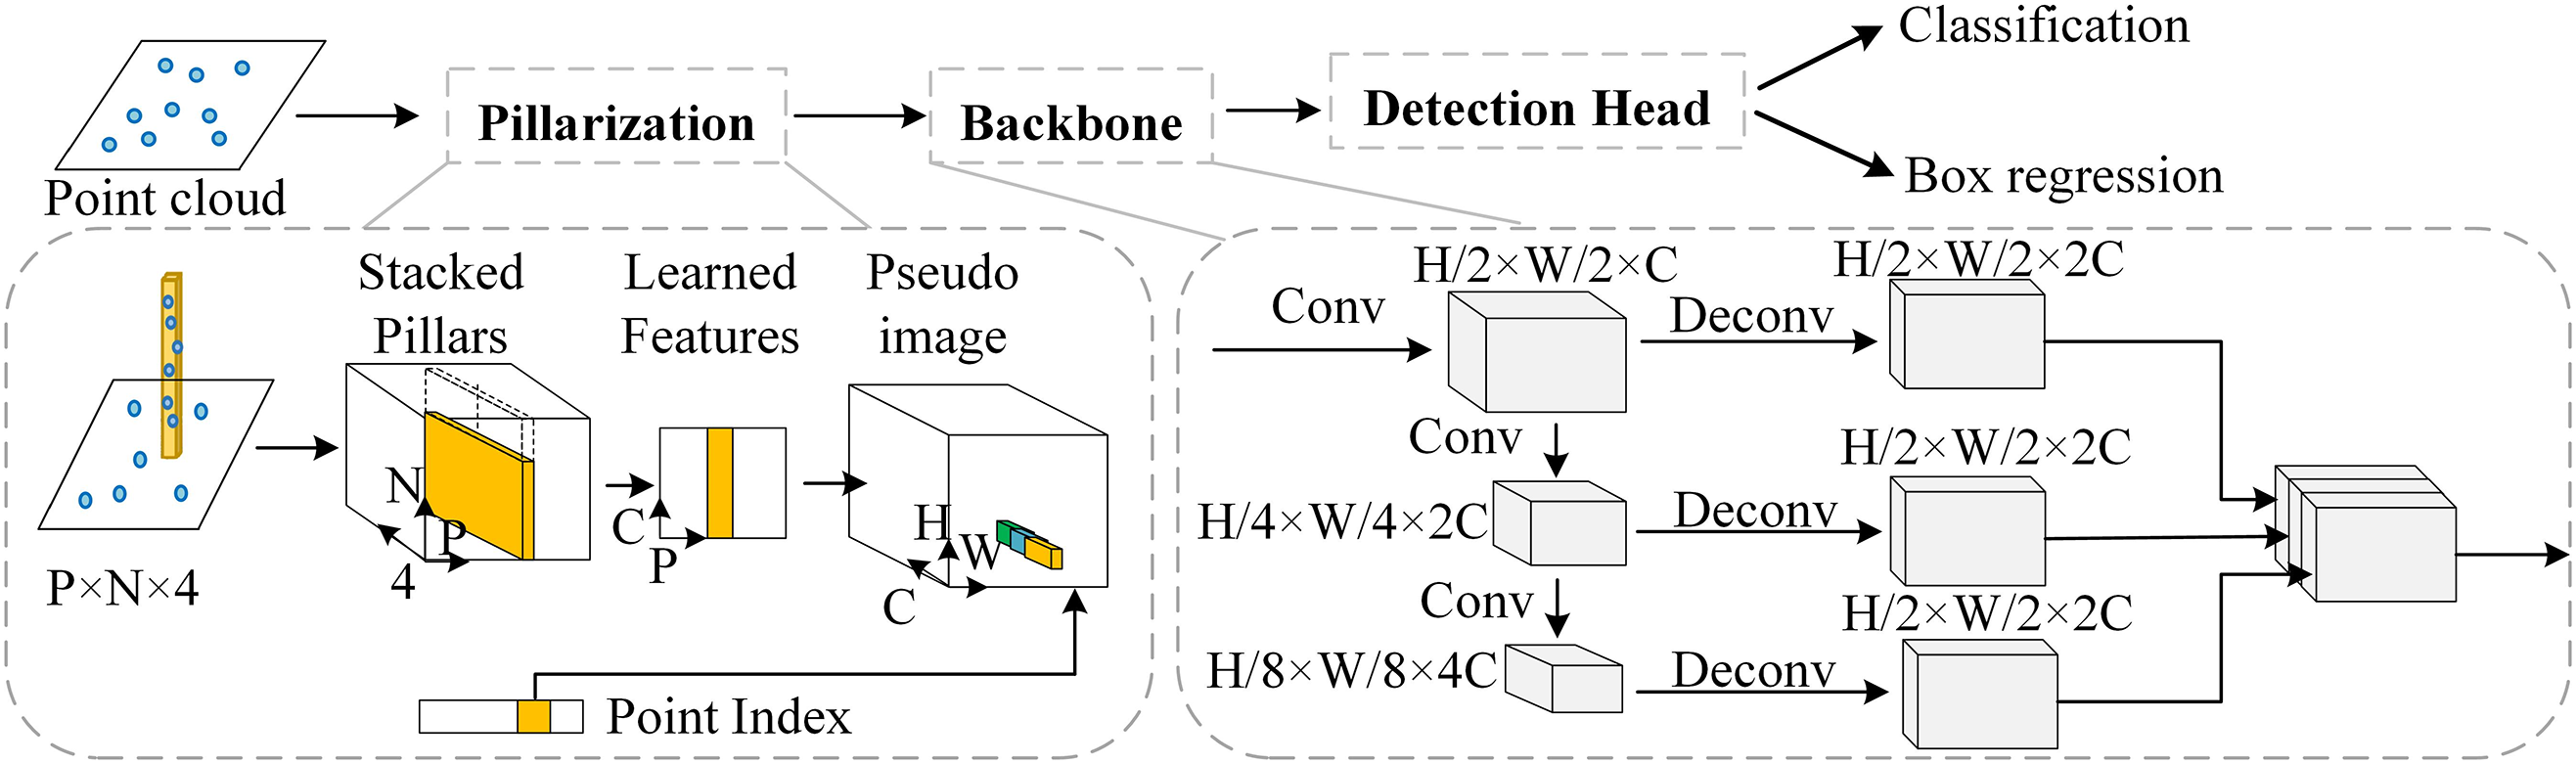
Figure 1: PointPillars network structure
PointPillars [9] uses a simplified PointNet [20] in the pillars encoder to aggregate features in each pillars. However, this results in the loss of local fine-grained information, which is critical for 3D detection (small object at long distances) [21]. In addition, the backbone network of PointPillars uses a 2D convolutional network with the structure of Vgg [22,23] for feature extraction, which ignores the exchange of local features and input-output information, and feature extraction is insufficient [24,25].
This paper proposes Rail-PillarNet to address the above issues. Rail-PillarNet takes the LIDAR point cloud as input and first processes the point cloud by pillar division, then extracts the pillars features by Parallel Attention Pillar Encoding (PAPE), reduces the loss of local information, and obtains finer pillars features, which are then converted into 2D pseudo image. The extraction and fusion of features at different scales is achieved by a finely designed 2D backbone. Finally, object classification and box regression are performed using the detection head to generate prediction results as shown in Fig. 2.
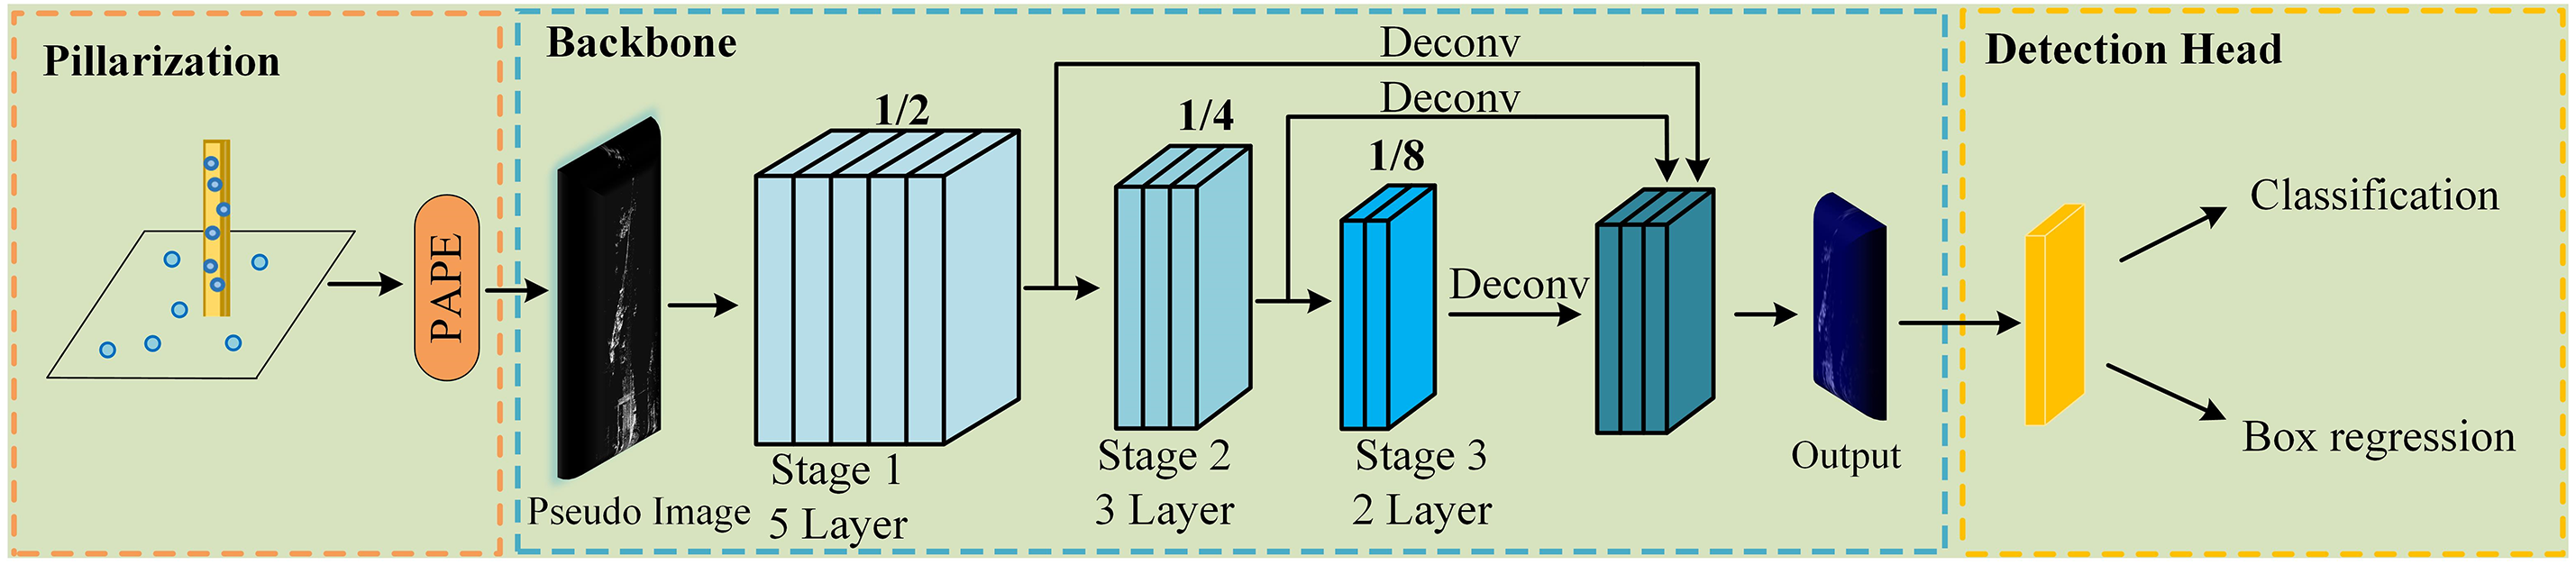
Figure 2: Rail-PillarNet network structure
3.1 Parallel Attention Pillar Encoding (PAPE)
PointPillars [9] simply uses fully connected and max pooling to extract pillars features, which leads to the loss of fine-grained information in the pillars, and is prone to problems such as omission and misdetection of long-distance small objects in railway scenes. To improve the model’s ability to detect small objects at long distances, the Parallel Attention Pillar Encoding (PAPE) module is embedded in the point cloud pillar encoding to mitigate the problem of fine-grained information loss in the point cloud encoding. As shown in Fig. 3, the PAPE module mainly consists of three units: (1) point-coding, (2) point-attention coding, (3) channel-attention coding.
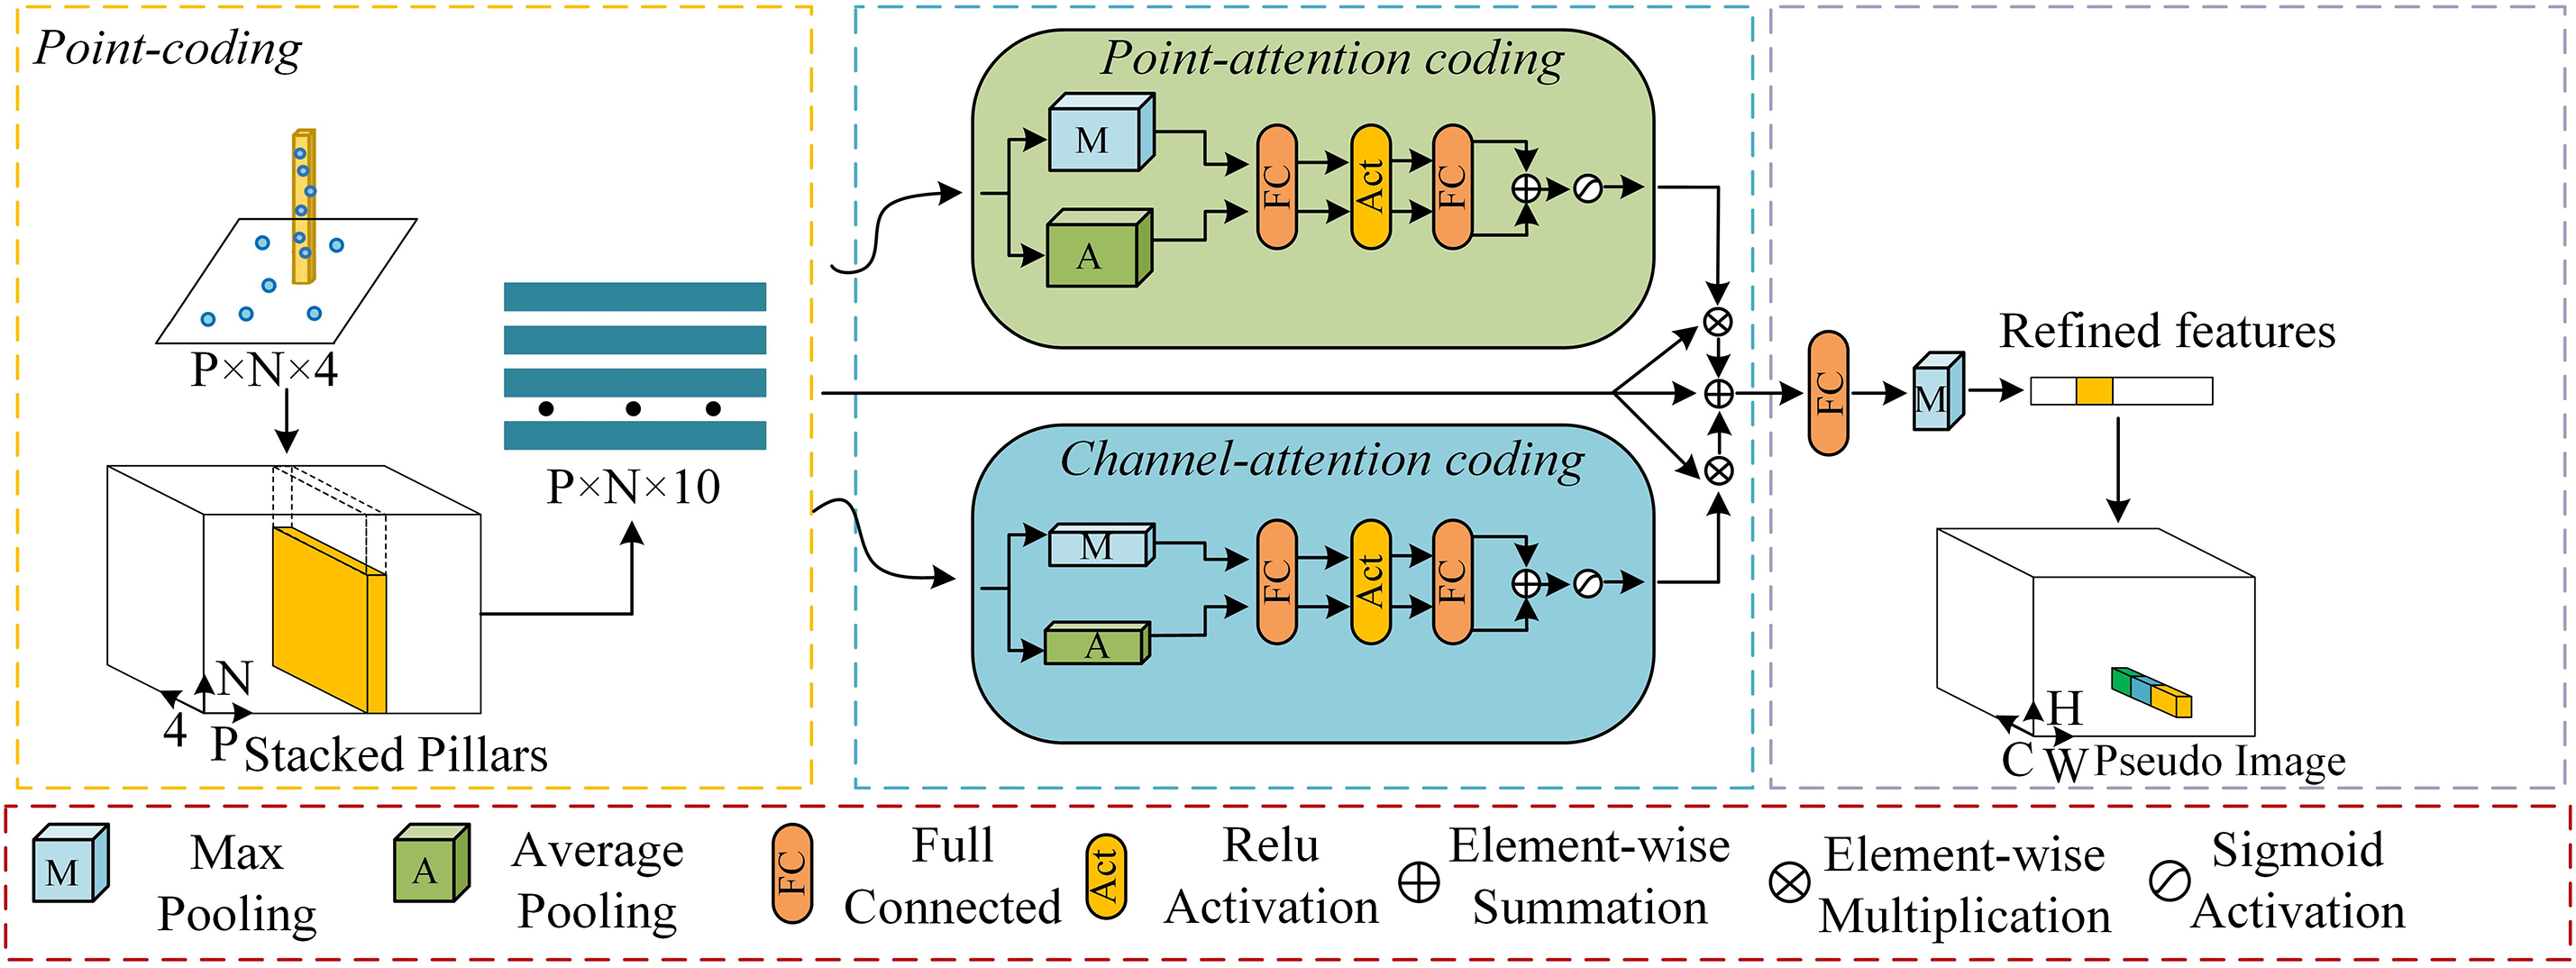
Figure 3: Parallel attention pillar encoding
Assuming that the point cloud extends L, W and H along the X, Y and Z-axes in 3D space, the point cloud is uniformly divided into specific pillars of size l, w and H. As with PointPillars, only the point cloud in the X-Y plane is divided into pillars. Let P = {pi = [xi, yi, zi, ri] ∈ RNv × 4]}, where P is a non-empty pillars consisting of N points, pi is the i-th point in the pillars, and each pi has feature dimension D = 4, i ∈ {1,...,Nv}, and Nv is the number of points in pillars v.
During the point encoding process, the points in each pillar is expanded as pi = {[xi, yi, zi, ri, xci, yci, zci, xpi, ypi, zpi] ∈ RNv × 10], where [xi, yi, zi, ri] are the coordinates and reflectance intensities of each point in the pillars, [xci, yci, zci,] are the offset of each point from the mean of all point clouds in that pillars, and [xpi, ypi, zpi] are the offset of each point from the centre of the coordinates of that pillars.
After obtaining the augmented non-empty pillars Pk, in order to capture the features in the pointwise dimension within the pillars, we use the point-attention coding to aggregate the pointwise features of the input pillars, as shown in Fig. 3. First, two different kinds of pointwise information are generated in the pointwise dimension using the max pooling and average pooling: Fpmean ∈ RP × N × 1 and Fpmax ∈ RP × N × 1. Second, the two kinds of information are fed into a shared network consisting of a fully connected layer and a nonlinear activation function. Finally, the two types of information are summed and normalised weights are generated by the sigmoid activation function to describe the importance of each point within the pillars. The formulas are as follows:
where Ap ∈ RP × N × 1 is the attention score of each point,
3.1.3 Channel-Attention Coding
To capture the channel characteristics of the augmented pillars more comprehensively. Similarly, we extract features in the channel direction using max pooling and average pooling. Then, the importance of each feature channel is computed using the fully connected layer and the activation function. The corresponding equations are as follows:
where Ac ∈ RP × 1 × C is the attention score of each channel,
The parallel mechanism is used to combine point-attention coding and channel-attention coding to form a parallel attention pillars encoder. By multiplying the point attention Ap and the channel attention Ac with the original pillars P, respectively, the attention-weighted features of the pillars in the channel direction and in the point direction can be obtained. The output features are obtained by adding both with the original pillars P. Finally, the output is processed by fully connected layers and max pooling to obtain refined pillars features. The definition is as follows:
where Ap ∈ RP × N × 1 is the attention score per point, Ac ∈ RP × 1 × C is the attention score per channel, P is the original pillars feature, w is the weight parameter of the fully connected layer.
The Vgg [22] structure of the backbone network is used in PointPillars, which ignores the exchange of local features and input-output information. In this paper, the residual structure block [23] is used instead of the ordinary convolution block to improve the feature extraction capability of the backbone network. In addition, unlike RGB images, features such as spatial distances and shapes of objects are explicitly encoded in the LIDAR point cloud, which does not require too much computational resources for later geometric modelling [25,26]. By adjusting the number of iterations in each stage of the backbone networks, more computations are allocated to the early stage to better integrate the geometric information contained in the point cloud.
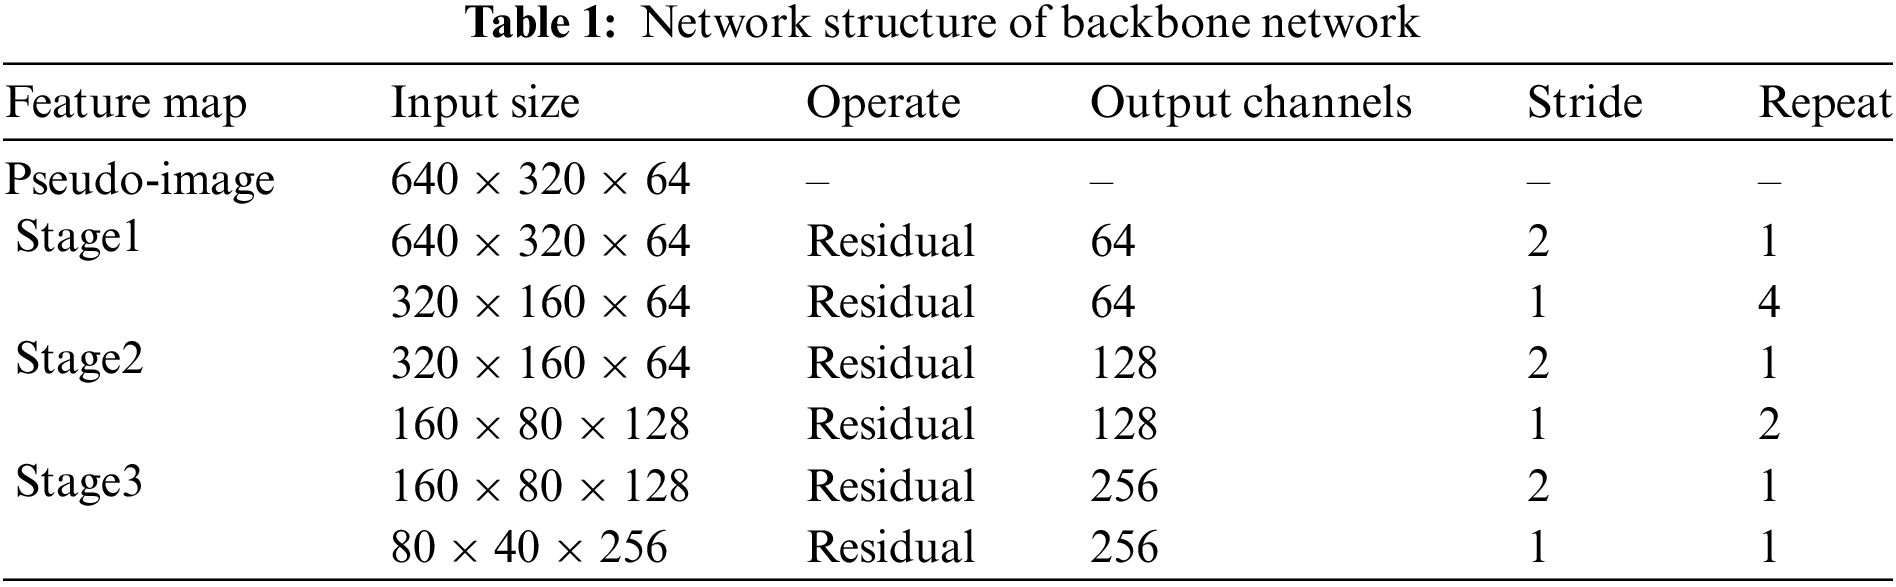
The structure of backbone network is shown in Fig. 4. For the feature extraction module with stride of 1, two 3 × 3 convolutions are used to extract features, while the skip connection fuses the inputs and outputs of the modul. For the feature extraction module with stride of 2, a two-branch structure is used. In the main branch, a 3 × 3 convolution with stride of 2 is used for feature extraction and downsampling, followed by information fusion via another 3 × 3 convolution. In the other branch, feature mapping is performed on the input using a 1 × 1 convolution with stride of 2. In addition, the outputs of both branches are fused. Finally, the pseudo-image is downsampled using the backbone network to obtain feature maps of different sizes, and the downsampled multiple feature maps are upsampled to the same size for stitching to generate the final feature map.
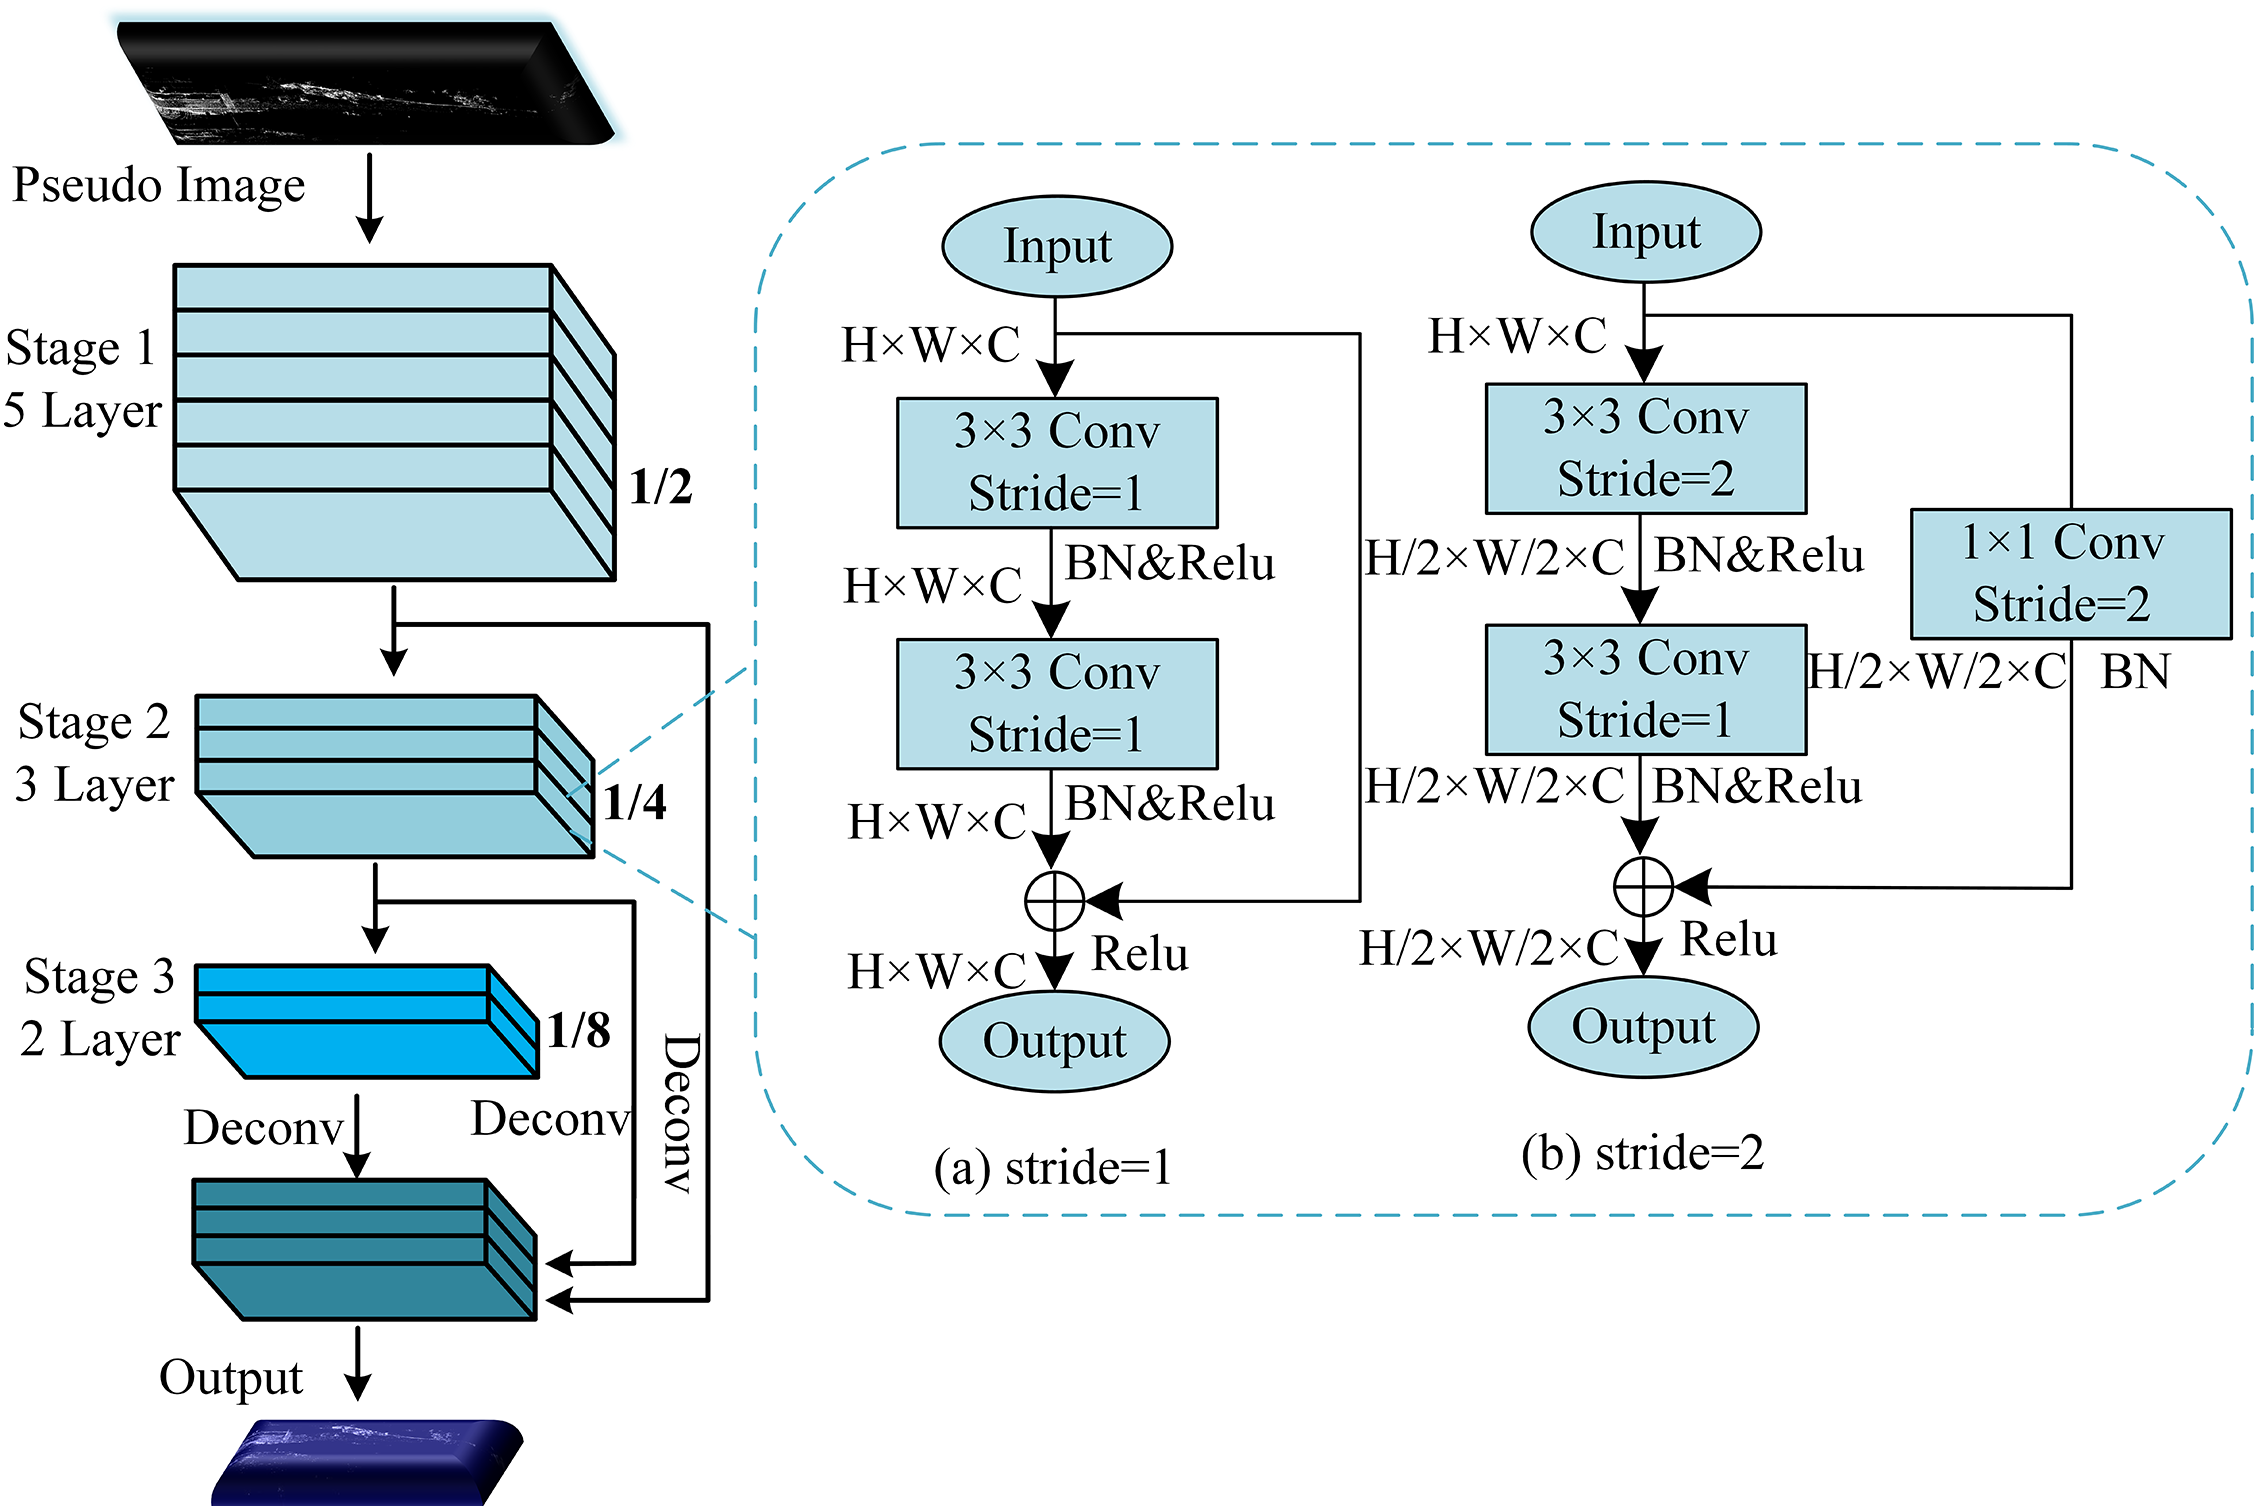
Figure 4: Backbone network structure
Table 1 shows the proposed backbone network structure. The size of the pseudo-image is assumed to be 640 × 320 × 64. In the table, Stage is the three stages of feature extraction, Residual is the residual block, Stride is the size of the step in the operation, Repeat is the number of repetitions.
3.3 Detection Head and Loss Function
In this paper, 3D object detection is performed by the single shot multibox detector (SSD) detection head [27], which uses 3D intersection over union (IoU) to match the anchors boxes with the ground-truth boxes. The network detection head finally outputs a 3D prediction frame with seven parameters, denoted as (x, y, z, w, l, h, θ), where x, y and z are the centroids of the prediction boxes, w, l and h are the width, length, and height of the prediction boxes, and θ is the angle of the orientation of the prediction boxes. The ground-truth boxes are defined as (xgt, ygt, zgt, wgt, lgt, hgt, θgt). The position errors between the ground-truth boxes and the prediction boxes are (∆x, ∆y, ∆z, ∆w, ∆l, ∆h, ∆θ):
where the subscript gt denotes the parameters of the ground-truth boxes, using the SmoothL1 loss as the 3D prediction boxes localisation loss:
Using Focus Loss to alleviate the problem of inefficient training and difficulty in model convergence, the object classification loss can be expressed as:
where pt is the category probability of the object in the anchor boxes,
In addition, the cross-entropy function is used to perform directional regression on the anchor boxes. Then the total loss function is defined as:
where β1, β2 and β3 are the weighting parameters for the different loss components, set to 2.0, 1.0 and 0.2, respectively.
Transfer learning uses the knowledge already learned in one domain and applies it to another related but different domain, thus avoiding the need to learn the model from scratch and providing the model with better initialised weight parameters. Rail-PillarNet is pre-trained on the KITTI dataset [19], which contains a rich variety of traffic scene objects (e.g., cars and pedestrians, etc.) in different environments such as city streets and highways. By pre-training on the KITTI dataset, the model can learn rich scene features and objects behaviours to better adapt to similar traffic scene objects in railway scenarios. The specific steps are as follows: following the training strategy of PointPillars, Rail-PillarNet is pre-trained on the KITTI dataset and the weights file is saved. Next, when training on the OSDaR23 [18] dataset, the originally saved pre-training weights are loaded and the mismatched operational layers are skipped.
4 Experimental Datasets and Environment
In this paper, we use the LiDAR dataset from OSDaR23 [18], released by German Centre for Rail Traffic Research in 2023, for model training. As shown in Fig. 5a, the acquisition equipment for the dataset consists of multiple calibrated and synchronised cameras, sensors such as LiDAR and millimetre-wave radar. The dataset includes 45 sequences totalling 1534 frames of data, and contains 20 categories of moving and static objects such as passengers, workers, vehicles, trains and buffer stop, as shown in Fig. 5b. However, the number of samples for some of the categories in the dataset is extremely limited. Therefore, in this paper, four common and more numerous target categories: pedestrians, vehicles, trains and buffer stop are selected, and the original point cloud is filtered and sifted, resulting in a total of 1356 frames of LIDAR point cloud, divided into 1084 frames of the training set and 272 frames of the validation set with a ratio of 8:2.
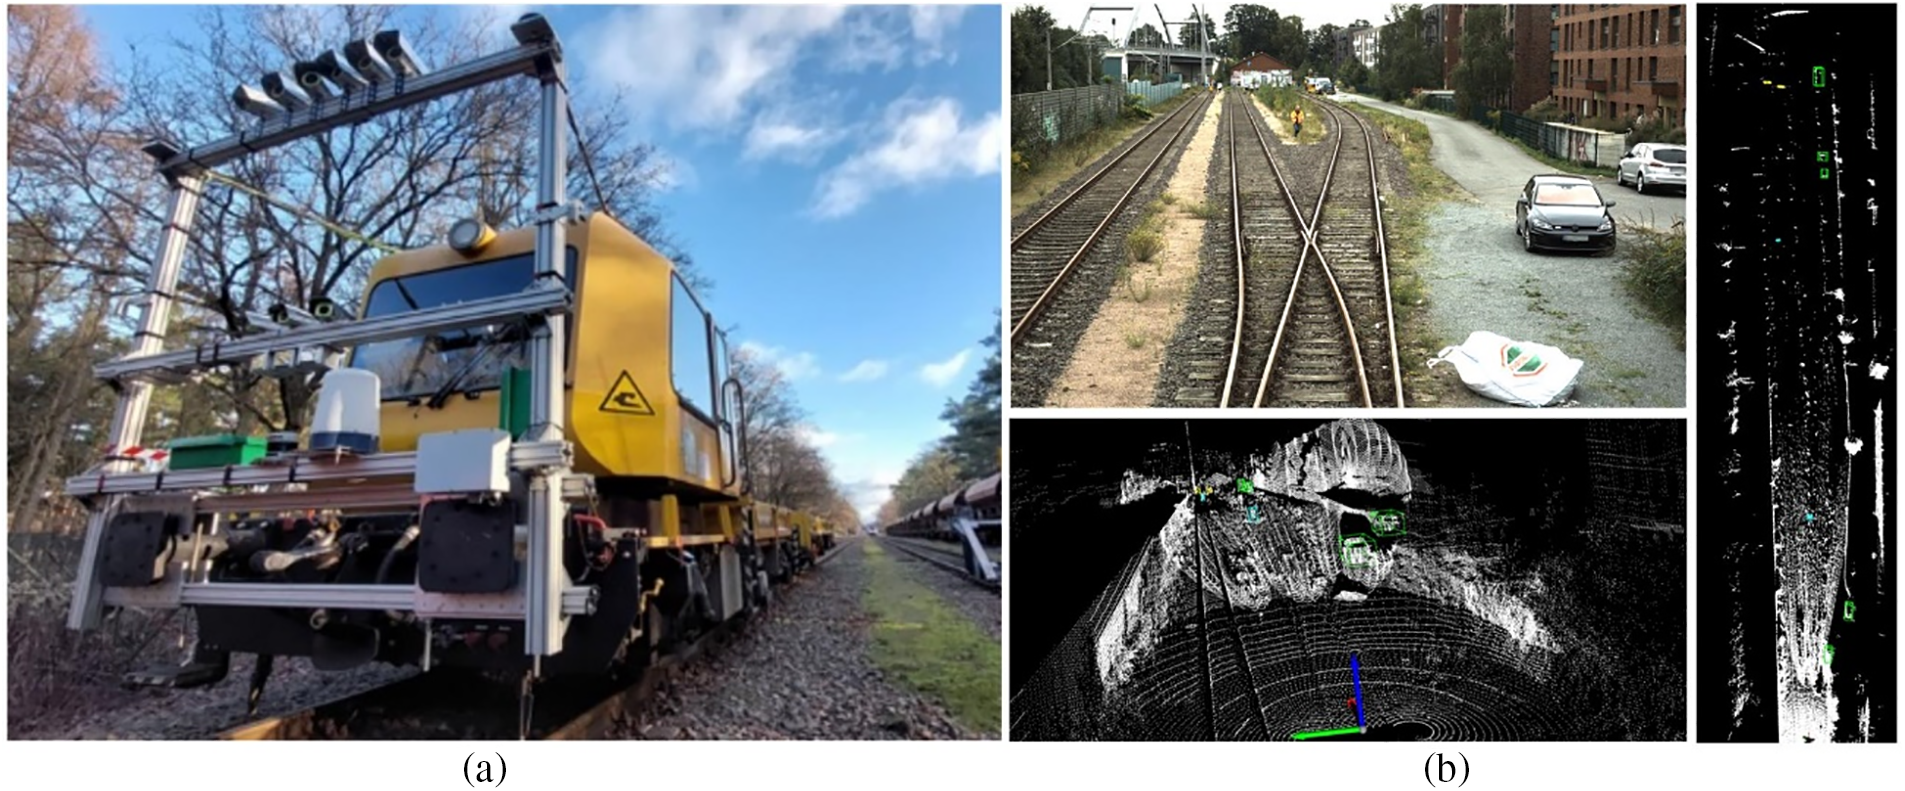
Figure 5: OSDaR23 acquisition equipment and part of the data. (a) Dataset acquisition equipment, (b) Example of dataset
4.2 Experimental Environment and Setup
The experiments were conducted using the OpenPCDet object detection framework, the operating system was Centos 7, and the network was trained using the Nvidia TITAN RTX GPU (24G) platform with a batch size of 2. Training was performed using the Adam optimiser with an learning rate of 0.03, a weight decay value of 0.01, and a momentum value of 0.9. The X-Y-Z dimensions of each voxel are set to [0.16, 0.16, 12] m. The maximum number of pillar is 16,000, and each pillar contains 32 points.
In addition, due to the very long probing distance of the LIDAR in the dataset, the detection range of the setup point cloud is limited to [−30, 354] m along the X-axis, [−25, 39] m along the Y-axis and [−4, 8] m along the Z-axis, and the points beyond this range are excluded from consideration. The anchor boxes dimensions for vehicles, pedestrians, buffer stop and trains were set to the average dimensions of the corresponding ground-truth boxes, the length, width and height ([l, w, h]) were [4.29, 3.06, 2.78] m, [0.88, 0.85, 1.89] m, [1.78, 2.85, 2.50] m and [62.95, 3.99, 4.28] m, respectively.
5 Experimental Results and Analysis
We perform ablation experiments on OSDaR23 to validate the contribution of each module in Rail-PillarNet to model performance improvement. In the ablation experiments, the accuracy of the model based on 40 recall thresholds under the IoU of 0.5 is mainly used as the evaluation indicator, and the ablation experiments include PAPE, fine-designed backbone network and transfer learning. Table 2 shows the experimental results.
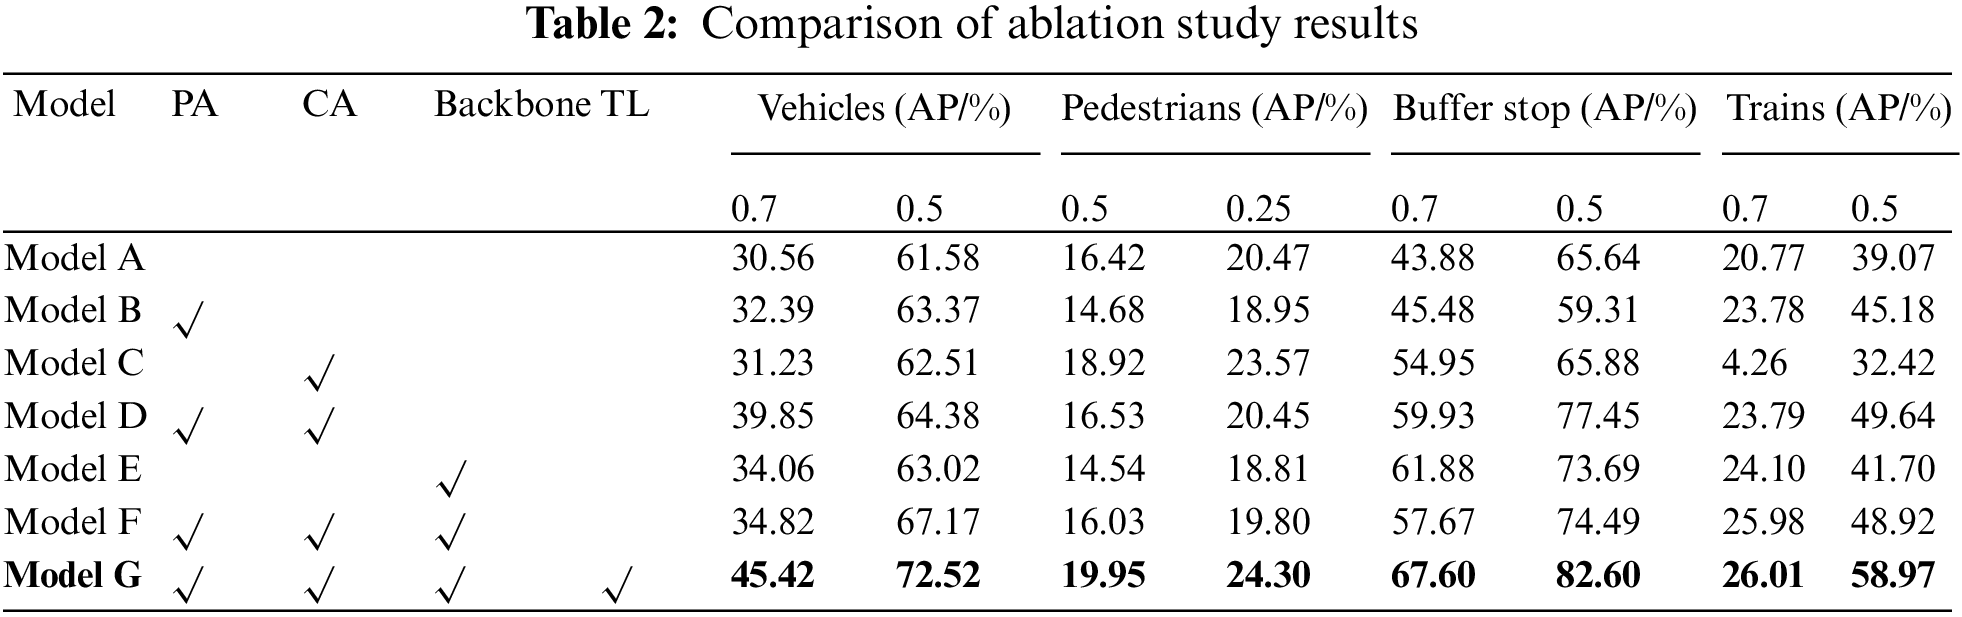
Using PointPillars as a baseline (Model A), point-attention (PA) and channel-attention (CA) are first individually integrated into the baseline model to form Model B and Model C. Model B has improved accuracy by 1.79% and 6.11% for the vehicle and train categories, respectively, i.e., the point-attention module is more effective for objects with larger dimensions and is better able to aggregate features in the point dimension of large objects. There is a small improvement in accuracy for small objects using the channel-attention. However, a more significant improvement was obtained by fusing the two.
In addition, the proposed backbone network takes into account the explicit encoding of the object in the point cloud and at the same time improves the feature extraction capability of the network through the residual structure, which increases the detection accuracy. The accuracy of vehicles, buffer stop and trains in the experiment improved by 1.44%, 8.05% and 2.63%, respectively. Finally, the effectiveness of the transfer learning (TL) training method is further analysed and the model obtains better initial weight parameters based on the results of the experiments and is able to adapt better to traffic scene targets similar to those in the KITTI dataset. Compared to Model F without transfer learning, its accuracies for vehicles and pedestrians are improved by 5.35% and 4.50%, respectively, and the detection accuracies for the remaining objects are also improved.
Rail-PillarNet is compared with common 3D object detection algorithms to verify its effectiveness. The comparison algorithms include SECOND [8], PointPillars [9], PartA2 [10], PV-RCNN [11], PillarNet [24], Voxel RCNN [26], and Centerpoint [28].
Table 3 shows the experimental results, where P is the number of model parameter values. Rail-PillarNet achieves satisfactory performance, where the average accuracy (mAP@0.5) reaches 58.51%, and the accuracies for each objective are 72.52%, 24.30%, 82.60% and 58.97%, respectively. Compared to PointPillars, the proposed method achieves an improvement of 12.83% in the average accuracy and about 10.94%, 3.53%, 16.96% and 19.90% for each category. SECOND consists of the 3D convolution, which achieves an average accuracy of 58.91%. This is attributed to the power of 3D convolution, but the high amount of 3D convolutional computation has a negative impact on the real-time performance of the model. However, Rail-PillarNet is able to achieve a significant increase in detection performance with a small increase in the number of parameters.
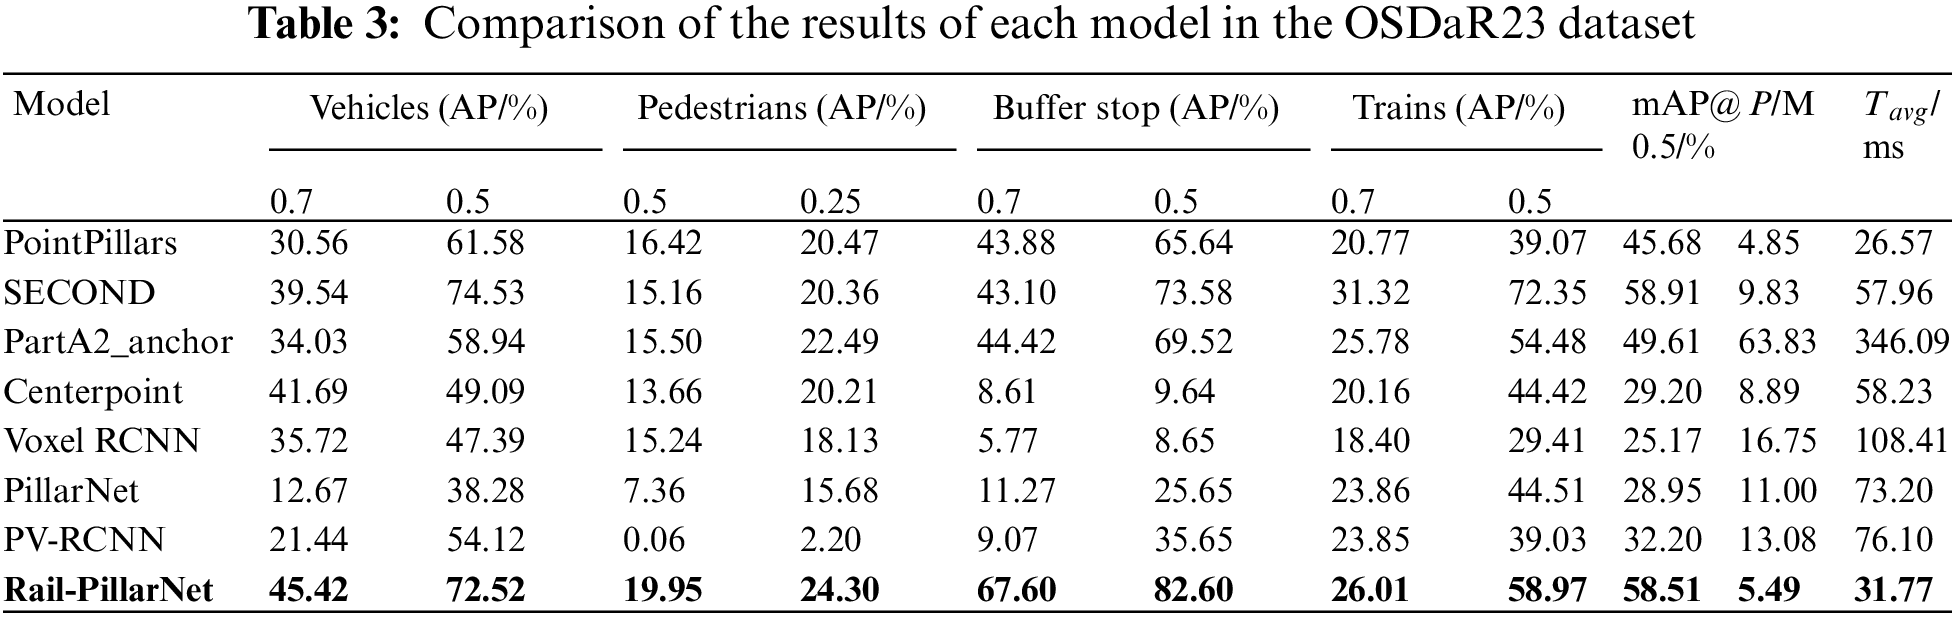
In addition, the proposed method is tested using a single TITAN RTX GPU (24 G) with an input point cloud size of 189,069 × 4, where 189,069 is the total number of points in the point cloud and 4 is the feature carried by each point (real world coordinates and reflectivity). In the Table 3, Tavg is the average inference time in milliseconds (ms) for 500 repetitions. The inference time of the proposed method on TITAN RTX GPU is 31.77 ms, which is ahead of the SECOND model with the best accuracy and also significantly ahead of other models (PartA2, Centerpoint, PV-RCNN, etc.). In conclusion, the proposed method has satisfactory effect accuracy and real-time performance.
Qualitative experiments are conducted to further evaluate Rail-PillarNet. As shown in Fig. 6, the detection results of Rail-PillarNet under different scenes [29] in the validation set are shown. The upper left part of the figure shows the corresponding camera image under the scene, the lower left part shows the 3D object detection results, and the right part shows the detection results under the bird’s eye view, where the ground-truth box is green and the predicted box is red. As shown in Fig. 6a, for the scene with sparse objects and small objects at a long distance, this paper’s algorithm is able to detect most of the objects, but for some small objects at a long distance, this paper’s method also has some leakage detection. As shown in Fig. 6b, for the scene with denser objects and close distance, this paper’s method has better detection results. However, due to the near point cloud is too dense, resulting in other objects similar to the target, also produces a certain amount of misdetection.
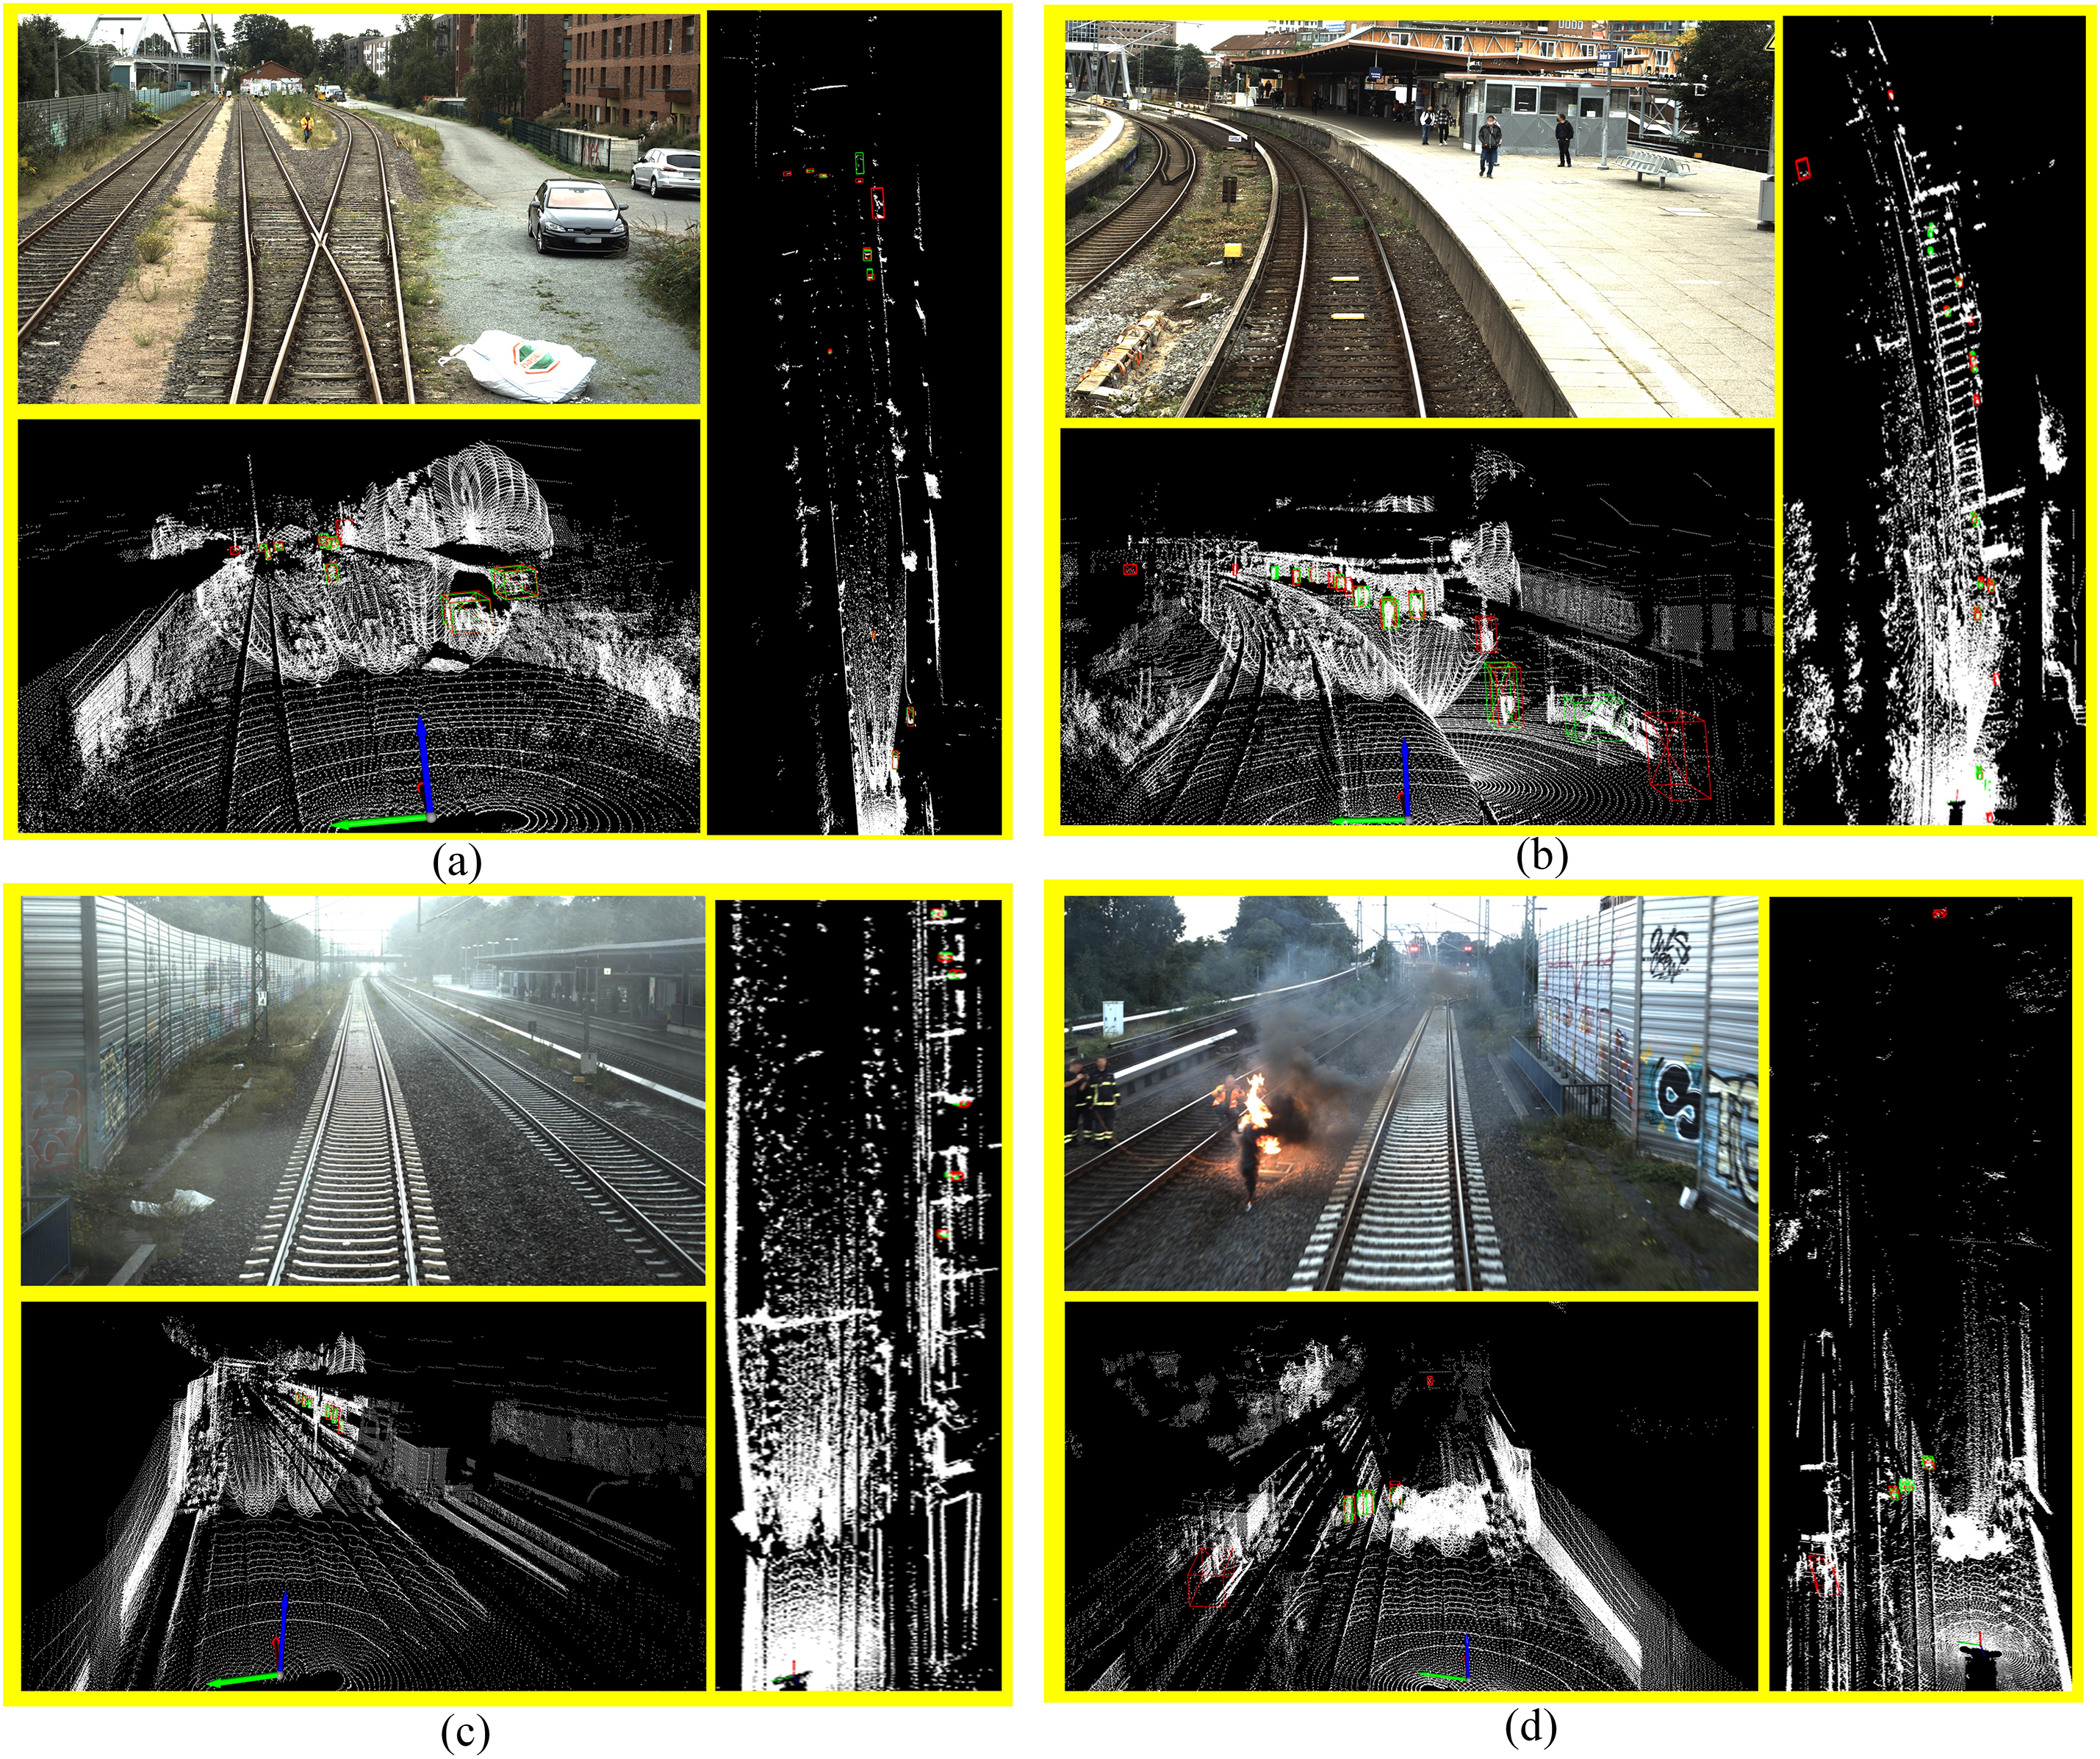
Figure 6: Visual inspection results of Rail-PillarNet in different scenarios. (a) Long distance scene, (b) Close distance scene, (c) Foggy weather scene, (d) Thick smoke scene
In addition, we perform robustness tests in different weather lighting conditions. As shown in Fig. 6c, under foggy weather conditions, the proposed method is able to better detect pedestrians located on the platform. As shown in Fig. 6d, Rail-PillarNet is also able to detect foreign objects under the condition of thick smoke obscuration. In conclusion, Rail-PillarNet achieves satisfactory results under different lighting conditions.
The detection results of Rail-PillarNet are compared with the PointPillars in different scenarios. As shown in Fig. 7, where the first column is the corresponding camera image in the scene, the second column is the 3D object detection result of the PointPillars algorithm, and the third column is the 3D object detection effect of Rail-PillarNet, where the ground-truth box is green and the predicted box is red. From the first and second rows of the figure, it can be seen that the PointPillars algorithm has more misdetections in the sparse object and small object far away scenarios, as shown in the dashed red box in the figure. Compared to PointPillars, Rail-PillarNet reduces the false alarm rate in the long range scenarios. From the third and fourth rows of the figure, it can be seen that the PointPillars algorithm has a certain amount of leakage and misdetection in the scenes with denser objects and close distances, as shown in the dashed red box in the figure, Rail-PillarNet reduces the false and missed detections in the close range scenario.
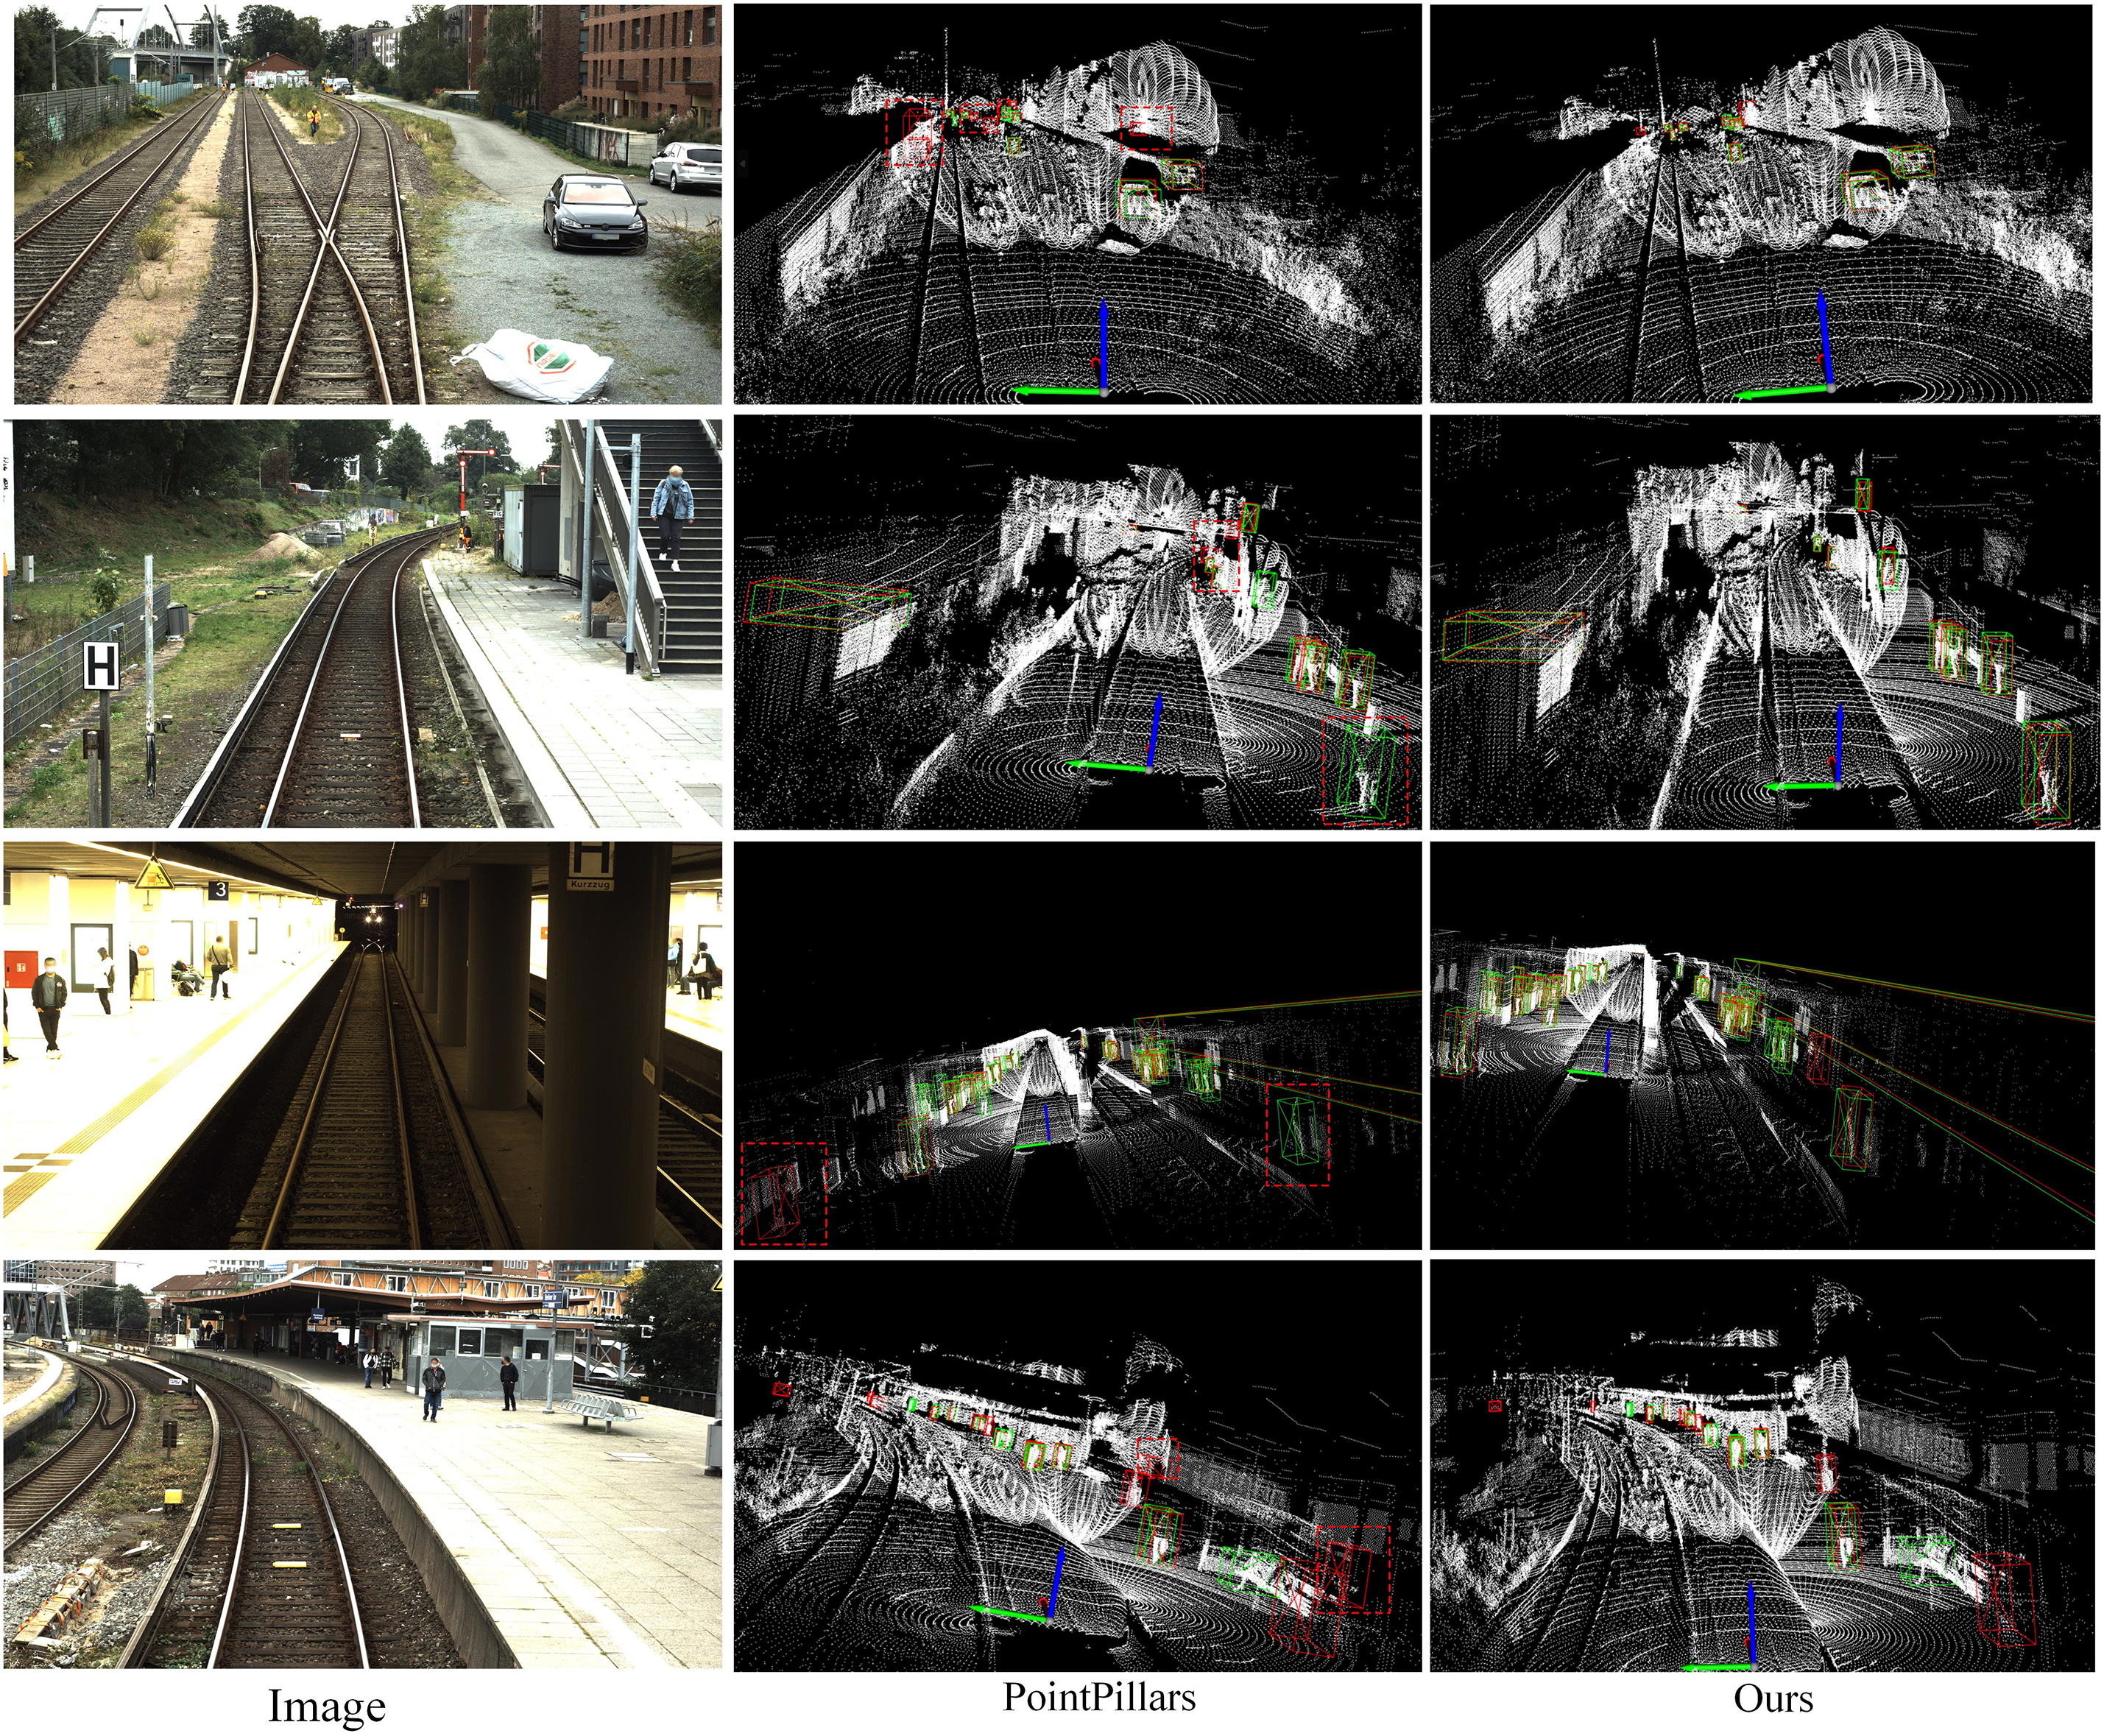
Figure 7: Comparison of visual inspection results between Rail-PillarNet and PointPillars
In this paper, a LiDAR railway object detection method, Rail-PillarNet, is proposed. Firstly, the PAPE is proposed to mitigate the loss of fine-grained information during the PointPillars point cloud encoding, obtain finer pillar features, and effectively improve detection accuracy. Secondly, a fine backbone network is designed by combining the LIDAR point cloud coding characteristics and the residual structure, and effectively improves the feature extraction capability of the network. Finally, the initialisation weight parameters of the model are optimized using the transfer learning training method, which further improves the detection accuracy.
In summary, the experimental results on the OsDar23 dataset demonstrate the effectiveness of the above method. the algorithm compared with PointPillars accuracy increased by 12.83%, and the number of parameters increased by only 0.64 M. In addition, the proposed method also achieved a satisfactory performance compared to other mainstream 3D object detection models.
However, the methodology in this paper focuses on exploring a perceptual approach, which has limitations in terms of decision-making for trains. Future work will consider the detection of track regions based on a priori knowledge to delineate the intrusion limit regions. Next, the detection results of potential foreign objects are combined to determine their location in the real world. Finally, based on the location of the potential foreign object and the delineated intrusion limit regions, it is determined whether an intrusion has occurred. The foreign object intrusion information is sent to the control room for train control commands.
Acknowledgement: Thanks are extended to the editors and reviewers.
Funding Statement: This work was supported by a grant from the National Key Research and Development Project (2023YFB4302100), Key Research and Development Project of Jiangxi Province (No. 20232ACE01011) and Independent Deployment Project of Ganjiang Innovation Research Institute, Chinese Academy of Sciences (E255J001).
Author Contributions: Conceptualization: Fan Li and Jie Yang; Data curation: Zhichao Chen and Zhicheng Feng; Investigation, Fan Li and Shuyao Zhang; Methodology, Fan Li and and Shuyao Zhang; Writing original draft, Fan Li and Jie Yang; Writing—review: Zhichao Chen and Zhicheng Feng. All authors reviewed the results and approved the final version of the manuscript.
Availability of Data and Materials: The experiments were performed on OSDaR23 and KITTI datasets. Here are the links to the OSDaR23 and KITTI datasets, respectively. data.fid-move.de/dataset/ osdar23 (accessed on 1 April 2024). http://www.cvlibs.net/datasets/kitti (accessed on 1 April 2024).
Ethics Approval: Not applicable.
Conflicts of Interest: The authors declare they have no conflicts of interest to report regarding the present study.
References
1. T. Ye, J. Zhang, Z. Zhao, and F. Zhou, “Foreign body detection in rail transit based on a multi-mode feature enhanced convolutional neural network,” IEEE Trans. Intell. Transp. Syst., vol. 23, no. 10, pp. 18051–18063, 2022. doi: 10.1109/TITS.2022.3154751. [Google Scholar] [CrossRef]
2. Z. Chen, J. Yang, L. Chen, Z. Feng, and L. Jia, “Efficient railway track region segmentation algorithm based on lightweight neural network and cross-fusion decoder,” Autom. Constr., vol. 155, 2023, Art. no. 105069. doi: 10.1016/j.autcon.2023.105069. [Google Scholar] [CrossRef]
3. Z. Chen, J. Yang, Z. Feng, and H. Zhu, “RailFOD23: A dataset for foreign object detection on railroad transmission lines,” Sci. Data, vol. 11, no. 1, 2024, Art. no. 72. doi: 10.1038/s41597-024-02918-9. [Google Scholar] [PubMed] [CrossRef]
4. Z. Feng, J. Yang, Z. Chen, and Z. Kang, “LRseg: An efficient railway region extraction method based on lightweight encoder and self-correcting decoder,” Expert. Syst. Appl., vol. 238, 2024, Art. no. 122386. doi: 10.1016/j.eswa.2023.122386. [Google Scholar] [CrossRef]
5. A. Wang, B. Guo, H. Du, and H. Bao, “Impact of automation at different cognitive stages on high-speed train driving performance,” IEEE Trans. Intell. Transp. Syst., vol. 23, no. 12, pp. 24599–24608, 2022. doi: 10.1109/TITS.2022.3211709. [Google Scholar] [CrossRef]
6. A. Vatavu et al., “From particles to self-localizing tracklets: A multilayer particle filter-based estimation for dynamic grid maps,” IEEE Intell. Transp. Syst. Mag., vol. 12, no. 4, pp. 149–168, 2020. doi: 10.1109/MITS.2020.3014428. [Google Scholar] [CrossRef]
7. D. Xie, Y. Xu, and R. Wang, “Obstacle detection and tracking method for autonomous vehicle based on three dimensional lidar,” Int. J. Adv. Robot. Syst., vol. 16, no. 2, 2019. doi: 10.1177/1729881419831587. [Google Scholar] [CrossRef]
8. Y. Yan, Y. Mao, and B. Li, “SECOND: Sparsely embedded convolutional detection,” Sensors, vol. 18, no. 10, 2018, Art. no. 3337. doi: 10.3390/s18103337. [Google Scholar] [PubMed] [CrossRef]
9. A. H. Lang, S. Vora, H. Caesar, L. Zhou, J. Yang and O. Beijbom, “PointPillars: Fast encoders for object detection from point clouds,” in 2019 IEEE/CVF Conf. Comput. Vis. Pattern Recognit. (CVPR), Long Beach, CA, USA, 2019, pp. 12689–12697. doi: 10.1109/CVPR.2019.01298. [Google Scholar] [CrossRef]
10. S. Shi, Z. Wang, J. Shi, X. Wang, and H. Li, “From points to parts: 3D object detection from point cloud with part aware and part-aggregation network,” 2020, arXiv:1907.03670. [Google Scholar]
11. S. Shi et al., “PV-RCNN: Point-voxel feature set abstraction for 3D object detection,” in 2020 IEEE/CVF Conf. Comput. Vis. Pattern Recognit. (CVPR), Seattle, WA, USA, 2020, pp. 10526–10535. doi: 10.1109/CVPR42600.2020.01054. [Google Scholar] [CrossRef]
12. M. Yuan, W. Wang, Q. Liu, Z. Yu, and X. Liu, “A rail detection method using bird’s eye view of LiDAR point clouds,” in 2023 6th Int. Conf. Electron. Technol. (ICET), Chengdu, China, 2023, pp. 120–126. doi: 10.1109/ICET58434.2023.10211715. [Google Scholar] [CrossRef]
13. S. Liu, C. Li, T. Yuwen, Z. Wan, and Y. Luo, “A lightweight lidar-camera sensing method of obstacles detection and classification for autonomous rail rapid transit,” IEEE Trans. Intell. Transp. Syst., vol. 23, no. 12, pp. 23043–23058, 2022. doi: 10.1109/TITS.2022.3194553. [Google Scholar] [CrossRef]
14. Z. Wang, G. Yu, X. Wu, H. Li, and D. Li, “A camera and lidar data fusion method for railway object detection,” IEEE Sens. J., vol. 21, no. 12, pp. 13442–13454, 2021. doi: 10.1109/JSEN.2021.3066714. [Google Scholar] [CrossRef]
15. L. Wen, Y. Peng, M. Lin, N. Gan, and R. Tan, “Multi-modal contrastive learning for lidar point cloud rail-obstacle detection in complex weather,” Electronics, vol. 13, no. 1, 2024, Art. no. 220. doi: 10.3390/electronics13010220. [Google Scholar] [CrossRef]
16. M. Neri and F. Battisti, “3D object detection on synthetic point clouds for railway applications,” in 2022 10th Eur. Workshop Vis. Inform. Process. (EUVIP), IEEE, 2022, pp. 1–6. doi: 10.1109/EUVIP53989.2022.9922901. [Google Scholar] [CrossRef]
17. C. Wisultschew, G. Mujica, J. M. Lanza-Gutierrez, and J. Portilla, “3D-lidar based object detection and tracking on the edge of IoT for railway level crossing,” IEEE Access, vol. 9, pp. 35718–35729, 2021. doi: 10.1109/ACCESS.2021.3062220. [Google Scholar] [CrossRef]
18. R. Tagiew et al., “OSDaR23: Open sensor data for rail 2023,” in 2023 8th Int. Conf. Robot. Autom. Eng. (ICRAE), Singapore, 2023, pp. 270–276. doi: 10.1109/ICRAE59816.2023.10458449. [Google Scholar] [CrossRef]
19. A. Geiger, P. Lenz, C. Stiller, and R. Urtasun, “Vision meets robotics: The KITTI dataset,” Int. J. Rob. Res., vol. 32, pp. 1231–1237, 2013. doi: 10.1177/0278364913491297. [Google Scholar] [CrossRef]
20. R. Q. Charles, H. Su, M. Kaichun, and L. J. Guibas, “PointNet: Deep learning on point sets for 3D classification and segmentation,” in 2017 IEEE Conf. Comput. Vis. Pattern Recognit. (CVPR), Honolulu, HI, USA, 2017, pp. 77–85. doi: 10.1109/CVPR.2017.16. [Google Scholar] [CrossRef]
21. D. Guo, G. Yang, and C. Wang, “PillarNet++: Pillar-based 3-D object detection with multiattention,” IEEE Sens. J., vol. 23, no. 22, pp. 27733–27743, 2023. doi: 10.1109/JSEN.2023.3323368. [Google Scholar] [CrossRef]
22. K. Simonyan and A. Zisserman, “Very deep convolutional networks for large-scale image recognition,” 2014, arXiv:1409.1556. [Google Scholar]
23. K. He, X. Zhang, S. Ren, and J. Sun, “Deep residual learning for image recognition,” in 2016 IEEE Conf. Comput. Vis. Pattern Recognit. (CVPR), Las Vegas, NV, USA, 2016, pp. 770–778. doi: 10.1109/CVPR.2016.90. [Google Scholar] [CrossRef]
24. G. Shi, R. Li, and C. Ma, “PillarNet: Real-time and high-performance pillar-based 3D object detection,” in Comput. Vis.–ECCV (Eur. Conf. Comput. Vis.) 2022, 2022, vol. 13670, pp. 35–52. doi: 10.1007/978-3-031-20080-9_3. [Google Scholar] [CrossRef]
25. S. Zhou et al., “FastPillars: A deployment-friendly pillar-based 3D detector,” 2023, arXiv:2302.02367. [Google Scholar]
26. J. Deng, S. Shi, P. Li, W. Zhou, Y. Zhang and H. Li, “Voxel R-CNN: Towards high performance voxel-based 3D object detection,” in Proc. AAAI (Assoc. Adv. Artif. Intell.) Conf. Artif. Intell., 2021, vol. 35, pp. 1201–1209. doi: 10.1609/aaai.v35i2.16207. [Google Scholar] [CrossRef]
27. W. Liu et al., “SSD: Single shot multibox detector,” in Comput. Vis.–ECCV (Eur. Conf. Comput. Vis.) 2016, 2016, vol. 9905, pp. 21–37.doi: 10.1007/978-3-319-46448-0_2. [Google Scholar] [CrossRef]
28. T. Yin, X. Zhou, and P. Krähenbühl, “Center-based 3D object detection and tracking,” in 2021 IEEE/CVF Conf. Comput. Vis. Pattern Recognit. (CVPR), Nashville, TN, USA, 2021, pp. 11779–11788. doi: 10.1109/CVPR46437.2021.01161. [Google Scholar] [CrossRef]
29. Z. C. Chen et al., “Fast vehicle detection algorithm in traffic scene based on improved SSD,” Measurement, vol. 201, 2022, Art. no. 111655. doi: 10.1016/j.measurement.2022.111655. [Google Scholar] [CrossRef]
Cite This Article
 Copyright © 2024 The Author(s). Published by Tech Science Press.
This work is licensed under a Creative Commons Attribution 4.0 International License , which permits unrestricted use, distribution, and reproduction in any medium, provided the original work is properly cited.
 Downloads
 Citation Tools