
 Submit a Paper
 Propose a Special lssue
 Open Access
ARTICLE

Cyberbullying Sexism Harassment Identification by Metaheurustics-Tuned eXtreme Gradient Boosting
1 Technical Faculty, Singidunum University, Belgrade, 11000, Serbia
2 Informatics and Computing, Singidunum University, Belgrade, 11000, Serbia
3 Business Economics, Singidunum University, Belgrade, 11000, Serbia
4 Computing and Informatics, Sinergija University, Bijeljina, 76300, Bosnia and Herzegovina
5 Department for Information Systems and Technologies, University “Union Nikola Tesla”, Cara Dusana, Belgrade, 11080, Serbia
6 Department for Computer Science and Informatics, School of Electrical Engineering, University of Belgrade, Belgrade, 11000, Serbia
7 Department of Electrical and Electronics Engineering, Kongu Engineering College (Autonomous), Perundurai, Erode, 638060, India
8 Department of Mathematics, Saveetha School of Engineering (Deemed to be University), SIMATS Thandalam, Chennai, 602105, India
9 MEU Research Unit, Middle East University, Amman, 11831, Jordan
* Corresponding Author: Nebojsa Bacanin. Email:
Computers, Materials & Continua 2024, 80(3), 4997-5027. https://doi.org/10.32604/cmc.2024.054459
Received 28 May 2024; Accepted 29 August 2024; Issue published 12 September 2024
 View Full Text
 Download PDF
Abstract
Cyberbullying is a form of harassment or bullying that takes place online or through digital devices like smartphones, computers, or tablets. It can occur through various channels, such as social media, text messages, online forums, or gaming platforms. Cyberbullying involves using technology to intentionally harm, harass, or intimidate others and may take different forms, including exclusion, doxing, impersonation, harassment, and cyberstalking. Unfortunately, due to the rapid growth of malicious internet users, this social phenomenon is becoming more frequent, and there is a huge need to address this issue. Therefore, the main goal of the research proposed in this manuscript is to tackle this emerging challenge. A dataset of sexist harassment on Twitter, containing tweets about the harassment of people on a sexual basis, for natural language processing (NLP), is used for this purpose. Two algorithms are used to transform the text into a meaningful representation of numbers for machine learning (ML) input: Term frequency inverse document frequency (TF-IDF) and Bidirectional encoder representations from transformers (BERT). The well-known eXtreme gradient boosting (XGBoost) ML model is employed to classify whether certain tweets fall into the category of sexual-based harassment or not. Additionally, with the goal of reaching better performance, several XGBoost models were devised conducting hyperparameter tuning by metaheuristics. For this purpose, the recently emerging Coyote optimization algorithm (COA) was modified and adjusted to optimize the XGBoost model. Additionally, other cutting-edge metaheuristics approach for this challenge were also implemented, and rigid comparative analysis of the captured classification metrics (accuracy, Cohen kappa score, precision, recall, and F1-score) was performed. Finally, the best-generated model was interpreted by Shapley additive explanations (SHAP), and useful insights were gained about the behavioral patterns of people who perform social harassment.Keywords
Social networks have become deeply ingrained in modern society, influencing various aspects of human interaction, communication, and behavior. They play a pivotal role in shaping individual identities, facilitating connections, and fostering communities on a global scale. These platforms have transformed the way people share information, consume news, and express opinions. Additionally, social networks have revolutionized business and marketing strategies, providing companies with unprecedented access to target audiences and enabling personalized advertising campaigns.
Social networks, however, also raise concerns regarding privacy, misinformation, and the impact of online interactions on mental health, highlighting the complex and multifaceted nature of their influence on contemporary society. These platforms also contribute to the creation of echo chambers, where individuals are exposed only to information that aligns with their own beliefs [1,2]. Social networks can promote addictive behaviors, and their excessive use may lead to feelings of loneliness and anxiety. Moreover, they can facilitate cyberbullying and harassment, posing serious risks to users’ safety and well-being.
The term cyberbullying on social networks refers to the use of digital communication tools to harass, intimidate, or harm others. Online games can also be hotspots for cyberbullying due to the competitive and anonymous nature of some gaming environments. This type of bullying often involves sending hurtful messages, spreading rumors or lies, sharing private or embarrassing information, or posting derogatory comments or images with the intent to harm someone emotionally or socially. Cyberbullying can take various forms, including direct attacks targeting individuals or groups, impersonation, exclusion, or the creation of fake profiles to deceive or torment others. These actions can have profound emotional and psychological consequences on their victims’ mental and emotional health [3,4]. Victims often endure heightened emotional distress, such as sadness, anger, and fear due to the persistent nature of online harassment [5]. This can lead to lowered self-esteem [6] and increased levels of anxiety and depression [7]. Social withdrawal and isolation are common as victims try to avoid further harassment. Academic performance may suffer, and physical health can be affected, with symptoms like headaches and stomachaches arising from prolonged stress. In extreme cases, cyberbullying has been linked to suicidal thoughts and behaviors [8,9]. Victims may also experience behavioral changes, such as increased aggression or risky behaviors. Trust issues can develop, making it difficult for victims to form new relationships. Another consequence of cyberbullying can be to severely affect a person’s reputation by spreading rumors or embarrassing information. Addressing cyberbullying effectively involves raising awareness, fostering empathy, and implementing strategies to create safer online environments.
Artificial Intelligence (AI) can indirectly encourage cyberbullying through various means. Algorithm biases may prioritize sensational or controversial content, including cyberbullying material, to maximize user engagement, AI-driven recommendation systems can create echo chambers, reinforcing existing biases and amplifying negative messages, AI-powered bots can automate harassment, flooding social-media platforms with abusive content, and AI can enable anonymity for cyberbullies, making it harder for victims to identify and report them. Finally, AI algorithms may perpetuate harmful stereotypes, leading to the proliferation of cyberbullying based on factors like race, gender, or disability.
On the other hand, AI is becoming increasingly successful when used in the automatic recognition of this phenomenon. Natural language processing (NLP) can be used for text content analysis, such as social media posts, comments, and messages, to detect patterns of abusive language, threats, derogatory remarks, and other harmful behavior. Performing sentiment analysis (SA) on text data may provide the emotional tone of messages, such as negativity, hostility, or aggression, making it possible to flag potentially harassing or abusive content for further review [7]. The technology of image and video recognition can analyze images and videos to identify visual cues of cyberbullying or harassment, such as offensive gestures, explicit imagery, or targeted attacks against individuals. Behavioral analysis (BA) can analyze user behavior to detect patterns associated with cyberbullying or harassment. The AI algorithms can also be trained to recognize deviations from normal online interactions, such as sudden spikes in negative comments or a high volume of messages directed at a single user, which may indicate cyberbullying or harassment campaigns, while machine learning (ML) models can be trained to automatically classify new instances of abusive behavior with high accuracy.
Nonetheless, fine-tuning the structure of ML models is a must for each specific task. Each model contains a set of hyperparameters that must be configured to optimal (or suboptimal) values to provide accurate predictions. According to the “no free lunch” theorem [10], there is no one-size-fits-all solution applicable to all problems. Nevertheless, optimizing these hyperparameters poses non-deterministic polynomial hard (NP-hard) challenges, which cannot be tackled using traditional deterministic methods. Hence, a stochastic approach is necessary in such scenarios.
This study aims to test whether a more efficient system for detecting sexist-harassing cyberbullying can be developed using a tuned XGBoost model. To achieve this, one of the latest metaheuristic algorithms, the Coyote optimization algorithm (COA) [11], was modified to determine the satisfying values for XGBoost [12] hyperparameters for performing the classification task for sexist-harassing cyberbullying identification, was developed. To validate the proposed approach, this study uses the Twitter sexism harassment dataset, containing tweets about the harassment of people on a sexual basis, for natural language processing (NLP). Two algorithms are employed to convert text into meaningful numerical representations suitable for ML input: Term frequency-inverse document frequency (TF-IDF) and Bidirectional encoder representations from transformers (BERT). Besides COA, other contemporary metaheuristics were also implemented for this challenge and strict comparative analysis of obtained classification metrics was performed. The best generated model was then interpreted using Shapley Additive Explanations (SHAP), revealing valuable insights into the behavioral patterns of individuals who engage in social harassment.
There is a noticeable gap in the research literature concerning the use of NLP alongside optimization metaheuristics for analyzing cyberbullying and sexist harassment. While studies have delved into NLP applications in cyberbullying analysis and the effectiveness of optimization metaheuristics across various contexts, there remains a scarcity of comprehensive investigations that integrate these two domains for practical applications. This research endeavors to fill this gap by presenting a methodology that combines the analytical capabilities of NLP with the optimization capacities of metaheuristics, along with ML models. Considering the above, the primary motivation of the research conducted for this paper is to improve the identification of cyberbullying sexist harassment by integrating NLP techniques, which transform textual inputs into a structure understandable by ML models, particularly the XGBoost in this case, and metaheuristics, which fine-tune XGBoost for this specific task. An attempt was thus made to address the aforementioned gap in the current literature.
The structure of the paper is as follows: Section 2 describes the fundamental preliminaries behind the proposed research, along with a brief literature review, and Section 3 provides information on the original and modified COA metaheuristics employed for XGBoost tuning. Simulation setup, a discussion of the experimental outcomes, comparative analysis, statistical validation, and interpretation of the results are given in Section 4, while Section 5 concludes the paper.
2 Preliminaries and Related Works
Unfortunately, cyberbullying is a common phenomenon on social networks and online games. According to some authors [13], approximately 55% of high-school students reported that they experienced cyberbullying at some point in their lifetimes, and 27% of them had been cyberbullied in the most recent 30 days. Gender-specifically, Fig. 1 shows that almost half of the surveyed male students (49.05%) had experienced one or more types of cyberbullying in their lifetimes, and 24.20% had had that experience in the previous 30 days [13]. In the female population, the percentage is somewhat higher, with 59.20% and 28.60%, respectively.
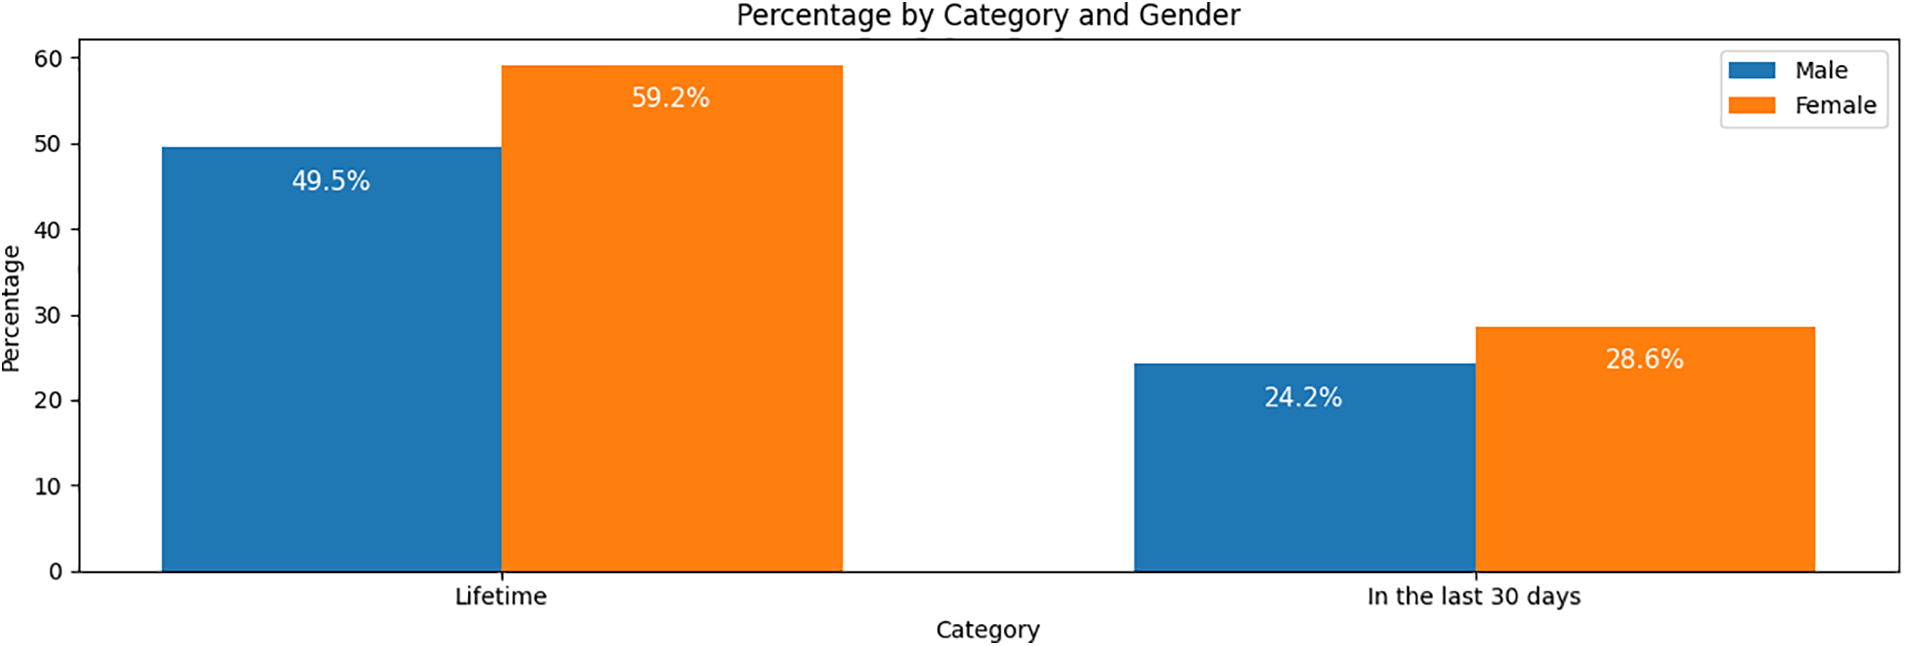
Figure 1: Cyberbullying among teens by gender
Regarding the most common types of cyberbullying, almost one third (30.4%) of the respondents stated that they had experienced mean or hurtful comments posted online, exclusion from group chats (28.9%), rumors spread online (28.4%), and someone embarrassing or humiliating them online (26.9%).
In online gaming, female gamers frequently encounter various forms of harassment, including instances of sexual harassment. These experiences can range from verbal abuse and derogatory comments to unwanted advances and explicit content, creating an environment that can be hostile and unwelcoming for many female players. A study published in the Journal of Adolescent Health found that around 65% of young people who play online games have experienced some form of in-game harassment, including cyberbullying behaviors.
In one study [14], key classification algorithms were reviewed, and an ensemble model was introduced to detect cyberbullying using Twitter data. Algorithms evaluated include Naive Bayes, K-Nearest Neighbors, Logistic Regression, Decision Tree, Random Forest, Linear Support Vector Classifier (SVC), Adaptive Boosting, Stochastic Gradient Descent, and Bagging classifiers. The algorithms were compared across accuracy, precision, recall, and F1 score metrics, showing varied performances, with the ensemble model outperforming individual algorithms and the Linear SVC proving least effective. In another paper [15], an AI-driven technique was developed for a cyberbullying-free Online social network (OSN), with a Chaotic salp swarm optimization (CSSO) method used to select key features from OSN data. Additionally, a stacked autoencoder model was employed for classifying OSN data, and the Mayfly optimization (MFO) algorithm to enhance performance through parameter tuning. More research [16] showed the development of an automated classification model whose purpose was to detect cyberbullying in text, avoiding high-dimensional spaces to prevent overfitting. The study introduced a Deep Decision Tree classifier using Deep Neural Network (DNN) layers as nodes for processing input, demonstrating improved accuracy in text-classification validation.
In other work [17], existing deep-learning approaches for cyberbullying detection were investigated, and research gaps and future directions were identified. Key areas for future investigation were highlighted, including hybrid deep-learning models and the detection of cyberbullying in speech, videos, and deep fakes, as well as personalized user-behavior analysis. Finally, the study proposed the development of specialized models like “cyberbully BERT” to enhance predictive accuracy in identifying online bullying behaviors.
Term frequency-inverse document frequency (TF-IDF) is a statistical measure used in NLP and information retrieval whose purpose is to assess the significance of keywords in specific documents [18]. The occurrence rate of phrases within documents is denoted as TF and calculated as:
where
On the other hand, document frequency (DF) indicates the occurrence frequency of a specific phrase across the entire set of documents. Words with a high DF value lack relevance due to their frequent occurrence. Consequently, higher IDF values indicate rare phrases in the whole set, thereby enhancing their overall significance [19,20].
Bidirectional encoder representations from transformers (BERT), developed by Google, is an NLP model introduced by [21,22], based on transformer architecture, and designed to understand the context of words in a sentence by considering both the left and right contexts simultaneously, hence the term bidirectional. BERT is pre-trained on large amounts of text data using masked language modeling and next-sentence prediction tasks [23]. In masked language modeling, BERT learns to predict a masked word in a sentence based on the surrounding words. In next-sentence prediction tasks, BERT learns to predict whether two given sentences are consecutive or not. After pre-training, BERT can be fine-tuned on specific NLP tasks, such as text classification, named-entity recognition, question answering, and more. Fine-tuning allows BERT to adapt its learned representations to the nuances of the task, resulting in state-of-the-art performance across various NLP benchmarks.
With the ability to understand the context of words in a sentence, BERT has practical use in a variety of AI applications, in tasks like text classification for sentiment analysis, spam detection, and topic categorization. BERT may enhance text generation, semantic search engines, language translation, and the capabilities of chatbots and virtual assistants. Additionally, it aids in text-summarization tasks by generating concise and informative summaries. Overall, BERT’s versatility in understanding natural language nuances makes it indispensable across various practical AI applications.
Still, BERT has limitations that hinder practical application but also motivate researchers to find more efficient, interpretable, and robust NLP models. Namely, BERT demands substantial computational resources for both training and real-time use, and its large memory requirements pose challenges for deployment on resource-constrained devices. BERT lacks explicit reasoning abilities, hindering performance on tasks requiring logical inference, with a limited understanding of common sense and world knowledge. Domain-specific nuances may be overlooked without fine-tuning specific data. BERT is also vulnerable to adversarial attacks, thus posing security risks. Interpreting BERT’s decisions may be challenging due to its complex representations affecting applications requiring interpretability.
The XGBoost is an ML algorithm used for supervised learning tasks, such as classification and regression [12]. It is an ensemble learning method based on gradient boosting that has gained recognition as a good optimizer, popular with researchers for tackling various challenging tasks [20]. The XGBoost improves upon traditional gradient boosting by incorporating regularization techniques to prevent overfitting, supporting parallelization for faster training, handling missing values in datasets, pruning trees for efficiency, and offering built-in cross-validation. It is widely used in competitions and industry applications due to its speed, scalability, and effectiveness in producing accurate models. In classification, it excels in predicting class labels, crucial in tasks like spam detection, fraud detection, and medical diagnosis. It may be effective when applied to regression for forecasting in finance, sales, and demand prediction. In search engines, recommendation systems, and personalized advertising it can be used for learning-to-rank tasks. In anomaly detection, it can identify outliers in data, aiding in cybersecurity, manufacturing, and healthcare. It can provide feature-importance scores in feature selection, aiding in selecting relevant features for modeling and interpretability. It may serve as a strong base learner in stacking and blending methods in ensemble learning, enhancing prediction robustness.
Despite its strengths, XGBoost requires substantial computational resources for training, especially on large datasets, leading to longer training times and increased resource use. Memory consumption can be significant, particularly with large datasets or complex models, which may pose challenges in memory-constrained environments. Tuning hyperparameters for optimal performance can be time-consuming and computationally expensive due to the need for extensive experimentation. Its models are complex and may be difficult to interpret. Although XGBoost incorporates regularization techniques, it can still be prone to overfitting, especially with noisy or high-dimensional data. Handling missing values as a separate category may not always be the most effective strategy, necessitating additional preprocessing steps. XGBoost’s performance can be sensitive to outliers in the training data, potentially impairing model accuracy, particularly with shallow trees. Despite these drawbacks, XGBoost remains widely used in machine learning due to its strong predictive capabilities and versatility across various tasks.
Hyperparameter tuning poses a challenge within the realm of NP-hard problems, encompassing problems that lack a known polynomial-time solution. Enhancing the performance of ML models through hyperparameter tuning is crucial, often necessitating exploration across an extensive spectrum of potential combinations. Such intricate optimization problems can be solved with the use of metaheuristics: versatile optimization techniques agnostic to specific problems. Nonetheless, the NFL theorem stipulates that no single optimization algorithm universally outperforms others across all scenarios. Consequently, researchers have devised numerous metaheuristic algorithms, each tailored to address specific sets of circumstances. The NFL principle underscores the influence of dataset features and learning tasks on the efficacy of an algorithm. Hence, the unique nuances of each problem should inform the choice of an algorithm, as different algorithms may excel under disparate conditions.
Many optimization algorithms draw inspiration from animal and insect species, aiming to mimic their natural behaviors. To encapsulate the essence of these biological processes, algorithms leverage mathematical models, e.g., the Firefly algorithm (FA) [24], Particle swarm optimizer (PSO) [25], Whale optimization algorithm (WOA) [26], Ant colony optimization (ACO) [27], and Artificial bee colony (ABC) [28], just to name few. Given their exceptional performance in general optimization tasks, metaheuristic algorithms find extensive application across various domains.
2.5 SHAP (Shapley Additive Explanations)
SHAP is a method used in explainable artificial intelligence (XAI) to clarify the output of ML models. It aims to provide interpretable explanations for individual predictions made by complex models. The SHAP framework is based on cooperative game theory, specifically the concept of Shapley values. One key advantage of SHAP is its ability to provide local explanations for individual predictions, allowing users to understand why a specific instance was classified or predicted in a certain way. Additionally, SHAP values can be combined to provide global insights into feature importance and model behavior across the entire dataset.
In the context of SHAP, Shapley values represent the average marginal contribution of a feature value to the prediction across all possible coalitions of features. These values capture the importance of each feature in determining the model’s output. The SHAP values can be applied to a wide range of machine learning models, including tree-based models, neural networks, and linear models. Shapley value can be represented as:
where sum ranges over all n! orders R of the players,
3 Introduced Modified Metaheuristics and Proposed Framework
This section first gives insights into the inner workings of the basic COA metaheuristics, then lists its disadvantages and provides details of the devised modified algorithm used for XGBoost tuning for sentiment classification. Finally, the section concludes with an overview of the proposed NLP framework for Twitter sexist harassment identification.
The COA is a metaheuristic optimization approach inspired by the hunting behavior of coyotes [11]. It mimics a cooperative hunting strategy, where individuals work together in groups to search for prey. As with every other metaheuristic approach, the COA tries to improve the population of solutions over a predefined number of iterations.
The COA offers some advantages compared to other metaheuristic optimization algorithms. Firstly, it integrates pack behavior, promoting collaboration and information-sharing among individuals, which aids in the thorough exploration of the search space. It strikes a balance between exploration and exploitation, preventing premature convergence and ensuring robust performance across diverse problem types. Moreover, the COA is flexible and adaptable to different optimization tasks, with the ability to handle complex, high-dimensional problems effectively. Despite its effectiveness, COA maintains a simple implementation, making it accessible and easy to understand for practitioners, who can readily customize it to suit specific needs.
The population is described by
The reproduction behavior, otherwise describable as the survival ratio, is modeled according to Algorithm 1 to tackle the size of populations, while the population is initialized according to Eq. (4):
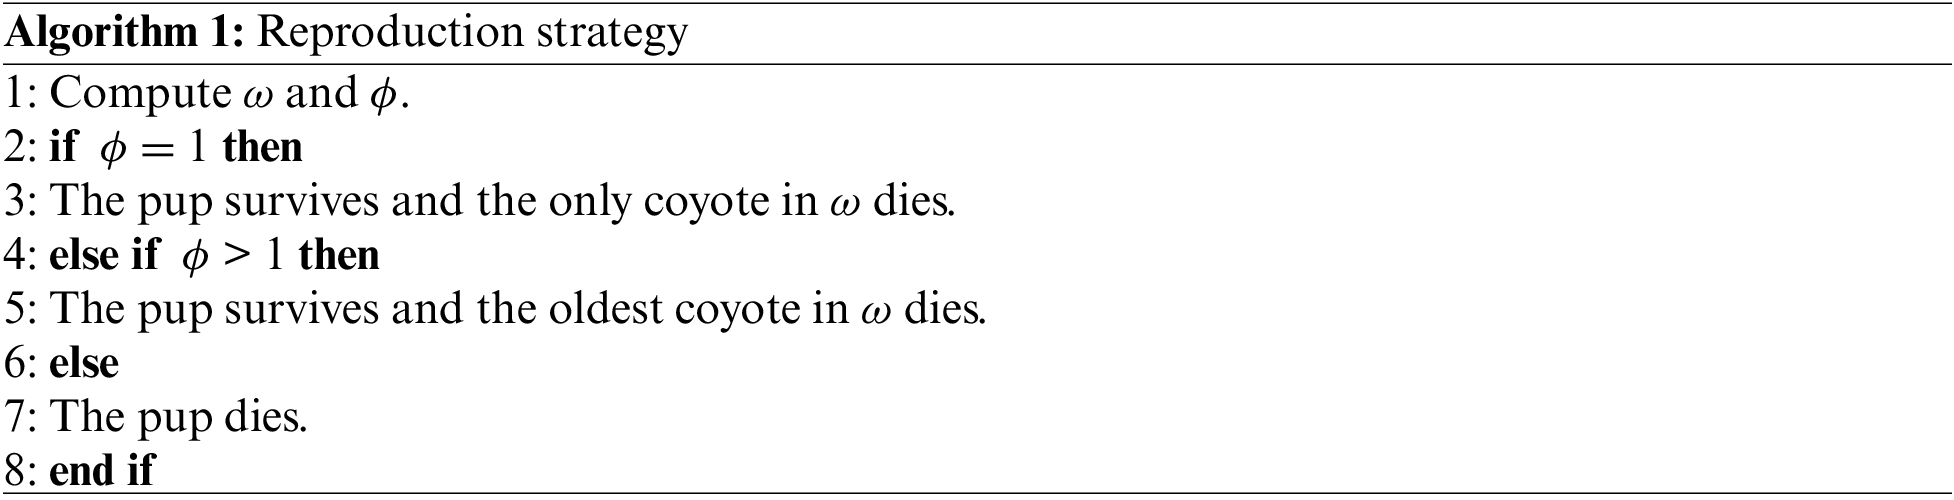
where the
The probability of solutions eviction from the group is given by Eq. (6).
The
where the
where the random solution of the
The alpha influence is described by
where the weights of the alpha and pack influence are respectively
3.2 Proposed Modified Algorithm
Besides its obvious advantages, COA also presents some drawbacks. First, it lacks a robust theoretical foundation compared to other metaheuristic algorithms, making it challenging to analyze its convergence behavior. Moreover, COA’s performance can be sensitive to parameter settings, requiring extensive tuning for optimal results. There is a risk of premature convergence, where the algorithm settles on suboptimal solutions too early. Scaling COA to larger or more complex problems may pose difficulties in maintaining effective exploration. Additionally, COA has received less benchmarking than established algorithms. Despite these limitations, due to its unique strengths COA remains a promising optimization approach.
In this research, the basic COA was evaluated using the comprehensive Congress on Evolutionary Computation (CEC) 2020 benchmark suite. Deficiencies in exploration were observed, especially in early iterations of the algorithm run. Namely, in the early phases of some runs, the COA entirely overlooks sections of the search space containing the optimal solution, resulting in slower convergence and an insufficient balance between exploration and intensification.
To address the above drawbacks and further improve exploration, as well as the intensification-diversification balance, the following mechanisms were incorporated:
• the quasi-reflexive learning population (QRL) initialization and
• the adoption of a self-adjusted control parameter that tunes exploration, as well as its trade-off with exploitation throughout the iterations.
The goal of the QRL’s initialization procedure is to increase diversification in the initial population so that the larger part of the search space is covered. This mechanism is executed in the following way: first N/2 individuals from the population are generated in the standard way according to Eq. (4); afterward, the quasi-reflexive opposite solutions of all N/2 individuals are created, and, in this way, an initial population of N solutions is generated. The algorithm for the QRL initialization procedure, as well as the expression for generating quasi-reflexive opposite individuals, can be found in [22].
In the early iterations, the exploration of the search area should be more intensive so that the algorithm could converge to the optimal (or suboptimal) domain. To achieve this, the nrs (number of replaced solutions) random individuals from the population are replaced in every iteration with randomly generated solutions according to Eq. (3). The solutions that are replaced are chosen based on the roulette-wheel selection, where the solutions with higher fitness have a lower chance of being replaced. The current best solution is preserved, however, and it is not considered in the replacement process. In this way, the information about the best-discovered region so far is sustained.
In later iterations, however, with the logical presumption that the search has converged toward an optimum, such intensive exploration is not required, and, to control this, an additional control parameter Ω is introduced. Therefore, for each solution from the population that was chosen for replacement, the above replacement mechanism is triggered only if the following condition is met:
where rand() represents a pseudo-random number drawn from a uniform distribution between [0, 1].
Since the exploration should be decreasing throughout the runs, the Ω is decreasing from its initial value Ω0 according to the following equation:
where t and t + 1 denote the current and next iteration, respectively, while T represents the total number of iterations in a run.
According to Eq. (18), as the run progresses toward the end, the replacement mechanism is triggered more rarely, and the exploration power decreases. Also, with the aid of this control parameter, in early phases, the exploitation–exploration trade-off is set in favor of exploration, while later it gradually moves toward exploitation, boosting intensification, while depressing diversification.
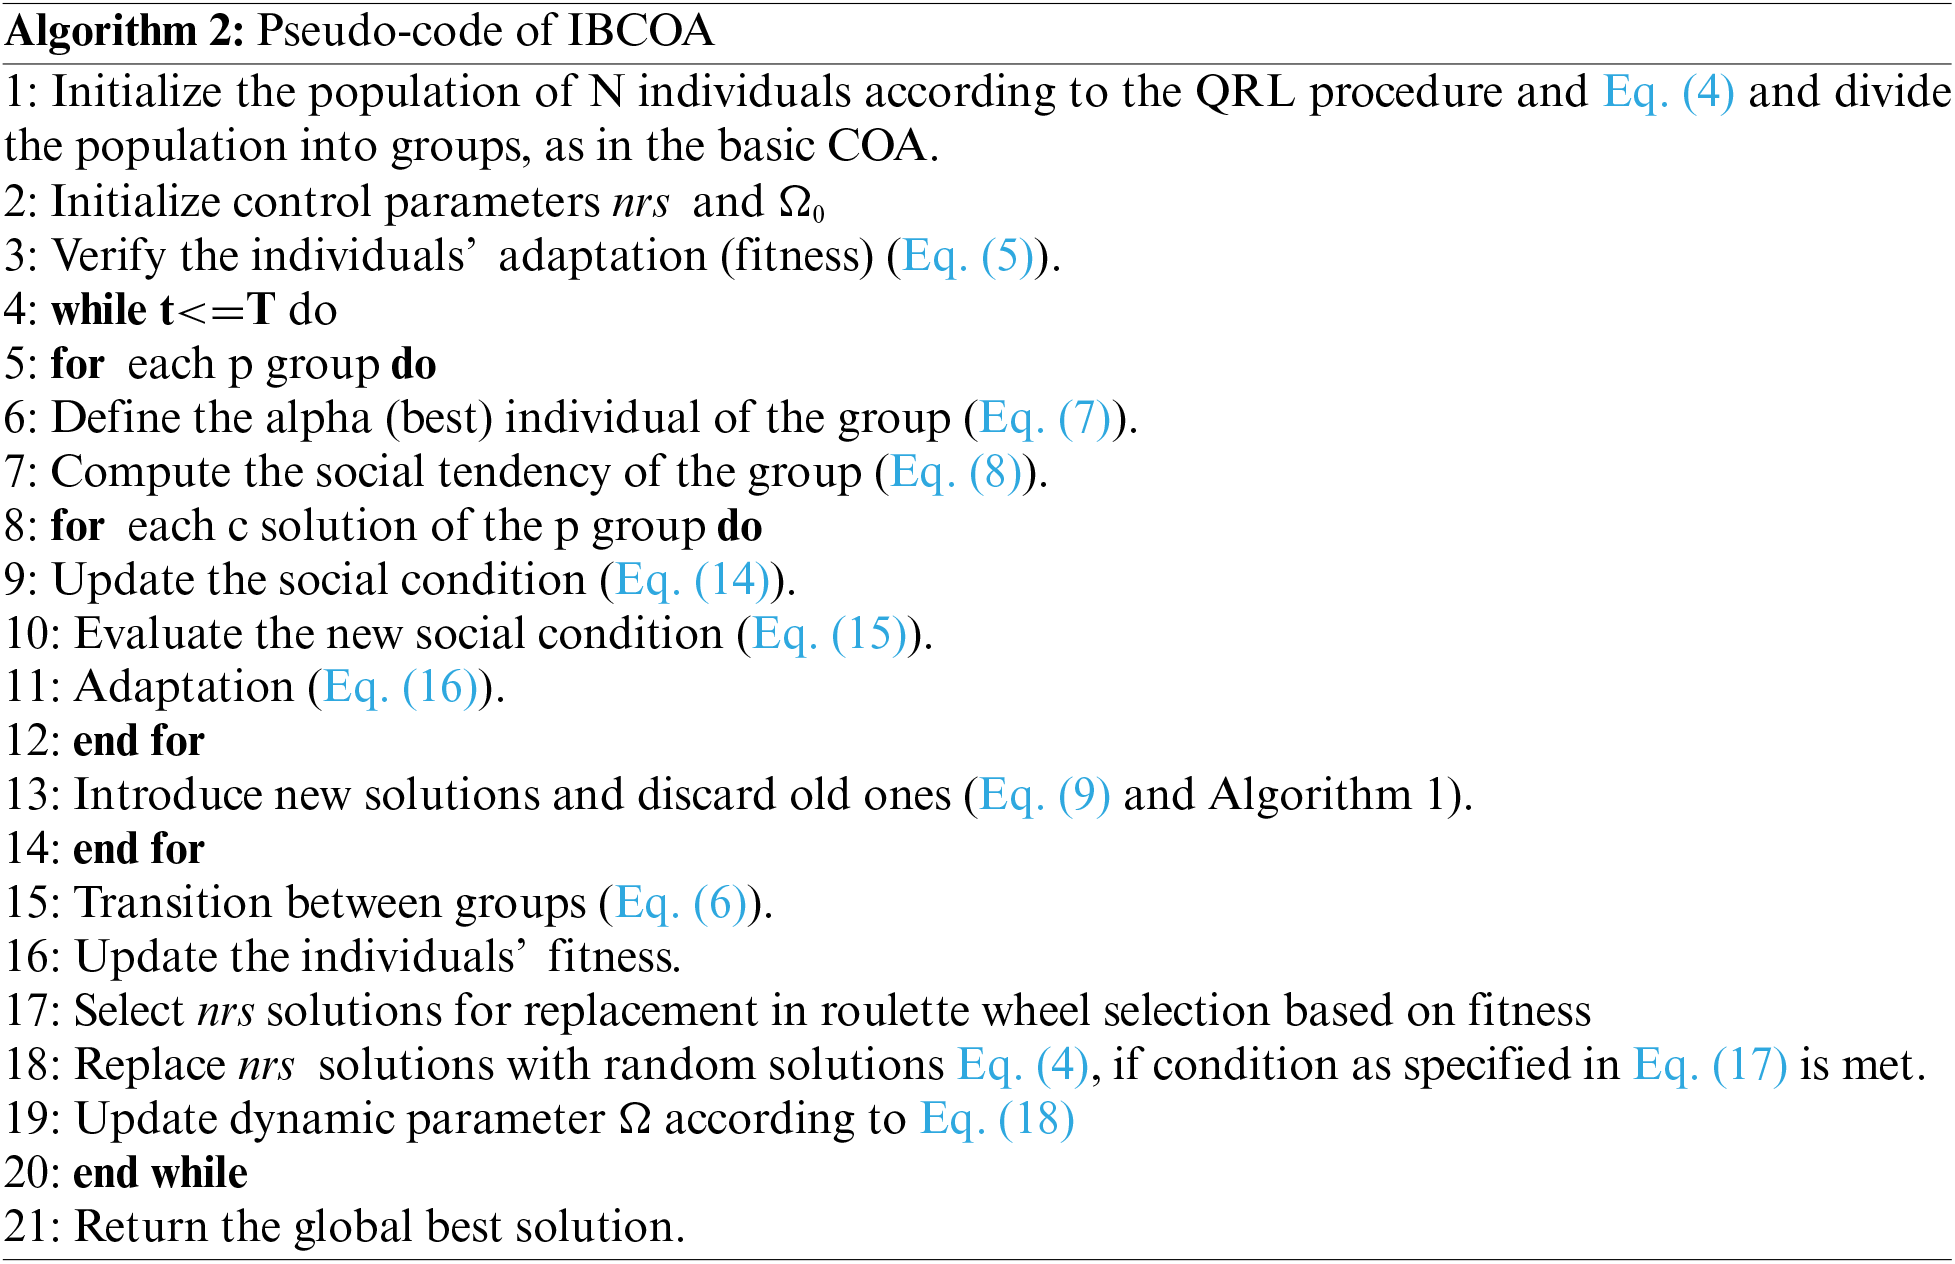
Considering all modifications of the original COA, the modified method was named iterative boosting COA (IBCOA), and its pseudo-code is given in Algorithm 2:
3.3 Solution Encoding and Proposed XGBoost Tuning Framework
The text-based Twitter sexist harassment dataset was divided into training and testing portions. Afterward, it was transformed into a numerical representation to be input into the XGBoost model using the TF-IDF and BERT techniques.
Each agent from the IBCOA population represents one set of XGBoost hyperparameters. Six parameters were subjected to the optimization process; therefore, each IBCOA individual is represented as a vector with six dimensions (D = 6). Some parameters, which are shown in Section 4.1, are of an integer, while others are of a float data type. Therefore, this NP-hard challenge falls into the group of mixed continuous-integer problems. After the algorithm’s execution, the best-performing solution (XGBoost model) was saved and further investigated using the SHAP technique. The block diagram of the proposed framework is depicted in Fig. 2.
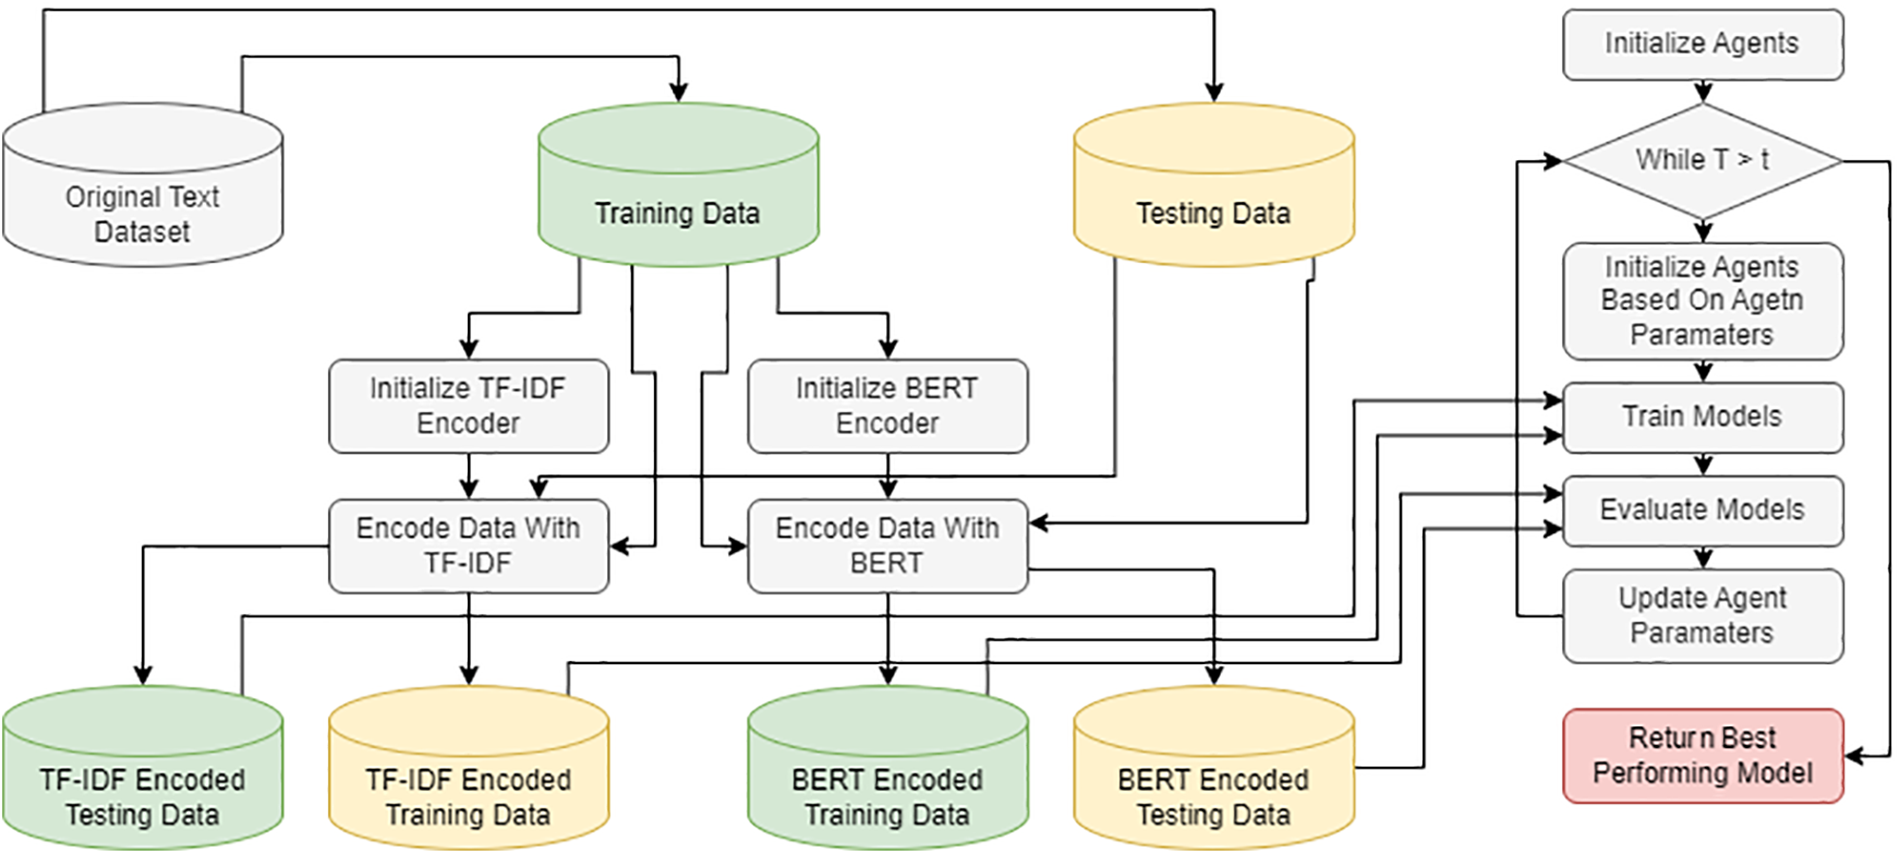
Figure 2: Block diagram of proposed XGBoost framework for Twitter sexism detection
4 Experimental Setup and Simulation Outcomes
In the proposed research, two experiments were conducted, one with TF-IDF encoded input and the second with BERT encoded input for XGBoost tuning. This section gives experimental setup and employs dataset details, simulation outcomes with comparative analysis, statistical analysis, and best model interpretation using SHAP technique.
4.1 Experimental Setup and Dataset Overview
The proposed study uses the Twitter sexist harassment dataset. This dataset comprises various collections from the Twitter social-networking platform, all related to the automatic detection of cyberbullying and sexist harassment. The dataset consists of 14,878 instances (observations), where each observation represents textual-based content (tweet), which was grabbed from the Twitter social network, and relates to potential sexism harassment. Labels that are used in the dataset are 0 (no sexism harassment) and 1 (sexism harassment).
The employed dataset is highly imbalanced, with 11,501 and 3377 observations belonging to classes 0 and 1, respectively. The visual representation of class distribution within the Twitter sexist harassment dataset is given in Fig. 3. The dataset used is freely available from the following Kaggle URL: https://www.kaggle.com/datasets/saurabhshahane/cyberbullying-dataset (accessed on 26 May 2024). Additionally, at the provided Kaggle repository link, more details regarding the dataset can be found.
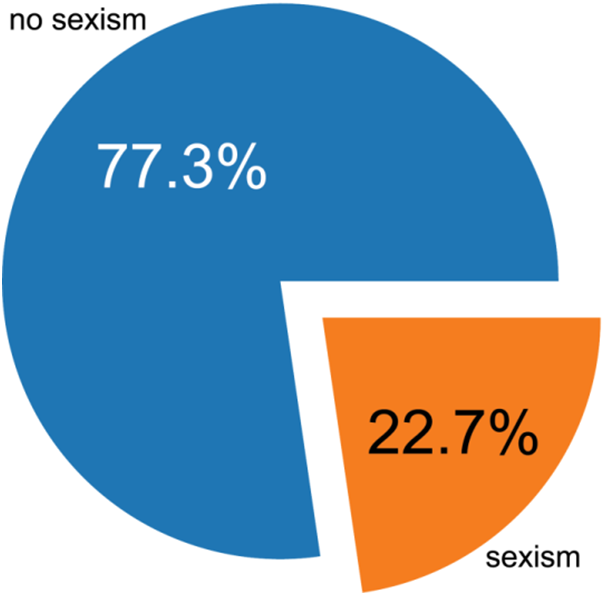
Figure 3: Distribution of classes in Twitter sexist harassment dataset
The data in the dataset were split into a training set containing 70% data, while the test set held 30% of the data. The experiments were conducted using a standard set of Python machine libraries, including scikit learn, numpy, pandas, and seaborn. To split the dataset, scikit learn train test split with random seed was used to allow the reproducibility of the simulations.
The experimental setup for both simulations was the same. Hyperparameter bounds that were optimized were provided to allow for the reproduction of experiments. The ranges in which the hyperparameters for XGBoost optimization were selected were 0.1–0.9 for learning rate (type: float), 1–10 for minimum child weight (type: integer), 0.01–1 for subsample (type: float), 0.01–1 for Colsample by tree (type: float), 3–10 for maximum depth (type: integer), and 0–0.8 for gamma (type: float).
Since the employed dataset was imbalanced, the Cohen kappa coefficient was used as the objective function, while the classification error rate, precision, recall, F1-score, macro, and weighted averages per each class were also captured. These indicators were used because, together, these metrics offer a holistic assessment of classifier performance across various dimensions: overall accuracy (measured by Cohen’s kappa and classification error), the equilibrium between precision and recall (F1-score), the capability to reduce false positives (precision), the ability to capture all positives (recall) and effectiveness in handling class imbalances (micro and macro weighted averages). They assist researchers and practitioners in evaluating how well classification models perform for particular tasks and datasets, providing insights into their effectiveness and appropriateness. Considering all these indicators together is also crucial for sexist-harassment cyberbullying identification, where maximizing true positive identifications of harassment cases and minimizing false positives and false negatives are the cornerstones of establishing an effective and efficient automated sexist harassment detection system.
Each metaheuristics approach was evaluated with the number of units in the population of 10 (N = 10) and a maximum iteration number of 10 (T = 10) throughout 30 independent runs. Moreover, best, worst, mean, median, standard deviation and variance of objective function, and classification error rate over 30 runs were also captured. To account for the stochastic nature of metaheuristics, it is important not only to focus on the best results obtained but also to gain insight into the average results across independent runs, where each run is executed with its own random sequence. The devised IBCOA was validated against other contemporary optimizers, which were tested under the same experimental conditions, with the goal of establishing rigid comparative analysis: COA [11], GA [29], PSO [25], FA [24], Sine cosine algorithm (SCA) [30], Sinh cosh algorithm (SCHA) [31], and Reptile search algorithm (RSA) [32]. All metaheuristics were employed for XGBoost tuning, in the results tables, and in the graphs; they are represented with the prefix ‘XG’. Also, the best-captured metrics in results tables are marked in bold type.
4.2 Simulation Outcomes, Comparative Analysis, and Discussion
The outcomes of the performed simulations are provided for both experiments. Firstly, the experiments employing TF-IDF are reported, followed by BERT experiments.
4.2.1 The TF-IDF Simulation Results
A solid foundational tool for analyzing the performance of a classification model is the confusion matrix since it plays a crucial role in classification tasks by providing a detailed breakdown of how a model’s predictions compare to actual class labels across different categories. It is essential for assessing model performance, revealing the accuracy of classifications, and exposing any biases toward particular classes in datasets with uneven distributions. Derived from the matrix are key metrics, such as accuracy, precision, recall, specificity, and the F1-score, which offer nuanced insights into the model’s effectiveness beyond overall accuracy. By analyzing patterns of misclassifications and errors identified in the confusion matrix, practitioners can refine models, adjust thresholds, or optimize features to enhance predictive accuracy. This thorough evaluation not only aids in refining models but also informs strategic decisions, ensuring that classification models are tailored to meet the specific challenges and requirements of real-world applications.
The IBCOA with TF-IDF technique achieved a 95.8% true negative rate and a 4.2% false positive rate, as observable from the confusion matrix, presented in Fig. 4, exhibiting exceptional performance in classifying the no-sexism class. The classification of the sexism class, however, is not of the same quality. The proposed solution with the TF-IDF technique provides around a 40.5% false negative rate, with a true positive rate of 59.5%. The performance is noticeably worse for the sexism class, as many positive cases are classified as the no-sexism class. Because the dataset is highly imbalanced toward the no-sexism class, however, these results are satisfactory.
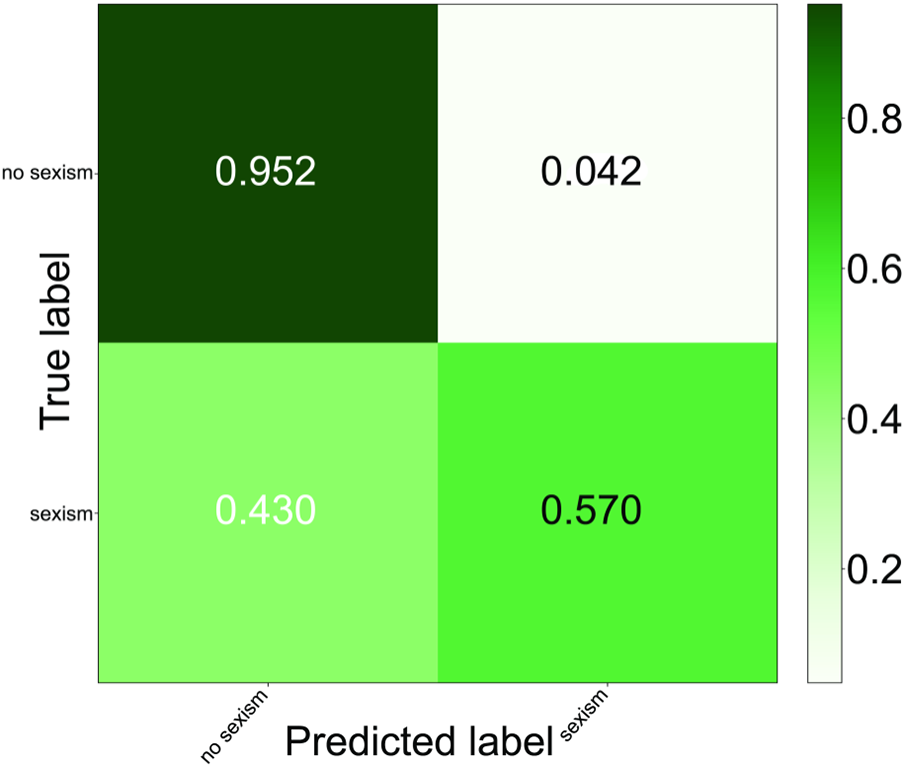
Figure 4: The IBCOA XGBoost tuning with TF-IDF confusion matrix
The error box plot diagrams for classification error for all metaheuristics over 30 runs are shown in Fig. 5, while the violin plot for the objective function is provided in Fig. 6. From those figures it can be observed that all methods exhibit consistent performance since tight groupings can be noticed in both plots. It can be also noticed that the proposed IBCOA established the best results compared to all other approaches.
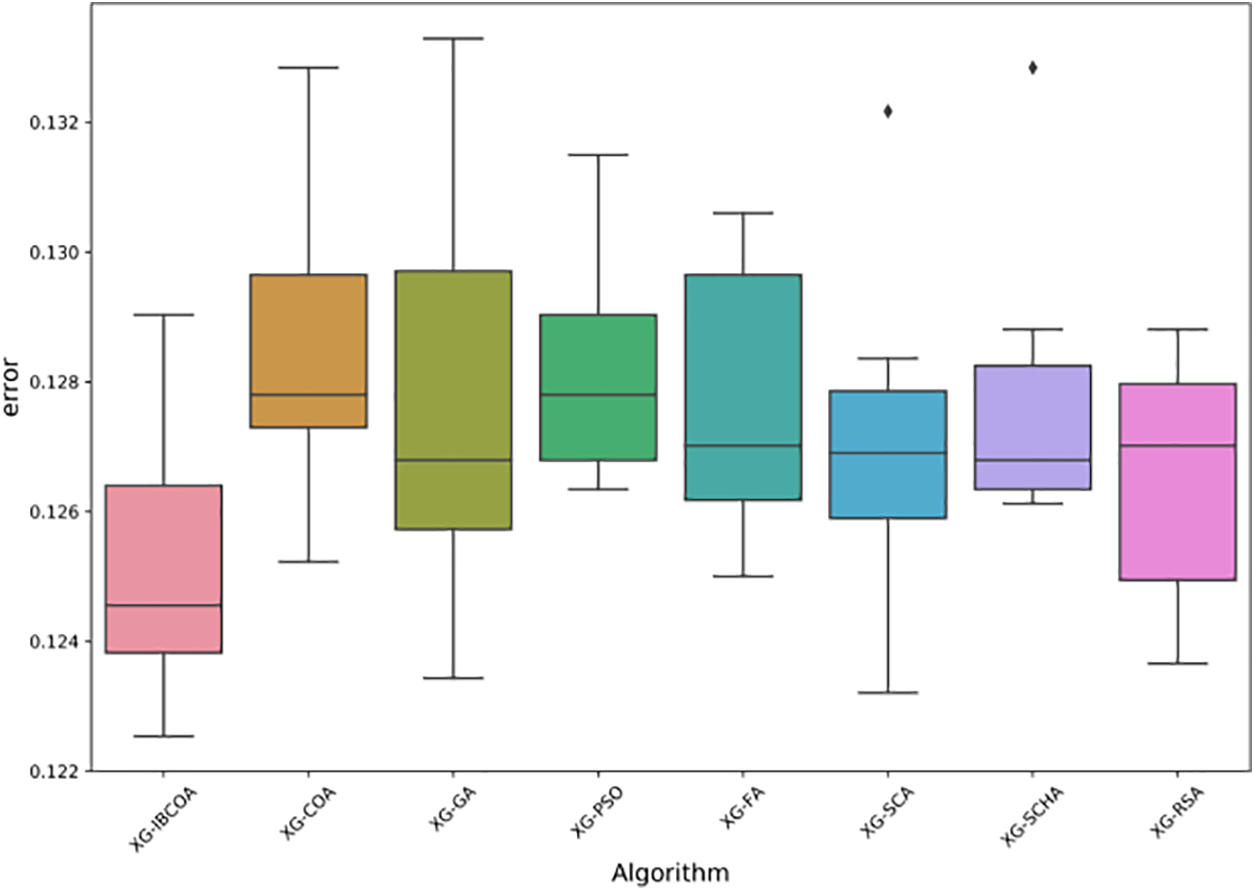
Figure 5: The TF-IDF simulations error box-plot diagram
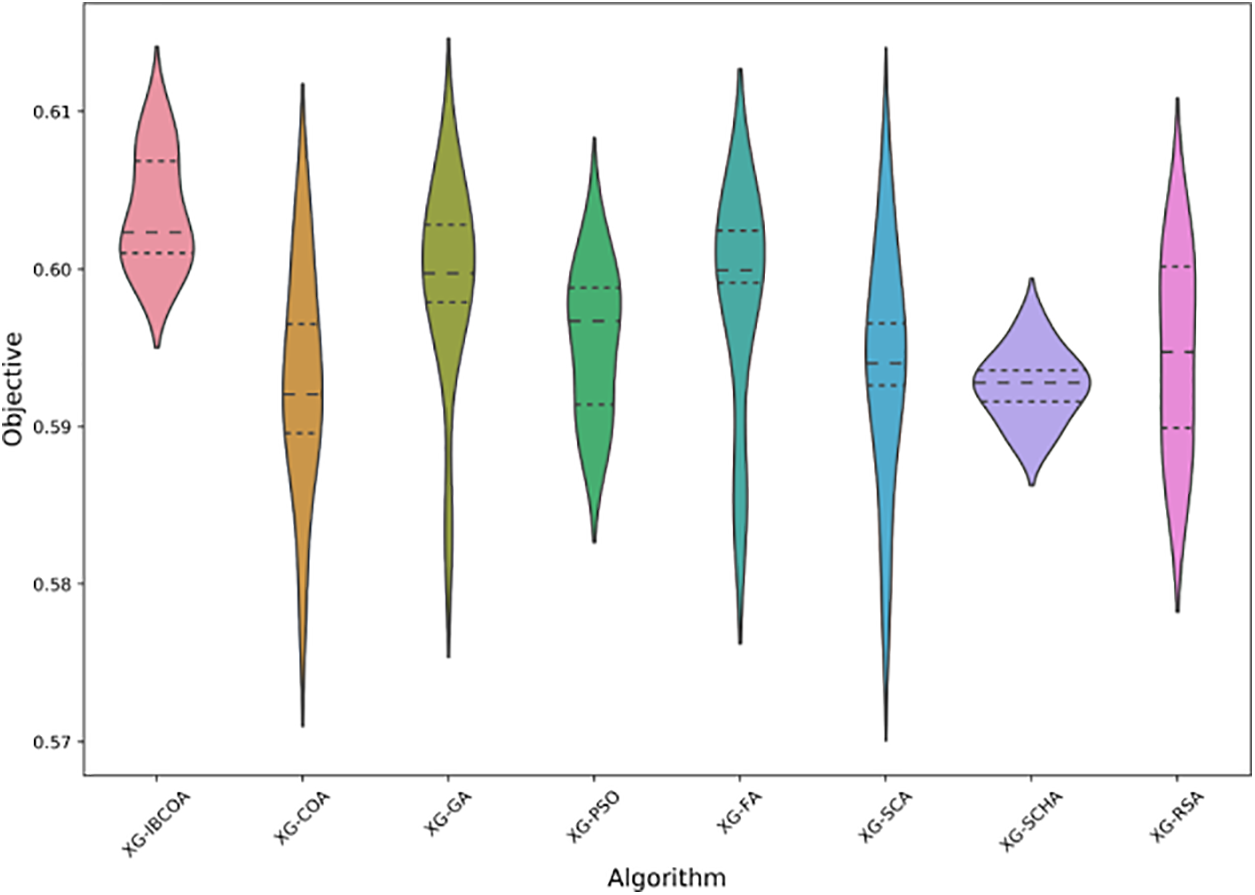
Figure 6: The TF-IDF simulations objective violin-plot diagram
The error convergence graphs for all methods in the best runs (Fig. 7) show admirable performance for the XG-IBCOA, as it is rapidly and consistently descending along the y-axis, which represents the error. After the fourth iteration, the algorithm slightly regresses and stabilizes immediately. Interesting is the performance in convergence speed for the XG-RSA solution as well. Namely, the algorithm shows significantly worse performance during the first iterations but after a short regression from the second to the fourth iteration, the algorithm outputs an even lower error value than the XG-IBCOA. The objective convergence graph reported in Fig. 8 indicates an even higher performance of the XG-IBCOA, where it obtains the highest objective values. Satisfying performance was also exhibited by the solutions optimized by GA, SCA, and FA, although they do not outperform the proposed IBCOA metaheuristics.
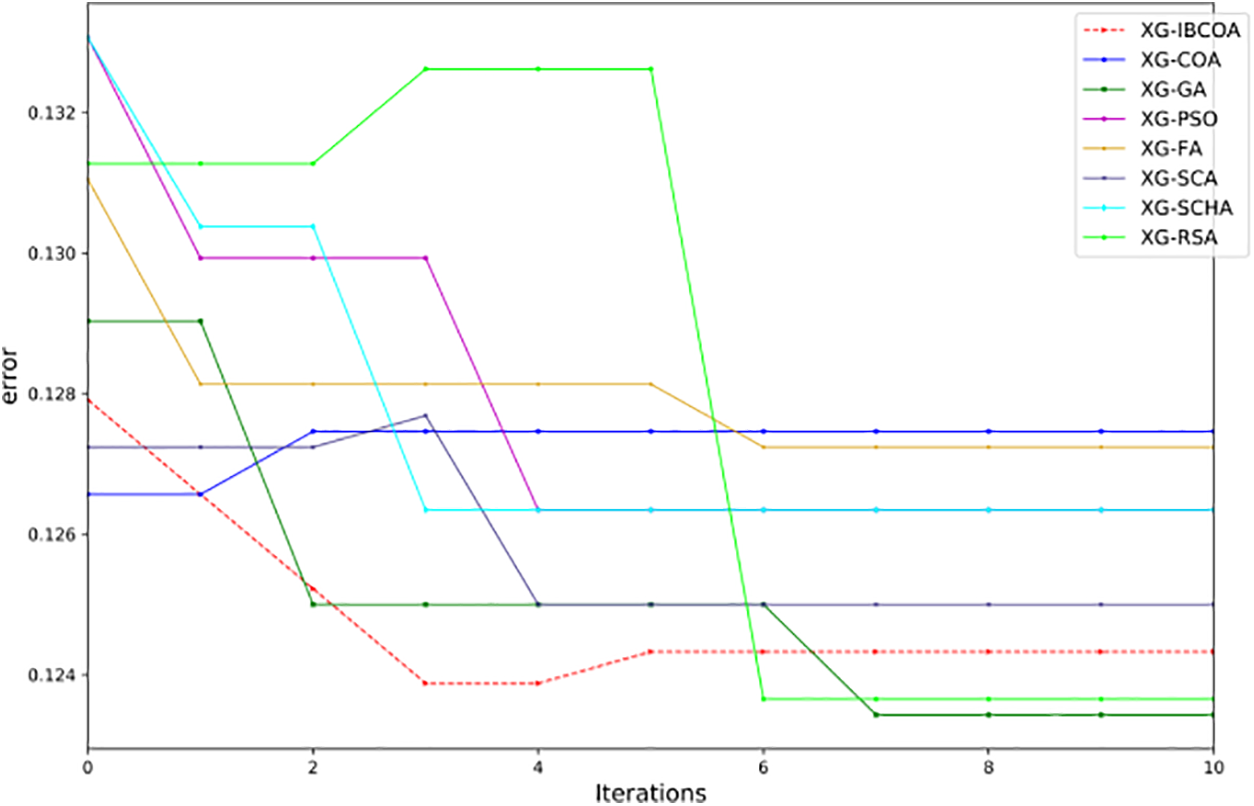
Figure 7: The TF-IDF simulations error convergence graphs in the best run of all methods
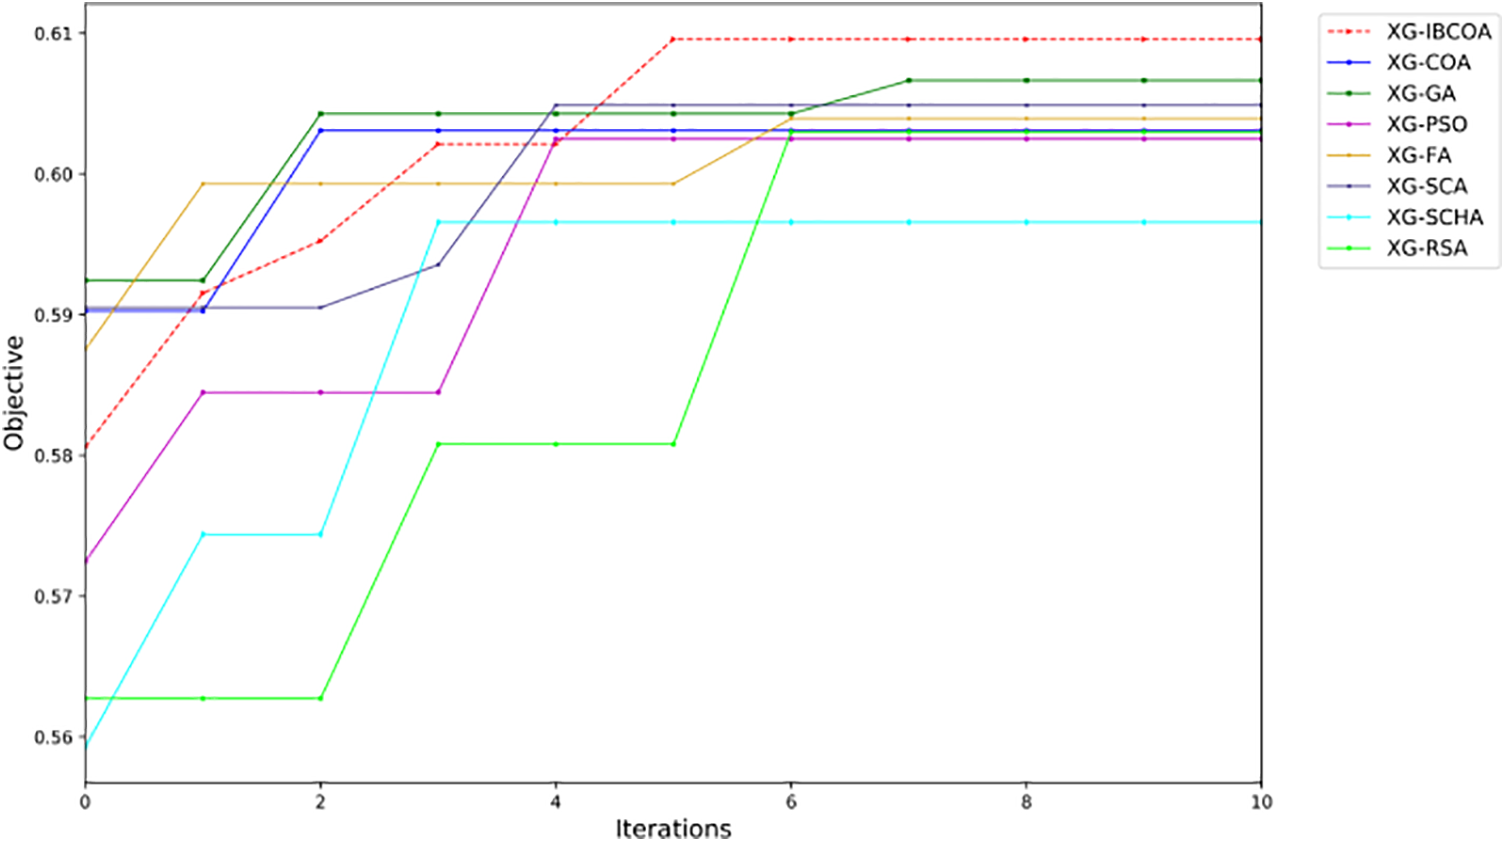
Figure 8: The TF-IDF simulations objective convergence graphs in the best run of all methods
The diversity of the population in the final iteration of the best run for all methods in terms of error and objective is shown in Figs. 9 and 10, respectively. It should be noted that the IBCOA population exhibits the lowest diversity, meaning that most individuals have converged to the right part of the search area.
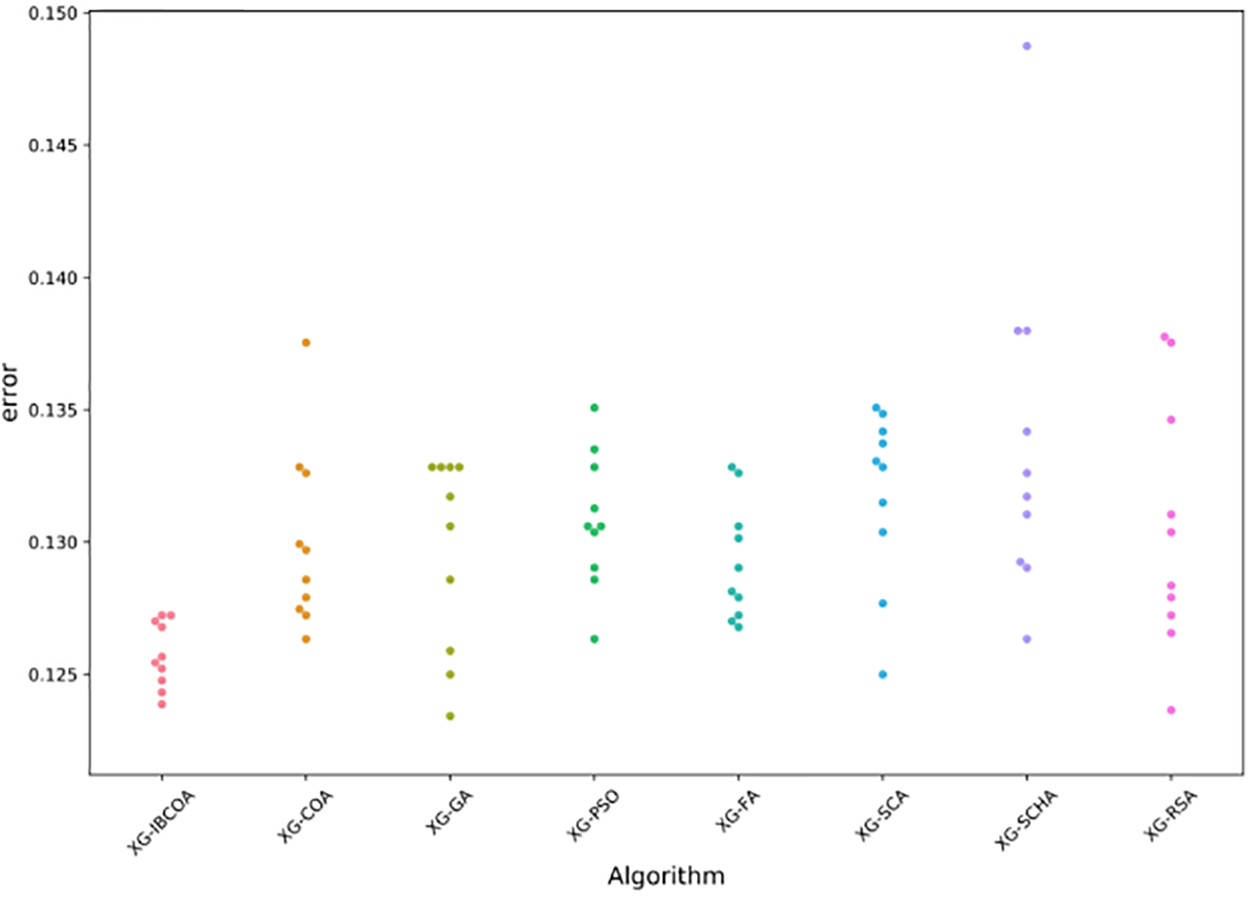
Figure 9: The TF-IDF simulations error swarm-plot diversity
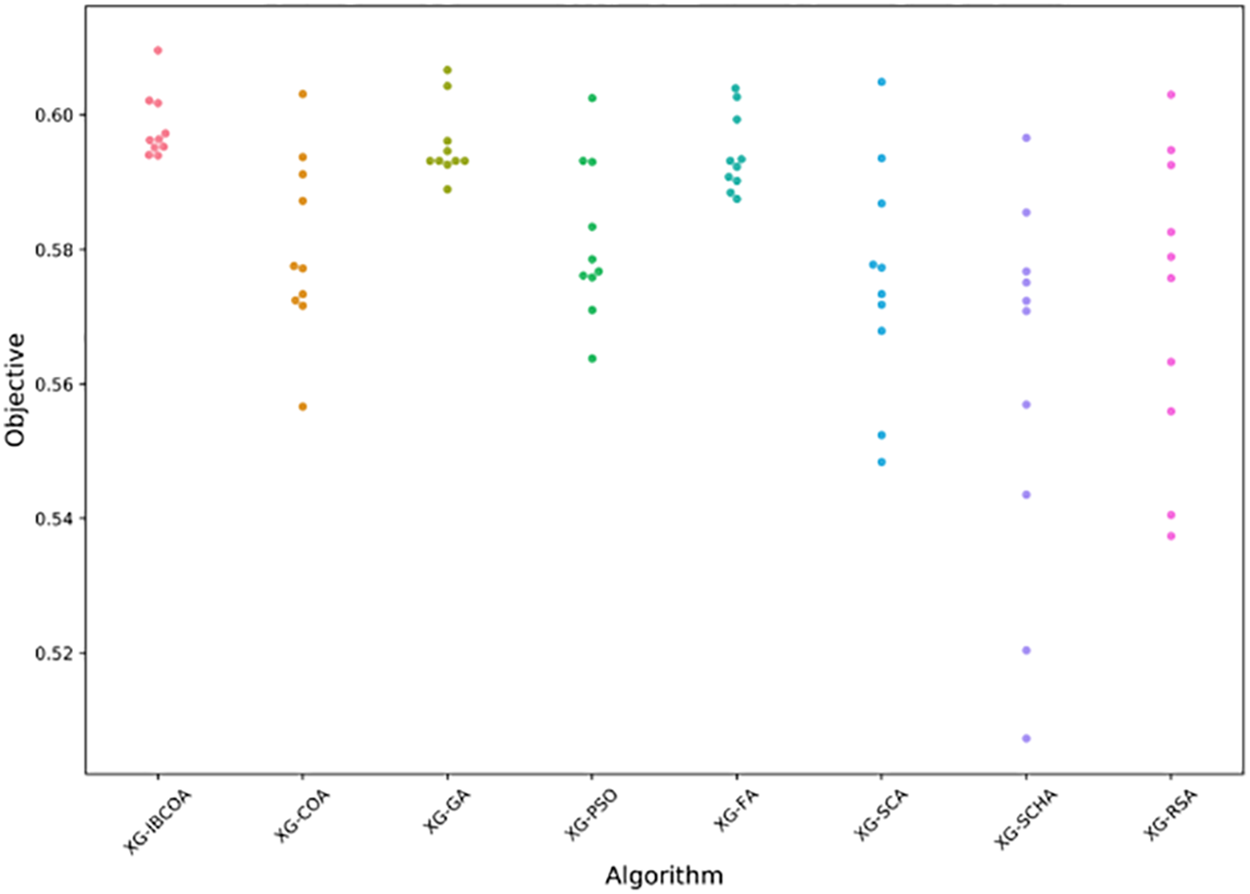
Figure 10: The TF-IDF simulations objective swarm-plot diversity
The precision-recall (PR) curve for the best model XGBoost model generated by IBCOA in Fig. 11 indicates 94% average precision for the no-sexism class, 75% average precision in detecting the sexism class, and a micro-average precision of 92%. The PR curve indicates a very high performance of the proposed solution for sexism identification but, as previously pointed out by the confusion matrix in Fig. 4, the improvements need to be made in classifying sexist content to raise the micro-average precision further.
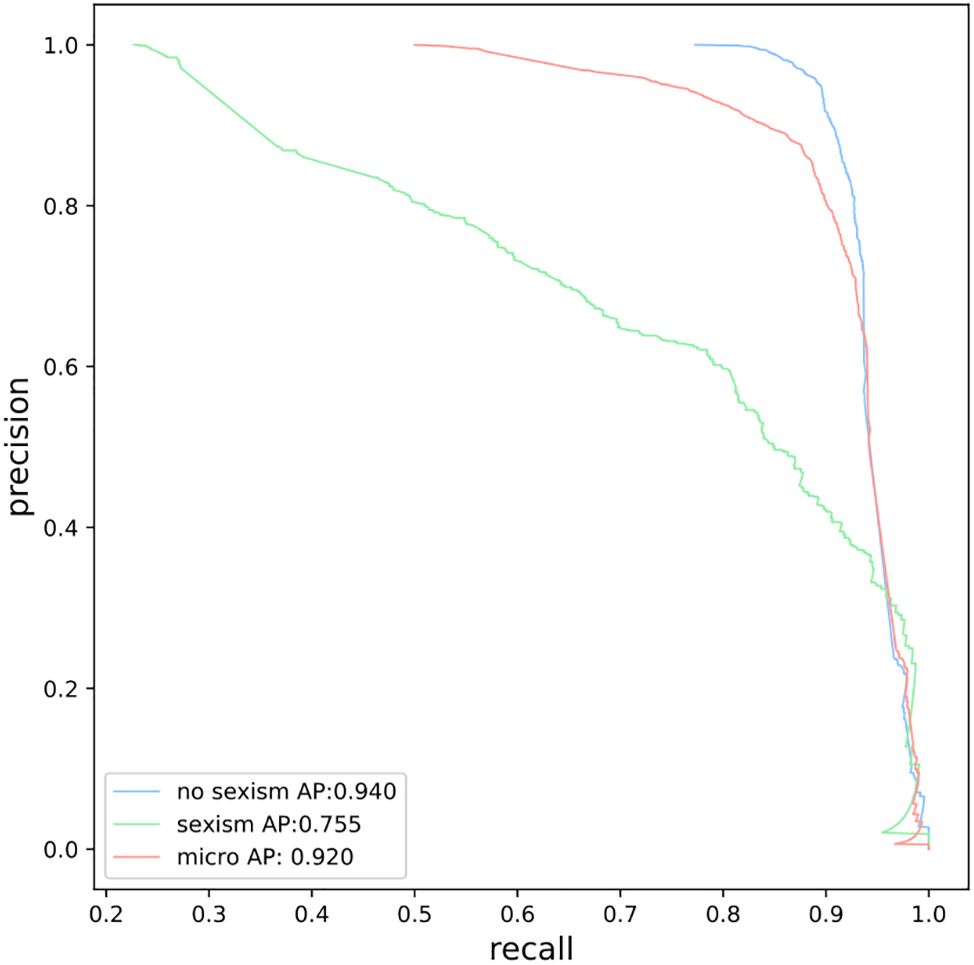
Figure 11: TF-IDF simulations PR curve obtained by XG-IBCOA
The results of the objective function (Cohen kappa score) in terms of best, worst, mean, median, standard deviation, and variance over 30 runs are reported in Table 1, while the same metrics for classification error are shown in Table 2 for the TF-IDF experiments. The proposed solution had the best results for the best, worst, mean, and median categories, indicating robust performance. Only the XG-SCHA solution had lower standard deviation and variance, but this approach did not provide even the second-best performance, indicating that, while it has a tighter grouping of predictions, they are still not close to other optimizers. The lowest score for the objective value was obtained by the XG-COA in the worst category and had the second worst score for the standard deviation, confirming the results of improvements to the original solution.
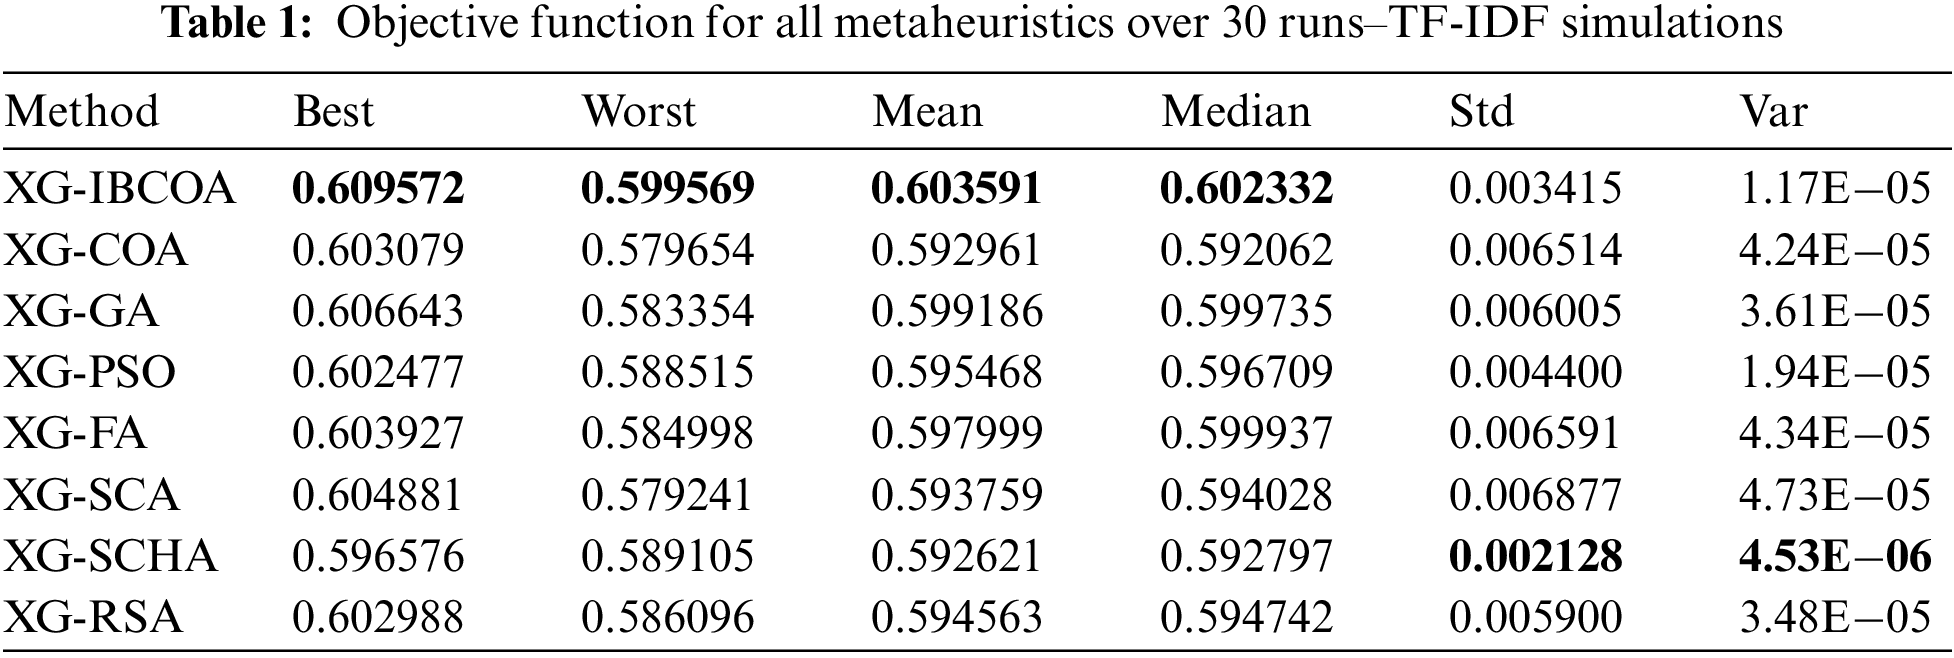
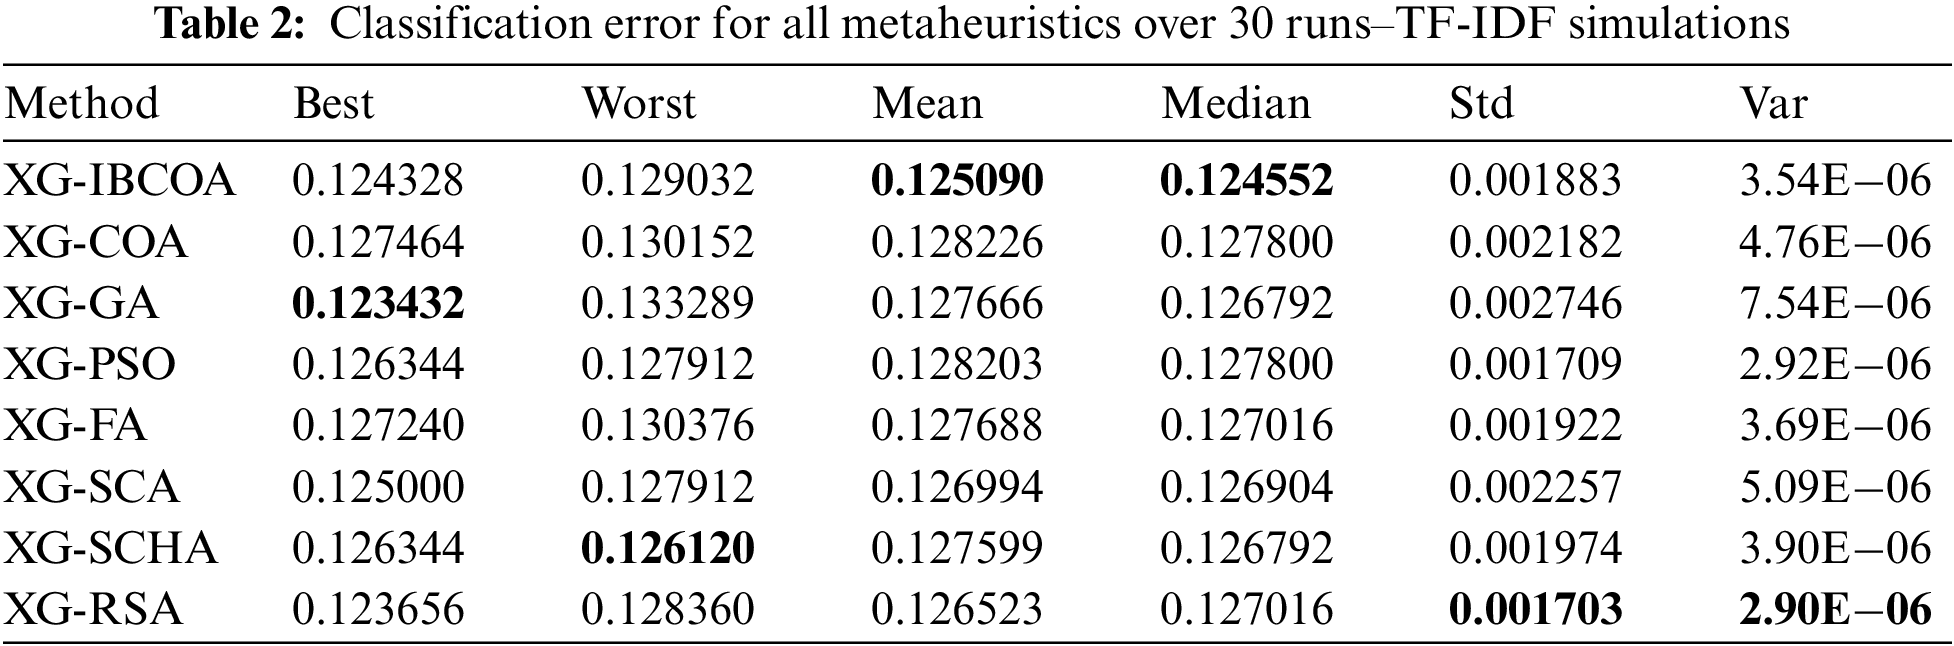
Table 2 reports the lowest scores of the XG-IBCOA for the mean and median categories exhibiting stability. The XG-GA had the best results for the best category, the second best was XG-SCHA, and the XG-IBCOA provided the third best results. In the worst category, the XG-IBCOA was placed behind the XG-PSO and XG-SCA, which had the same results, and the XG-SCHA, which had the best obtained result in this category. Standard deviation and variance were dominated by the RSA algorithm.
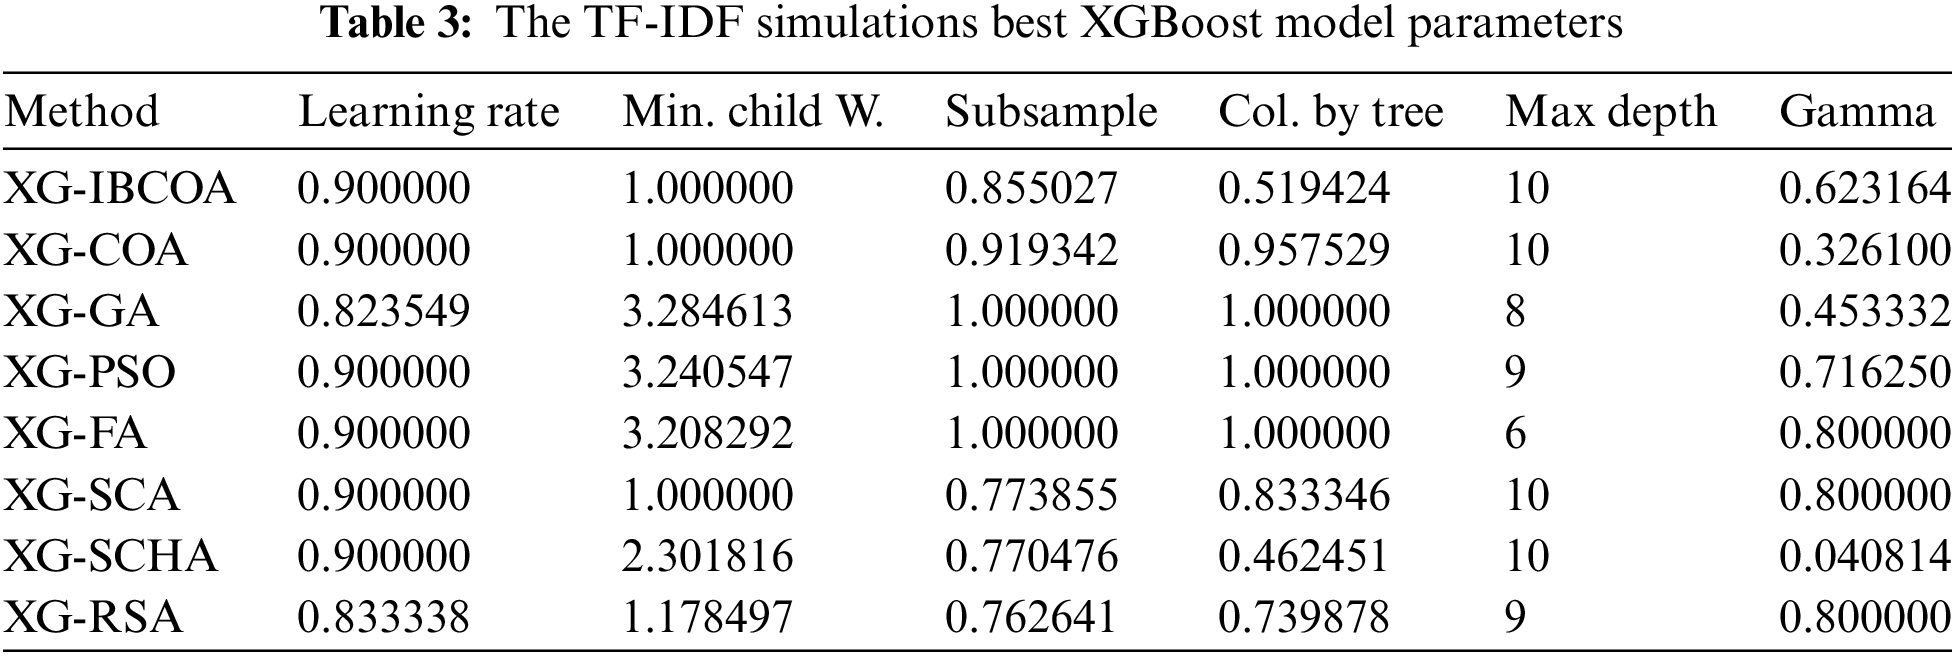
The best-obtained parameter sets for each applied metaheuristic are reported in Table 3 to enable experiment repetition.
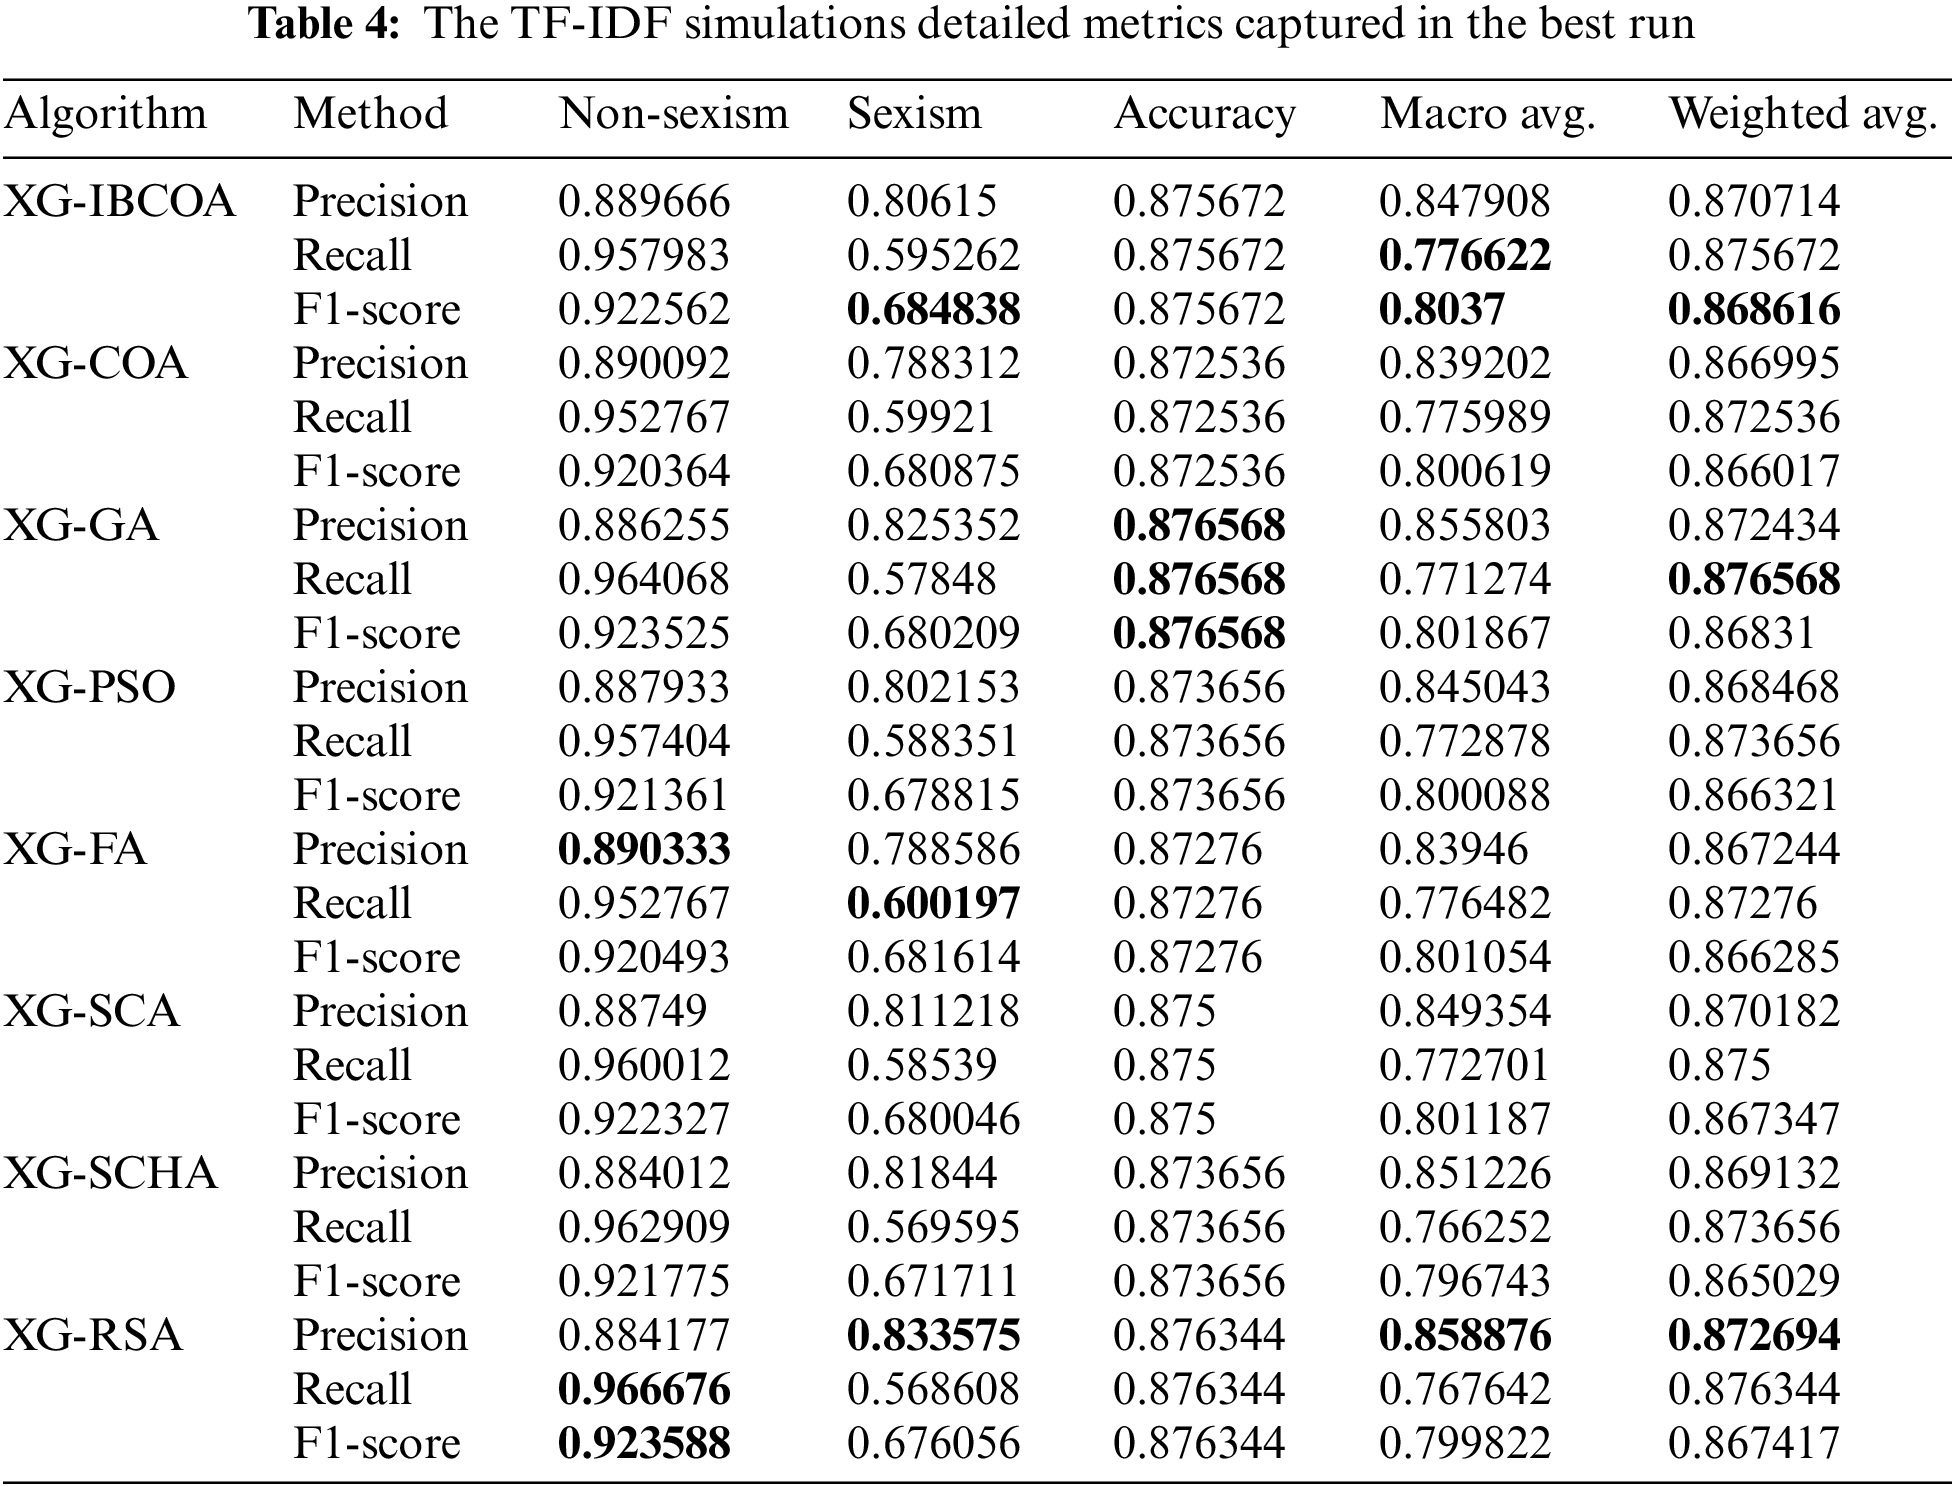
Detailed metrics per each class for the best run are shown in Table 4. The best precision for the no-sexism class is obtained by XG-FA, while the recall and F1-score categories had the best results with the XG-RSA solution. The original COA had better precision than the proposed solution only in the precision category for the no-sexism class. The best score for precision on the harassment class was obtained by the XG-RSA, while the XG-FA had the best recall and the XG-IBCOA had the best F1-score. A better recall score was obtained by the XG-COA than the XG-IBCOA, but the proposed solution had a better F1-score. The best score for accuracy across all three categories was provided by the XG-GA, but the IBCOA outperforms the original COA optimizer across all three categories. The best recall and F1-score were obtained by the XG-IBCOA for the macro-average metric, while the best precision for this category was obtained by the XG-RSA, with the XG-GA coming in second place. For the weighted average metric, the XG-RSA had the best precision, the XG-GA had the best recall, and the XG-IBCOA the best F1-score. Finally, the XG-IBCOA obtained the best F1-score for the weighted average category.
The XG-IBCOA BERT-based approach achieved slightly worse results compared to those obtained by applying the TF-IDF technique according to the confusion matrix reported in Fig. 12. The true negative rate was 95.2%, while the false positive rate was 4.8%. The classification of the sexism class was the issue, just like with the TF-IDF approach. The false negative rate was 43%, and the true positive rate was 57%, again providing slightly worse results than with the TF-IDF-based approach. This proves that the harmful content of this type is tough to distinguish, but when it is absent, the classification of negative cases is precise.
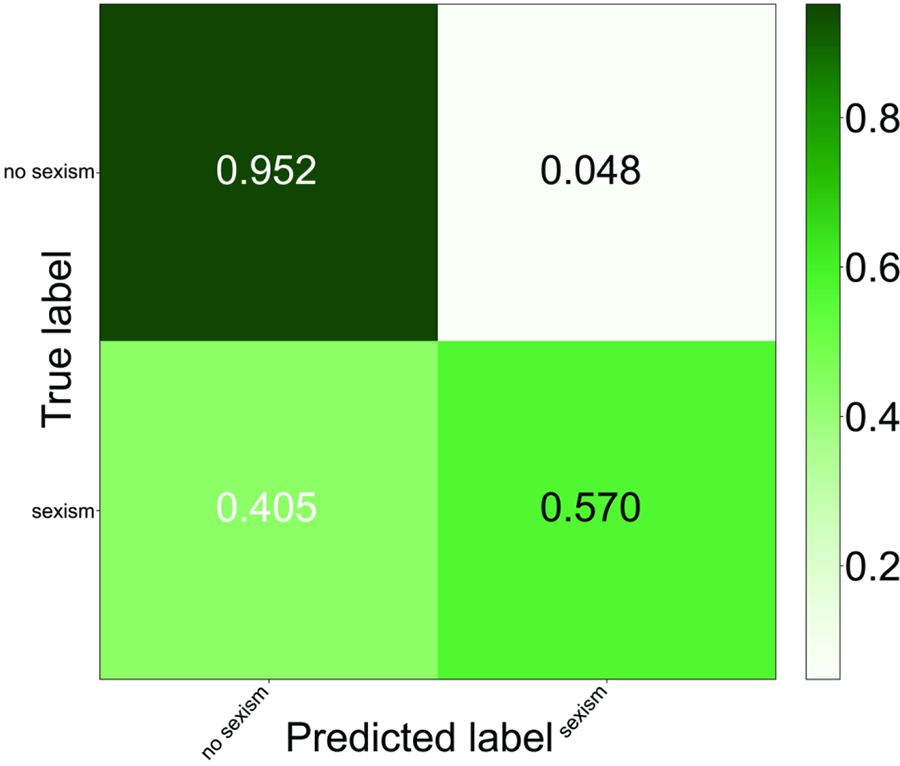
Figure 12: The IBCOA XGBoost tuning with BERT confusion matrix
The distribution of classification errors in the form of box and whiskers and objectives in the form of violin plot diagrams over 30 runs are depicted in Figs. 13 and 14, respectively. From the presented figures can be seen that the IBCOA and SCA managed to establish the best values for the error indicator, while the basic COA proved the most robust approach managing to generate the lowest mean value. The IBCOA outperformed other methods in terms of objective function.
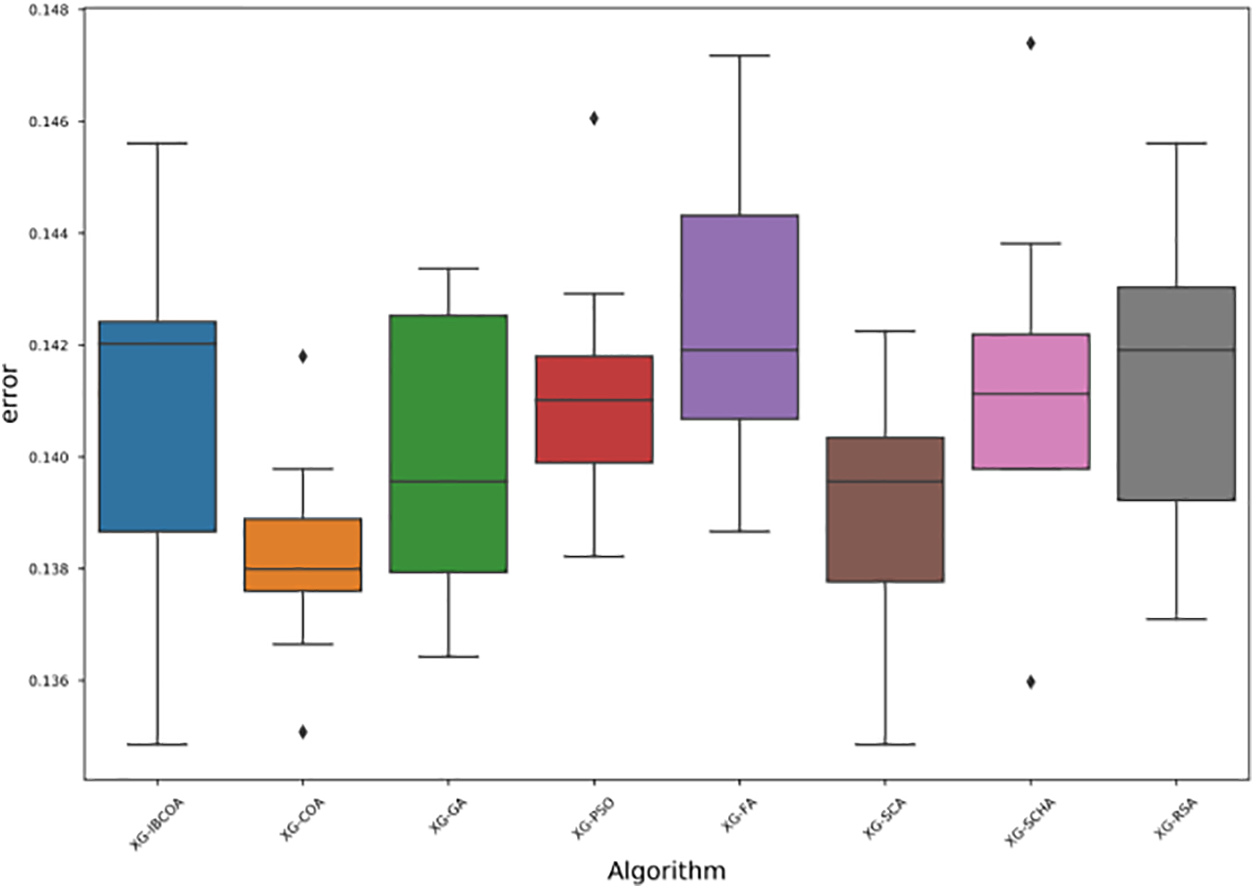
Figure 13: The BERT simulations error box-plot diagram
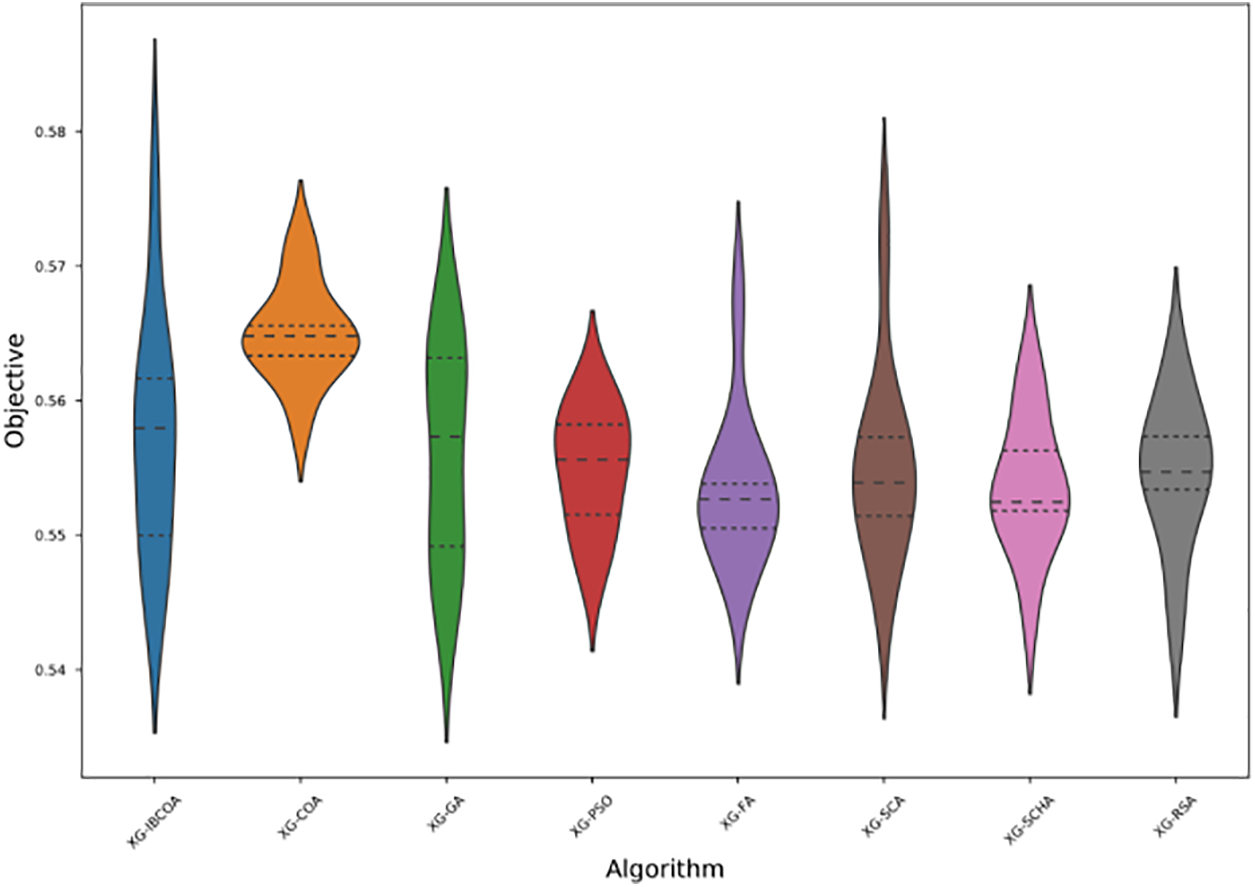
Figure 14: The BERT simulations objective violin-plot diagram
The error convergence graph in Fig. 15 and the objective convergence graph in Fig. 16 for the best run indicate the overall stable performance of the proposed solution. Regarding XG-IBCOA, it can be observed that the model gradually improves solutions over iterations and that it exhibits a solid convergence rate. Other methods also converge during 10 iterations, albeit at a slower pace than the IBCOA.
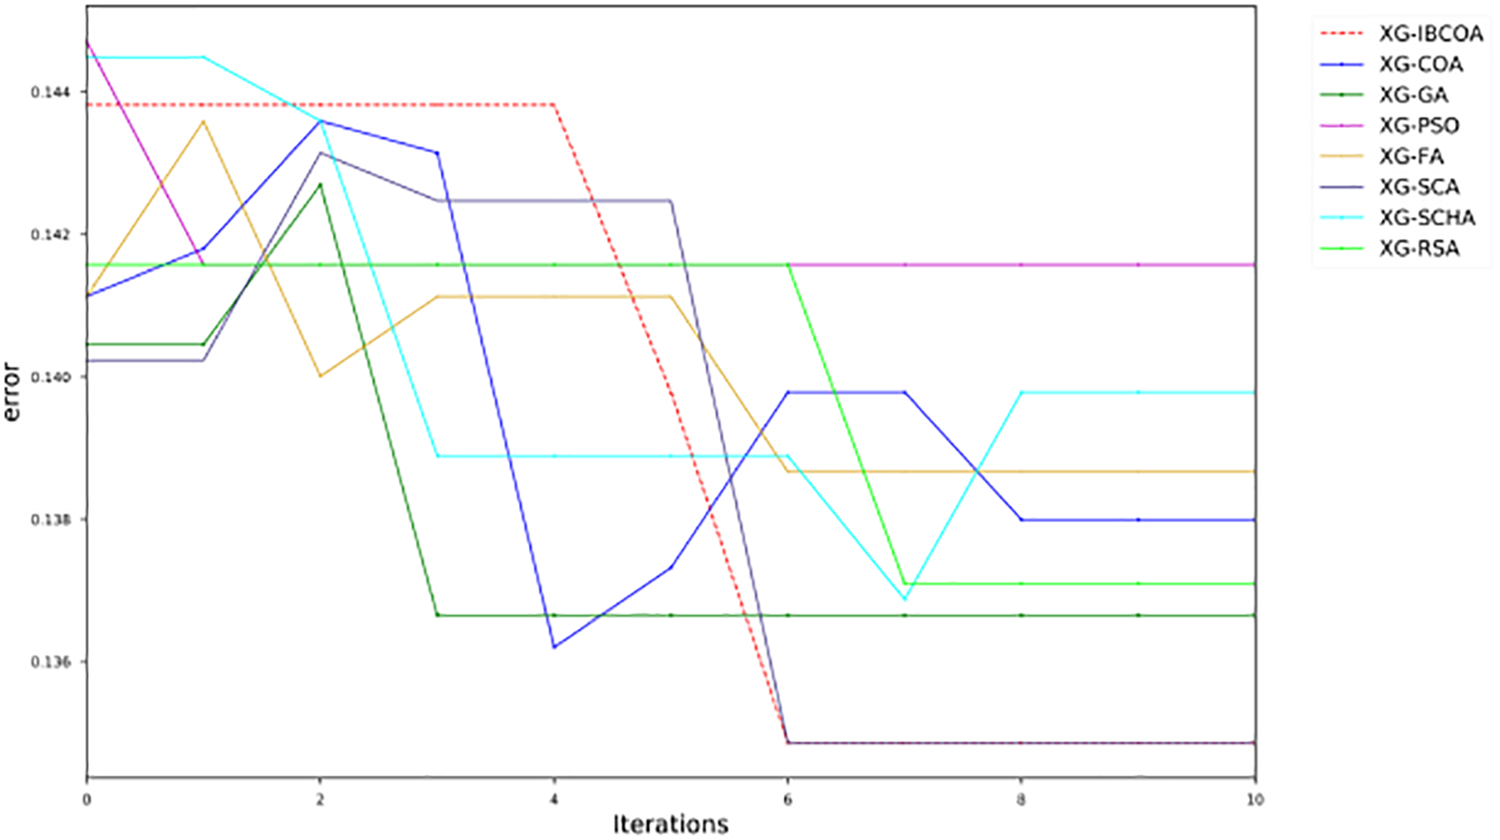
Figure 15: The BERT simulations error convergence graphs in the best run of all methods
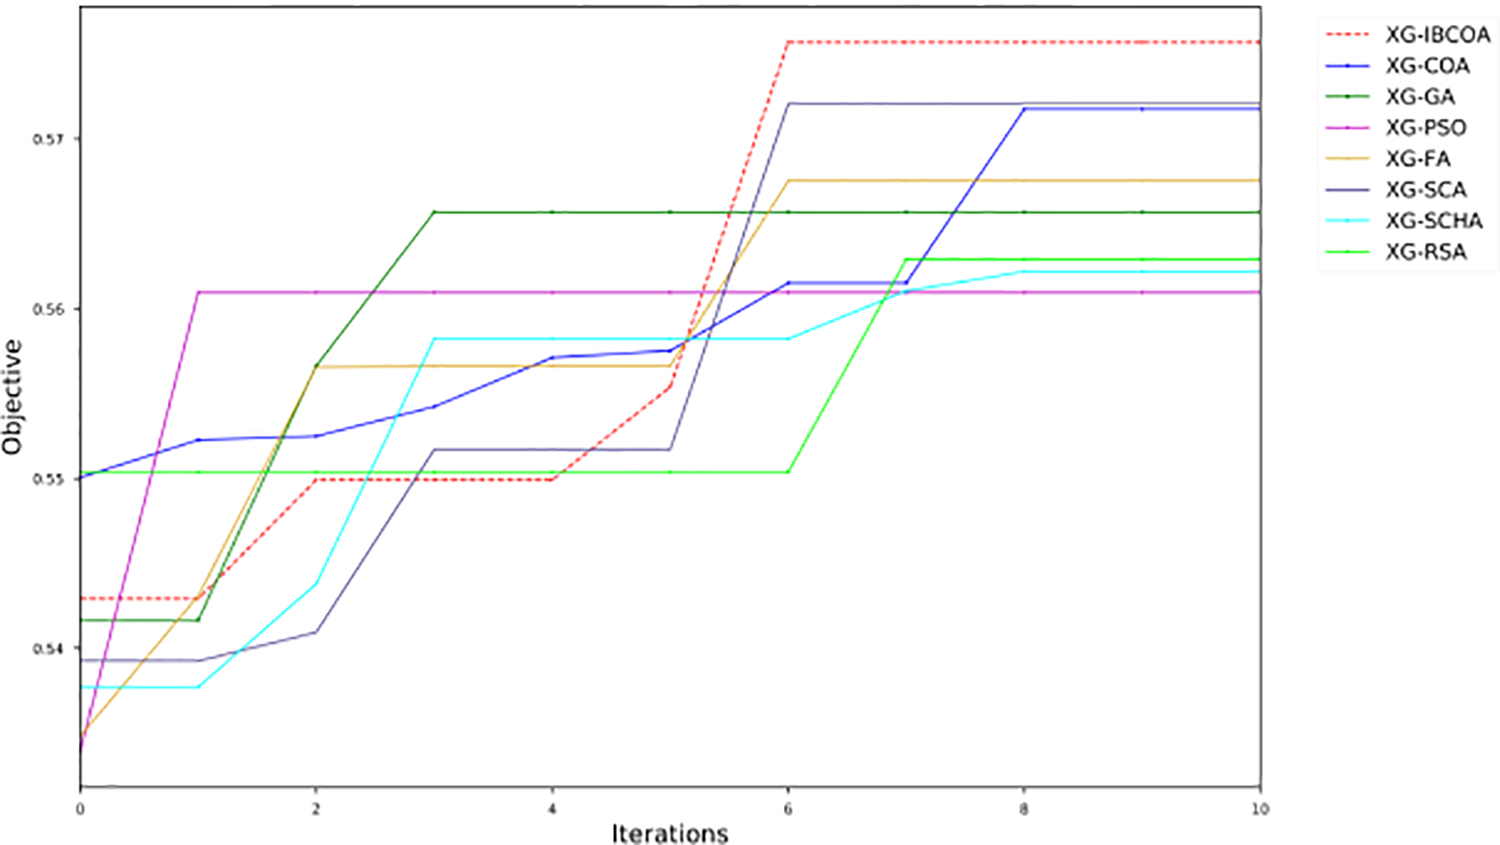
Figure 16: The BERT simulations objective convergence graphs in the best run of all methods
The diversity of population in the final iteration of the best run for both objective and error is shown in Figs. 17 and 18, respectively. It is interesting to notice that, conversely to TF-IDF experimentation, the population diversity of IBCOA is higher, and, from this, a conclusion can be drawn that not all individuals managed to converge toward an optimum. Nonetheless, the diversity of IBCOA is still better than those of other metaheuristics.
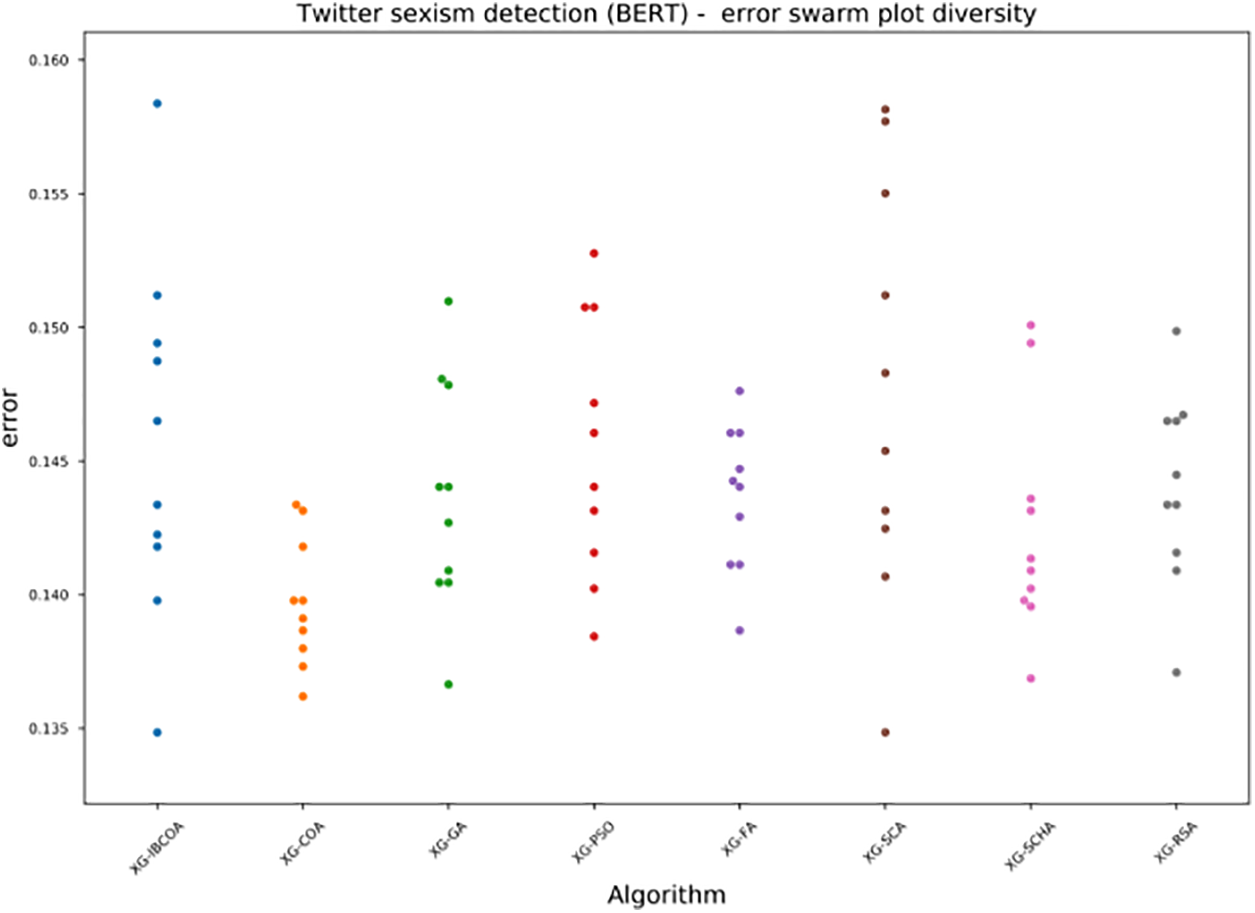
Figure 17: The BERT simulations error swarm-plot diversity
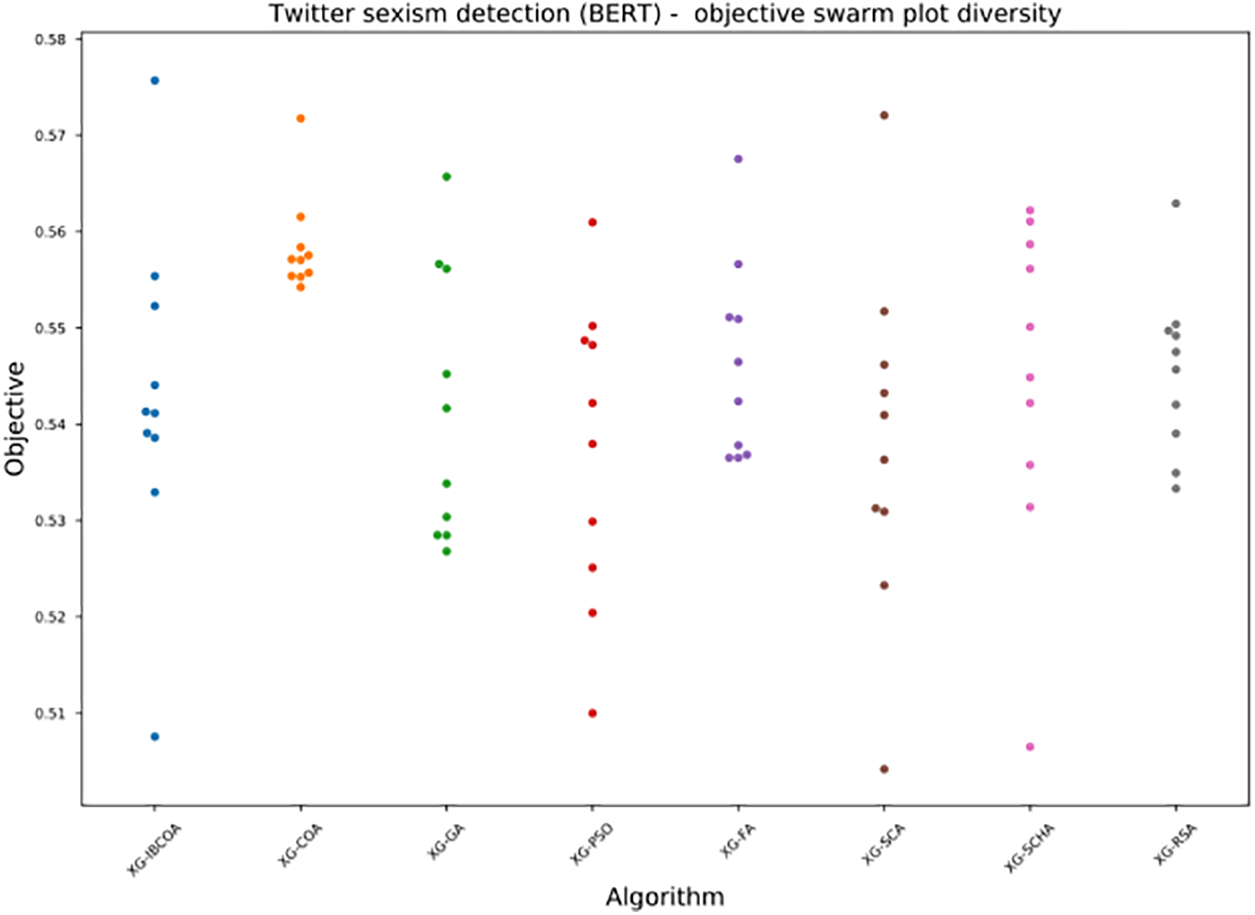
Figure 18: The BERT simulations objective swarm-plot diversity
Finally, the PR curve for XG-IBCOA, shown in Fig. 19, displays a higher score than with the TF-IDF solution for the no-sexism average precision of 95.6%, marginally lower average precision with sexism class of 73.8%, and a slightly better value for micro-average precision of 92.7%.
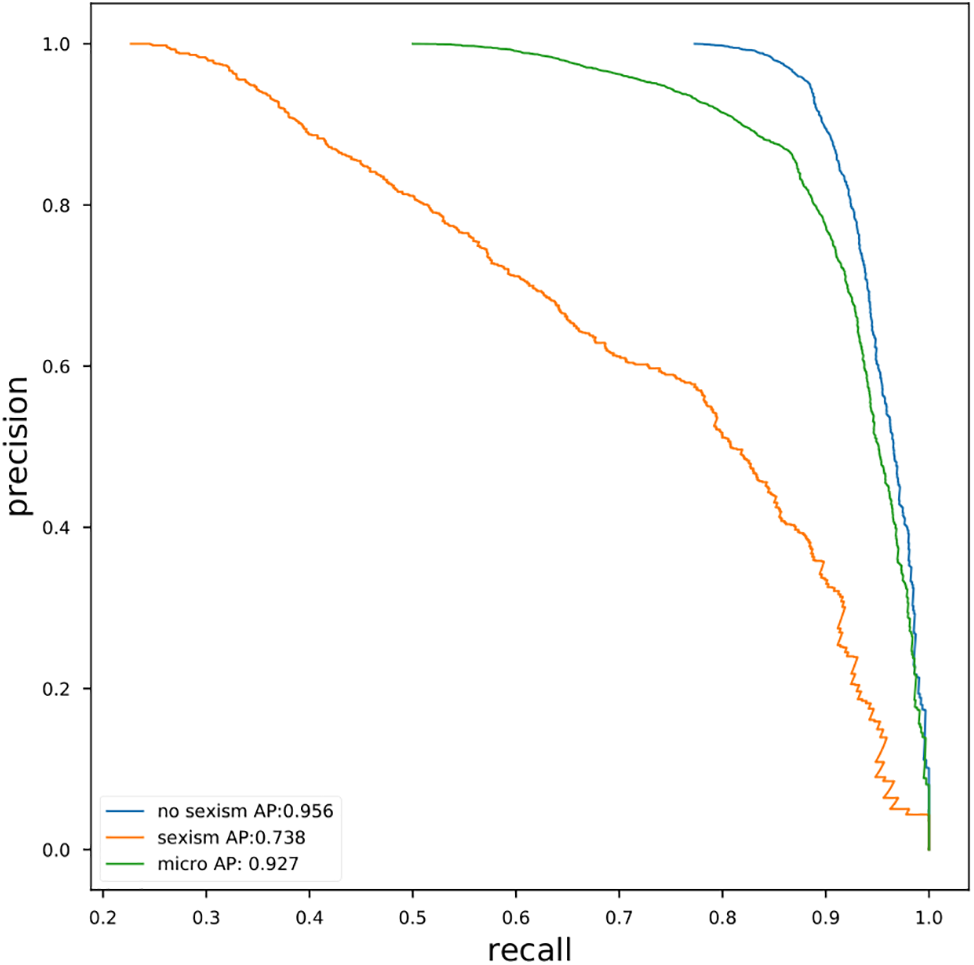
Figure 19: BERT simulations PR curve obtained by XG-IBCOA
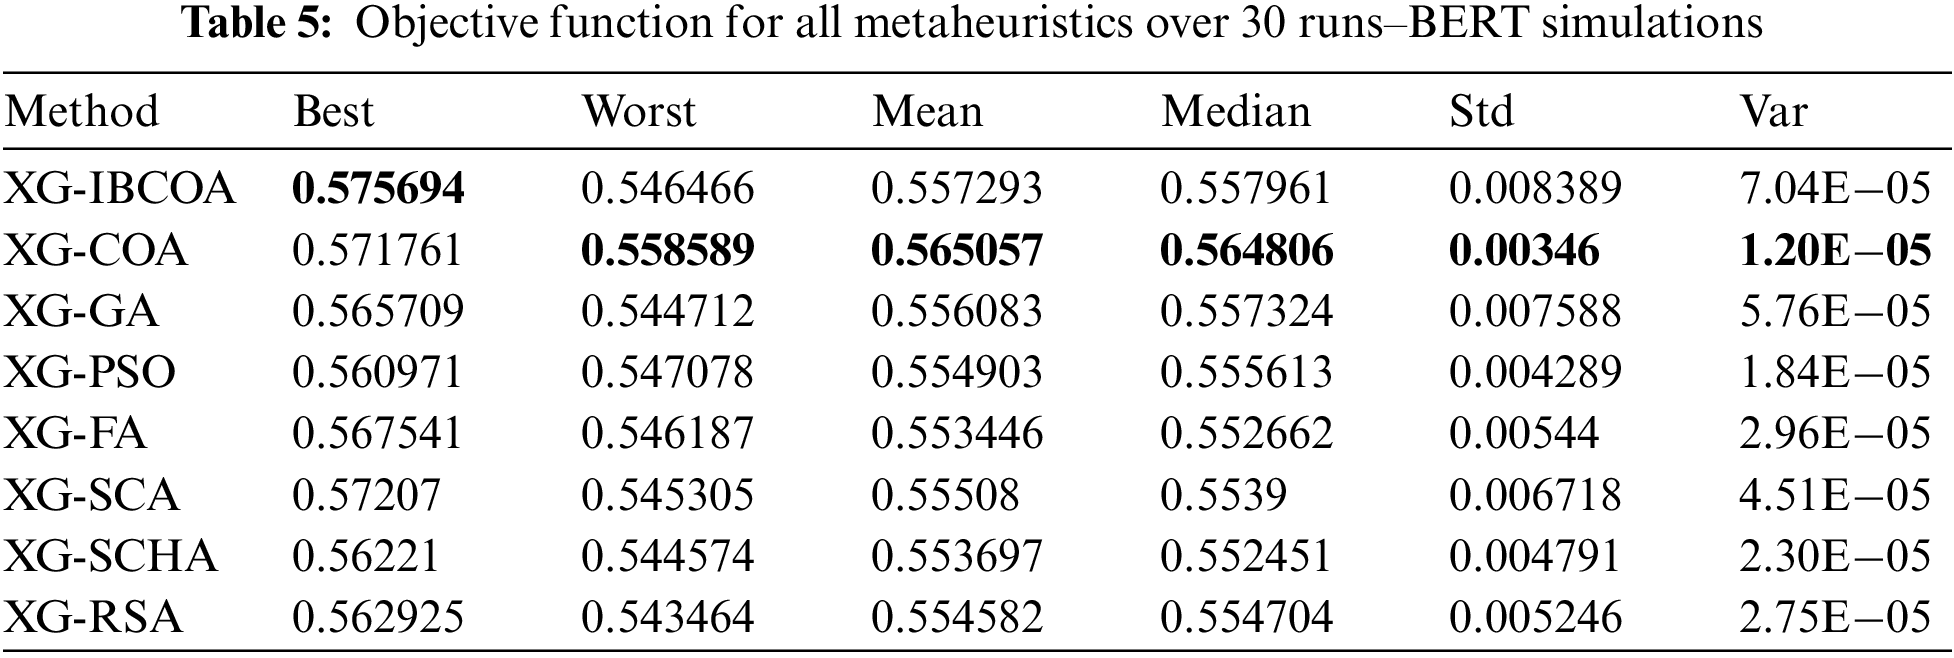
The results of the objective function (Cohen kappa score) in terms of best, worst, mean, median, standard deviation, and variance over 30 runs are reported in Table 5, while the same metrics for classification error are shown in Table 6, for BERT experiments. The best objective function value was achieved by the proposed IBCOA metaheuristics, while for all other indicators, the basic COA proved to be the best optimizer, as seen in the provided table. This stems from the NFL theorem–the IBCOA managed to overcome some deficiencies of the original COA, while, at the same time, some capabilities of the original method were worsened.
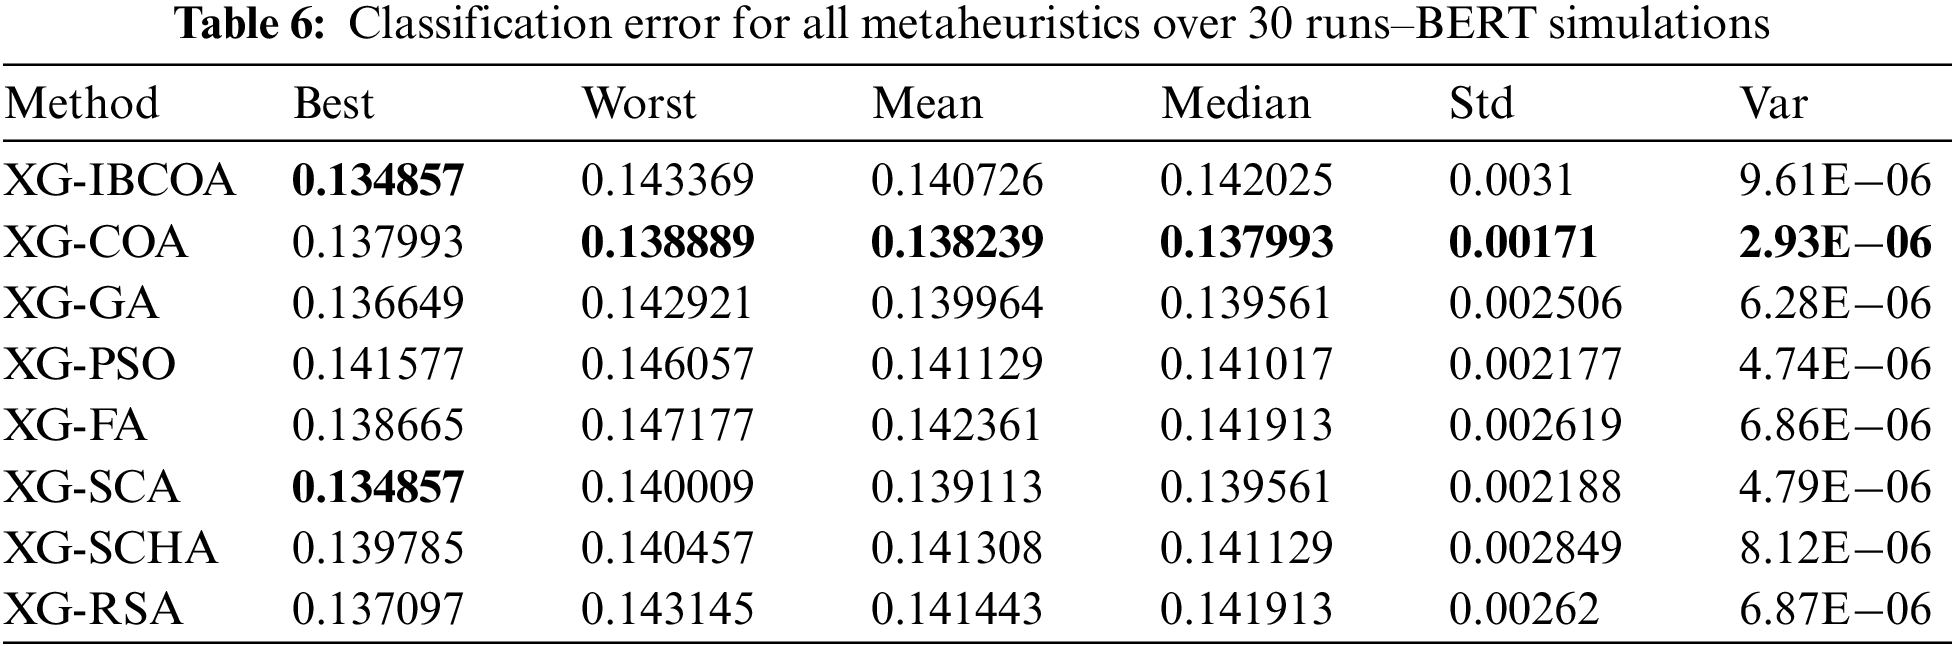
The indicator function (classification error) shows similar outcomes as for the objective, and those results are reported in Table 6.
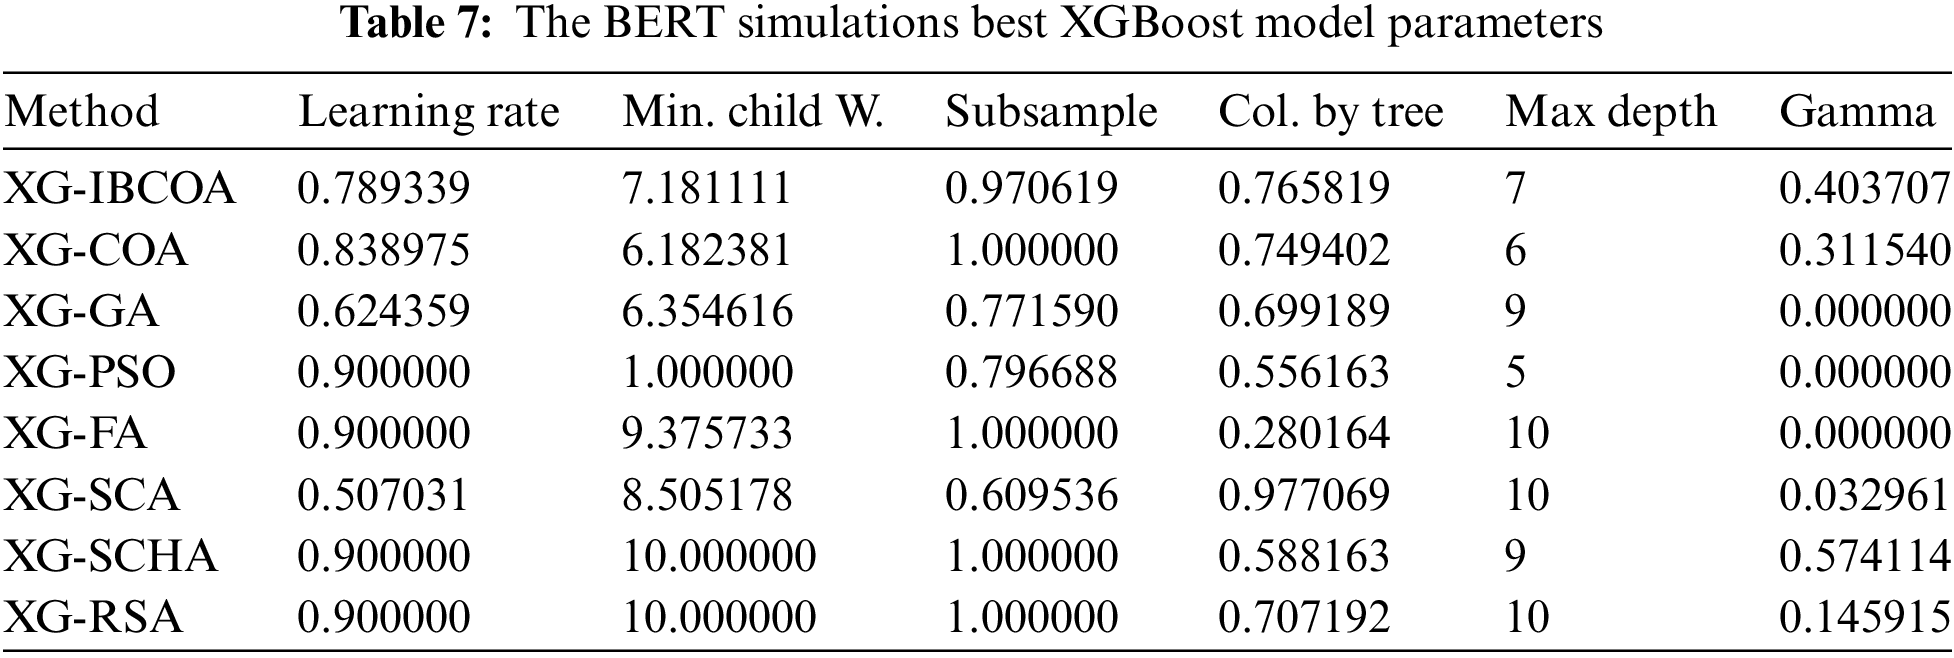
The best-selected sets of hyperparameters for the best models are exhibited in Table 7.
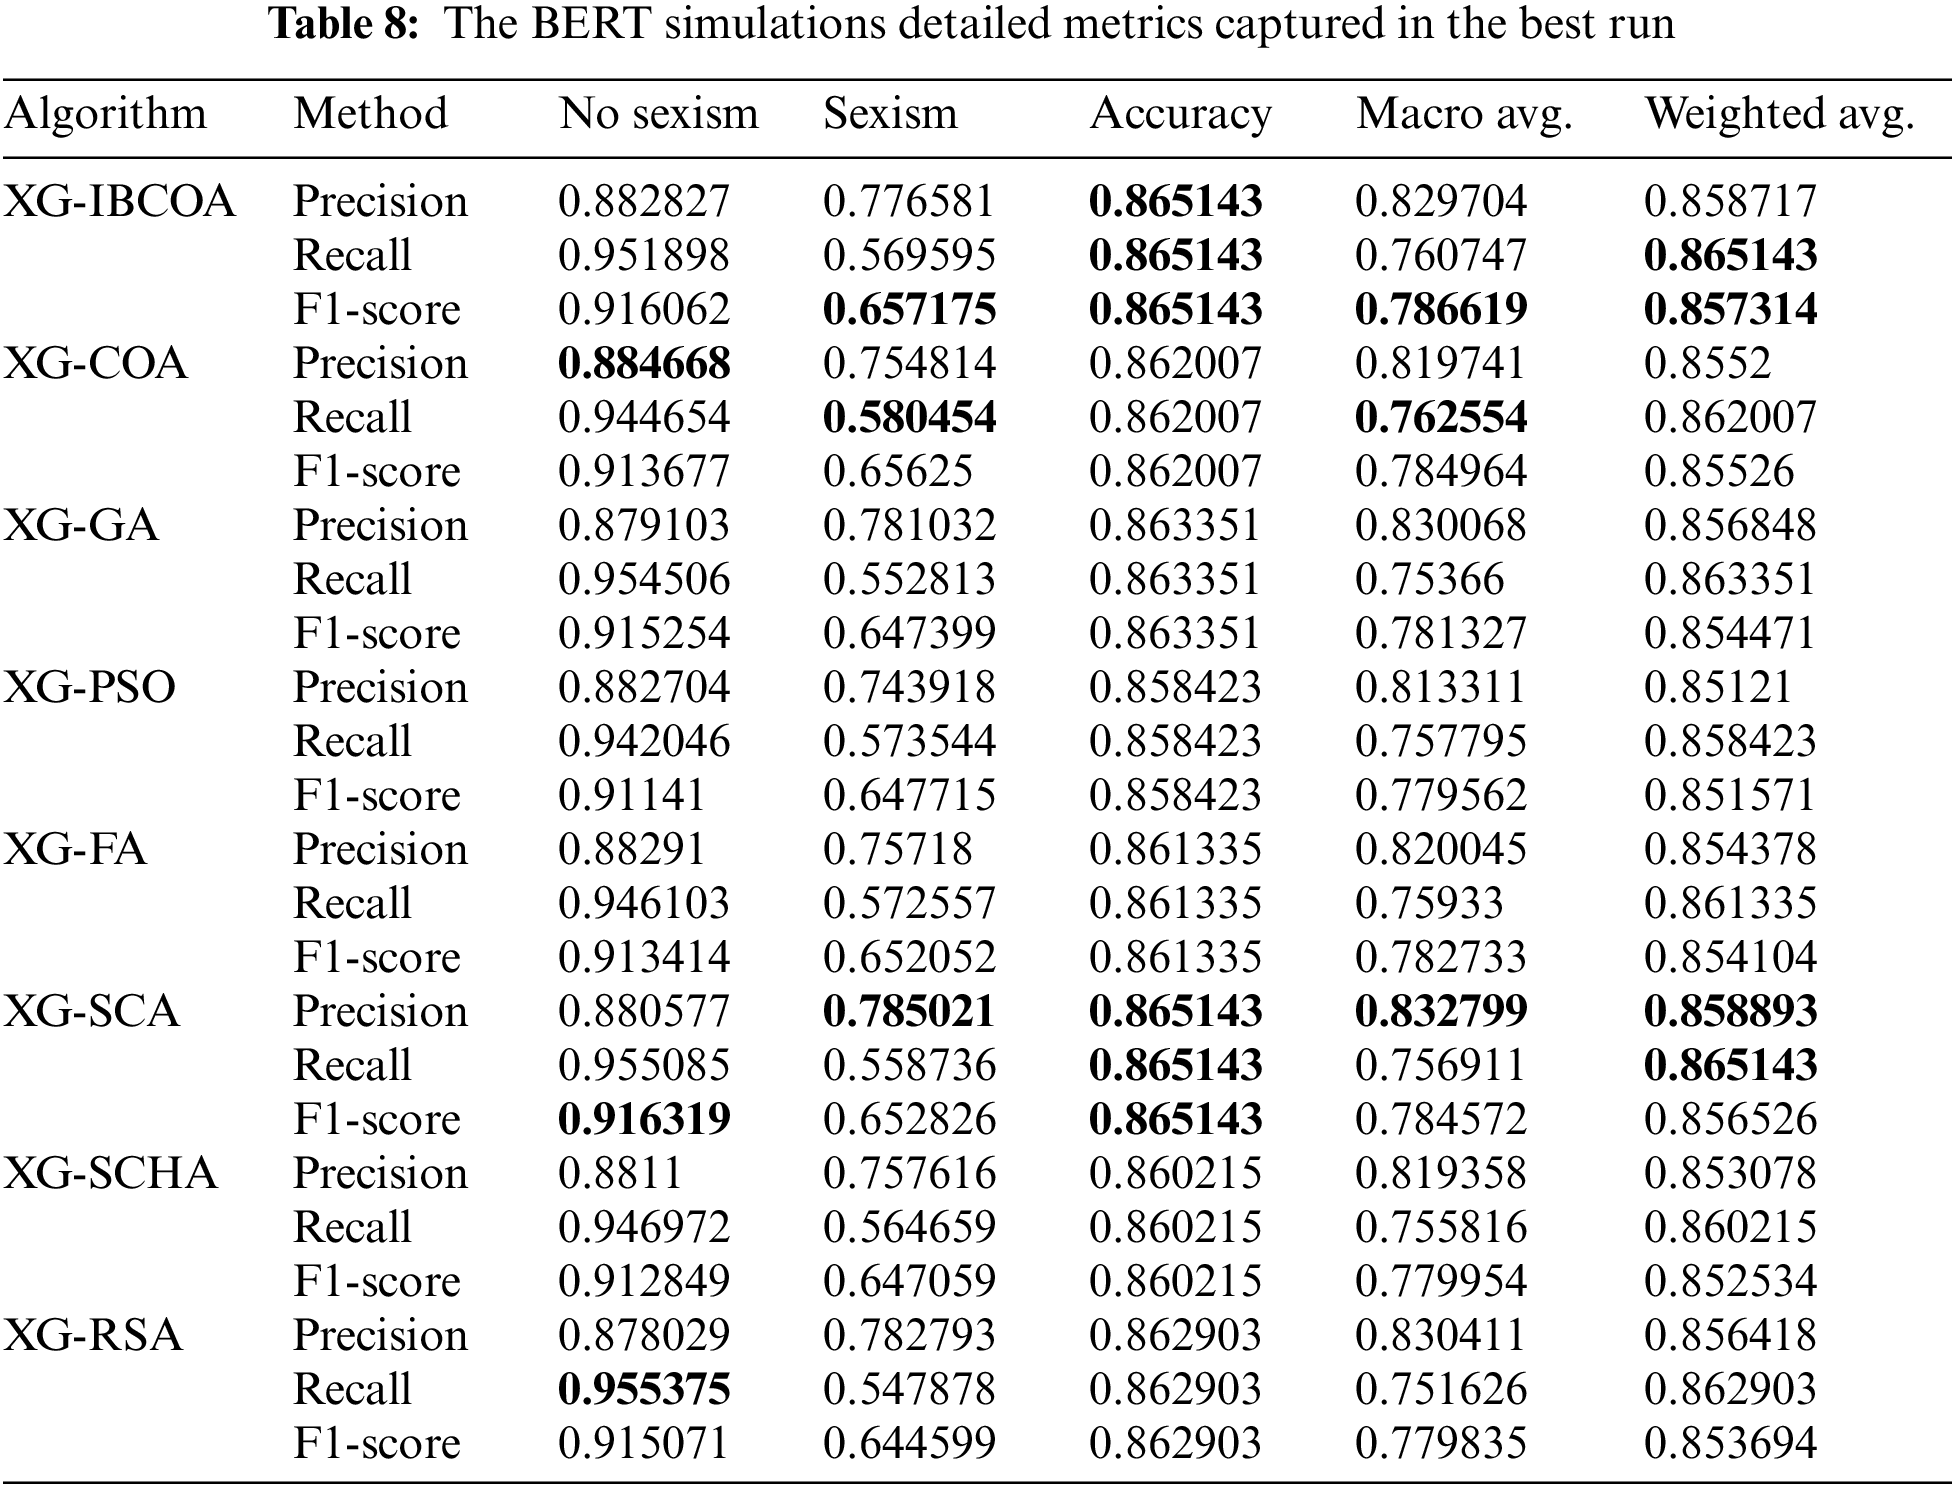
Detailed metrics per each class for the best run are visible in Table 8. The proposed solution had the best scores for sexism class F1-score, the best accuracy across all three reported metrics, the best F1-score for the macro average, and the recall and F1-score for the weighted average. The best scores for the no-sexism class are obtained by the XG-FA for the precision metric, the best recall by the XG-RSA, and the XG-SCA for the F1-score. The best results for the sexism class are obtained by the XG-COA for the recall category, and by the XG-SCA for precision. The XG-SCA obtains equal performance as the XG-IBCOA for all categories for accuracy. The best recall for the macro-average is provided by the XG-COA, while the best precision is by XG-SCA. The best precision in the weighted average is obtained by the XG-SCA, while it shares the best score for the recall metric with the XG-IBCOA.
4.3 Overall Conclusion, Statistical Validation and Best Model Results Interpretation
In summary, the proposed IBCOA consistently outperformed all other cutting-edge metaheuristics in both experiments. It is noteworthy that most classifiers showed improved performance when using the TF-IDF technique for text processing. The highest accuracy of 87.66% was achieved by XG-IBCOA with TF-IDF, slightly surpassing the accuracy obtained with BERT (86.51%). Accuracy alone can sometimes be misleading, however, especially with imbalanced datasets like the one used here. Interestingly, similar conclusions were drawn when comparing Cohen’s kappa scores, which consider class imbalance. In this regard, the best scores achieved were 0.6096 with TF-IDF and 0.5757 with BERT experiments.
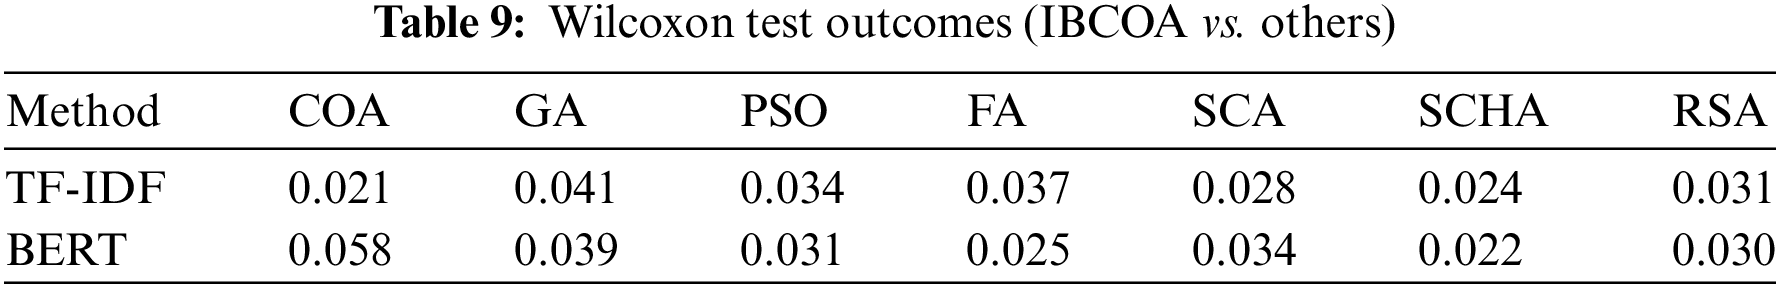
Statistical tests were conducted to evaluate whether the outcomes attained by the suggested IBCOA method were statistically significant. A Shapiro–Wilk test was applied to both experiments, and it was determined that the results did not originate from the normal distribution. Thus, it was not safe to proceed with parametric tests. Instead, the Wilcoxon non-parametric test was conducted, and the resulting outcomes are shown in Table 9. The outcomes show that the performance of introduced IBCOA is statistically significantly better than other algorithms in the case of TF-IDF simulations, as obtained p-values are less than threshold of 0.05. In the case of the BERT experiments, IBCOA is significantly better than all algorithms except COA (p-value 0.058).
Considering both conducted experiments, the best accuracy was obtained by the XG-IBCOA in the TF-IDF simulations. Also, overall for both simulations, proposed IBCOA metaheuristics outscored all other methods in terms of most performance indicators and convergence speed, including the original COA. It is also necessary to state that all metaheuristics algorithms included in the experiments obtained respectable results, in terms of high accuracy, recall, and other metrics. When observing all metrics together, it can be concluded that the proposed approach can successfully identify cyberbullying accurately, with considerable potential for practical use.
Finally, to get more insights into the feature’s effect on the model performance, the best model generated by XG-IBCOA with the TF-IDF technique was subjected to results’ interpretation using the SHAP methodology.
The most significant features according to the SHAP analysis, provided in Fig. 19 (left), are “sexist,” “rt,” “kat,” and “co,” while the features with a moderate influence are “mkr,” “notsexist,” and “girls.” Features with high influence can sway model classification in a more significant way. The presence or absence of a feature influences a model’s decision more the higher the importance is. Analysis outcomes are dataset and model-specific, and, in this case, the presence of terms like “sexist” suggests that a comment has a higher probability of being classified as “sexist.” Terms like “rt,” “mkr,” and “rt” are dataset-specific. Namely, the “mkr” is a hashtag associated with a popular Australian cooking show, “My Kitchen Rules,” with Kat being one of the contestants. The presence of these terms suggest that a comment is not considered sexist harassment. The “co” token is often associated with URL links present in Twitter posts. The presence of this keyword is often associated with advertisements in posts and the presence of this keyword decreases the probability of a post’s being sexist from the model’s perspective. The rest of the features provide a lower influence on the prediction.
The individual prediction local analyses are provided in Fig. 20 (right). In the first prediction, the outcome of the prediction is positive being classified as sexist. The “sexist” feature had the most influence on this prediction, while “rt” and “to” follow behind. The second prediction indicates similar results where the “rt” feature had the most influence, followed by the “sexist” feature. The third prediction indicates once again the highest influence of the same features as previously. The fourth prediction reported shows a negative classification, indicating the no-sexism class. The fifth prediction indicates that the features “this,” “there,” and “sexist” contributed most to the positive prediction. The final prediction that is reported shows that the features like “islam,” “muslims,” and “understand” have a high influence on the prediction.
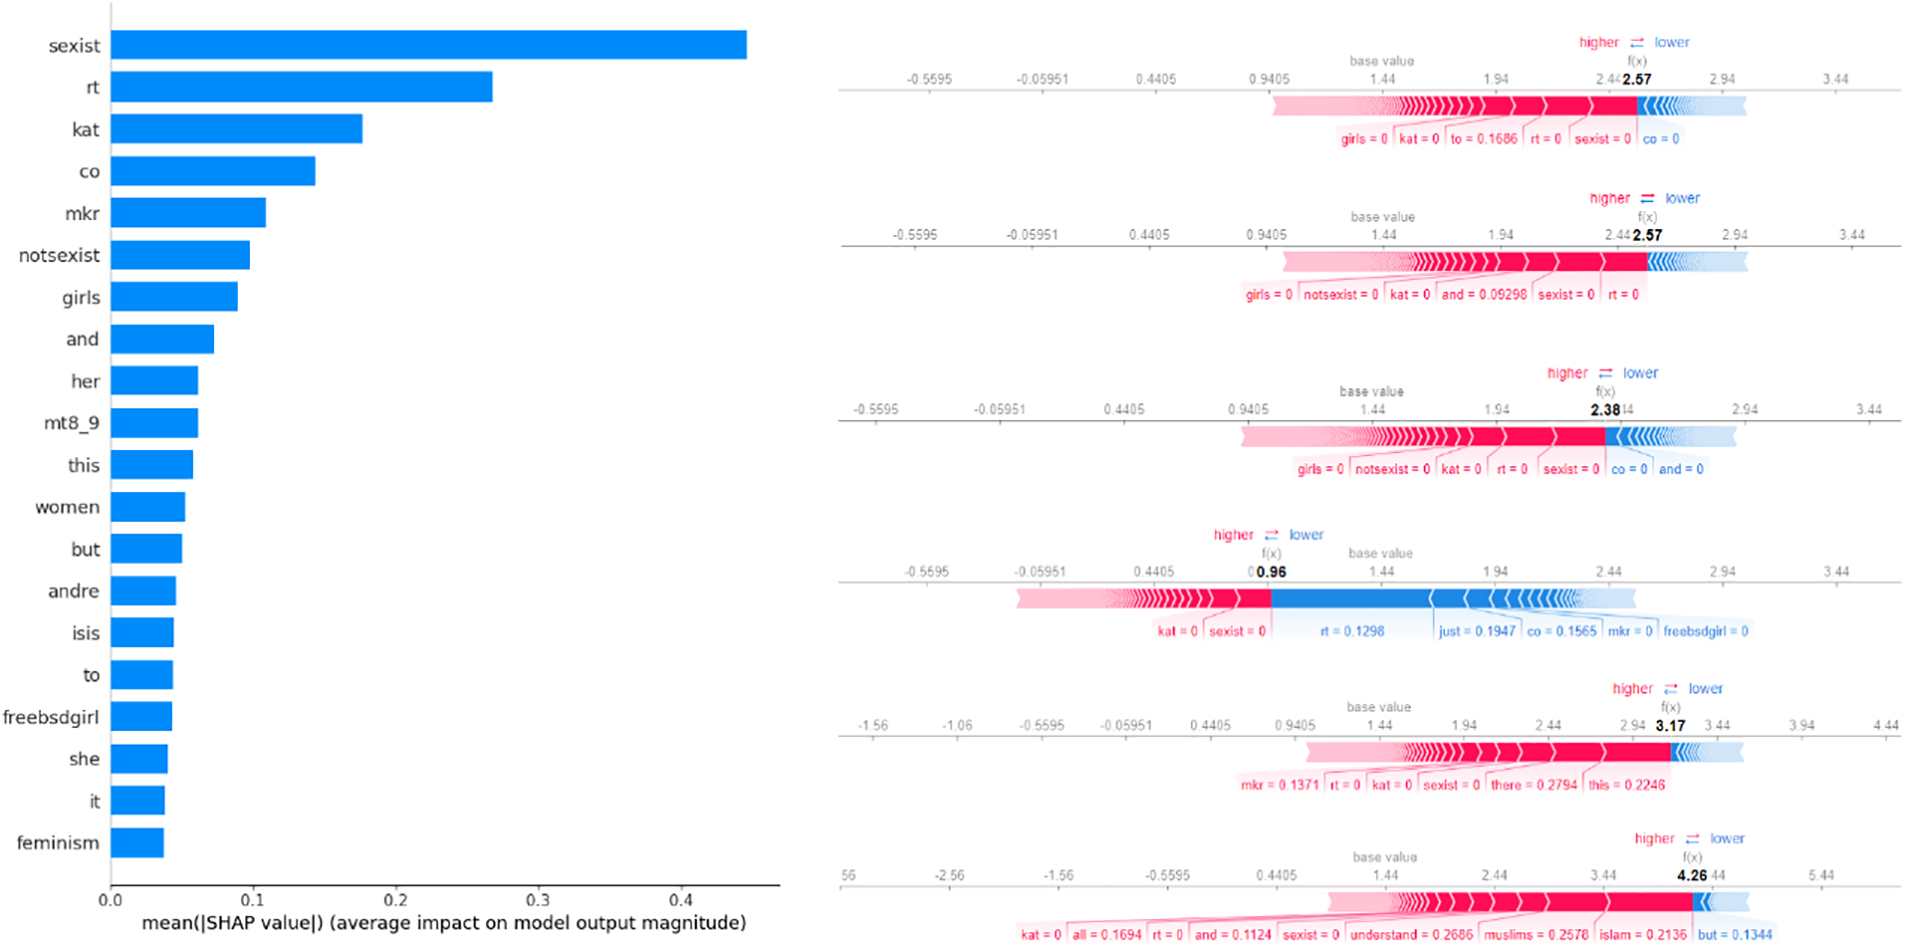
Figure 20: SHAP analysis of feature impact for the best model (XG-IBCOA for TF-IDF)
Global importance interpretation can improve data-collection and-screening systems. Running models on all the generated data can be taxing and computationally expensive. Focusing on comments that contain significant keywords, however, can help address higher-priority comments earlier while reducing processing costs for comments with terms that are unlikely to be flagged. Local interpretation can help shed insight on the importance of each term in the context of a single comment’s helping moderators justify their decision to flag a certain comment in cases of an appeal.
The primary objective of the research presented in this manuscript was to address the growing challenge of cyberbullying in the form of sexist harassment. For this purpose, the Twitter sexist-harassment dataset, which includes tweets about sexual harassment, was used for NLP. Two algorithms were employed to transform text into meaningful numerical representations for ML input: TF-IDF and BERT. The well-known XGBoost ML model was used to classify whether specific tweets fall into the category of sexual harassment. Additionally, to achieve better performance, several XGBoost models were developed with hyperparameter tuning using metaheuristics. Moreover, for the purpose of the presented research, the recently proposed COA metaheuristic was modified and adapted for XGBoost model optimization. Inspired by the incorporated changes, the proposed algorithm was named IBCOA.
Two experiments were performed, one with XGBoost tuning using TF-IDF and the other by using the BERT MLP technique. Other cutting-edge metaheuristic approaches were also implemented, and a rigorous comparative analysis of classification metrics (accuracy, Cohen’s kappa score, precision, recall, and F1-score) was conducted. As an overall conclusion, the proposed IBCOA achieved on average the best performance and outscored all other approaches included in the comparative analysis. Also, the best-generated model was interpreted using the SHAP methodology, providing valuable insights into the behavioral patterns of individuals who engage in social harassment.
The classification research results shown in this study contribute significantly to the detection and prevention of sexist-harassment cyberbullying in practical ways, including: (a) models trained on sexist cyberbullying and other cyberbullying datasets can accurately identify instances of cyberbullying, distinguishing them from normal online interactions. This capability enables timely detection and intervention, preventing the escalation of harmful behaviors; (b) automated classification systems, like the one proposed in this study, can process large volumes of textual data from social-media platforms, messaging apps, and forums in almost real time. This scalability allows for continuous monitoring and a prompt response to sexist cyberbullying incidents across diverse online environments; (c) by flagging potentially harmful content early, classification models facilitate swift intervention by moderators, parents, educators, or platform administrators. Early intervention is crucial for supporting victims, educating offenders, and mitigating the effect of cyberbullying. The most important limitations of the proposed research, which also represent potential directions for upcoming work in this area, include validation on other datasets, which are freely available on, e.g., the Kaggle and UCL repositories, optimization of other standard ML and DL models for this challenge, and simulations with other variants of COA metaheuristics. There are also, however, other limitations worth mentioning. For example, detecting nuanced forms of sexist cyberbullying harassment often requires understanding context, sarcasm, irony, or cultural references, which can be challenging for ML models trained on text data alone. Also, ML models trained on user-generated content may raise privacy concerns, as they involve analyzing personal communications and behaviors. Finally, models trained on data from one platform or language may not generalize well to others due to differences in user behavior, language nuances, cultural norms, and platform-specific features. Some of the mentioned challenges and limitations will be addressed as part of future research endeavors in this area.
Acknowledgement: Research was supported by the Science Fund of the Republic of Serbia.
Funding Statement: This research was supported by the Science Fund of the Republic of Serbia, Grant No. 7373, Characterizing Crises-Caused Air Pollution Alternations Using an Artificial Intelligence-Based Framework-crAIRsis and Grant No. 7502, Intelligent Multi-Agent Control and Optimization applied to Green Buildings and Environmental Monitoring Drone Swarms-ECOSwarm.
Author Contributions: Methods implementation and simulations: Nebojsa Bacanin, Miodrag Zivkovic, Tamara Zivkovic and Luka Jovanovic; study conception and design: Milos Dobrojevic, Nebojsa Bacanin, Miroslav Cajic and Suresh Muthusamy; analysis and interpretation of results: Lepa Babic and Suresh Muthusamy; draft manuscript preparation: Milos Antonijevic, Luka Jovanovic and Miroslav Cajic; review and editing: Nebojsa Bacanin, Tamara Zivkovic, Luka Jovanovic and Miroslav Cajic. All authors reviewed the results and approved the final version of the manuscript.
Availability of Data and Materials: The data that supports the findings of this study is openly available on Kaggle: https://www.kaggle.com/datasets/saurabhshahane/cyberbullying-dataset (accessed on 13 May 2024).
Ethics Approval: Not applicable.
Conflicts of Interest: The authors declare that they have no conflicts of interest to report regarding the present study.
References
1. A. Oksanen, R. Oksa, N. Savela, M. Kaakinen, and N. Ellonen, “Cyberbullying victimization at work: Social media identity bubble approach,” Comput. Hum. Behav., vol. 109, Aug. 2020, Art. no. 106363. doi: 10.1016/j.chb.2020.106363. [Google Scholar] [CrossRef]
2. O. Stetsyk and S. Terenchuk, “Model development of the system for avoiding Echo Chambers in social networks,” Manag. Develop. Complex Syst., vol. 57, pp. 77–82, Mar. 2024. doi: 10.32347/2412-9933.2024.57.77-82. [Google Scholar] [CrossRef]
3. S. Kim, S. R. Colwell, A. Kata, M. H. Boyle, and K. Georgiades, “Cyberbullying victimization and adolescent mental health: Evidence of differential effects by sex and mental health problem type,” J. Youth Adolesc., vol. 47, no. 3, pp. 661–672, 2018. doi: 10.1007/s10964-017-0678-4. [Google Scholar] [PubMed] [CrossRef]
4. R. Kota and E. Selkie, “Cyberbullying and mental health,” in Technology and Adolescent Mental Health, M. Moreno, A. Radovic, eds, Cham: Springer, 2018, pp. 89–99. doi: 10.1007/978-3-319-69638-6_7. [Google Scholar] [CrossRef]
5. A. M. Giménez Gualdo, S. C. Hunter, K. Durkin, P. Arnaiz and J. J. Maquilón, “The emotional impact of cyberbullying: Differences in perceptions and experiences as a function of role,” Comput. Educ., vol. 82, no. 2, pp. 228–235, 2015. doi: 10.1016/j.compedu.2014.11.013. [Google Scholar] [CrossRef]
6. N. Agustiningsih, A. Yusuf, and A. Ahsan, “Relationships among self-esteem, bullying, and cyberbullying in adolescents: A systematic review,” J. Psychosoc. Nurs. Ment. Health Serv., vol. 62, no. 5, pp. 11–17, May 2024. doi: 10.3928/02793695-20231013-01. [Google Scholar] [PubMed] [CrossRef]
7. A. E. Fahy, S. A. Stansfeld, M. Smuk, N. R. Smith, S. Cummins and C. Clark, “Longitudinal associations between cyberbullying involvement and adolescent mental health,” J. Adolesc. Health, vol. 59, no. 5, pp. 502–509, 2016. doi: 10.1016/j.jadohealth.2016.06.006. [Google Scholar] [PubMed] [CrossRef]
8. S. Hinduja and J. W. Patchin, “Bullying, cyberbullying, and suicide,” Arch. Suicide Res., vol. 14, no. 3, pp. 206–221, Jul. 2010. doi: 10.1080/13811118.2010.494133. [Google Scholar] [PubMed] [CrossRef]
9. D. Nikolaou, “Does cyberbullying impact youth suicidal behaviors?” J. Health Econ., vol. 56, no. 5, pp. 30–46, Dec. 2017. doi: 10.1016/j.jhealeco.2017.09.009. [Google Scholar] [PubMed] [CrossRef]
10. D. H. Wolpert and W. G. Macready, “No free lunch theorems for optimization,” IEEE Trans. Evol. Comput., vol. 1, no. 1, pp. 67–82, Apr. 1997. doi: 10.1109/4235.585893. [Google Scholar] [CrossRef]
11. J. Pierezan and L. D. S. Coelho, “Coyote optimization algorithm: A new metaheuristic for global optimization problems,” in 2018 IEEE Congr. Evol. Comput. (CEC), Rio de Janeiro, Brazil, IEEE, 2018, pp. 1–8. doi: 10.1109/CEC.2018.8477769. [Google Scholar] [CrossRef]
12. T. Chen and C. Guestrin, “XGBoost: A scalable tree boosting system,” in Proc. 22nd ACM SIGKDD Int. Conf. Know. Dis. Data Min., San Francisco, CA, USA, Aug. 2016, pp. 785–794. doi: 10.1145/2939672.2939785. [Google Scholar] [CrossRef]
13. J. W. Patchin and S. Hinduja, “2023 cyberbullying data,” Cyberbull. Res. Center. Accessed: May 18, 2024. [Online]. Available: https://cyberbullying.org/2023-cyberbullying-data [Google Scholar]
14. N. A. Azeez, S. O. Idiakose, C. J. Onyema, and C. Van Der Vyver, “Cyberbullying detection in social networks: Artificial intelligence approach,” J. Cyber Secur. Mobil., vol. 10, no. 4, pp. 745–774, 2021. doi: 10.13052/jcsm2245-1439.1046. [Google Scholar] [CrossRef]
15. A. Al-Marghilani, “Artificial intelligence-enabled cyberbullying-free online social networks in smart cities,” Int. J. Comput. Intell. Syst., vol. 15, no. 1, 2022, Art. no. 9. doi: 10.1007/s44196-022-00063-y. [Google Scholar] [CrossRef]
16. N. Yuvaraj et al., “Automatic detection of cyberbullying using multi-feature based artificial intelligence with deep decision tree classification,” Comput. Electr. Eng., vol. 92, no. 6, 2021, Art. no. 107186. doi: 10.1016/j.compeleceng.2021.107186. [Google Scholar] [CrossRef]
17. M. T. Hasan, M. A. E. Hossain, M. S. H. Mukta, A. Akter, M. Ahmed and S. Islam, “A review on deep-learning-based cyberbullying detection,” Fut. Internet, vol. 15, no. 5, 2023, Art. no. 179. doi: 10.3390/fi15050179. [Google Scholar] [CrossRef]
18. S. Qaiser and R. Ali, “Text mining: Use of TF-IDF to examine the relevance of words to documents,” Int. J. Comput. Appl., vol. 181, no. 1, pp. 25–29, Jul. 2018. doi: 10.5120/ijca2018917395. [Google Scholar] [CrossRef]
19. D. Kim, D. Seo, S. Cho, and P. Kang, “Multi-co-training for document classification using various document representations: TF-IDF, LDA, and Doc2Vec,” Inf. Sci., vol. 477, pp. 15–29, Mar. 2019. doi: 10.1016/j.ins.2018.10.006. [Google Scholar] [CrossRef]
20. N. Bacanin et al., “Application of natural language processing and machine learning boosted with swarm intelligence for spam email filtering,” Mathematics, vol. 10, no. 22, Nov. 2022, Art. no. 4173. doi: 10.3390/math10224173. [Google Scholar] [CrossRef]
21. J. Devlin, M. W. Chang, K. Lee, K. Toutanova, “BERT: Pre-training of deep bidirectional transformers for language understanding,” in Proc. NAACL HLT, 2019 Conf. North Am. Chap. Ass. Computat. Linguist.: Human Lang. Technol., Minneapolis, MN, USA, Jun. 2–7 2019, vol. 1, pp. 4171–4186. [Google Scholar]
22. S. Minaee, N. Kalchbrenner, E. Cambria, N. Nikzad, M. Chenaghlu and J. Gao, “Deep learning–based text classification,” ACM Comput. Surv., vol. 54, no. 3, pp. 1–40, Apr. 2021. doi: 10.1145/3439726. [Google Scholar] [CrossRef]
23. M. Podkorytov, D. Biś, and X. Liu, “How can the [MASK] know? The sources and limitations of knowledge in BERT,” in 2021 Int. Joint Conf. Neural Netw. (IJCNN), Shenzhen, China, 2021, pp. 1–8. doi: 10.1109/IJCNN52387.2021.9534299. [Google Scholar] [CrossRef]
24. X. S. Yang and X. He, “Firefly algorithm: Recent advances and applications,” Int. J. Swarm Intell., vol. 1, no. 1, 2013. doi: 10.1504/IJSI.2013.055801. [Google Scholar] [CrossRef]
25. D. Wang, D. Tan, and L. Liu, “Particle swarm optimization algorithm: An overview,” Soft Comput., vol. 22, no. 2, pp. 387–408, Jan. 2017. doi: 10.1007/s00500-016-2474-6. [Google Scholar] [CrossRef]
26. S. Mirjalili and A. Lewis, “The whale optimization algorithm,” Adv. Eng. Softw., vol. 95, no. 12, pp. 51–67, May 2016. doi: 10.1016/j.advengsoft.2016.01.008. [Google Scholar] [CrossRef]
27. M. Dorigo, M. Birattari, and T. Stutzle, “Ant colony optimization,” IEEE Comput. Intell. Mag., vol. 1, no. 4, pp. 28–39, Nov. 2006. doi: 10.1109/MCI.2006.329691. [Google Scholar] [CrossRef]
28. D. Karaboga and B. Basturk, “A powerful and efficient algorithm for numerical function optimization: Artificial Bee Colony (ABC) algorithm,” J. Glob. Optim., vol. 39, no. 3, pp. 459–471, Apr. 2007. doi: 10.1007/s10898-007-9149-x. [Google Scholar] [CrossRef]
29. S. Mirjalili, “Genetic algorithm,” Evolut. Algorithms Neural Netw. Stud. Computat. Intell., vol. 780, no. 2, pp. 43–55, Jun. 2018. doi: 10.1007/978-3-319-93025-1_4. [Google Scholar] [CrossRef]
30. S. Mirjalili, “SCA: A sine cosine algorithm for solving optimization problems,” Knowl. Based Syst., vol. 96, no. 63, pp. 120–133, 2016. doi: 10.1016/j.knosys.2015.12.022. [Google Scholar] [CrossRef]
31. J. Bai et al., “A sinh cosh optimizer,” Know.-Based Syst., vol. 282, no. 1, 2023, Art. no. 111081. doi: 10.1016/j.knosys.2023.111081. [Google Scholar] [CrossRef]
32. L. Abualigah, M. Abd Elaziz, P. Sumari, Z. W. Geem, and A. H. Gandomi, “Reptile search algorithm (RSA): A nature-inspired meta-heuristic optimizer,” Expert. Syst. Appl., vol. 191, no. 11, Apr. 2022, Art. no. 116158. doi: 10.1016/j.eswa.2021.116158. [Google Scholar] [CrossRef]
Cite This Article
 Copyright © 2024 The Author(s). Published by Tech Science Press.
This work is licensed under a Creative Commons Attribution 4.0 International License , which permits unrestricted use, distribution, and reproduction in any medium, provided the original work is properly cited.
 Downloads
 Citation Tools