
 Submit a Paper
 Propose a Special lssue
 Open Access
ARTICLE

Improving Prediction Efficiency of Machine Learning Models for Cardiovascular Disease in IoST-Based Systems through Hyperparameter Optimization
1 Department of Computer Science and Engineering (CSE), Daffodil International University, Dhaka, 1216, Bangladesh
2 Graduate School of Science and Engineering, Saga University, Saga, 8408502, Japan
3 Computer Science Department, College of Computer and Information Sciences, Imam Mohammad Ibn Saud Islamic University (IMSIU), Riyadh, 11623, Saudi Arabia
* Corresponding Author: Tajim Md. Niamat Ullah Akhund. Email:
(This article belongs to the Special Issue: Deep Learning and IoT for Smart Healthcare)
Computers, Materials & Continua 2024, 80(3), 3485-3506. https://doi.org/10.32604/cmc.2024.054222
Received 22 May 2024; Accepted 31 July 2024; Issue published 12 September 2024
 View Full Text
 Download PDF
Abstract
This study explores the impact of hyperparameter optimization on machine learning models for predicting cardiovascular disease using data from an IoST (Internet of Sensing Things) device. Ten distinct machine learning approaches were implemented and systematically evaluated before and after hyperparameter tuning. Significant improvements were observed across various models, with SVM and Neural Networks consistently showing enhanced performance metrics such as F1-Score, recall, and precision. The study underscores the critical role of tailored hyperparameter tuning in optimizing these models, revealing diverse outcomes among algorithms. Decision Trees and Random Forests exhibited stable performance throughout the evaluation. While enhancing accuracy, hyperparameter optimization also led to increased execution time. Visual representations and comprehensive results support the findings, confirming the hypothesis that optimizing parameters can effectively enhance predictive capabilities in cardiovascular disease. This research contributes to advancing the understanding and application of machine learning in healthcare, particularly in improving predictive accuracy for cardiovascular disease management and intervention strategies.Keywords
In the current era of Artificial Intelligence (AI), Machine Learning (ML), and Robotics, cardiovascular disease remains a significant cause of mortality globally, necessitating effective predictive models for early diagnosis and intervention. Researchers have increasingly turned to machine learning algorithms to predict heart attacks, leveraging diverse datasets to improve accuracy. This study focuses on the pivotal role of hyperparameter optimization in refining machine learning models for cardiovascular disease prediction. By implementing ten distinct ML approaches and systematically evaluating their performance metrics, we aim to uncover the impact of hyperparameter tuning on predictive accuracy. Support Vector Machines (SVM) and Neural Networks consistently show enhanced performance following hyperparameter optimization. Additionally, this research delves into the mathematical underpinnings of each model, highlighting the distinctions arising from hyperparameter optimization. The ultimate goal is to contribute to a deeper understanding of the effectiveness of hyperparameter tuning in optimizing ML models for cardiovascular disease prediction, thus advancing early and accurate diagnosis in clinical settings.
This research is driven by the critical imperative to enhance the precision and dependability of cardiovascular disease prediction, recognizing its substantial global health implications. The novelty lies in integrating advanced machine learning models to enable early detection and intervention, promising significant societal benefits. Through meticulous hyperparameter optimization, this study aims to achieve heightened prediction accuracy, equipping healthcare professionals with powerful tools for timely diagnosis and personalized interventions. This approach not only holds potential for saving lives but also alleviating the societal impact of cardiovascular disease. Furthermore, by elucidating the mathematical foundations derived from hyperparameter optimization, this research aims to facilitate the practical adoption of these models in clinical practice, advancing proactive and tailored healthcare strategies.
The contribution of this work lies in systematically exploring the impact of hyperparameter optimization on ML models for cardiovascular disease prediction. We enhance predictive performance across various algorithms by rigorously analyzing and fine-tuning key parameters. This study offers valuable insights into the optimization process, providing a foundation for improved model selection and parameter-tuning strategies in healthcare applications. Additionally, the technical analysis conducted here advances our understanding of the nuanced interactions between hyperparameters and model performance, contributing to the refinement and optimization of predictive models in healthcare.
The subsequent sections of the paper are organized as follows: The background study summarizes previous research on cardiovascular disease prediction with ML over the past two decades. The methodology section outlines the hypothesis, dataset description, and calculations for ML algorithms and parameter optimization techniques. Subsequently, the results section presents the outcomes before and after parameter optimization in ML approaches, followed by the discussion section analyzing the impacts of parameter optimization. Finally, the conclusion section offers concluding remarks and outlines future directions for research.
Cardiovascular diseases, such as heart attacks, hypertension, and strokes, constitute a significant global health concern and have emerged as the leading cause of mortality worldwide [1]. The integration of sensor-based technologies has facilitated the collection of biological data and health metrics from the human body, enabling the prediction of various diseases [2]. Authors of [3] implemented an IoST-enabled system to predict abnormal finger movements. Cardiovascular diseases, including heart attacks and strokes, account for approximately 30% of all global deaths, with an estimated 20 million fatalities reported annually [4]. Reinforcement learning, specifically, has proven valuable in disease management [5]. Expert systems show effectiveness in disease prediction, as seen in a sensor-based system for neurodegenerative disease detection. Innovations like exploring linear and non-linear features of Heart Rate Variability (HRV) [6] and using smartphones for heart attack prediction [7] demonstrate ongoing efforts in leveraging technology for healthcare. In heart attack prediction through ML, researchers examine features like pulse rate, respiratory rate, blood pressure, and temperature [7]. Fuzzy logic and data mining techniques, including respiratory rate as a key physiological indicator [7], have been used for accurate results. The comparison of supervised machine learning algorithms for long-term patient prediction shows the superiority of SVM+ [8]. Heartbeat sounds, a valuable diagnostic parameter, reveal that only two out of the four sounds are audible. Dimensionality reduction techniques like minimal redundancy maximum relevance (mRMR) and Principal Component Analysis (PCA) enhance prediction accuracy, with random forest as the most accurate predictor. Reinforcement learning methods are applied to disease identification, featuring a novel approach optimizing clinical concept mining through a deep Q-network architecture [8]. The iterative quest for optimal clinical terms during training enables the agent to learn an effective diagnostic strategy. Researchers emphasize the critical role of data-driven models in healthcare [9], evaluate different ML techniques for cardiovascular disease prediction [10], propose hybrid ML techniques [11], and explore ML algorithms for cardiovascular disease prediction [12]. Ongoing efforts include the development of hybrid ML models [13], the use of ML for cardiovascular disease prediction [14], and the implementation of ML models for predicting heart failure [15]. Other contributions involve predicting cardiovascular disease using ML algorithms [16], proposing a hybrid intelligent system framework for cardiovascular disease prediction [17], introducing an IoT-based model for cardiovascular disease prediction [18], improving risk prediction in heart failure using ML [19], developing a real-time cardiovascular health monitoring system using ML algorithms [20], and presenting work on cardiovascular disease prediction using ML [21]. Additionally, there is a predictive analysis of cardiovascular diseases using ML approaches [22].
Fig. 1 illustrates a consistent rise in research works related to “heart attack prediction with machine learning and IoT” on Google Scholar from 1995 to 2023. Starting at 141 in 1995, the numbers remained relatively stable until the mid-2000s, after which there was a steady increase. The peak occurred in 2023 with 310 research works, indicating a growing interest in leveraging machine learning and IoT for heart attack prediction. This upward trend reflects advancements in technology and a heightened awareness of the potential applications in healthcare. The data highlights the evolving landscape of research in this field, emphasizing its increasing significance over the years.

Figure 1: Research works found in google scholar with related topics
In Fig. 2, we present a word cloud illustrating the most frequently used words among the related works from the past 23 years (2000–2023) as found in Google Scholar. The size of each word corresponds to its frequency, providing a visual representation of the key terms prevalent in literature. This word cloud offers a quick overview of the prominent themes and topics within the body of related research. In recent years, machine learning has experienced a surge in applications across various domains. Authors of [23,24] illustrated the integration of machine learning in healthcare. These contributions highlight the versatility and impact of machine learning in addressing diverse challenges across various domains, from healthcare to agriculture and beyond. Undoubtedly, researching predicting cardiac disease using machine learning holds significant promise as it contributes to advancing scientific knowledge and has the potential to profoundly benefit mankind by enabling more accurate and personalized risk assessments, early detection, and tailored interventions for improved cardiovascular health.

Figure 2: Word cloud with the most used words among the related works (size of each word corresponds to its frequency)
Our hypothesis posits that there exists an optimal set of hyperparameters within the hyperparameter space H, that maximizes the performance of our machine learning model. The performance of the model is denoted by P(h), where h represents a specific configuration of hyperparameters. We aim to identify this optimal configuration h*, which yields the highest model performance. This involves systematically exploring the hyperparameter space H and evaluating the corresponding model performance. The optimization process entails fine-tuning the hyperparameters to achieve the highest possible predictive accuracy for cardiovascular disease prediction. In summary, our objective is to discover the most effective combination of hyperparameters that enhances the model’s predictive accuracy.
To develop our IoT health monitoring device, we require specific sensors tailored to measure various physiological parameters. These include the DS18B20 temperature sensor (model number DS18B20) for accurate body temperature readings, the AD8232 Heart Rate Monitor sensor (model number AD8232) for monitoring heart rate and rhythm, the BMP180 Barometric Pressure sensor (model number BMP180) for measuring systolic and diastolic blood pressure, the MAX30102 Pulse Oximeter and Heart-Rate Sensor (model number MAX30102) for measuring oxygen saturation levels in the blood, the MPU-6050 3-axis Accelerometer and Gyroscope sensor (model number MPU-6050) for tracking activity levels and movement intensity, the MPXV5004DP Respiratory Rate Sensor (model number MPXV5004DP) for monitoring breathing frequency, and the Freestyle Libre Glucose Sensor (model number Freestyle Libre) for measuring blood glucose levels. By integrating these sensors with the Raspberry Pi, our IoT health monitoring system can provide comprehensive real-time data for assessing and managing various health parameters. Table 1 illustrates the circuit wiring configuration linking the Raspberry Pi with the DS18B20, AD8232, and MAX30102 sensors.
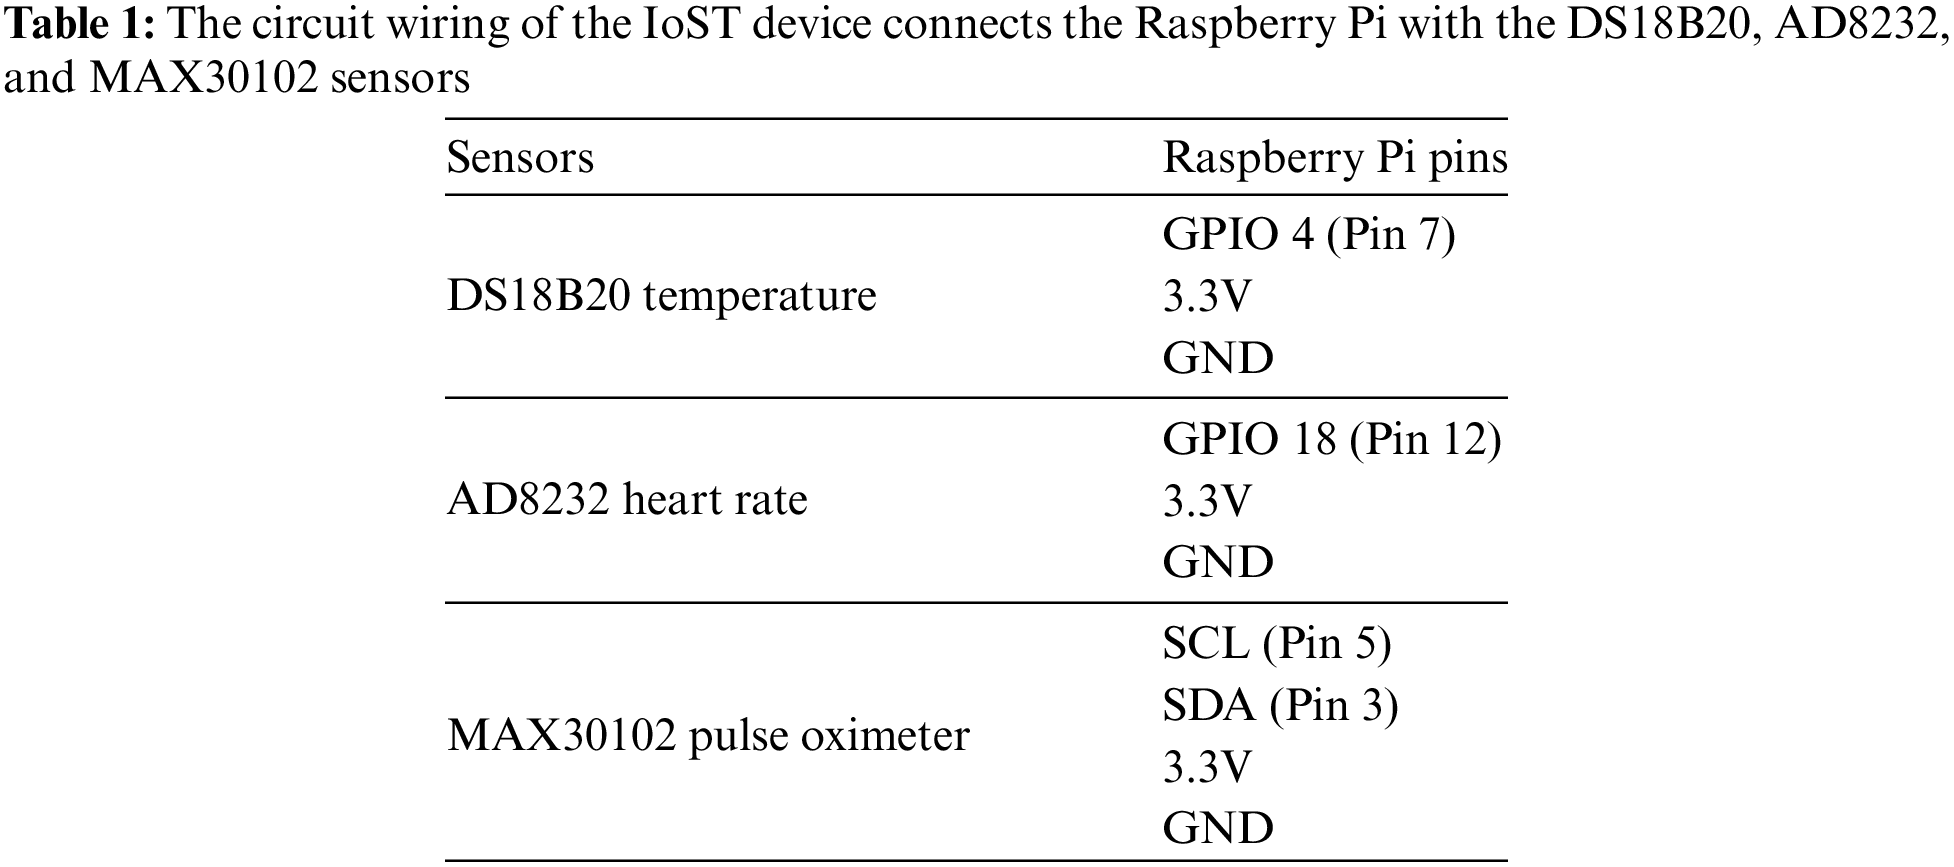
Fig. 3 shows the architecture of the Raspberry Pi-based IoST device for predicting cardiovascular disease. Fig. 4 shows the circuit diagram of this Raspberry Pi-based IoST predictor device.

Figure 3: Raspberry Pi IoST-cardiovascular disease predictor device architecture

Figure 4: Raspberry Pi IoST-cardiovascular disease predictor device architecture
The system follows Algorithm 1 to collect patient data.

All participants in this system have provided written consent to use their data. 295 individuals contributed to the dataset, with each entry containing 13 columns, including the outcome variable. The features and target variable descriptions are as follows:
• V1: Age.
• V2: In the context of defining gender, we assign the value 1 to male and 0 to female in this column.
• V3: Type of chest pain, coded as follows: 1 for Typical, 2 for Atypical, 3 for Non-anginal, and 4 for Asymptomatic.
• V4: Resting blood pressure upon admission, measured in millimeters of mercury (mm Hg).
• V5: Serum cholesterol levels measured in milligrams per deciliter (mg/dL)
• V6: Fasting blood sugar level, categorized as 1 for true (indicating fasting blood sugar >120 mg/dL) and 0 for false.
• V7: ECG results for resting, with 0 indicating Normal, 1 indicating Abnormal, and 2 indicating Left Ventricular Hypertrophy. ECG is measured with the AD8232 sensor of the IoST device.
• V8: Maximum value of heart rate. Heart rate is measured with the MAX30102 sensor of the IoST device.
• V9: Presence of exercise-induced angina, coded as 1 for yes and 0 for no.
• V10: ST depression, denoting changes in the SegmentT Wave induced by exercise relative to rest.
• V11: Oxygen level, measured with the MAX30102 sensor of the IoST device.
• V12: Temperature, measured with the DS18B20 sensor of the IoST device.
• Res: Diagnosis of cardiovascular disease, with 0 representing absence and 1 representing presence.
Here, columns V1 to V12 and Res denote specific attributes related to heart health, with “V” standing for variable.
3.3 Machine Learning Algorithms and Parameter Optimization
We analyze ten machine learning algorithms for our dataset, including Logistic Regression, Decision Trees, Random Forest, Support Vector Machine (SVM), K-Nearest Neighbors (KNN), Naive Bayes, Gradient Boosting, Neural Networks, XGBoost, and Voting Classifier. In Logistic Regression, we model the probability of cardiovascular disease using features V1 to V12 and optimize coefficients to minimize the negative log-likelihood function. Decision Trees classify instances by maximizing information gain or minimizing impurity, with parameter optimization focusing on tree depth and minimum samples for split. Random Forest combines Decision Trees, with parameter tuning for the number of trees and maximum depth. SVM aims to find hyperplanes separating instances, optimizing the regularization and kernel parameters. KNN classifies based on nearest neighbors, maximizing the number of neighbors. Naive Bayes assumes feature independence, with Gaussian Naive Bayes parameter optimization involving mean and variance estimation. Gradient Boosting combines weak learners, optimizing boosting stages and learning rate. Neural Networks predict class probabilities, with hyperparameter tuning for hidden layers and neurons. XGBoost combines Decision Trees, optimizing boosting rounds, learning rate, and tree-specific parameters. The Voting Classifier combines model predictions via majority vote, optimizing base classifiers and hyperparameters for performance maximization. The detailed explanation of the hyperparameter tuning process for each of the ten machine learning algorithms mentioned, including relevant mathematical equations are as follows:
1. Parameter Optimization Method for Logistic Regression: In Logistic Regression, we aim to model the probability
Here,
Hyperparameter tuning involves optimizing the regularization parameter
Parameter Optimization Method for Decision Trees: Decision Trees classify instances by splitting the data into subsets based on feature values that maximize information gain or minimize impurity. Here the information gain is obtained by as follows:
Here,
3. Parameter Optimization Method for Random Forest: Random Forest is an ensemble of Decision Trees. The algorithm tunes the Number of trees (
Here,
4. Parameter Optimization Method for Support Vector Machine (SVM): SVM finds a hyperplane that maximizes the margin between classes:
Hyperparameter tuning involves the Regularization parameter C and Kernel parameters.
5. Parameter Optimization Method for K-Nearest Neighbors (KNN): KNN classifies an instance based on the majority class among its
6. Parameter Optimization Method for Naive Bayes: Gaussian Naive Bayes assumes feature independence and follows:
Here,
Parameter optimization involves estimating Mean
7. Parameter Optimization Method for Gradient Boosting: Gradient Boosting combines weak learners to minimize a loss function
Here,
8. Parameter Optimization Method for Neural Networks: Neural Networks predict class probabilities using a network of neurons:
Here,
Parameter Optimization Method for XGBoost: XGBoost is an optimized version of Gradient Boosting. It tunes Number of boosting rounds
Parameter Optimization Method for Voting Classifier: The Voting Classifier combines the predictions of base classifiers. It tunes the Selection of base classifiers, Weights for each classifier in the vote. The combined prediction is:
Hyperparameter optimization for each model typically involves cross-validation to ensure the selected parameters generalize well to unseen data. Grid search or randomized search techniques are commonly used to explore the hyperparameter space efficiently.
4.1 PCA of Heart Disease Dataset
Fig. 5 illustrates the results of Principal Component Analysis (PCA) applied to the heart disease dataset, where PC1 captures the primary and PC2 captures the secondary. Each data point represents an individual projected onto the PC1-PC2 plane, with colors indicating the diagnosis label: blue for healthy individuals (0) and red for individuals with heart disease (1). PC1 predominantly reflects variations in features v3, v9, and v10, while PC2 primarily reflects variations in features v1, v6, and v7. Notably, higher values of PC1 correspond to a greater likelihood of heart disease, suggesting that individuals with elevated values along PC1 may exhibit characteristic patterns in features related to exercise-induced angina, ST depression, and serum cholesterol levels. Conversely, higher values along PC2 are associated with features such as age, fasting blood sugar level, and ECG results, indicating potential distinctions in these attributes between healthy and diseased individuals.

Figure 5: PCA projection of heart disease dataset onto PC1-PC2 plane
4.2 Parameter Optimization Performance
Accuracy, as depicted in Table 2, serves as a fundamental metric for evaluating the overall performance of classification models. The accuracy of a model is calculated using the formula:
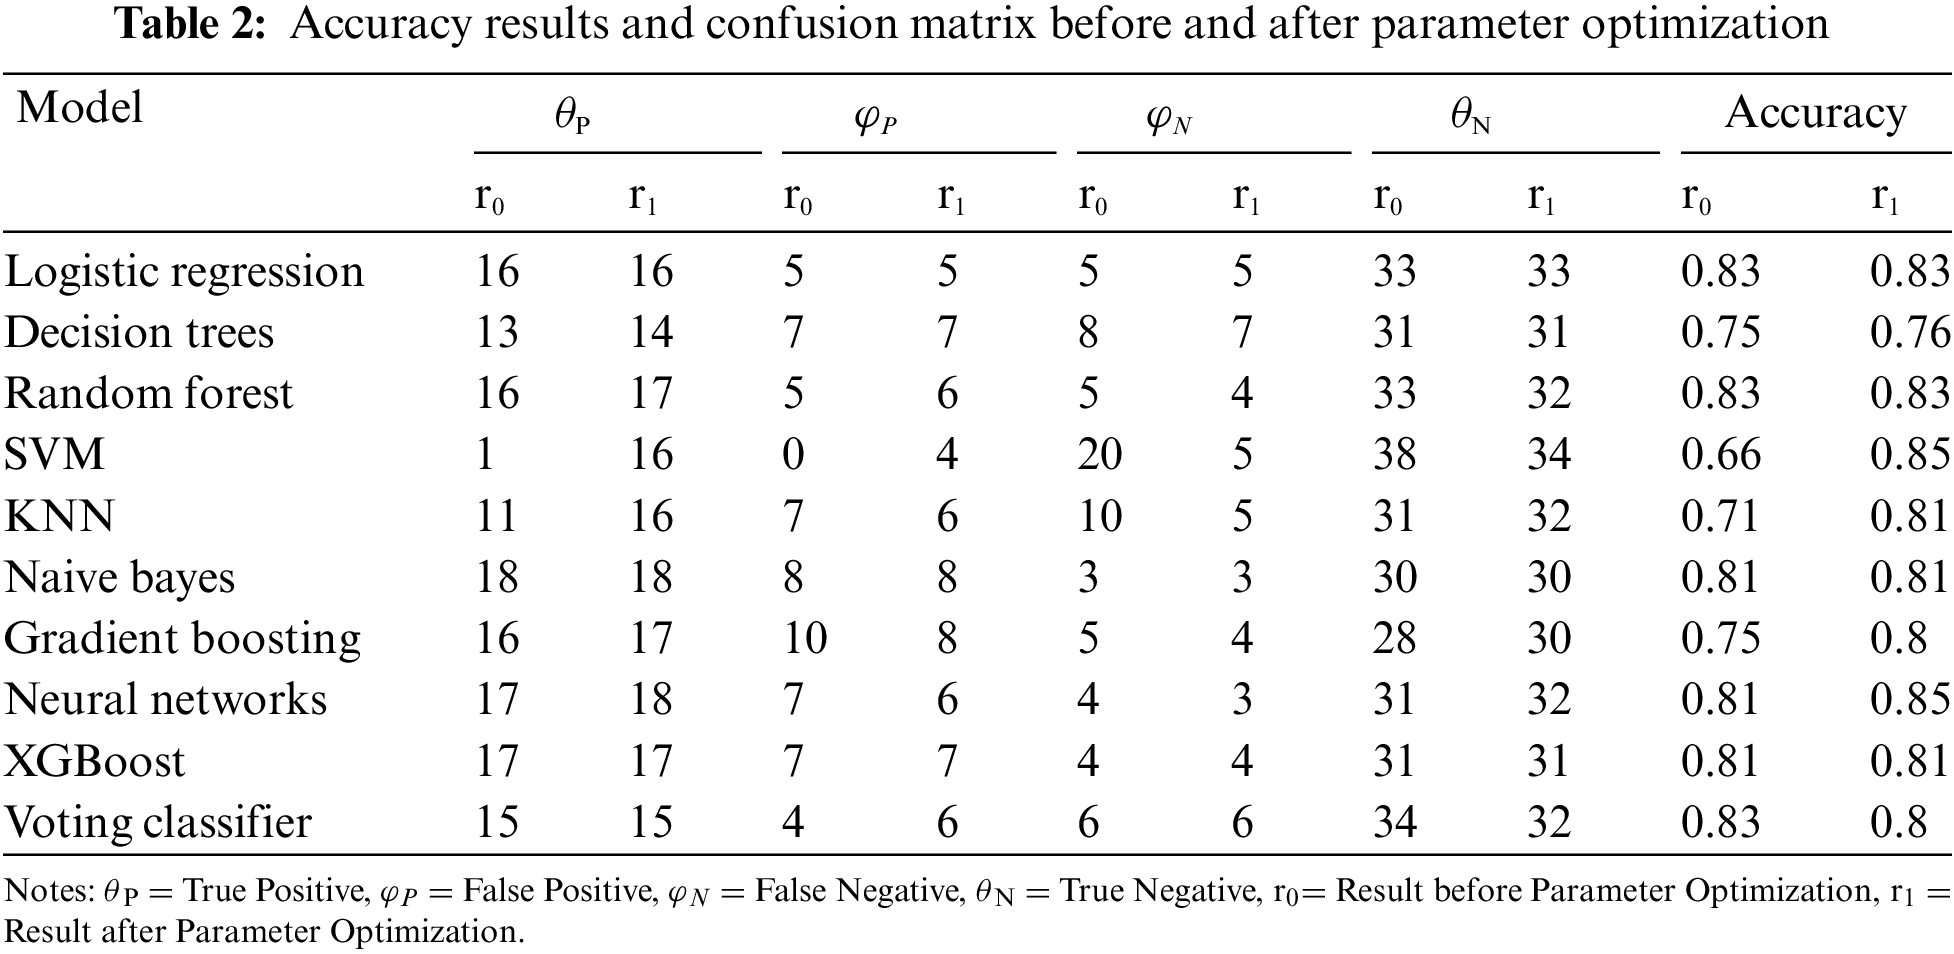
where
Table 3 provides a granular breakdown of model performance through the Confusion Matrix after Parameter Optimization. The True Positive
The Confusion Matrix enables a more nuanced assessment of a model’s ability to make specific types of correct and incorrect predictions.
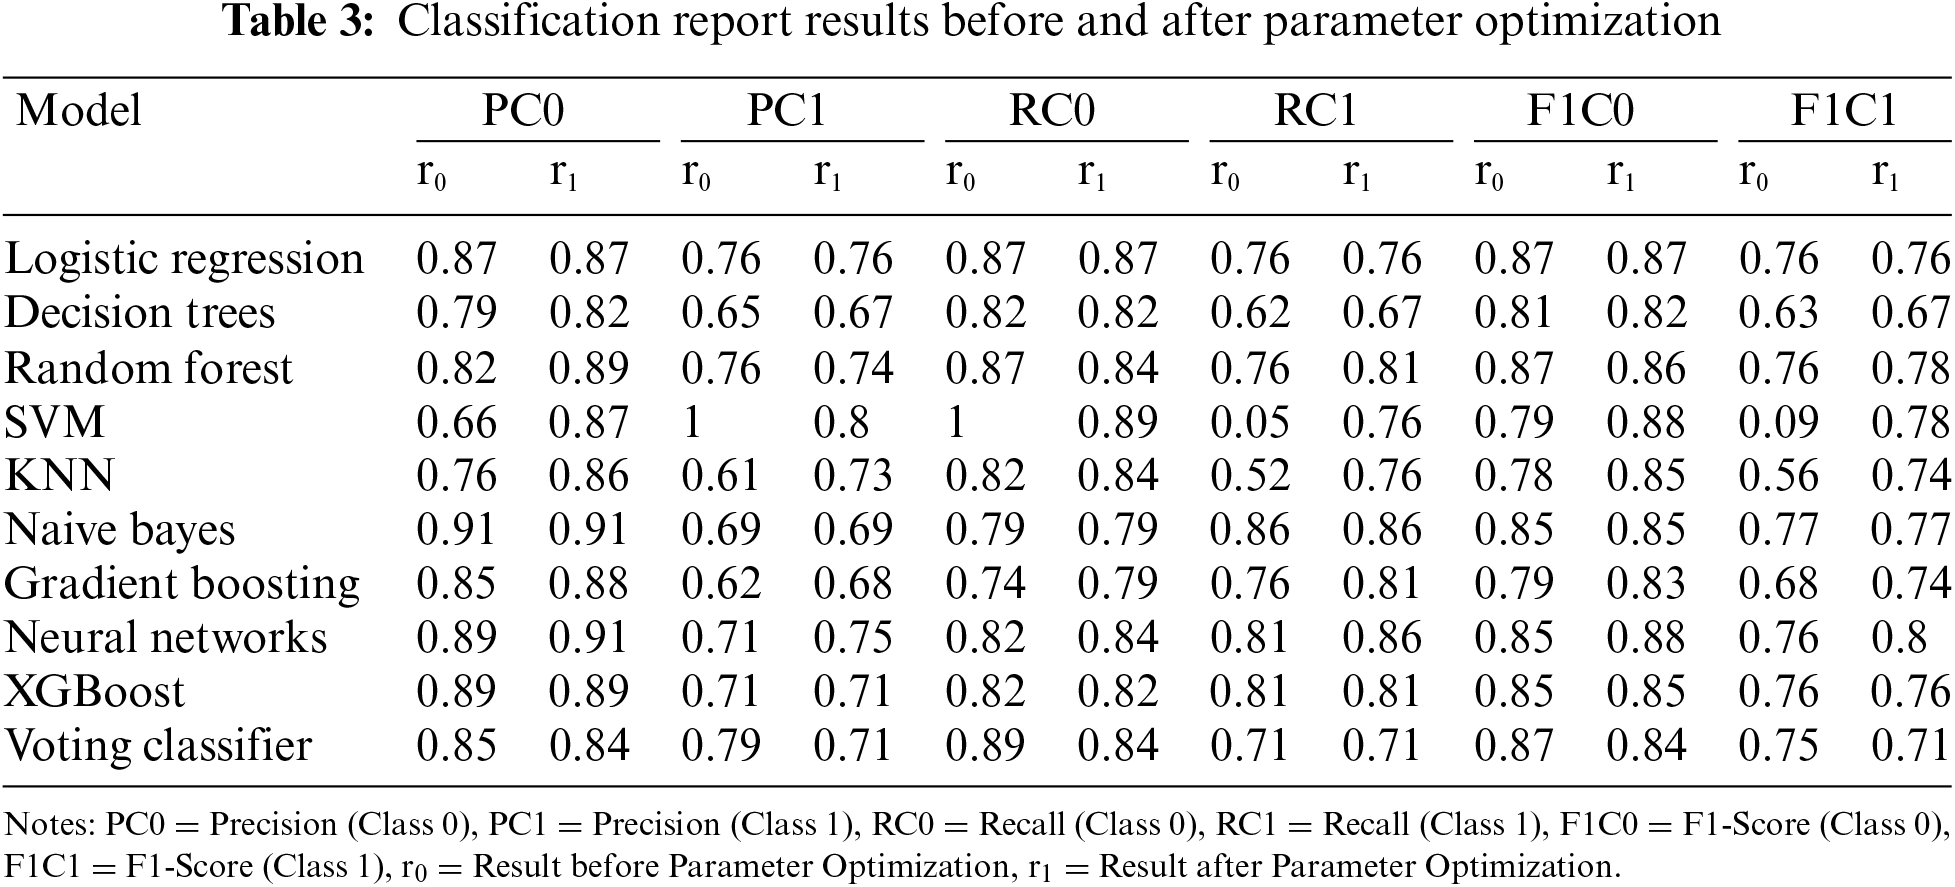
The Classification Report, as illustrated in Table 3 for Classification Report Results before and after Parameter Optimization provides a comprehensive overview of model performance, offering insights into precision, recall, and F1-Score for each class in a binary classification setting.
The heatmap visualization (Fig. 6) shows model performances before and after parameter optimization. This visualization offers an intuitive representation of model performances. Each cell in the heatmap corresponds to the F1-Score for a particular model and class combination. Darker colors represent higher F1-Scores. The heatmap provides a quick visual summary, allowing easy identification of models that excel in specific class predictions. It complements the tabular data, aiding in the interpretation of model performance across different classes. The heatmap facilitates a holistic understanding of how well each model performs across Class 0 and Class 1, serving as a valuable tool for model comparison.
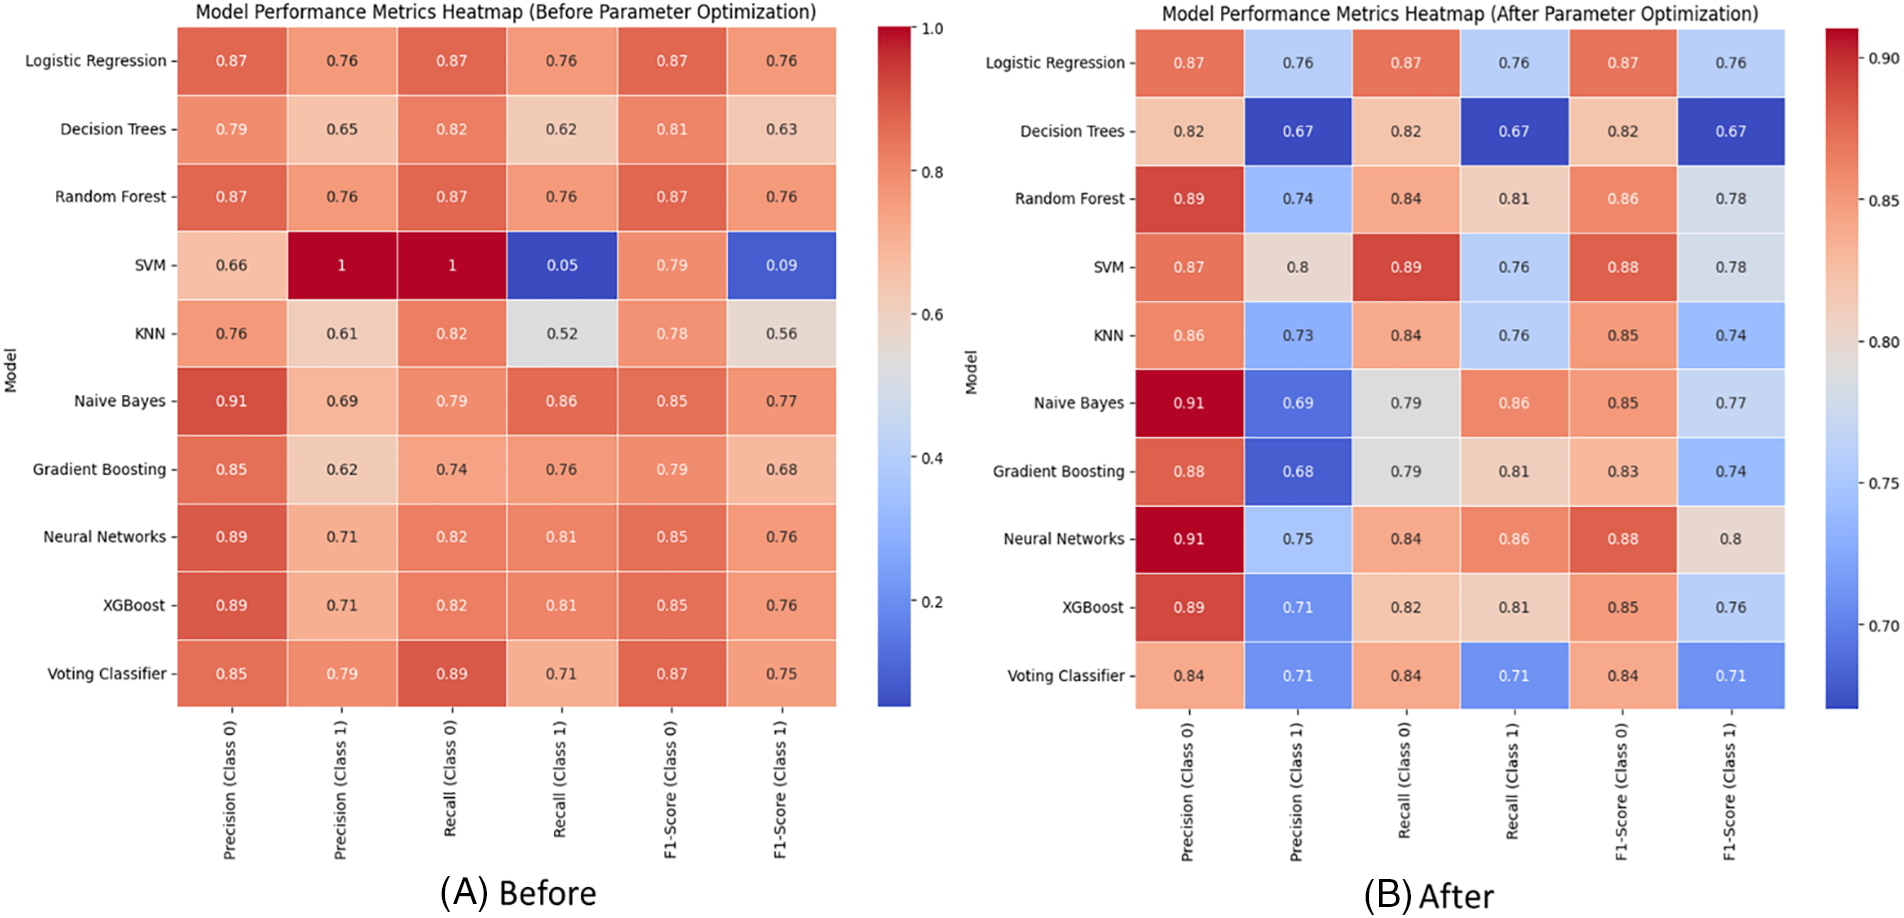
Figure 6: Visualizing model performances with heat-map (A) before and (B) after the parameter optimization
Table 4 provides a comparative analysis of the execution times in seconds for various machine learning models before and after parameter optimization on the Raspberry Pi 4B model which has 4 GB LPDDR4 ram, 128 GB U3A1 sd storage, and 64-bit processor with 1.8 GHz clock speed. Execution Time Comparison with and Without Parameter Optimization is illustrated in Fig. 7.


Figure 7: Comparison of execution time (s) before and after parameter optimization
As discussed in the Table 2, it is evident that parameter optimization has a noticeable impact on the accuracy of certain models. The execution time, measured in seconds, is considerably reduced for several models after tuning their parameters. For Logistic Regression, the execution time significantly decreases from 0.097 to 0.036 s after optimization. Similarly, models like Decision Trees and KNN exhibit improvements in computational efficiency. Notably, models like Random Forest and Neural Networks demonstrate a substantial increase in execution time after optimization. This phenomenon could be attributed to the complexity introduced by fine-tuning parameters, leading to longer computation times. The execution time analysis emphasizes the trade-off between parameter optimization and computational efficiency. While some models benefit from faster execution times, others experience increased computational complexity. This insight is crucial for selecting the appropriate optimization strategy based on the specific requirements and constraints of the machine learning application.
Table 2 presents a comparative view of the model accuracy before and after parameter optimization. Parameter optimization is a crucial step in machine learning that involves fine-tuning hyper-parameters to enhance model performance. Fig. 8 illustrates the impact of parameter optimization on the machine learning model’s accuracy.
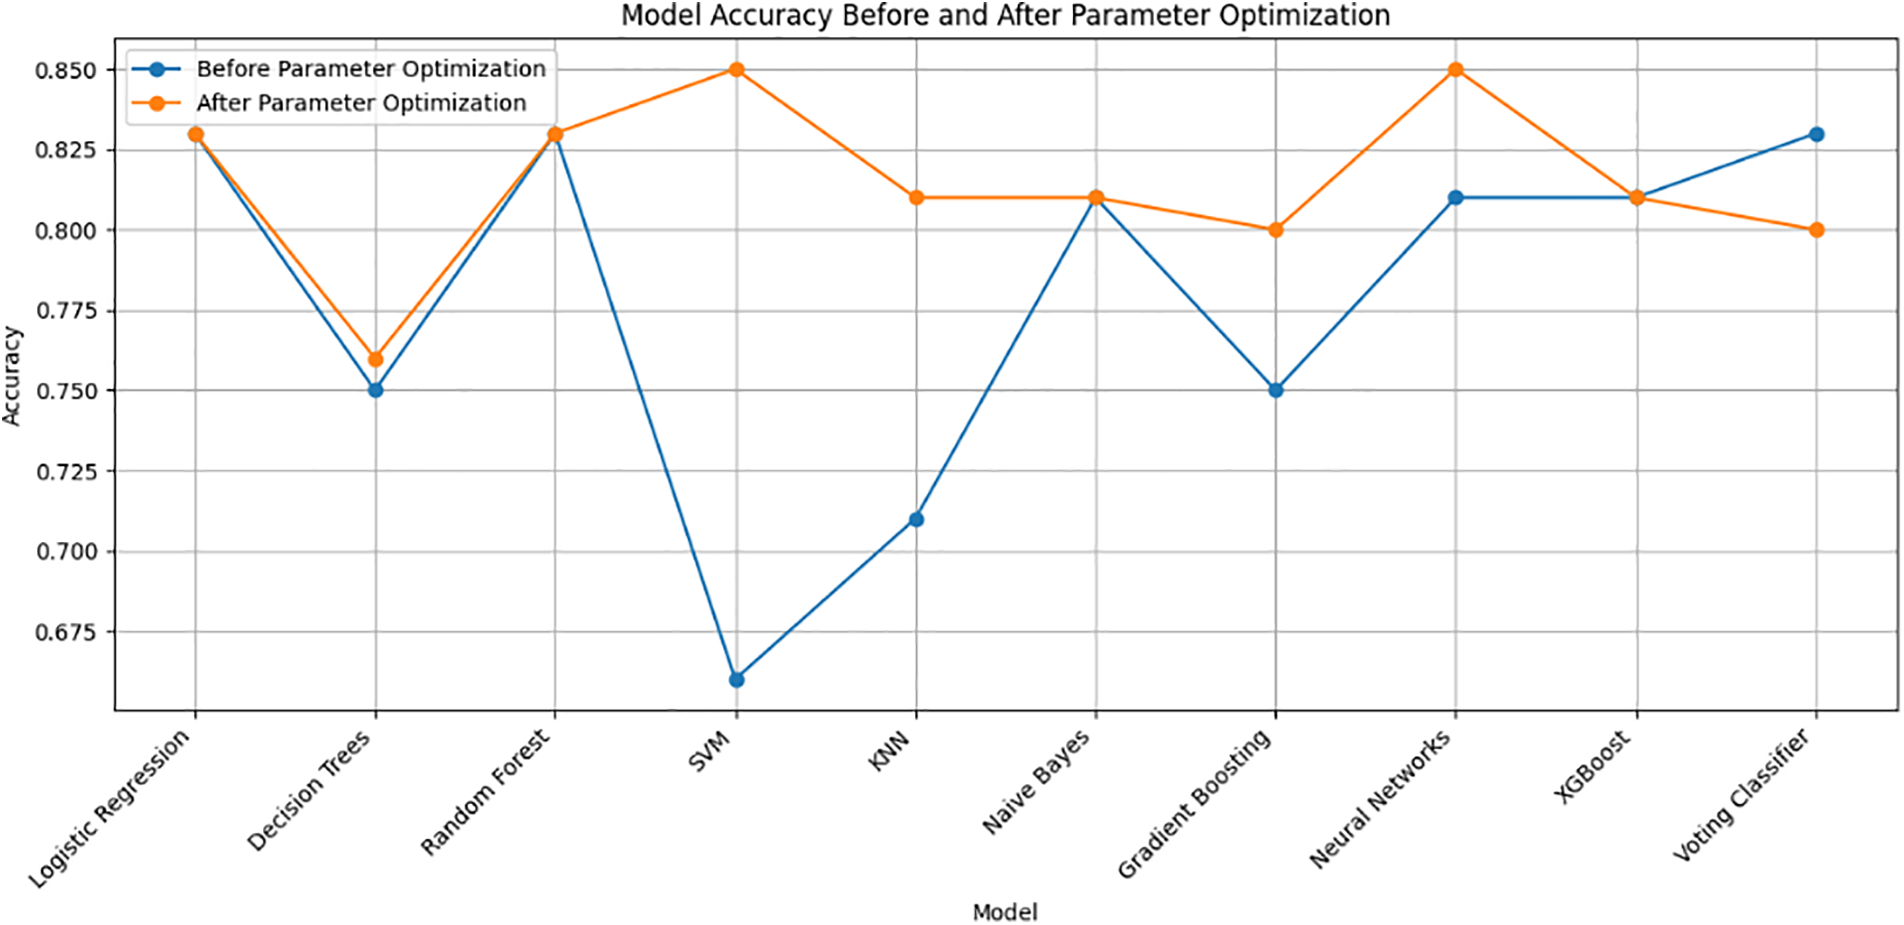
Figure 8: Visualization of the impact of parameter optimization on machine learning model’s accuracy
Let’s delve into the findings:
1. Logistic Regression: The accuracy remains consistent at 0.83 before and after optimization, suggesting that default hyperparameters already yield a satisfactory result.
2. Decision Trees: After optimization, the accuracy slightly improved from 0.75 to 0.76. Tuning the ‘max_depth’ parameter may have contributed to better generalization.
3. Random Forest: The accuracy maintains consistency at 0.83, indicating that the default settings or initial hyperparameters are effective for this ensemble model.
4. SVM (Support Vector Machine): Significant improvement is observed from 0.66 to 0.85 after optimization. Tuning the ‘C’ parameter and kernel settings led to a more accurate model.
5. KNN (K-Nearest Neighbors): The accuracy slightly drops from 0.71 to 0.81 after optimization. Adjusting the ‘n_neighbors’ parameter might have introduced a balance between bias and variance.
6. Naive Bayes: No significant change in accuracy (0.81) is noted before and after optimization. Naive Bayes often performs well with default settings.
7. Gradient Boosting: The accuracy improves from 0.75 to 0.80, indicating that optimizing ‘n_estimators’ contributes to boosting model performance.
8. Neural Networks: A notable increase in accuracy from 0.81 to 0.85 suggests that tuning the ‘hidden_layer_sizes’ parameter enhances the neural network’s ability to capture complex patterns.
9. XGBoost: The accuracy remains consistent at 0.81, implying that the default hyperparameters or initial settings already yield satisfactory results for this gradient-boosting algorithm.
10. Voting Classifier: The accuracy drops slightly from 0.83 to 0.80 after optimization. It’s crucial to note that the voting classifier integrates various models, and changes in individual models can impact the ensemble.
5.2 Overall Performance Metrics
The generated merged heat map (Fig. 9) compares the classification performance metrics (Precision, Recall, and F1-Score) for Class 0 and Class 1 before and after parameter optimization across different machine learning models. The provided heatmaps offer a visual representation of the classification metrics (precision, recall, and F1-Score) for two scenarios: before and after parameter optimization. Let’s discuss the observed changes in scores.
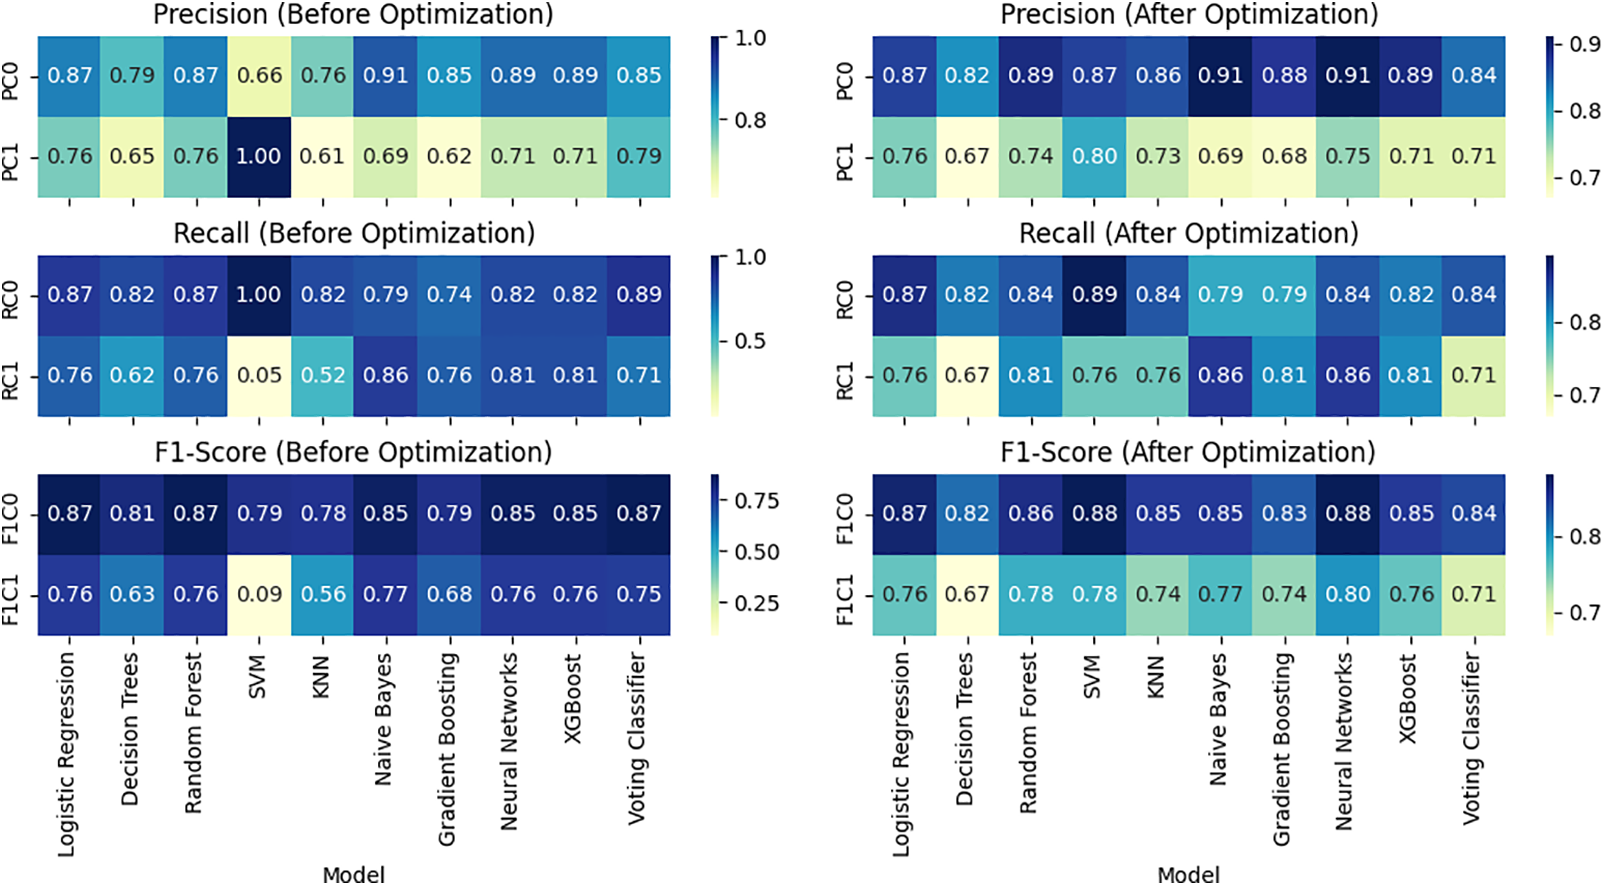
Figure 9: Overall Performance Visualization before (left) and after (right) parameter optimization
5.2.1 Precision (before vs. after Optimization)
Before optimization, most models exhibit relatively high precision for Class 0, ranging from 0.66 to 0.91. After optimization, there are instances of improvement, with some models achieving higher precision scores (e.g., Logistic Regression, Random Forest, SVM), indicating enhanced accuracy in predicting instances of Class 0. Precision for Class 1 varies across models before optimization, with a wide range from 0.61 to 1.00. After optimization, some models experience improvements (e.g., SVM, Neural Networks), while others see slight decreases. The Voting Classifier, for example, maintains precision for Class 1.
5.2.2 Recall (before vs. after Optimization)
Before optimization, models show diverse recall scores for Class 0, ranging from 0.74 to 1.00. After optimization, certain models improve their ability to capture instances of Class 0 (e.g., SVM, KNN, Neural Networks), while others remain relatively stable. Recall for Class 1 before optimization has a broad range from 0.05 to 0.86. After optimization, there are notable improvements in recall for some models (e.g., SVM, Neural Networks), indicating enhanced sensitivity in capturing instances of Class 1.
5.2.3 F1-Score (before vs. after Optimization)
F1-Scores for Class 0 before optimization range from 0.79 to 0.87. After optimization, some models exhibit improvements in achieving a balance between precision and recall for Class 0 (e.g., SVM, Neural Networks). F1-Scores for Class 1 before optimization vary widely. After optimization, there are instances of improvement (e.g., Neural Networks) and slight decreases, reflecting the trade-off between precision and recall for Class 1.
5.2.4 AUC and ROC Curve Analysis
AUC stands for “Area Under the Curve,” and ROC stands for “Receiver Operating Characteristic”. Table 5 presents the AUC values before and after parameter optimization for various machine learning models. A higher AUC indicates better discriminative performance. Notably, Logistic Regression, Random Forest, Naive Bayes, and Neural Networks maintained high AUC values before and after optimization, showcasing their robustness. Decision Tree, SVM, and KNN witnessed improvements in AUC after parameter optimization, with SVM and KNN showing substantial enhancements. The graphical representations in Fig. 10 visually depict the ROC curves before and after optimization, illustrating the trade-off between Sensitivity and Specificity at different classification thresholds. The explanation of AUC as the area under the ROC curve reinforces that an AUC of 0.5 implies random guessing, while an AUC of 1.0 signifies a perfect classifier. These results emphasize the significance of parameter tuning in enhancing model performance, leading to improved discrimination capabilities as evidenced by the higher AUC values.


Figure 10: ROC Curves before (A) and after (B) the parameter optimization
5.2.5 In Depth Analysis of the Results
This study systematically evaluated multiple machine learning models for heart disease prediction using a diverse patient dataset, focusing on the impact of hyperparameter optimization on performance metrics like precision, recall, and F1-Score. While models such as Logistic Regression and Random Forest consistently demonstrated robust performance, anomalies were observed in the SVM model, notably with a precision of 1 for PC1-r0, 1 for RC0-r0 and 0.05 for RC1-r0 before parameter optimization. These variations underscore the sensitivity of SVM and other models to hyperparameter settings, influencing their ability to generalize effectively across different classes. But all this abnormality is solved after the parameter optimization as 0.8 for PC1-r1, 0.89 for RC0-r1 and 0.76 for RC1-r1. Here r0 is stands for before applying our parameter optimization method and r1 is after applying our parameter optimization method. Rigorous methodological approaches, including cross-validation and systematic hyperparameter tuning, were employed to ensure the reliability of our findings. Our study highlights the need for careful model selection and optimization in healthcare analytics, suggesting avenues for future research in enhancing model stability and performance across diverse datasets and applications.
Following parameter optimization, several machine learning models exhibited significant performance enhancements in our study. Support Vector Machines (SVM) and Neural Networks (NN) demonstrated improved precision and recall metrics across both classes by fine-tuning kernel parameters, regularization strength, and network architecture. SVM’s optimization process aims to maximize the margin between classes while minimizing classification errors, achieving better separation in complex datasets. Neural Networks, on the other hand, benefited from optimized learning rates and batch sizes during backpropagation, enhancing their ability to learn intricate data patterns and improving overall F1-Scores and accuracy. Additionally, ensemble methods such as Random Forest and XGBoost leveraged parameter tuning to optimize tree depth, feature subsampling, and the number of trees, resulting in reduced variance and higher predictive accuracy. These improvements underscore the critical role of parameter optimization in tailoring model performance to dataset characteristics and achieving robust predictions across diverse machine learning methodologies.
Addressing the potential for overfitting, particularly with models like Neural Networks that are prone to it due to their complex architectures and large number of parameters, is crucial in machine learning. Neural Networks have a tendency to memorize noise and specific details in the training data, leading to excellent performance on training sets but poor generalization to unseen data. To mitigate this risk, we have implemented several effective strategies during parameter optimization. Techniques such as regularization, including L2 regularization, help prevent overfitting by penalizing large weights in the model, thereby promoting simpler and more generalized solutions. Additionally, dropout regularization randomly deactivates neurons during training, forcing the network to learn more robust features and reducing reliance on specific neurons. Early stopping, another method employed, monitors validation performance and halts training when improvements cease, preventing the model from further fitting noise in the training data. These approaches collectively ensure that our Neural Networks maintain strong performance metrics on both training and validation sets, enhancing their ability to generalize to new data while managing the inherent risk of overfitting.
It is important to acknowledge the potential limitations of our study regarding the generalizability of findings beyond the specific dataset obtained from the IoST device. While our results demonstrate the effectiveness of hyperparameter optimization in enhancing model performance for heart disease prediction within this dataset, future studies should aim to validate these findings across diverse datasets and patient populations. This will ensure broader applicability and robustness of the optimized models in real-world healthcare settings.
5.3 Hypothesis Testing with Wilcoxon Signed-Rank Test
The Wilcoxon signed-rank test, a non-parametric statistical method, assesses if there’s a significant difference between two related samples, such as model accuracy before and after parameter optimization. The test calculates differences between pairs of observations, assigns ranks based on their absolute values, and determines the test statistic (T) as the minimum of the sums of ranks of positive (T+) and negative (T−) differences. The process involves calculating these differences, ranking them, and obtaining T. The resulting p-value (0.0115) is compared to the significance level (usually 0.05) to reject or accept the null hypothesis. Here, the p-value is lower, indicating a significant difference in mean accuracy post-optimization. Therefore, we reject the null hypothesis, concluding a notable change in mean accuracy due to parameter optimization.
5.4 Novelty of the Proposed Work and Comparison with Existing Systems
Several existing studies have focused on cardiovascular disease prediction using various machine-learning techniques. Table 6 compares existing systems and our proposed approach. Our work contributes to the existing body of research on heart attack prediction by proposing novel methodologies, optimizing model parameters, and conducting a comprehensive comparative analysis. By addressing these aspects, we aim to advance the field and provide valuable insights for improved diagnosis and prevention of cardiovascular disease.

In this study, we focused on the optimization of hyperparameters for traditional machine learning models to predict cardiovascular diseases. While our analysis provided significant insights and highlighted the importance of tailored hyperparameter tuning, we recognize the necessity of comparing these results with state-of-the-art deep learning techniques. Future research will incorporate these advanced methods to ensure a robust and comprehensive evaluation, enhancing the novelty and applicability of our findings in real-world clinical settings.
Future research could focus on advanced search techniques such as Bayesian optimization, genetic algorithms, and reinforcement learning-based approaches to further refine parameter configurations. Exploring ensemble methods and optimizing hyperparameters for their configurations, as well as delving into feature engineering and automated selection methods, may enhance the models’ predictive power. Incorporating temporal aspects, longitudinal data, and prioritizing interpretable models could offer a more comprehensive understanding of patient health. External validation across diverse datasets and addressing real-world deployment challenges are crucial steps toward ensuring optimized models generalized and practical applicability in clinical settings.
In this work, we implemented ten machine-learning approaches to predict cardiovascular disease from the collected data with our proposed IoST device. Then we applied parameter optimization and got better results. The impact of parameter optimization on performance metrics has been substantial across various machine learning models. The overall variability in the impact of optimization emphasizes the need to carefully choose models and fine-tune parameters based on specific classification goals. Decisions regarding model selection depend on the desired balance between precision and recall, with Decision Trees and Random Forests demonstrating consistent performance. The parameter optimization process yields diverse results across different algorithms, indicating the necessity for a tailored approach to hyperparameter tuning. While some models experience significant accuracy improvements, others demonstrate performance stability. Though the parameter optimization provides a higher accuracy rate it costs more execution time. The results underscore the critical role of parameter optimization in achieving optimal model performance. The findings highlight the importance of thoughtful hyperparameter selection to maximize accuracy, with implications for cardiovascular disease prediction in our specific case.
Acknowledgement: Not applicable.
Funding Statement: This work was supported and funded by the Deanship of Scientific Research at Imam Mohammad Ibn Saud Islamic University (IMSIU), Grant Number IMSIU-RG23151.
Author Contributions: Tajim Md. Niamat Ullah Akhund: Conceptualization, methodology, software, formal analysis, resources, data curation, original draft preparation, visualization. Waleed M. Al-Nuwaiser: Conceptualization, methodology, validation, formal analysis, investigation, review, supervision, funding acquisition. All authors reviewed the results and approved the final version of the manuscript.
Availability of Data and Materials: The data that support the findings of this study are available from the corresponding author, Tajim Md. Niamat Ullah Akhund, upon reasonable request.
Ethics Approval: The Institutional Review Board of Daffodil International University scrutinized and approved research projects involving human participants. Each participant provided written consent to participate in the study.
Conflicts of Interest: The authors declare that they have no conflicts of interest to report regarding the present study.
References
1. W. -Y. Chung, C. -L. Yau, K. -S. Shin, and R. Myllyla, “A cell phone-based health monitoring system with self analysis processor using wireless sensor network technology,” in 2007 29th Annu. Int. Conf. IEEE Eng. Med. Biol. Soc., Lyon, France, Aug. 23–26, 2007, pp. 3705–3708. [Google Scholar]
2. T. M. N. U. Akhund, M. J. N. Mahi, A. H. Tanvir, M. Mahmud, and M. S. Kaiser, “ADEPTNESS: Alzheimer’s disease patient management system using pervasive sensors-Early prototype and preliminary results,” in Int. Conf. Brain Inform., Arlington, TX, USA, Springer, Dec. 7–9, 2018, pp. 413–422. [Google Scholar]
3. T. M. N. U. Akhund et al., “IoST-enabled robotic arm control and abnormality prediction using minimal flex sensors and gaussian mixture models,” IEEE Access, vol. 12, no. 6, pp. 45265–45278, 2024. doi: 10.1109/ACCESS.2024.3380360. [Google Scholar] [CrossRef]
4. P. Dinkar, A. Gulavani, S. Ketkale, P. Kadam, and S. Dabhade, “Remote health monitoring using wireless body area network,” Int. J. Eng. Adv. Technol. (IJEAT), vol. 2, no. 3, pp. 894–898, 2013. [Google Scholar]
5. R. Miotto, F. Wang, S. Wang, X. Jiang, and J. T. Dudley, “Deep learning for healthcare: Review, opportunities and challenges,” Brief. Bioinform., vol. 19, no. 6, pp. 1236–1246, 2017. doi: 10.1093/bib/bbx044. [Google Scholar] [PubMed] [CrossRef]
6. H. G. Lee, K. Y. Noh, and K. H. Ryu, “Mining biosignal data: Coronary artery disease diagnosis using linear and nonlinear features of HRV,” in Pacific-Asia Conf. Knowl. Discov. Data Min., Nanjing, China, Springer, May 22–25, 2007, pp. 218–228. [Google Scholar]
7. M. Ashrafuzzaman, M. M. Huq, C. Chakraborty, M. R. M. Khan, T. Tabassum and R. Hasan, “Heart attack detection using smart phone,” Int. J. Technol. Enhanc. Emerg. Eng. Res., vol. 1, no. 3, pp. 1–6, 2013. [Google Scholar]
8. Y. Ling et al., “Diagnostic inferencing via improving clinical concept extraction with deep reinforcement learning: A preliminary study,” in 2017 Int. Conf. Mach. Learn. Healthc. (MLHC), Boston, MA, USA, Aug. 18–19 2017. [Google Scholar]
9. D. Shah, S. Patel, and S. K. Bharti, “Heart disease prediction using machine learning techniques,” SN Comput. Sci., vol. 1, no. 6, pp. 1–6, Jan. 2020. doi: 10.1007/s42979-020-00365-y. [Google Scholar] [CrossRef]
10. K. Dwivedi, “Performance evaluation of different machine learning techniques for prediction of heart disease,” Neural Comput. Appl., vol. 29, no. 10, pp. 685–693, Mar. 2018. doi: 10.1007/s00521-016-2604-1. [Google Scholar] [CrossRef]
11. S. Mohan, C. Thirumalai, and G. Srivastava, “Effective heart disease prediction using hybrid machine learning techniques,” IEEE Access, vol. 7, pp. 81542–81554, 2019. doi: 10.1109/ACCESS.2019.2923707. [Google Scholar] [CrossRef]
12. R. Singh and R. Kumar, “Heart disease prediction using machine learning algorithms,” in 2020 Int. Conf. Electr. Electron. Eng. (ICE3), Gorakhpur, India, IEEE, Feb. 14–15, 2020, pp. 14–15. [Google Scholar]
13. M. Kavitha, G. Gnaneswar, R. Dinesh, Y. R. Sai, and R. S. Suraj, “Heart disease prediction using hybrid machine learning model,” in 2021 6th Int. Conf. Inventive Comput. Technol. (ICICT), Coimbatore, India, IEEE, Jan. 20–22, 2021, pp. 1329–1333. [Google Scholar]
14. D. E. Salhi, A. Tari, and M. -T. Kechadi, “Using machine learning for heart disease prediction,” in Adv. Comput. Syst. Appl.: Proc. 4th Conf. Comput. Syst. Appl., Yasmine Hammamet, Tunisia, Springer, Dec. 21–23, 2021, pp. 70–81. [Google Scholar]
15. Y. H. Basha, A. B. Nassif, and M. AlShabi, “Predicting heart failure disease using machine learning,” in Smart Biomed. Physiol. Sens. Technol. XIX, San Francisco, CA, USA, Jun. 22–24, 2022, vol. 12123, pp. 75–84. [Google Scholar]
16. K. G. Dinesh, K. Arumugaraj, K. D. Santhosh, and V. Mareeswari, “Prediction of cardiovascular disease using machine learning algorithms,” in 2018 Int. Conf. Curr. Trends Towards Converg. Technol. (ICCTCT), Coimbatore, India, IEEE, Mar. 1–3, 2018, pp. 1–7. [Google Scholar]
17. U. Haq, J. P. Li, M. H. Memon, S. Nazir, and R. Sun, “A hybrid intelligent system framework for the prediction of heart disease using machine learning algorithms,” Mob. Inf. Syst., vol. 2018, pp. 1–21, Nov. 2018. [Google Scholar]
18. M. Ganesan and N. Sivakumar, “IoT based heart disease prediction and diagnosis model for healthcare using machine learning models,” in 2019 IEEE Int. Conf. Syst. Comput. Autom. Network. (ICSCAN), Pondicherry, India, IEEE, Mar. 29–30, 2019, pp. 1–5. [Google Scholar]
19. E. D. Adler et al., “Improving risk prediction in heart failure using machine learning,” Eur. J. Heart Fail., vol. 22, no. 1, pp. 139–147, Jan. 2020. doi: 10.1002/ejhf.1628. [Google Scholar] [PubMed] [CrossRef]
20. S. Nashif, M. R. Raihan, M. R. Islam, and M. H. Imam, “Heart disease detection by using machine learning algorithms and a real-time cardiovascular health monitoring system,” World J. Eng. Technol., vol. 6, no. 4, pp. 854–873, 2018. doi: 10.4236/wjet.2018.64057. [Google Scholar] [CrossRef]
21. A. L. Yadav, K. Soni, and S. Khare, “Heart diseases prediction using machine learning,” in 2023 14th Int. Conf. Comput. Commun. Network. Technol. (ICCCNT), Kharagpur, India, IEEE, Jul. 4–6, 2023, pp. 1–7. [Google Scholar]
22. T. Ramesh, U. K. Lilhore, M. Poongodi, S. Simaiya, A. Kaur and M. Hamdi, “Predictive analysis of heart diseases with machine learning approaches,” Malays. J. Comput. Sci., vol. 35, no. 3, pp. 132–148, Sep. 2022. [Google Scholar]
23. B. Ramesh and K. Lakshmanna, “Multi head deep neural network prediction methodology for high-risk cardiovascular disease on diabetes mellitus,” Comput. Model. Eng. Sci., vol. 137, no. 3, pp. 2513–2528, Jun. 2023. doi: 10.32604/cmes.2023.028944. [Google Scholar] [CrossRef]
24. M. Tayyeb, A. Rahman, S. Sarker, and M. T. Islam, “Deep learning approach for automatic cardiovascular disease prediction employing ECG signals,” Comput. Model. Eng. Sci., vol. 137, no. 2, pp. 1677–1694, Apr. 2023. doi: 10.32604/cmes.2023.026535. [Google Scholar] [CrossRef]
25. H. Takcı, “Improvement of heart attack prediction by the feature selection methods,” Turk. J. Electr. Eng. Comput. Sci., vol. 26, no. 1, pp. 1–11, Jan. 2018. doi: 10.3906/elk-1611-235. [Google Scholar] [CrossRef]
26. F. S. Alotaibi, “Implementation of machine learning model to predict heart failure disease,” Int. J. Adv. Comput. Sci. Appl., vol. 10, no. 1, pp. 115–120, Jan. 2019. doi: 10.14569/issn.2156-5570. [Google Scholar] [CrossRef]
27. A. Abd El-Latif et al., “Prediction of heart disease using a combination of machine learning and deep learning,” Comput. Intell. Neurosci., vol. 2021, no. 1, Feb. 2021, Art. no. 8387680. doi: 10.1155/2021/8387680. [Google Scholar] [PubMed] [CrossRef]
28. N. Janaraniani, P. Divya, E. Madhukiruba, R. Santhosh, R. Reshma and D. Selvapandian, “Heart attack prediction using machine learning,” in 2022 4th Int. Conf. Inventive Res. Comput. Appl. (ICIRCA), Coimbatore, India, Sep. 22–24, 2022, pp. 854–860. [Google Scholar]
29. L. Riyaz, M. A. Butt, M. Zaman, and O. Ayob, “Heart disease prediction using machine learning techniques: A quantitative review,” in Int. Conf. Innov. Comput. Commun., A. Khanna, D. Gupta, S. Bhattacharyya, A. E. Hassanien, S. Anand and A. Jaiswal, Eds. New Delhi, India, Springer, Feb. 20–21, 2022, pp. 81–94. [Google Scholar]
Cite This Article
 Copyright © 2024 The Author(s). Published by Tech Science Press.
This work is licensed under a Creative Commons Attribution 4.0 International License , which permits unrestricted use, distribution, and reproduction in any medium, provided the original work is properly cited.
 Downloads
 Citation Tools