
 Submit a Paper
 Propose a Special lssue
 Open Access
ARTICLE

A Quarterly High RFM Mining Algorithm for Big Data Management
1 School of International Education, Guangdong University of Technology, Guangzhou, 510006, China
2 School of Computer Science and Technology, Guangdong University of Technology, Guangzhou, 510006, China
3 Business Administration, South China University of Technology, Guangzhou, 510641, China
4 Guangzhou Institute of Technology, Xidian University, Guangzhou, 710071, China
* Corresponding Author: Jiahui Chen. Email:
Computers, Materials & Continua 2024, 80(3), 4341-4360. https://doi.org/10.32604/cmc.2024.054109
Received 19 May 2024; Accepted 09 August 2024; Issue published 12 September 2024
 View Full Text
 Download PDF
Abstract
In today’s highly competitive retail industry, offline stores face increasing pressure on profitability. They hope to improve their ability in shelf management with the help of big data technology. For this, on-shelf availability is an essential indicator of shelf data management and closely relates to customer purchase behavior. RFM (recency, frequency, and monetary) pattern mining is a powerful tool to evaluate the value of customer behavior. However, the existing RFM pattern mining algorithms do not consider the quarterly nature of goods, resulting in unreasonable shelf availability and difficulty in profit-making. To solve this problem, we propose a quarterly RFM mining algorithm for On-shelf products named OS-RFM. Our algorithm mines the high recency, high frequency, and high monetary patterns and considers the period of the on-shelf goods in quarterly units. We conducted experiments using two real datasets for numerical and graphical analysis to prove the algorithm’s effectiveness. Compared with the state-of-the-art RFM mining algorithm, our algorithm can identify more patterns and performs well in terms of precision, recall, and F1-score, with the recall rate nearing 100%. Also, the novel algorithm operates with significantly shorter running times and more stable memory usage than existing mining algorithms. Additionally, we analyze the sales trends of products in different quarters and seasonal variations. The analysis assists businesses in maintaining reasonable on-shelf availability and achieving greater profitability.Keywords
Retail has become increasingly competitive, prompting offline stores to confront mounting profit pressures. Effective shelf management is a critical determinant of store performance, as it directly influences sales and ultimately shapes profit potential. In response, many retailers have leveraged big data technologies to enhance their shelf management capabilities. For instance, applying frequent pattern mining techniques [1] enables retailers to identify frequently occurring itemsets in transaction databases, optimize shelf layout for customer convenience, and contribute to increased profitability.
However, frequent pattern mining techniques solely focus on item frequency, overlooking other crucial factors such as profit margins. Subsequently, utility pattern mining methods have been employed to identify high-profit itemsets from transaction databases [2]. Placing these high-value products in prominent shelf locations where customers are most likely to see them can optimize shelf layout, maximizing the benefits of on-shelf products [3]. Nevertheless, most utility pattern mining algorithms only focus on identifying the profitability of products without regard for shelf occupancy time. This oversight is impractical since shelf occupancy time varies: some products are seasonal or influenced by holidays, performing efficiently only during specific seasons [4]. We illustrate the inadequacy of utility pattern mining results by considering two scenarios. In the first scenario, low-priced items like ice cream cause high utility only during summer, not throughout the year. Consequently, the mining results might mislabel ice cream as low-utility items. In the second scenario, products with high prices, like down jackets, may show significant annual turnover in utility pattern mining results. However, these products are only bestsellers during specific seasons (e.g., summer and winter). Therefore, mining results overlook the temporal factor, fail to reveal the actual sales patterns of products comprehensively, and are unable to assist retailers in determining the optimal selling time for products. Consequently, traditional utility pattern mining algorithms lack applicability in this regard. The study [5] proposed on-shelf utility pattern mining to address the issue of uneven on-shelf time for products. Although they accounted for product on-shelf time, their method was insufficiently rational and practical, as it merely divided the total time into several time slots without considering the practical application in offline stores.
A key metric in shelf management is On-Shelf Availability (OSA), which refers to the ratio of actual stocked items on the shelf to the total capacity of the shelf, indicating the proportion of non-empty products on the shelf. A low OSA indicates stockouts, where consumers cannot find the products they plan to buy on the supermarket shelves. Stockouts inevitably lead to unpleasant customer shopping experiences, reducing customer satisfaction and loyalty while forfeiting valuable profit opportunities [6]. This outcome is undesirable for retailers. Hence, many retailers have realized the importance and necessity of improving OSA and have taken measures to enhance it. However, unquestioningly striving for high OSA on all shelves may not maximize profits. Maintaining full-shelf OSA requires constantly stocking sufficient inventory, incurring significant replenishment costs. Additionally, in smaller stores, excessive stocking can lead to product clutter and a crowded shopping environment, adversely affecting the customer experience. Moreover, excessively high OSA indicates slow-moving products, suggesting a failure to stock items aligned with customer preferences and inefficient use of limited shelf resources, resulting in wastage. Therefore, a suitable OSA is crucial and necessary. It not only enhances the shopping experience for customers but also increases the potential for business profitability.
In the retail industry, RFM pattern mining is a commonly used and effective method that segments and evaluates customers based on their behavior. According to RFM analysis, retailers can better understand various customer segments’ purchasing habits, enabling them to formulate targeted marketing strategies to increase sales volume and profitability. However, RFM analysis assumes the availability of accurate customer identity information, which is often challenging for retailers to obtain. For instance, some customers do not use membership cards or share their cards with others, and thus, it is difficult for retailers to static precise customer identity information. Therefore, the RFM pattern was proposed to find interesting results without requiring customer identity information. RFM patterns refer to sets of patterns within recency (R), frequency (F), and monetary (M) values that are all higher than predefined minimum thresholds. RFM pattern mining holds practical and effective significance for the retail industry. In detail, recency reflects the recent activity level of the product, with higher recency indicating recent popularity. Frequency denotes the number of times the product has been purchased, indicating its popularity. Monetary represents the sales amount of the product, reflecting its utility value. It aims to discover customer purchasing preferences and potential interesting patterns based on transaction records. This helps retailers manage products on shelves, maintain reasonable shelf availability, and ultimately, greater business profitability. However, most RFM pattern mining algorithms do not consider OSA application. The core contribution of these heuristic approaches is how to be more efficient in mining RFM patterns.
To address the above issues, we propose a novel OS-RFM pattern mining algorithm considering seasonality. Compared with existing RFM algorithms that do not consider time factors, the newly designed OS-RFM pattern considers the shelf occupancy time of products every quarter. This allows us to analyze the sales trends of products in different quarters and seasonal variations, thereby adjusting the products on shelves. Thus, the issue of shelf availability in the retail industry is tackled. In addition, compared to the existing on-shelf utility pattern mining, the superiority of the proposed method lies in its more precise and practical consideration of the shelf occupancy time of products, which is more directly applicable to offline stores. However, it is essential to note that since the on-shelf time is measured every quarter, the R and F values calculation is also quarterly-based. This study aims to utilize the mining results of the OS-RFM patterns to analyze the sales trends of products in different quarters and seasonal variations, thereby adjusting the products on shelves to maintain reasonable shelf availability, enhance the sales capability of retailers, and achieve greater profitability. The major contributions of our work are summarized as follows:
1. We introduce a quarterly RFM pattern mining algorithm for on-shelf datasets, termed OS-RFM, aimed at mining comprehensive OS-RFM patterns from transaction databases containing temporal records. Our algorithm can mine the patterns of high recency, high frequency, and high monetary utility and consider the period of the on-shelf goods in quarterly units. Thus, it can solve the problem of on-shelf availability in the retail industry.
2. We conduct experimental evaluations and comparisons on real datasets and synthetic datasets to assess the effectiveness and performance of our proposed algorithm. Compared with the state-of-the-art RFM mining algorithm, our algorithm can mine more patterns and is effective in Precision, Recall, and F1-score features. Also, our algorithm outperforms the compared algorithms regarding running time and memory usage.
3. We perform performance testing on a synthetic dataset, obtaining information on products with high recency, frequency, and monetary value across all quarters. Additionally, we analyze product sales trends in different quarters and seasonal variations. The analysis assists businesses in maintaining reasonable on-shelf availability and achieving greater profitability.
The rest of the content of this paper is structured as follows: Section 2 discusses related work. Then, Section 3 introduces basic definitions and problem statements of the OS-RFM pattern mining task, and Section 4 elaborates on the new algorithm proposed in this study. Furthermore, Section 5 shows the experimental results. Finally, Section 6 provides conclusions and an outlook for future work.
In the face of increasing profit pressures in the retail industry, many researchers have begun to focus on solving the problem of maximizing shelf profitability. Yang et al. [7] proposed a comprehensive model to optimize shelf space allocation and management, which enhances the effectiveness of allocation while reducing inventory levels and improving customer satisfaction. Satapathy et al. [8] introduced simple selfie cameras for real-time shelf checks, enabling restocking alerts and increasing shelf availability. Additionally, some researchers have integrated shelf management with big data technology applications. For instance, Chan et al. [2] utilized utility pattern mining to discover high-profit itemsets from transaction databases, optimizing shelf displays for maximizing on-shelf profitability. However, most utility mining algorithms assume uniform shelf occupancy time for all items, whereas in reality, shelf occupancy time varies, influenced by factors such as seasonality and holidays. For example, ice cream sells well in summer, while turtleneck sweaters are popular in winter. To address the issue of uneven shelf occupancy time, Lan et al. [5] introduced the concept of high-utility itemsets on shelves, considering both profit and shelf occupancy time, and proposed a two-stage algorithm for mining high-utility itemsets. Recently, Chen et al. [9] utilized a heuristic pattern mining algorithm to discover on-shelf high utility itemsets from transaction databases. This helps retailers optimize shelf layout by grouping itemsets to increase profitability.
All the above studies considered products’ shelf occupancy time. However, compared with previous studies, the algorithm proposed in this paper can provide adequate quarterly sales data for retailers by considering the quarterly shelf occupancy time, which is conducive to direct application by enterprises and can quickly adjust shelf layout to meet the demand for goods in different seasons, ultimately increasing the profitability of enterprises.
RFM analysis is a data-driven marketing technique based on customer purchasing behavior, which serves as a powerful and effective method for clustering or classifying customers. Tavakoli et al. [10] pointed out that RFM analysis can provide helpful information for retailers, such as predicting customers’ behavior, including whether they will revisit the market soon, their shopping frequency, and expenditure amounts. Heldt et al. [11] proposed a new model called RFM/P to predict the customer value of each product. This model combines product and customer marketing perspectives, giving managers a more complete strategic perspective on the product portfolio and customers. Tasabat et al. [12] proposed the RFMS model and developed a more efficient classification method for managing customer relationships, which improved the efficiency process of the company. However, RFM analysis provides only a basic understanding of customer behavior and may not reveal underlying patterns or relationships. Data mining technology, on the other hand, can assist businesses in gaining a deeper insight into customer behavior by analyzing transaction data. This approach can uncover hidden patterns and relationships, categorize customers into different levels, and facilitate customer segmentation, ultimately enhancing customer engagement. Therefore, RFM analysis is often combined with data mining techniques [13] to discover customer behavior patterns, thereby assisting companies in making better business decisions. More specifically, RFM analysis calculates the corresponding scores for each customer based on their recency, frequency, and monetary values to derive each customer’s RFM score. Subsequently, customers are segmented into different groups by taking collected scores as a basis. Companies can thus develop more targeted and personalized marketing strategies to meet the unique needs of different customer groups. Liao et al. [14] proposed a multi-behavior RFM based on the self-organizing map algorithm to analyze various customer behaviors. Chen et al. [15] developed a data-driven recommendation model based on customer purchase and product sales behavior using improved RFM analysis and association rule mining to enhance retail transactions.
However, the above studies consider customer identity to be crucial information. In reality, customer identity information is sensitive and often undisclosed. Moreover, retailers often struggle to obtain accurate customer identity information because some customers do not possess membership cards or potentially lend them to others, thereby complicating the process of obtaining accurate customer identity information. Hu et al. [16] first applied RFM analysis to pattern mining without customer identity information. They proposed the RFM pattern concept and demonstrated that “RFM customers” are subsets of patterns in some cases. Subsequently, Wan et al. [17] proposed a more efficient and scalable RFM mining algorithm called RFMUL. Besides, Wan et al. [18] also proposed another efficient mining algorithm to address the RFM pattern mining task, which performs better than previous approaches.
For comprehensive and practical considerations, this paper also explores RFM patterns and discovers attractive customer purchasing preferences and sales patterns of products, solely based on customers’ product transaction records, without requiring customer identity information. Although RFM analysis can be conducted without customer identity information, the quality and integrity of data remain challenging. However, our algorithm can provide adequate quarterly sales data, which is beneficial for businesses to analyze product sales trends in different quarters and seasonal variations, thereby maintaining reasonable on-shelf availability and achieving greater profitability.
3 Preliminaries and Problem Definition
In this section, we introduce the preliminaries and definitions related to on-shelf RFM pattern mining task. Some basic definitions are as follows.
Definition 1. (Transaction Database) Let
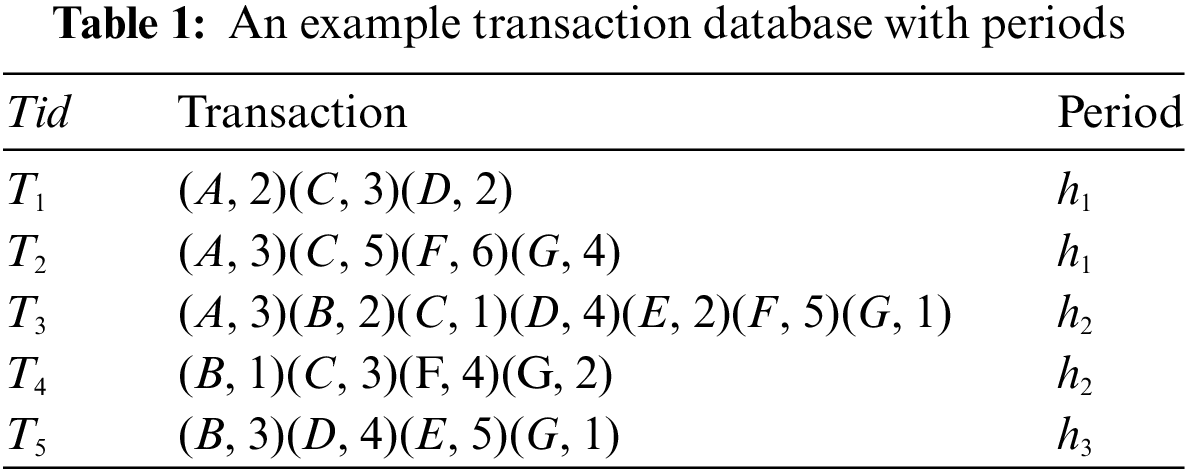
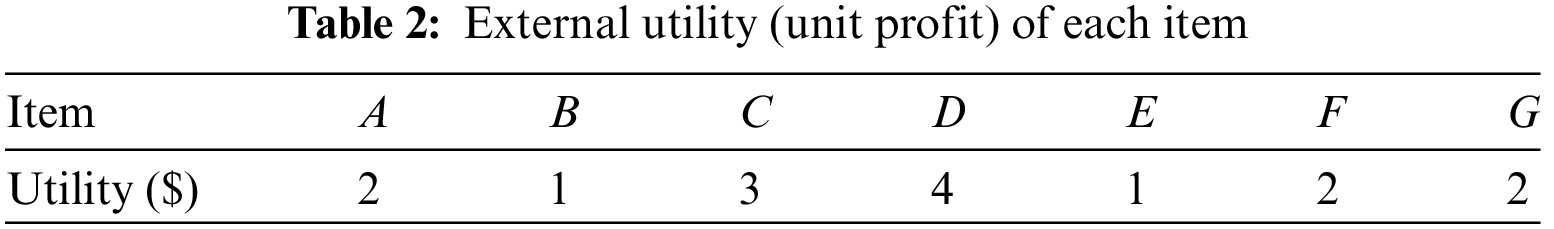
Definition 2. (Utility of an Itemset in a period) Let
During a period ℎ ∈ (X)), the utility of an itemset
The overall utility of an itemset X in a D is denoted as
Definition 3. (Relative Utility of an Itemset) For a transaction
The total utility of the periods of X is computed as
Besides, the utility of a period h is donated as
The relative utility of an itemset X for a period
The above content is all about the definitions related to on-shelf pattern mining. Since this paper integrates the RFM pattern, the following will introduce the relevant definitions of RFM pattern.
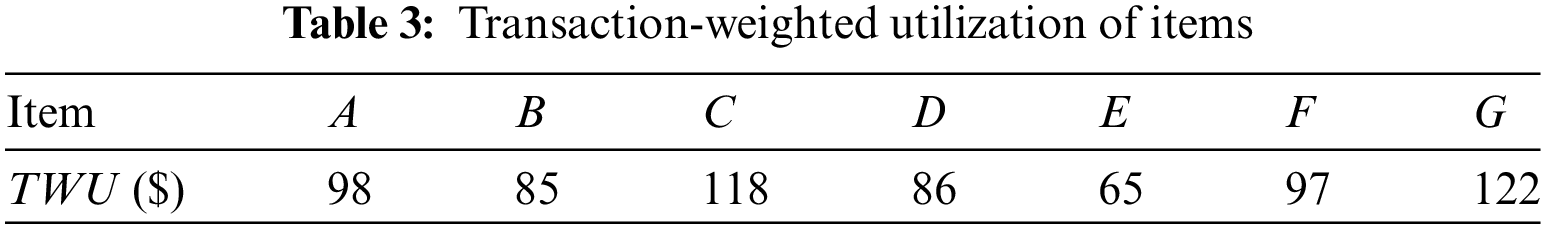
Definition 4. (Transaction-Weighted Utilization [19]) For a specific period ℎ, TWU of an itemset X is the sum of the transaction utilities of transactions from h that contain X, and denoted as
Property 1. For a given period ℎ, the TWU of an itemset X represents the upper-bound on the utility of X,
Strategy 1. (TWU Pruning Strategy) For an itemset X, if there does not exist a period ℎ for which
Definition 5. (Recency pattern) Consider an itemset X within a transaction
where |D| denotes the total number of transactions in D. Moreover, the sum of recency values across all transactions in D containing X is given by
For a period h, the sum of recency values across all transactions containing X in h is donated as
An itemset is classified as a recency pattern only if
Property 2. According to the Definition 5, the recency value is related to the number of the transactions containing the itemset. The inequality
Proof. Assuming two itemsets X and Y (X ⊆Y), the number of transactions containing X is more than that containing Y. Therefore, if R(X) does not satisfy the condition, then R(Y) must also be lower than γ. Similarly, for a period h, if
Strategy 2. (Recency Pruning Strategy). Based on Property 2, if
Definition 6. (Frequency Pattern) The frequency value reflects the count of occurrences of an itemset, and it is equal to the number of the transactions that contain X. In a database D, it is denoted as
For a period h, it is denoted as
In particular, only if F(X, h) not less than |D| × α (
Property 3. According to the Definition 6, the frequency value is related to the occurrence times of the itemset. The inequality
Proof. Assuming two itemsets X and Y (X ⊆Y), the occurrence of X is more than Y, if F(X) does not satisfy the condition
Strategy 3. (Frequency Pruning Strategy) Based on Property 3, if
In this study, the global order
Definition 7. (Remaining utility) For a given period h, the remaining utility of X in h is defined as
Definition 8. (Remaining Utility Upper-Bound [9]) Given an itemset X and a period h, the sum of iutil and rutil values in the ℎ-based period from the OS-RFM-list of
Property 4. Let X be an itemset and h be a period.
Strategy 4. (Remaining Utility Upper-Bound Pruning Strategy ). For an itemset X, if there is no period ℎ such that
Definition 9. (pOS-RFM pattern) Given a transaction database D and three user-specified thresholds
Definition 10. (OS-RFM pattern). If an itemset X satisfies the three following constraints:
Definition 11. (OS-RFM-List) The OS-RFM-list of an itemset X in D consists of four rows, and each row is a quadruple (period, tid, iutil, rutil), where period represents the identification of a period h that contains X, tid represents the identification of a transaction that contains X, the iutil element corresponds to the utility of X in
To create the OS-RFM-List structure for an l-itemset (l ≥ 2) without scanning the database multiple times, the lists of two different (l-1)-itemsets that have some same tid in the same period h are directly joined. Subsequently, in relation to the utility of the l-itemset, the term itutil represents the sum of the respective utilities of the two component itemsets, where rutil is based on the smaller one. In the Fig. 1 the OS-RFM-lists {A}-List and {B}-List have the same tids (i.e.,
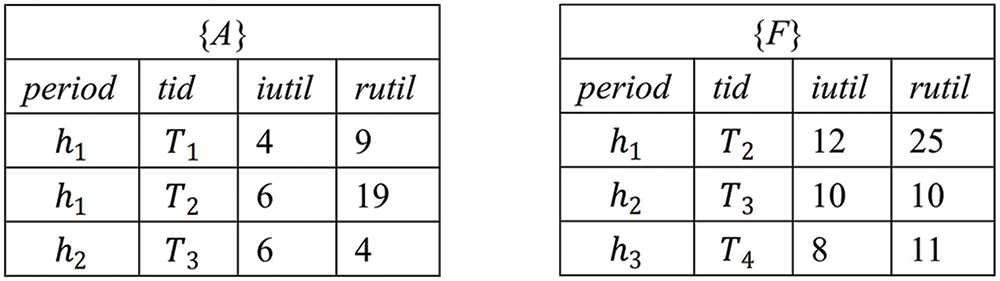
Figure 1: The OS-RFM-List of 1-itemsets

Figure 2: The OS-RFM-List of a 2-itemset
Problem Statement. Based on the definitions, the problem of the OS-RFM pattern mining task involves identifying a comprehensive set of OS-RFM patterns from a transaction database D, considering three minimal thresholds (i.e., recency, frequency, and monetary).
In this section, the detail about the proposal OS-RFM algorithm and time complexiy analysis are presented below.
The main procedure (Algorithm 1) begins by requiring several key input parameters, including a transaction database, a minimum recency threshold, a delayed recency rate, a minimum frequency threshold, and a minimum utility threshold. The algorithm initially iterates through the entire database to calculate the TWU of each item i in h, the frequency and recency of i and pto(h) of each period h

The Search procedure (Algorithm 2) takes seven parameters as input: (1) a prefix itemset P; (2) the OS-RFM-Lists of a prefix itemset


This section presents a series of experiments designed to assess the effectiveness of the proposed algorithm. The algorithms are implemented in Java and tested on Windows. In this section, we will analyze the time complexity of Algorithm 2. In a time period when X appears in the 1-extensions itemset, item X must traverse that period to find Y (X < Y) that meets the criteria. In the worst-case scenario, XY appears in all transactions, and each transaction belongs to a distinct period. Because the items in the 1-extensions itemset are arranged in order, the time complexity of constructing an
We present a series of experiments designed to assess the effectiveness of the proposed algorithm. The algorithms are implemented in Java and tested on Windows 10 with 16 GB memory and Intel(R) Core (TM) i7-8550U CPU@1.80 GHz.
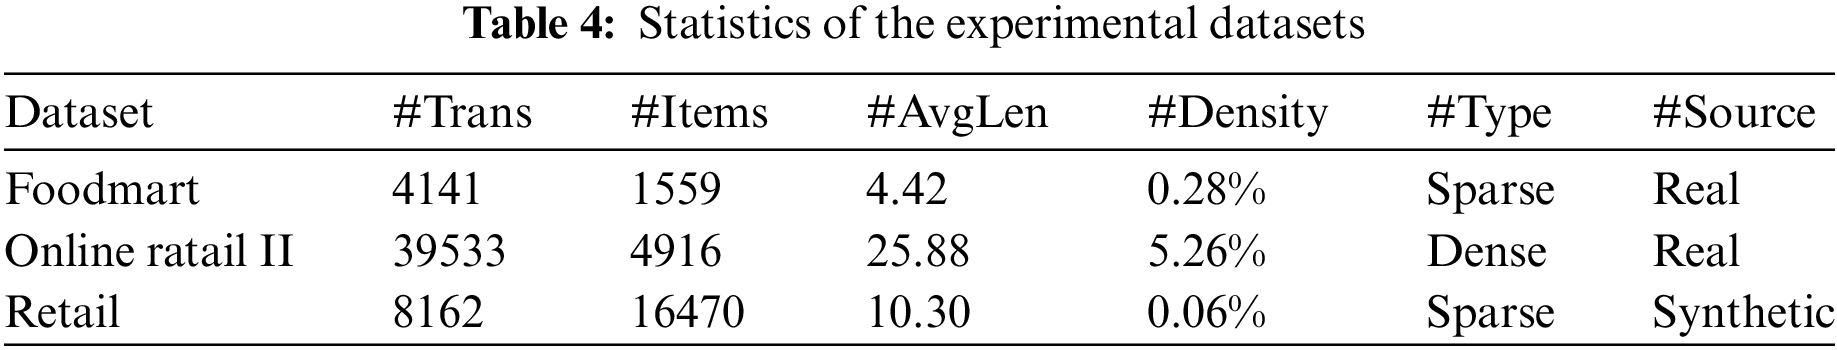
Experiments were performed using a set of standard datasets, namely Foodmart, Online Retail II, and Retail. These datasets are chosen because they all belong to the retail field and each transaction records the transaction time, which aligns with the OS-RFM algorithm’s application scenario. In addition, these datasets have different characteristics such as size, source, and type. Conducting experiments using these datasets can more effectively demonstrate the algorithm’s effectiveness. Table 4 summarizes their characteristics. Among them, the two real datasets, Foodmart, and Online Retail II, were used in the empirical evaluation. The Foodmart transaction dataset, provided by Microsoft SQL Server 2000, contains sales records from 24 stores from 1997 to 1998. It is a small and sparse dataset with short transactions. In contrast, Online Retail II is a large and dense dataset with moderately long transactions, comprising all transaction records of a non-brick-and-mortar online retailer registered in the UK between 1 December, 2009 and 9 December 2011. As this paper does not consider negative profits and does not require customer identity information, we preprocessed the datasets by removing irrelevant information such as product descriptions, transactions with negative profits, customer IDs, and transaction countries. Another synthetic dataset called “Retail” is used to perform an ablation study. It is a small and sparse dataset with moderately short transactions sourced from customer transactions at an anonymous retail store in Belgium.
5.1 Overall Performance Evaluation
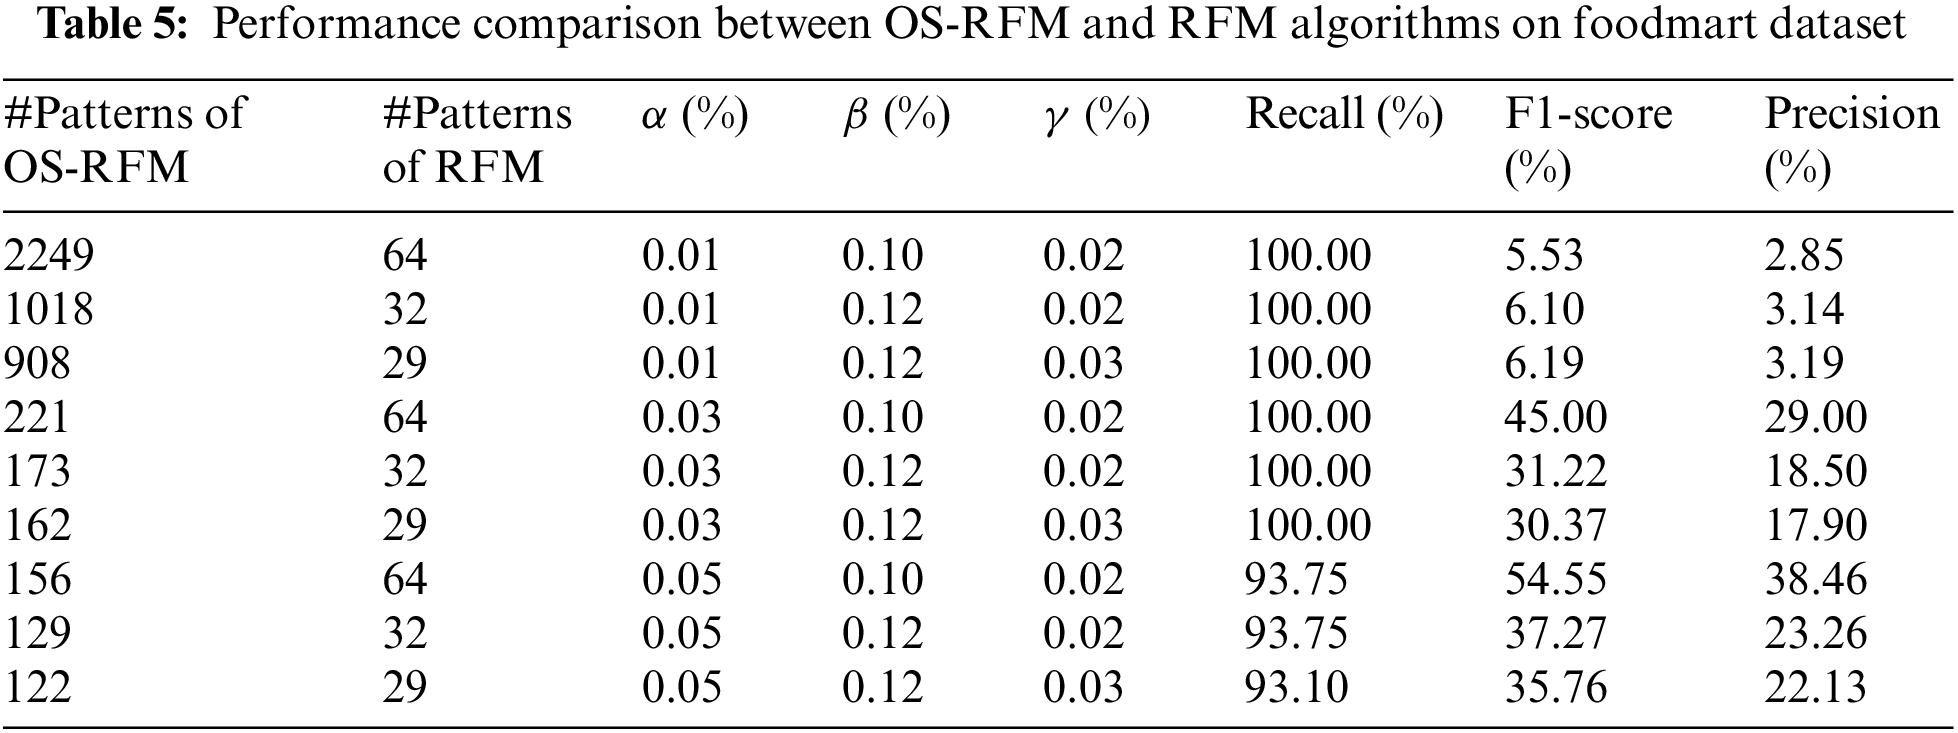
Table 5 provides a comparative analysis of the OS-RFM and RFM algorithms [17] regarding numbers of generated patterns, Precision, Recall, and F1-score, using various threshold parameter settings on the Foodmart dataset. Specially, we assume the delay rate is fixed at 0.1. Notably, both algorithms demonstrate a decrease in the number of results as threshold parameters increase. As previously content introduced, the RFM algorithm considers patterns relative to the entire year, but the OS-RFM algorithm considers each period individually. Consequently, OS-RFM will output more interesting patterns than that of RFM algorithms. As shown in Table 5, the high recall rate of OS-RFM, which is close to 100%, indicates its capability to identify the most significant patterns recognized by RFM. Although OS-RFM has relatively low precision, with the highest accuracy below 40%, this does not imply inferior performance; instead, it highlights its effectiveness in uncovering additional patterns characterized by high recency, frequency, and utility within specific periods. This is a challenging task for RFM pattern mining algorithms due to their low sensitivity to periods. However, the OS-RFM algorithm evaluates patterns per period, while the RFM algorithm evaluates them across entire periods, resulting in different outcomes. The OS-RFM algorithm partially replicates the effects of RFM, thus leading to a lower F1-score, averaging 28%.
To better compare OS-RFM with RFM and highlight the effectiveness of the OS-RFM algorithm, we conducted a comparative experiment between the sub-algorithms of OS-RFM and RFM [17] regarding the number of mining results on the Foodmart dataset. OS-R, OS-F, and OS-M are the sub-algorithms of OS-RFM algorithm. Similarly, R, F, and M are the sub-algorithms of RFM algorithm. The OS-R algorithm only considers recency factors and aims to discover patterns that meet the minimum reception threshold within each period. Therefore, when implemented, the frequency and utility thresholds must be set to 0. OS-F, OS-M, R, F, and M work similarly. Addtionally, OS-R compares with R, OS-F with F, and OS-M with M. As shown in Fig. 3, the number of mining results for all algorithms decreases as the threshold increases. In addition, although the OS-R algorithm has fewer mining results than the R algorithm in Fig. 3b when the threshold is set higher, it can be seen that it has a more significant number of mining results than the R algorithm in other cases. The number of results from OS-F and OS-M algorithms is much greater than from F and M algorithms, particularly in Fig. 3c.

Figure 3: Comparison of OS-RFM and RFM algorithms in mining result patterns
In summary, the proposed algorithm effectively explores patterns meeting recency, frequency, and utility thresholds, leveraging product on-shelf time considerations. Under reasonable parameters, the OS-RFM algorithm identifies more valuable patterns than RFM algorithm, such as seasonal items, providing actionable insights for businesses to optimize stocking strategies, ensure on-shelf availability, and enhance profitability while satisfying customer demand. We explore the performance of our algorithm and the compared algorithm to show the efficiency analysis. It should be noted that the accuracy, recall, and F-score results are all because the OS-RFM algorithm mines more patterns than the RFM algorithm.
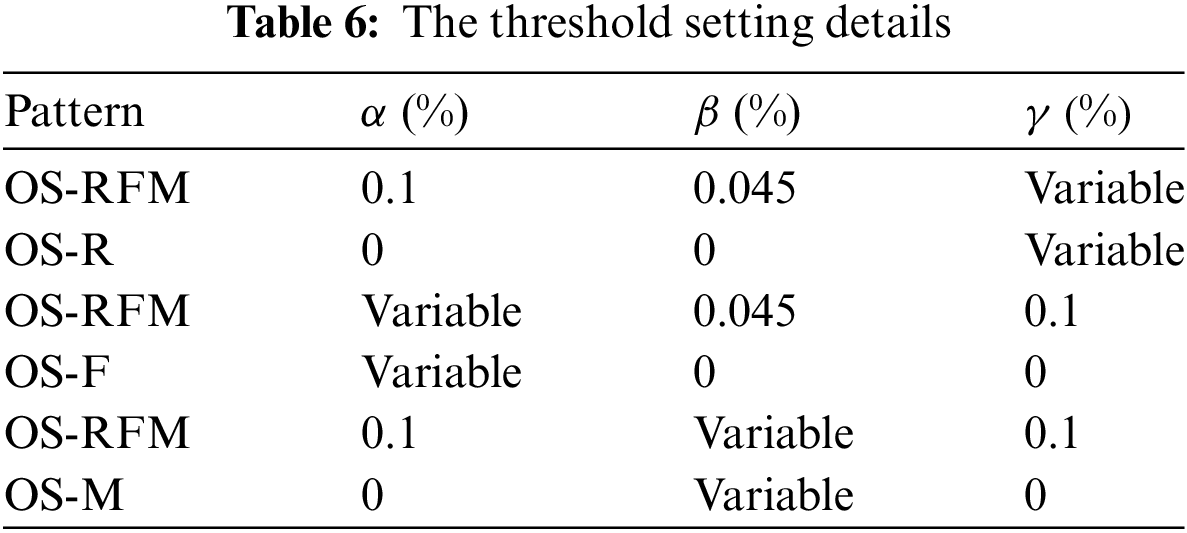
Next, we explore the runtime and memory usage of our algorithm and the compared baseline algorithm [19] to show the efficiency analysis. The experiments are based on the Retail dataset, generating a dataset Retail_p4 for performance testing with four periods. As far as we know, current RFM mining algorithms cannot deal with on-shelf datasets, and we found OS-M [19] a suitable mining algorithm for, so we use it as our benchmark algorithm and compared our algorithm with it. TheOS-R and OS-F are all sub-algorithms of the OS-RFM algorithm. The OS-R algorithm only considers recency factors and aims to discover patterns that meet the minimum recency threshold within each period. Therefore, when implemented, the frequency and utility thresholds must be set to 0. OS-F and OS-M work similarly. The experimental parameter settings are shown in Table 6. Besides, “variable” denotes the threshold used for testing. In particular, the delay rate of tested algorithms is set as 0.1.
As shown in Figs. 4 and 5, the OS-RFM algorithm performs significantly more efficiently than the other algorithms in terms of runtime and memory consumption. In Fig. 4, as the threshold increases, the runtime of all algorithms decreases. Additionally, it can be observed that the OS-RFM algorithm has a notably shorter runtime, all of which are less than those of the OS-R, OS-F, andOS-M algorithms. Due to the OS-RFM list structure and some efficient pruning strategies we adopted, such as the strategies of recency, frequency, and TWU, the OS-RFM algorithm can strikingly reduce the runtime. In Fig. 5, although the OS-RFM algorithm consumes more memory than the OS-R algorithm under different thresholds, OS-RFM costs less than the other two algorithms. Furthermore, the memory consumption of the OS-RFM algorithm is relatively stable, while that of the OS-R, OS-F, and OS-M algorithms fluctuates significantly.

Figure 4: Runtime cost on Retail dataset (a) Runtime cost comparison between OS-RFM and OS-R algorithm; (b) Runtime cost comparison between OS-RFM and OS-F algorithm; (c) Runtime cost comparison between OS-RFM and OS-M algorithm

Figure 5: Memory usage on Retail dataset (a) Memory usage comparison between OS-RFM and OS-R algorithm; (b) Memory usage comparison between OS-RFM and OS-F algorithm; (c) Memory usage comparison between OS-RFM and OS-M algorithm
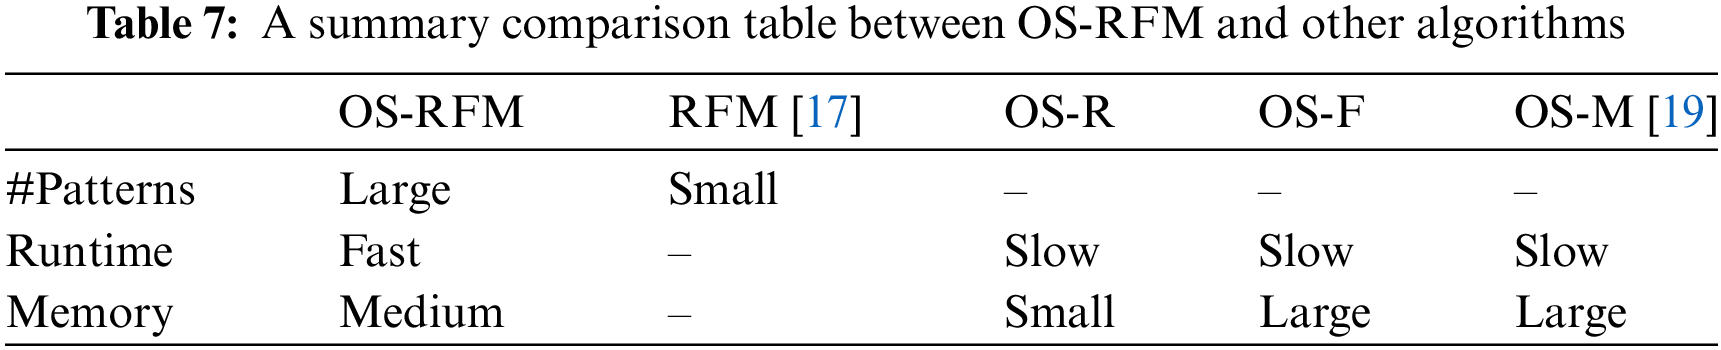
Thereafter, a summary table that compares OS-RFM with other algorithms in terms of the number of mining result patterns, runtime, and memory usage is given in Table 7. It can be seen that OS-RFM performs well in all comparisons.
In this section, we try to enable enterprises to gain further insights into the monthly changes in the recent activeness, popularity, and sales revenue of products throughout the year, allowing them to implement shelf management strategies flexibly. This experimental study employs the Online Retail II dataset, divided into 12 periods based on months. The recency, frequency, and utility values of products in each period (month) are calculated and plotted into graphs to analyze the sales situation of products over time. To further reveal the interesting and valuable insights about products reflected by the graphs using the OS-RFM algorithm, the beach bag and parasol products will be taken as an example to elaborate on the insights revealed by the OS-RFM algorithm.
Fig. 6a reveals the recency of beach bag and parasol products over a year, reflecting the product’s recent activity level change throughout the year. Note that next we will give the study analysis of parasol products in the bracket. It can be seen from the figure that the recency value of the beach bag (parasol) is higher from June to August (in June and December), reaching its peak value of 1.85 (2.4) in June (December). However, the recency value of beach bag (parasol) is lower from September to November (January to February and also in November), with the lowest value being less than 0.02 (0.3). The difference between the maximum and minimum values is quite significant. This suggests that the product’s sales fluctuate wildly, and the beach bag is most active and popular with customers from June to August in the summer. However, fewer people purchase it from September to November. Enterprises can utilize the recency information on the beach bag to restock in advance and boost the quantity of the beach bag on shelves in June, fulfilling customer demand and enhancing profitability. By examining the trends in the recency value of items like beach bags and parasol over time, enterprises can identify the peak popularity periods and the less favorable ones. This enables them to restock beforehand, adjust the timing and quantity of products on shelves, ensure reasonable stock availability, prevent profit opportunities from being missed due to stock-outs during peak demand, and also avoid stocking up excessively during periods of low demand, which could lead to overcrowding and impact the sales of other more valuable items on the shelves.

Figure 6: The variation in recency, frequency, and monetary values of beach bags and parasol throughout the year (a) The variation in recency values of beach bags and parasol throughout the year; (b) The variation in frequency values of beach bags and parasol throughout the year; (c) The variation in monetary values of beach bags and parasol throughout the year
Fig. 6b depicts the change in the frequency of beach bag and parasol products over a year, reflecting the changes in the product’s popularity over time. A higher frequency indicates that the product is more popular and has been purchased more frequently. As shown in the figure, the frequency value of the beach bag (parasol) has been increasing from April to June (March to July and October to December), with a sharp growth rate, reaching its maximum value in June (December). Besides, the frequency values of beach bag from September to December are relatively low. This indicates that the weather dramatically influences the beach bag. June to August is the peak sales period for the beach bag, as it is summer when the weather is scorching, which is suitable for people to purchase beach bags for the beach. However, from September to December, during the autumn and winter, when the weather is colder, fewer people purchase it, marking the off-season for the product. Retailers can make informed stocking decisions based on this information, increasing inventory in early May to add more beach bags to the shelves for customers to select. Additionally, they can appropriately reduce the number of items on shelves in September to prevent overcrowding and interfere with the sales of autumn and winter products. Retailers can maximize profits by accurately identifying the peak and off-peak products sales periods. Similarly, retailers can gain insight into their store’s monthly sales by analyzing the trends in similar products’ frequent value changes. This helps to pinpoint the peak sales periods and the off-peak periods. This information is crucial for retailers to scientifically and efficiently plan their inventory levels, ensuring adequate products are available on shelves for customers while preventing overstocking or understocking. It also enables retailers to use their limited funds effectively for procurement, avoiding the risks of overstocking and tying up funds, which can impact cash flow or lead to missed profit opportunities during the limited peak seasons.
Fig. 6c introduces the change in the utility of beach bag and parasol products throughout the year. It can be observed from the figure that the sales revenue of the product fluctuates greatly over time. The sales revenue of beach bag (parasol) shows an increasing trend from April to August (March to August and October to December), with a slight decrease in July (July) but still maintaining an average level for the year, reaching its peak value of nearly $48,000 ($11,000) in August (December). Overall, the sales peak for the beach bag (parasol) is from May to August (June to August and in December), while the sales revenue in other months is relatively low, around $4000 ($3000). Enterprises can leverage the intricate sales patterns of the product to flexibly manage inventory and adjust the quantity of items displayed on shelves. For instance, from May onwards, gradually and appropriately boost both inventory and the number of items on shelves to satisfy customer demand, while making suitable reductions in September. This approach ensures the capture of valuable profit opportunities and maximizes the return on products displayed. Likewise, by analyzing trend graphs of comparable product sales over time, enterprises can scrutinize the actual profits generated by their products. If profits during a specific period are insufficient (making a minor contribution to the overall corporate profit). In this case, enterprises might consider removing the product or reducing its display quantity for that period to prevent the squandering of shelf space by low-value items. Concurrently, products with more significant profit potential can be introduced, or their display numbers on shelves can be increased, sustaining a reasonable stocking rate to maximize the return on displayed products.
As evident from the analysis of the beach bag and parasol product, considering the trend of the product’s recency value, frequency value, and utility value over time is meaningful and effective. The new approach can provide enterprises with more valuable sales information, guiding them to adopt flexible and accurate strategies to adjust the shelving of products rather than temporarily stocking or shelving products due to unknown market fluctuations. This helps maintain a reasonable in-stock rate on shelves and brings more profits. Besides, it demonstrates that considering recency, frequency, or monetary loneliness will make it challenging to reflect the actual sales situation accurately. Moreover, the on-shelf pattern mining task only reflects the sale trend of products. This is not conducive to enterprises comprehensively grasping the profitability of a product. In conclusion, the novel algorithm in this paper can provide enterprises with more comprehensive and sufficient sales information, helping them maintain a reasonable in-stock rate on shelves and achieve greater profits.
In conclusion, the OS-RFM algorithm introduced in this paper considers quarterly patterns. It aims to discover OS-RFM patterns that exhibit high recency, frequency, and monetary value within specific periods. The effectiveness of this algorithm has been demonstrated through the utilization of real-life datasets and numerical and curve analyses. The numerical study comparing the accuracy, recall, and F1-score of OS-RFM and RFM using the real Foodmart dataset indicates that OS-RFM discovers most patterns identified by RFM and uncovers more meaningful patterns within specific periods. Additionally, experiments illustrate the variation of a product’s recency, frequency, and monetary value over the year, providing valuable insights for businesses to maintain reasonable shelf availability. Performance comparison between OS-RFM and other algorithms based on the Retail dataset shows that OS-RFM exhibits higher efficiency. In conclusion, the proposed OS-RFM algorithm can assist businesses in maintaining reasonable shelf availability and achieving greater profitability. The algorithm in this paper is mainly based on historical data analysis and may not respond more quickly to the changing market environment and customer behavior in real time. Future research should explore how to make algorithms more dynamic and real-time to better adapt to rapidly changing market demands. In addition, multi-source data fusion, careful consideration of multiple factors, data privacy, and security are essential for further development in this field.
Acknowledgement: This research was partially supported by the Foundation of State Key Laboratory of Public Big Data.
Funding Statement: This research was partially supported by the Foundation of State Key Laboratory of Public Big Data (No. PBD2022-01).
Author Contributions: Cuiwei Peng: Software design, Writing—original draft. Jiahui Chen: Conceptualization, Supervision, Funding. Shicheng Wan: Methodology, Writing—reviewing. Guotao Xu: Data curation, Software Programming. All authors reviewed the results and approved the final version of the manuscript.
Availability of Data and Materials: The data that support the findings of this study are available from the corresponding author, upon reasonable request.
Ethics Approval: Not applicable.
Conflicts of Interest: The authors declare that they have no known competing financial interests or personal relationships that could have appeared to influence the work reported in this paper.
References
1. R. Agrawal and R. Srikant, “Fast algorithms for mining association rules,” in Proc. 20th Int. Conf. Very Large Data Bases, VLDB, Santiago de Chile, Chile, Sep. 1994, vol. 1215, pp. 487–499. [Google Scholar]
2. R. Chan, Q. Yang, and Y. D. Shen, “Mining high utility itemsets,” in Proc. Third IEEE Int. Conf. Data Min., Melbourne, Florida, USA, 2003. doi: 10.1142/S0219622010004159. [Google Scholar] [CrossRef]
3. T. Flamand, A. Ghoniem, and B. Maddah, “Store-wide shelf-space allocation with ripple effects driving traffic,” Oper. Res, vol. 71, no. 4, pp. 1073–1092, 2023. doi: 10.1287/opre.2023.2437. [Google Scholar] [CrossRef]
4. G. P. Soysal and L. Krishnamurthi, “Demand dynamics in the seasonal goods industry: An empirical analysis,” Mark. Sci., vol. 31, no. 2, pp. 293–316, 2012. doi: 10.1287/mksc.1110.0693. [Google Scholar] [CrossRef]
5. G. C. Lan, T. P. Hong, and V. S. Tseng, “Discovery of high utility itemsets from on-shelf periods of products,” Expert. Syst. Appl., vol. 38, no. 5, pp. 5851–5857, 2011. doi: 10.1016/j.eswa.2010.11.040. [Google Scholar] [CrossRef]
6. J. Fernie and D. B. Grant, “On-shelf availability: The case of a UK grocery retailer,” Int. J. Logist. Manage., vol. 19, no. 3, pp. 293–308, 2008. doi: 10.1108/09574090810919170. [Google Scholar] [CrossRef]
7. M. H. Yang and W. C. Chen, “A study on shelf space allocation and management,” Int. J. Prod. Econ., vol. 60, pp. 309–317, 1999. doi: 10.1016/S0925-5273(98)00134-0. [Google Scholar] [CrossRef]
8. R. Satapathy, S. Prahlad, and V. Kaulgud, “Smart shelfie–Internet of shelves: For higher on-shelf availability,” in 2015 IEEE Region 10 Symp., Ahmedabad, India, May 2015, pp. 70–73. [Google Scholar]
9. J. Chen, X. Guo, W. Gan, C. M. Chen, W. Ding and G. Chen, “On-shelf utility mining from transaction database,” Eng. Appl. Artif. Intell., vol. 107, 2022, Art. no. 104516. doi: 10.1016/j.engappai.2021.104516. [Google Scholar] [CrossRef]
10. M. Tavakoli, M. Molavi, V. Masoumi, M. Mobini, S. Etemad and R. Rahmani, “Customer segmentation and strategy development based on user behavior analysis, RFM model and data mining techniques: A case study,” in IEEE 15th Int. Conf. e-Bus. Eng., Xi’an, China, Oct. 2018, pp. 119–126. [Google Scholar]
11. R. Heldt, C. S. Silveira, and F. B. Luce, “Predicting customer value per product: From RFM to RFM/P,” J. Bus. Res., vol. 127, pp. 444–453, 2021. doi: 10.1016/j.jbusres.2019.05.001. [Google Scholar] [CrossRef]
12. S. E. Taşabat, T. Özçay, S. Sertbaş, and E. Akca, A new RFM model approach: RFMS. in Industry 4.0 and the Digital Transformation of International Business. Singapore: Springer, pp. 143–172, 2023. [Google Scholar]
13. D. R. Liu, C. H. Lai, and W. J. Lee, “A hybrid of sequential rules and collaborative filtering for product recommendation,” Inf. Sci., vol. 179, no. 20, pp. 3505–3519, 2009. doi: 10.1016/j.ins.2009.06.004. [Google Scholar] [CrossRef]
14. J. Liao, A. Jantan, Y. Ruan, and C. Zhou, “Multi-behavior RFM model based on improved SOM neural network algorithm for customer segmentation,” IEEE Access, vol. 10, pp. 122501–122512, 2022. doi: 10.1109/ACCESS.2022.3223361. [Google Scholar] [CrossRef]
15. A. H. L. Chen and S. Gunawan, “Enhancing retail transactions: A datadriven recommendation using modified RFM analysis and association rules mining,” Appl. Sci., vol. 13, 2023, Art. no. 10057. doi: 10.3390/app131810057. [Google Scholar] [CrossRef]
16. Y. H. Hu and T. W. Yeh, “Discovering valuable frequent patterns based on RFM analysis without customer identification information,” Knowl. Based Syst., vol. 61, pp. 76–88, 2014. doi: 10.1016/j.knosys.2014.02.009. [Google Scholar] [CrossRef]
17. S. Wan, J. Chen, Z. Qi, W. Gan, and L. Tang, “Fast RFM model for customer segmentation,” in Companion Proc. Web Conf. 2022, Lyon, France, 2022, pp. 965–972. [Google Scholar]
18. S. Wan, J. Deng, W. Gan, J. Chen, and S. Y. Philip, “Fast mining RFM patterns for behavioral analytics,” in IEEE 9th Int. Conf. Data Sci. Adv. Anal., Shenzhen, China, 2022, pp. 1–10. [Google Scholar]
19. P. Fournier-Viger and S. Zida, “FOSHU: Faster on-shelf high utility itemset mining–with or without negative unit profit,” in Proc. 30th Annu. ACM Symp. Appl. Comput., Salamanca, Spain, 2015, pp. 857–864. [Google Scholar]
20. P. Fournier-Viger, C. W. Wu, S. Zida, and V. S. Tseng, “FHM: Faster high-utility itemset mining using estimated utility co-occurrence pruning,” in Found. Intell. Syst.: 21st Int. Symp., ISMIS 2014, Roskilde, Denmark, Jun. 25–27, 2014. pp. 83–92. [Google Scholar]
Cite This Article
 Copyright © 2024 The Author(s). Published by Tech Science Press.
This work is licensed under a Creative Commons Attribution 4.0 International License , which permits unrestricted use, distribution, and reproduction in any medium, provided the original work is properly cited.
 Downloads
 Citation Tools