
 Submit a Paper
 Propose a Special lssue
 Open Access
ARTICLE

FIBTNet: Building Change Detection for Remote Sensing Images Using Feature Interactive Bi-Temporal Network
1 School of Geographic Information and Tourism, Chuzhou University, Chuzhou, 239000, China
2 Anhui Province Key Laboratory of Physical Geographic Environment, Chuzhou University, Chuzhou, 239000, China
* Corresponding Authors: Jing Wang. Email: ; Jun Peng. Email:
Computers, Materials & Continua 2024, 80(3), 4621-4641. https://doi.org/10.32604/cmc.2024.053206
Received 27 April 2024; Accepted 14 August 2024; Issue published 12 September 2024
 View Full Text
 Download PDF
Abstract
In this paper, a feature interactive bi-temporal change detection network (FIBTNet) is designed to solve the problem of pseudo change in remote sensing image building change detection. The network improves the accuracy of change detection through bi-temporal feature interaction. FIBTNet designs a bi-temporal feature exchange architecture (EXA) and a bi-temporal difference extraction architecture (DFA). EXA improves the feature exchange ability of the model encoding process through multiple space, channel or hybrid feature exchange methods, while DFA uses the change residual (CR) module to improve the ability of the model decoding process to extract different features at multiple scales. Additionally, at the junction of encoder and decoder, channel exchange is combined with the CR module to achieve an adaptive channel exchange, which further improves the decision-making performance of model feature fusion. Experimental results on the LEVIR-CD and S2Looking datasets demonstrate that iCDNet achieves superior F1 scores, Intersection over Union (IoU), and Recall compared to mainstream building change detection models, confirming its effectiveness and superiority in the field of remote sensing image change detection.Keywords
Remote sensing change detection technology has broad applications in natural resource management, land change surveys, and many other scenarios. It is deeply integrated into human economic production and social life [1]. Early change detection methods generally used machine learning methods that manually extracted features. Ozcan et al. [2] detected buildings in satellite images through decision tree classifiers and morphological operations. They also identified building changes in bi-temporal images. Feng et al. [3] used multiband temporal texture and one-class random forest (OCRF) to detect changes in urban built-up areas. They improved change detection accuracy by combining spectral and temporal texture features. Li et al. [4] effectively detected building damage in the Dujiangyan urban area after the Wenchuan earthquake using one-class support vector machines (OCSFMs) combined with spectral and spatial features through object-level multitemporal classification. Traditional machine learning methods rely on manual feature extraction, which is limited by data quality and feature selection.
In recent years, deep learning has developed rapidly and has attracted the attention of many scholars. Deep learning has shown significant performance improvements in remote sensing image building change detection due to its ability to automatically learn features, better model generalization, and robustness to noise and outliers. Among them, convolutional neural networks (CNNs) have been extensively studied in building change detection because they can mine deeper and more robust abstract image features [5–7]. Currently, Siamese network structures have been widely studied for the characteristics of bi-temporal remote sensing image change detection. FC-Siam-Conc and FC-Siam-Diff are two fully convolutional Siamese network architectures with skip connections [8]. To better extract feature information from remote sensing images, backbones such as VGG-16 [6,9,10], ResNet [11,12], and attention mechanisms [6], Chen et al. [12–14] have been continuously applied, further enhancing the performance of these algorithms. In addition, the method of using dense skip connections between the encoder and decoder has been proposed and applied, extracting clearly defined change areas on season-varying bi-temporal remote sensing images in the CDD dataset [14]. Furthermore, a multitude of studies have revealed that the interaction between homologous and heterologous features significantly influences the model’s ultimate performance [11,15,16]. Fang et al. [11] introduced a feature exchange mechanism on the basis of a Siamese neural network, mutually learning the spatial and channel features of bi-temporal images, achieving better change detection performance.
However, the extraction of building change information from remote sensing images based on these methods still faces the challenge of pseudo changes caused by changes in imaging conditions such as seasons, weather, shadows, and sensor attitudes [17–20]. This paper introduces the feature interactive bi-temporal change detection network (FIBTNet, Fig. 1), a new approach to mitigate the adverse effects of pseudo changes in change detection. Here are the specific contributions:
(1) Base on bi-temporal Siamese encoder-decoder structure, we’ve introduced the feature interaction mechanism. Bi-temporal feature interaction layers are integrated into both the encoding and decoding processes. During the encoding process, a bi-temporal feature exchange architecture (EXA) is crafted with various feature exchange methods that focus on spatial, channel, or a mix of both dimensions, and we’ve optimized the EXA’s structure for best performance.
(2) In the decoding process, multiple improved change residual (CR) modules constitute a bi-temporal difference extraction architecture (DFA), where the elementwise difference branch of the CR module applies a spatial attention mechanism to enhance the module’s ability to extract semantic differences in bi-temporal features. Additionally, at the junction of encoder and decoder, channel exchange is combined with the CR module to achieve an adaptive channel exchange, further enhancing the performance of FIBTNet.
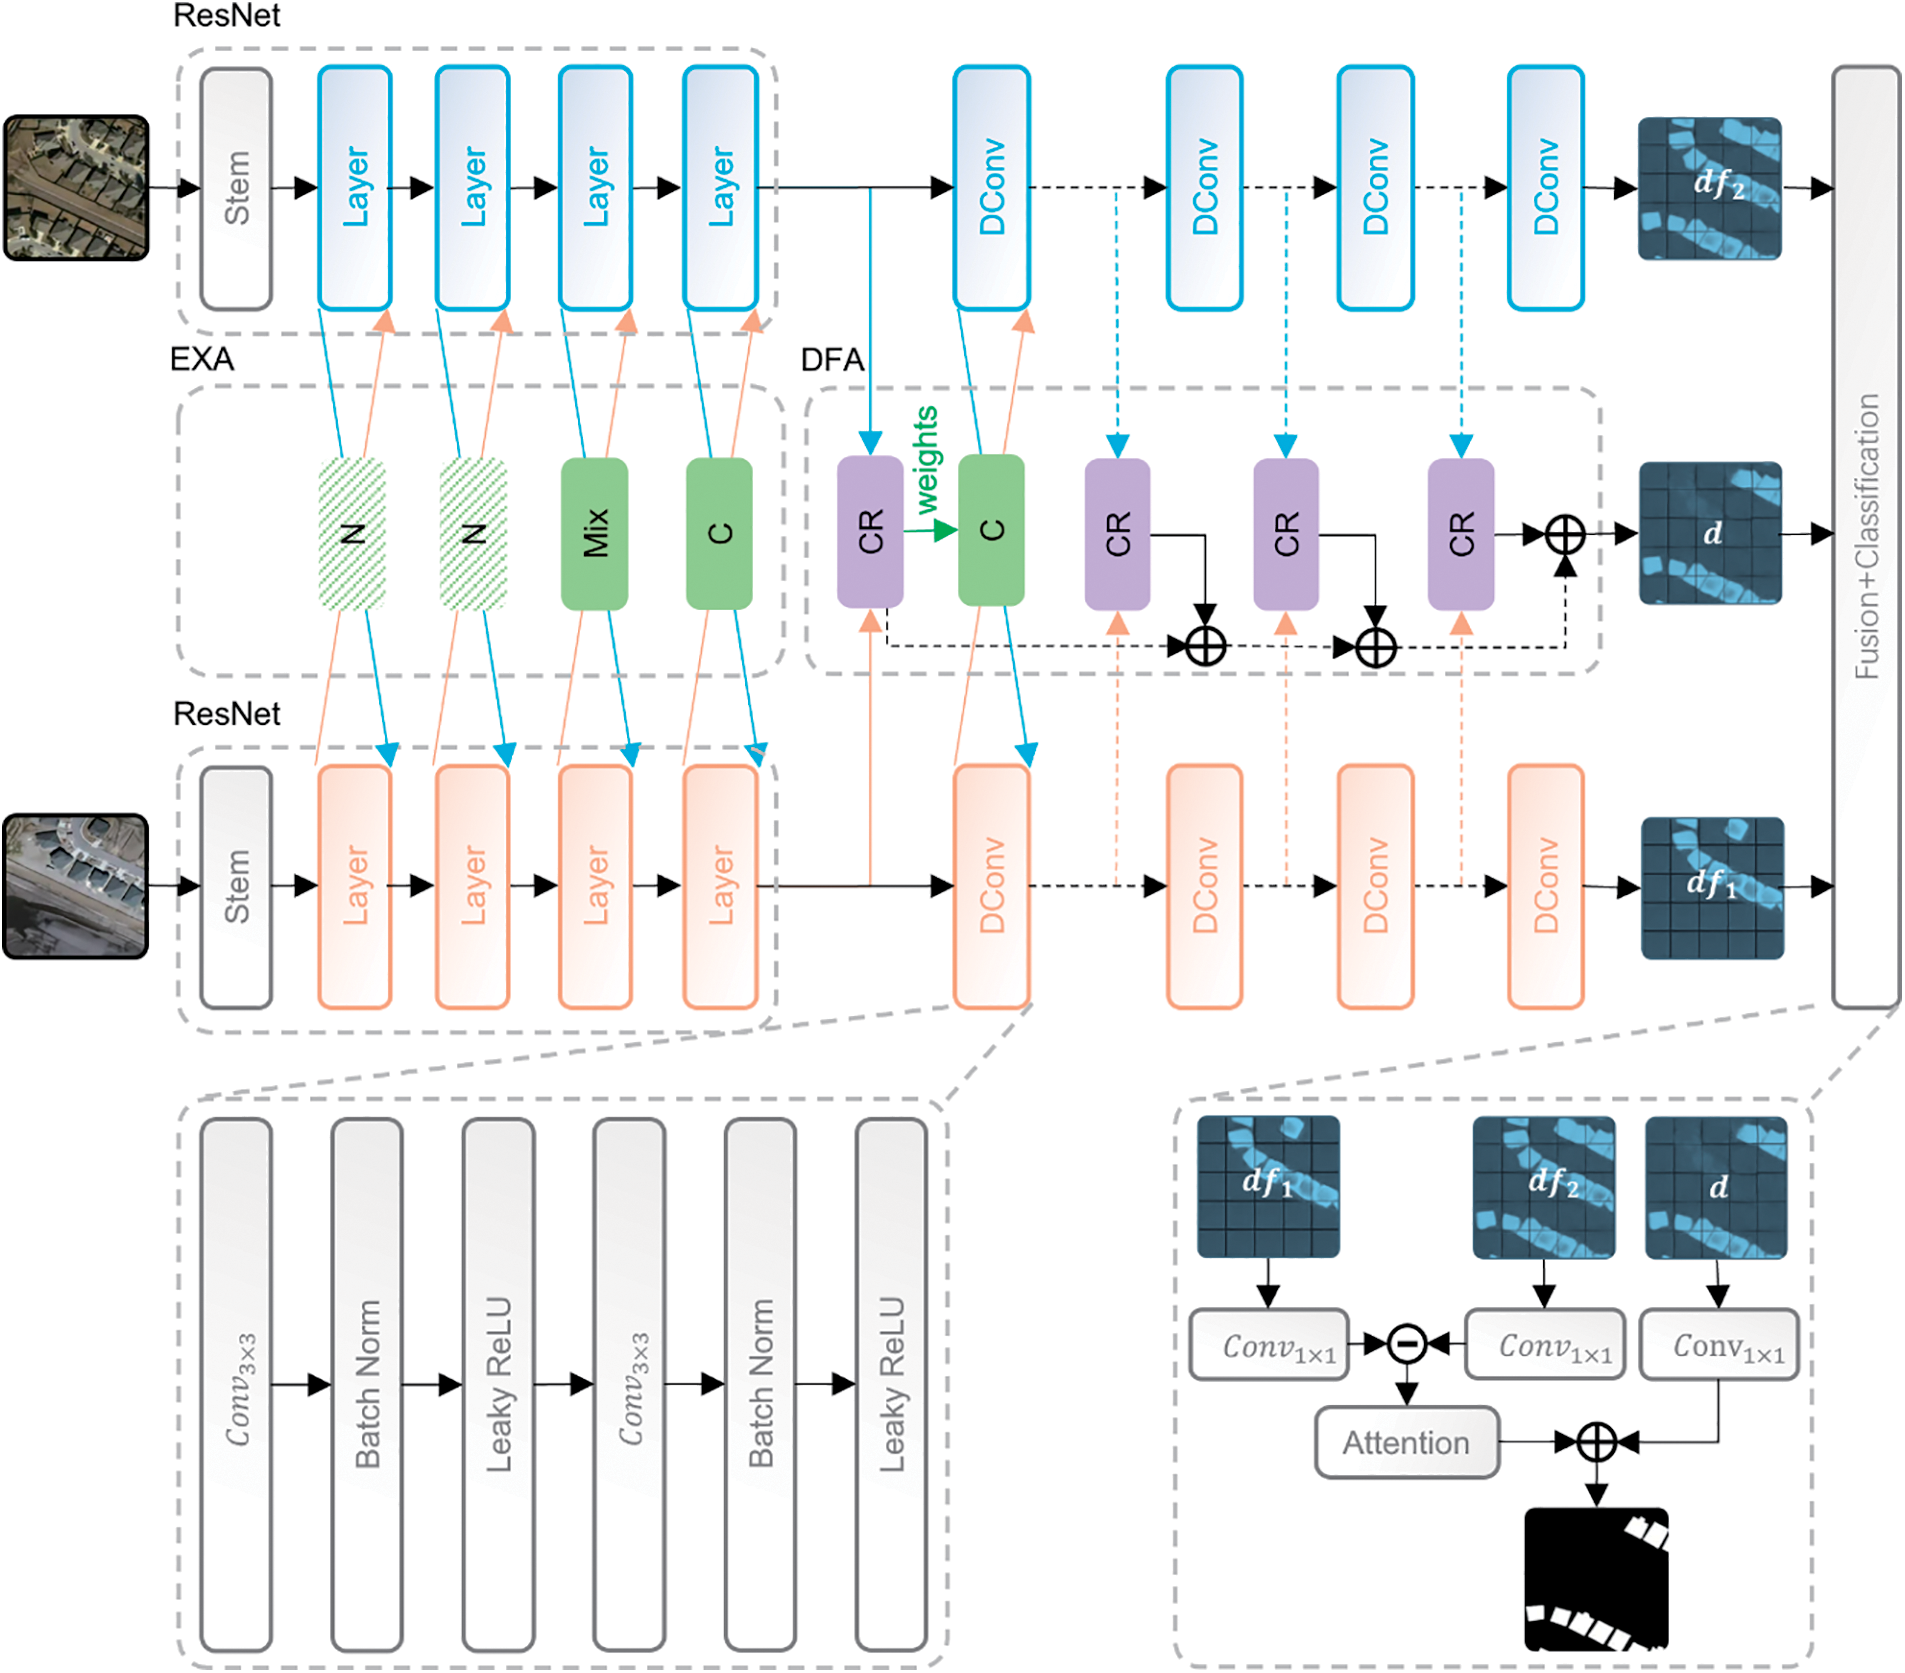
Figure 1: FIBTNet Architecture Diagram (1) Green squares denote feature exchange methods. ‘N’ denotes no exchange operation, ‘Mix’ denotes a mix exchange operation, and ‘C’ denotes a channel exchange operation. (2) Purple squares denote CR modules. (3) Arrows with multiplication symbols indicate two times upsampling. (4)
Finally, this paper also conducted extensive experimental evaluation of FIBTNet on multiple building change detection benchmark datasets and compared it with other advanced methods (Fig. 2). The experimental results show that FIBTNet has achieved significant performance improvement in the building change detection task, validating the effectiveness and superiority of our algorithm.
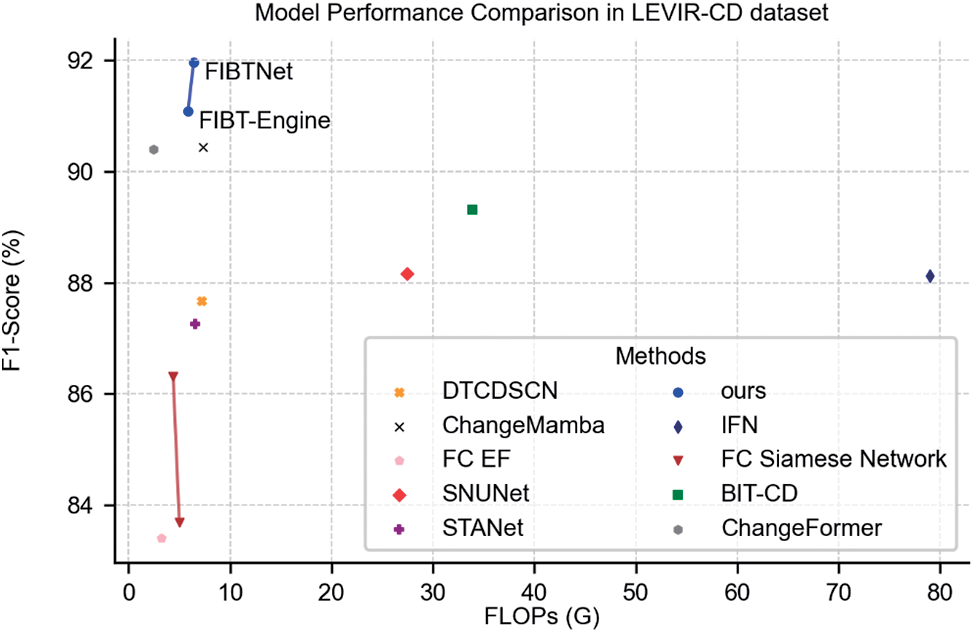
Figure 2: Model performance comparison in the LEVIR-CD dataset. The X-axis represents the floating point operations (FLOPs)
2.1 Deep Learning for Bi-Temporal Change Detection
In the task of remote sensing image change detection, the architecture of deep learning models for bi-temporal change detection typically consists of two parts: the encoder and the decoder. These methods can be mainly categorized as direct-classification structure, post-classification structure, and Siamese structure. The direct-classification structure [13,14], also known as the two-channel structure, focuses more on the decoder. It first fuses bi-temporal data into a single image and then inputs it into a semantic segmentation algorithm to generate a change detection mask. During the fusion process, various data preprocessing operations can be employed, with the most commonly used being concatenation and change analysis methods. This requires the original images to be strictly spatially aligned and may ignore the independence of features from the two temporal phases, leading to the loss of key channel information.
In contrast, the post-classification structure [5,15,16] generates semantic segmentation results for each temporal phase and calculates the difference, focusing more on encoding features of each temporal phase. However, this method overly relies on the accuracy of the encoder and requires strict spatial alignment of the original images. Siamese networks (using Siamese structure) consist of two structurally identical neural sub-networks forming a coupled structure. These networks process bi-temporal imagery by inputting the images into two separate neural networks that share the same structure and weight parameters. Through weight sharing, the sub-networks extract equivalent features. Currently, Siamese networks are one of the most widely used methods for such tasks. Many researchers have improved upon the initial Siamese structure to enhance performance, designing numerous models with higher accuracy by incorporating techniques such as spatial attention [7,9,12], channel attention [9,13,14] or self-attention mechanisms [18,21], etc. Building on the research in Siamese networks, this paper proposes a novel Siamese network for the extraction of building change information from remote sensing VHR (very high resolution) imagery.
Feature interaction is a crucial component in multimodal algorithms, enhancing the richness of information in feature maps from different modalities by fusing the information between them [16]. It often employs co-attention mechanisms or cross attention to learn mutual information from different branches [22–25]. There is also feature interaction achieved through information exchange between features, which is a lightweight and effective method. The earliest to perform information exchange was Channel-Exchanging-Network (CEN) [15], which attempted to exchange channel feature maps of different modalities before multimodal feature fusion, allowing important information to be shared across modalities.
In the field of remote sensing image change detection, feature interaction methods have been applied widely [6,11,13,26–28]. Fang et al. [11] specifically constructed spatial exchange and channel exchange for the Siamese network encoder, enabling the sharing of change features between two phases of remote sensing data, and allowing the model to better detect changes between the two remote sensing images. Zhang et al. [26] allowed the model to capture correlations in the data more comprehensively by performing feature exchange and mixing along spatial, channel, and amplitude dimensions, and further optimized model performance by fusing information from two branches. Jiang et al. [6] embedded CR modules layer by layer in the bi-temporal decoding process to achieve multi-scale feature fusion, adapting to building changes of different resolutions and sizes. Yao et al. [13] and others introduced a Squeeze-and-Excitation (SE) channel attention mechanism [29] to the CR module, enhancing the sharing and communication of image information at different scales, and effectively improving the precision of building change detection by assigning higher weights to important features. These methods all contribute to the improvement of remote sensing change detection model performance.
However, there is still room for improvement in the aforementioned methods. For instance, Fang’s approach only employs spatial or channel exchange in certain neural network layers, which limits the capacity for model information exchange. Yao’s method solely utilizes channel attention mechanisms, failing to optimize the semantic extraction process in the elementwise difference branch. Incorporating spatial attention mechanisms could effectively enhance feature extraction for tasks that focus on spatial variations. Additionally, the methods of Jiang et al. [6,13] overlook the potential for information exchange during the initial stages of feature fusion, which could further enhance the model’s capabilities.
We introduce a feature interactive bi-temporal change detection engine (FIBTEngine), which is the baseline model for the feature interactive bi-temporal change detection network (FIBTNet). FIBTEngine is designed with a bi-temporal encoder-decoder structure. The encoder uses ResNet as the backbone, and the decoder is composed of upsampling and double convolution. Each layer in the decoder concatenates the features from the corresponding layer in the encoder. On the basis of FIBTEngine, FIBTNet introduced the feature interaction mechanism. In the encoding process of FIBTNet, a bi-temporal feature exchange architecture (EXA) is made up of multiple spatial, channel, or mixed feature exchange methods. In the decoding process, a bi-temporal difference extraction architecture (DFA) is composed of multiple improved change residual (CR) modules. The architecture diagram of the FIBTNet model is shown in Fig. 1.
The specific implementation process of FIBTEngine is as follows:
Assuming that the remote sensing images of two time points can be denoted as
Finally, we perform pixel-level classification based on the decoding results for change detection. The encoder and decoder of FIBTEngine can flexibly embed different feature interaction modules. All the configuration schemes of the interactive layers in FIBTEngine define the final FIBTNet. The overall process of FIBTEngine can be represented by the following Eq. (3):
Deep convolution performs convolution operations on each input channel separately. The convolution kernel of each channel focuses on only the information of that channel, not all channels, which helps reduce the number of parameters and mitigate overfitting. Pointwise convolution follows deep convolution, combining the results of deep convolution to increase the feature map depth. This step is similar to standard convolution operations but involves only 1 × 1 convolution kernels, so the computational cost is relatively small. FIBTEngine replaces the convolution operations of double convolution with depthwise separable convolution to reduce the risk of overfitting. For the loss calculation of the model, FIBTEngine adopts cross-entropy (CE) loss. The formula for calculating the CE loss is shown in Eq. (8):
where
3.2 Bi-Temporal Feature Exchange Architecture
The bi-temporal feature exchange architecture (EXA) is designed to exchange and encode bi-temporal features. Fang et al. [11] proposed spatial exchange and channel exchange modules for efficiently addressing pseudo changes at different time points and embedded one spatial exchange and two-channel exchanges in the 2nd, 3rd, and 4th downsampling layers of ResNet, respectively. Based on the above research, this paper embeds Mix change in Layer 3 and channel exchange in Layer 4 in ResNet downsampling, as shown in Fig. 1.
In EXA, the Mix exchange method is used, which adopts a feature exchange mechanism in the encoding stage that can collaborate with each other in the same layer, i.e., it allows Spatial exchange and Channel exchange to be embedded in the same layer. Specifically, the Spatial exchange method exchanges the features of remote sensing images of two time phases along the spatial dimension, based on which the Channel exchange method exchanges the features again along the channel dimension, with a step size of 1 between the exchanged pixels in the feature exchange, as shown in Fig. 3.
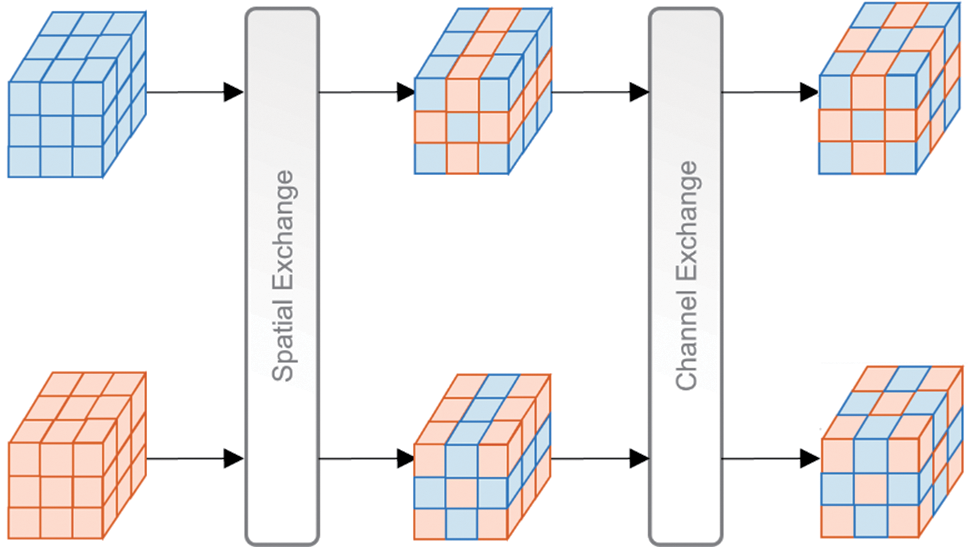
Figure 3: The processes of mixed exchange when the exchange stride is 1
3.3 Bi-Temporal Difference Extraction Architecture
The bi-temporal difference extraction architecture (DFA) is a new architecture adopted by FIBTNet in the decoding process, aiming to enhance the perception of difference features in the decoding process. DFA consists of multiple CR modules, which, together with upsampling and double convolution, form the decoding process. Each CR module at each layer is mainly responsible for producing differential decoding results, which are then added to the results from the previous CR module. The final outcome is integrated and classified with the feature maps output by the bi-temporal decoder, as depicted in the overall figure (Fig. 1).
Each CR module can be divided into two branches, namely, the elementwise concatenation branch and the elementwise difference branch, which are weighted by Squeeze-and-Excitation (SE) channel attention and spatial attention, respectively. The structure of CR module proposed in this paper is shown in Fig. 4.
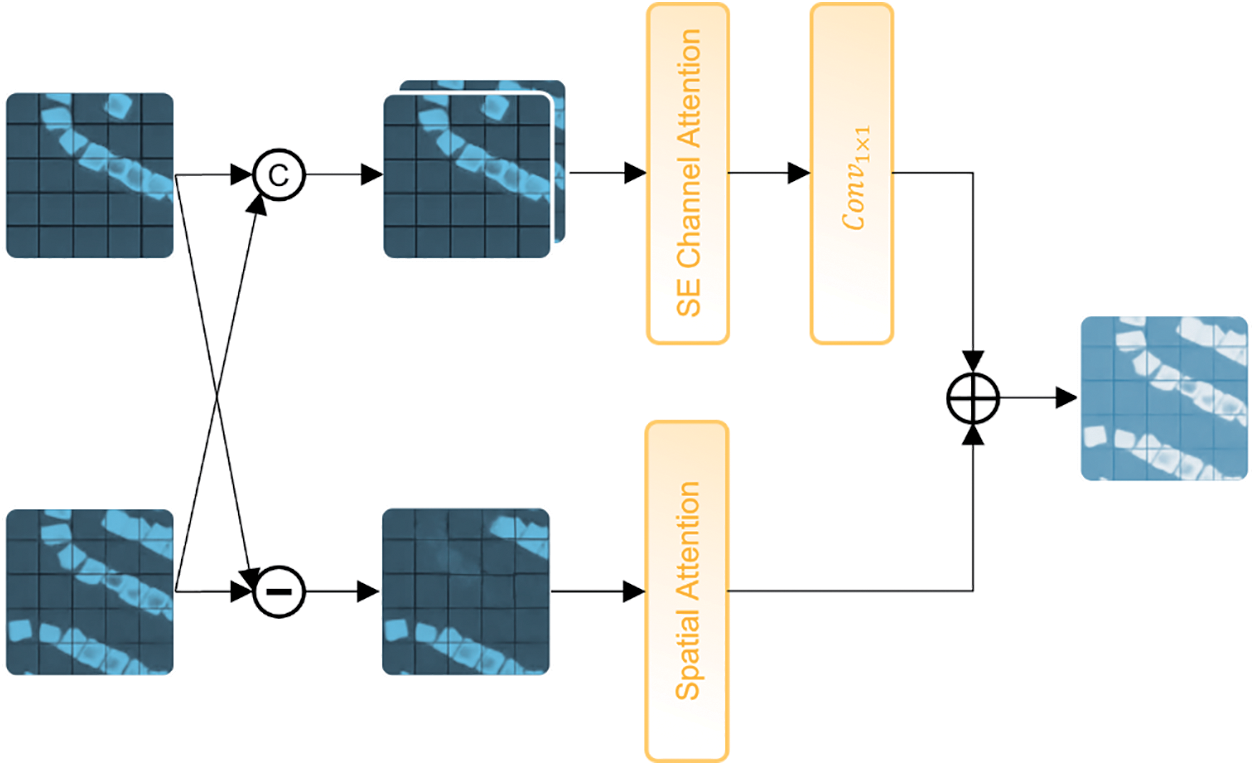
Figure 4: CR module architecture. The elementwise concatenation branch includes a SE channel attention (top). The elementwise difference branch includes a spatial attention mechanism (bottom)
Elementwise concatenation branch is responsible for channel weighting of the concatenation results of two time-phase feature maps,
3.4 Encoding and Decoding Junction
Here, it should be especially elaborated that at the encoding and decoding junction, specifically after the first CR module in the decoding process, a channel exchange module is integrated (Fig. 1). This module, guided by the attention weights produced by the CR module. The attention weights determine the channel positions to be exchanged, thereby improving the model’s focus on the distinctive features of building changes (Fig. 5).
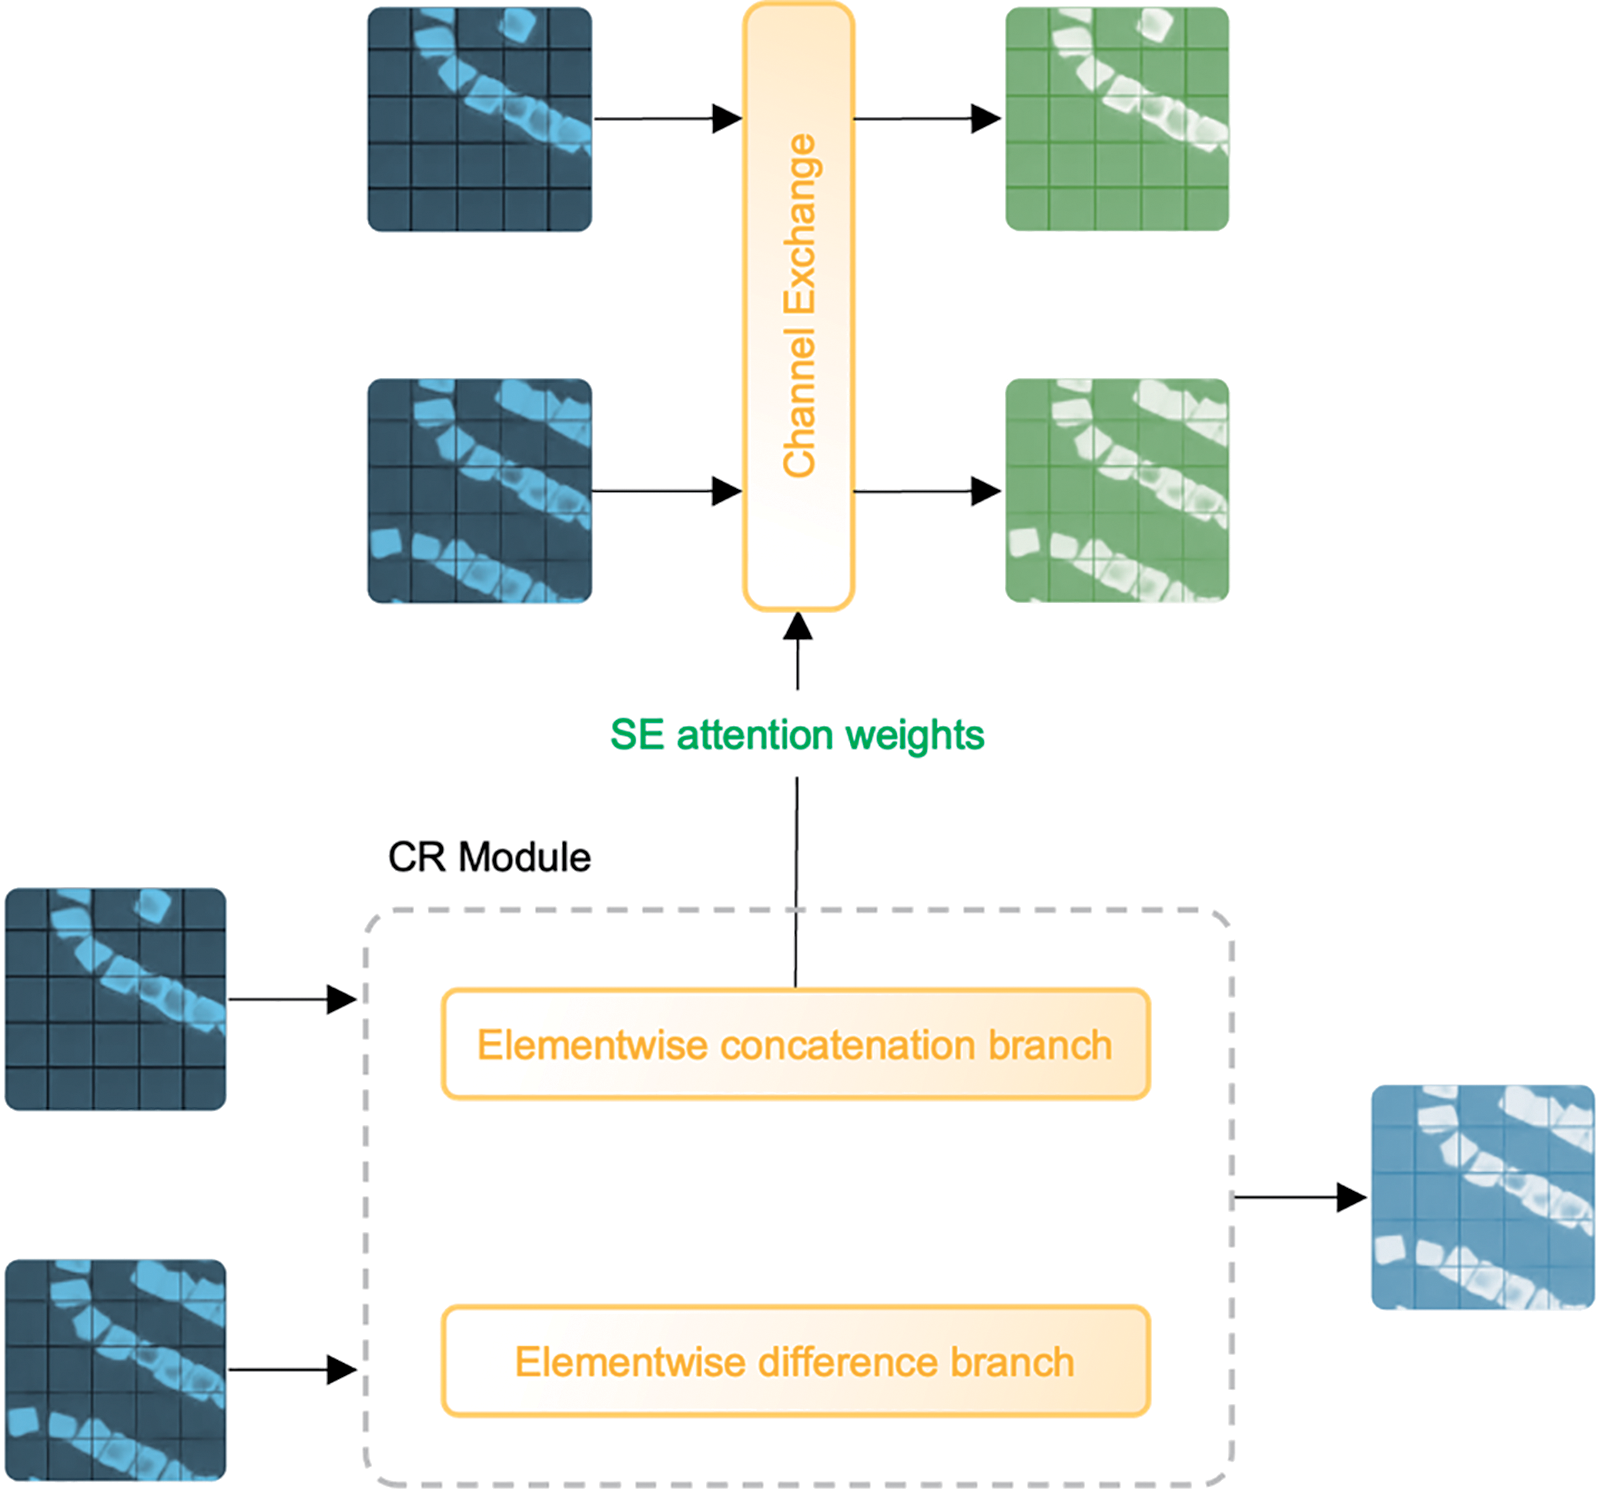
Figure 5: Channel exchange with attention from the first CR module
We believe that in the CR module, the channel attention of the elementwise concatenation branch mainly focuses on feature information related to changes. Since this channel attention simultaneously calibrates the channels of features from two time points, we further assume that for one of the time points, the positive and negative weighting of the attention mechanism strengthens and weakens the features of the changed and unchanged areas, respectively. The attention weighting from different time points is unique. Therefore, taking the intersection of the areas of interest for the two time points is equivalent to a voting process, which can enrich the model’s perspective on the diversity of changed and unchanged areas. The above logic can be represented as Eq. (10):

Squeeze-and-Excitation (SE) [29] can explicitly model the interchannel dependencies of convolutional feature maps, thereby enhancing the model’s expressive power. The core steps of SE in modeling this relationship are divided into two parts: “squeeze” and “excitation”. The “squeeze” operation abstracts and compresses the input features through global average pooling, obtaining global information for each channel; the “excitation” operation then recalibrates the channels using a small network consisting of two network layers (i.e., an encoding layer and a decoding layer) to obtain the weights for each channel. The intensity of “excitation,” or the strength of channel compression, can be controlled by the ratio parameter. Generally, the higher the intensity is, the better the accuracy; however, the complexity of training time is also greater.
3.5.2 Spatial Attention Mechanism
The convolutional block attention module (CBAM) [30] is an attention mechanism that introduces both channel and spatial attention to weight the feature channels and spatial dimension. The spatial attention mechanism in this paper is inspired by CBAM and uses a convolutional kernel of size 7 to assist pooling to generate spatial dimension attention weights.
The classification results output by the segmentation head of FIBTNet adopt two-channel direct classification rather than probability maps after the interaction of bi-temporal features. Probability maps require a binarization process, which can introduce unnecessary factors into the experiment, such as traditional algorithms such as Otsu’s or thresholding methods. Two-channel classification does not involve this process and can be directly used to calculate losses.
To verify the effectiveness of the proposed FIBTNet, we conducted experimental evaluations on public datasets (Fig. 8) and compared them with mainstream change detection methods (Tables 3 and 4). Unless otherwise specified, the default backbone for FIBTNet is ResNet18, the ratio parameter for SE channel attention is set to 16, and FDAF is disabled.
We conducted experiments on the following two benchmark datasets:
(1) LEVIR-CD [12]: LEVIR-CD is a large-scale aerial image dataset for detecting changes in buildings that contains 637 high-resolution VHR (0.5 m/pixel) image pairs. Each image pair is 1024 × 1024 pixels in size. The period of the image pairs ranges from 5 months to 6 years. The bitemporal images in LEVIR-CD are from 20 different regions that sit in several cities in Texas of the US, including Austin, Lakeway, Bee Cave, Buda, Kyle, Manor, Pflugervilletx, Dripping Springs, etc. All images in the LEVIR-CD dataset were obtained from Google Earth (GE). The ratio of the training, validation, and testing sets is 7:1:2. Significant seasonal and illumination changes were introduced into the dataset.
(2) S2Looking [17]: S2Looking contains 5000 VHR image pairs (0.5–0.8 m/pixel). Each image pair is 1024 × 1024 pixels in size. The data acquisition covers a wide range of locations with varying large off-nadir angles; the annotated subjects are mostly rural buildings throughout the world. All images were obtained from satellites such as GaoFen (GF), SuperView (SV), and BeiJing-2 (BJ-2). The ratio of the training, validation, and testing sets is 7:1:2.
General Information of the two benchmark datasets is summarized in Table 2 and Examples of annotated samples are displayed in Fig. 6.

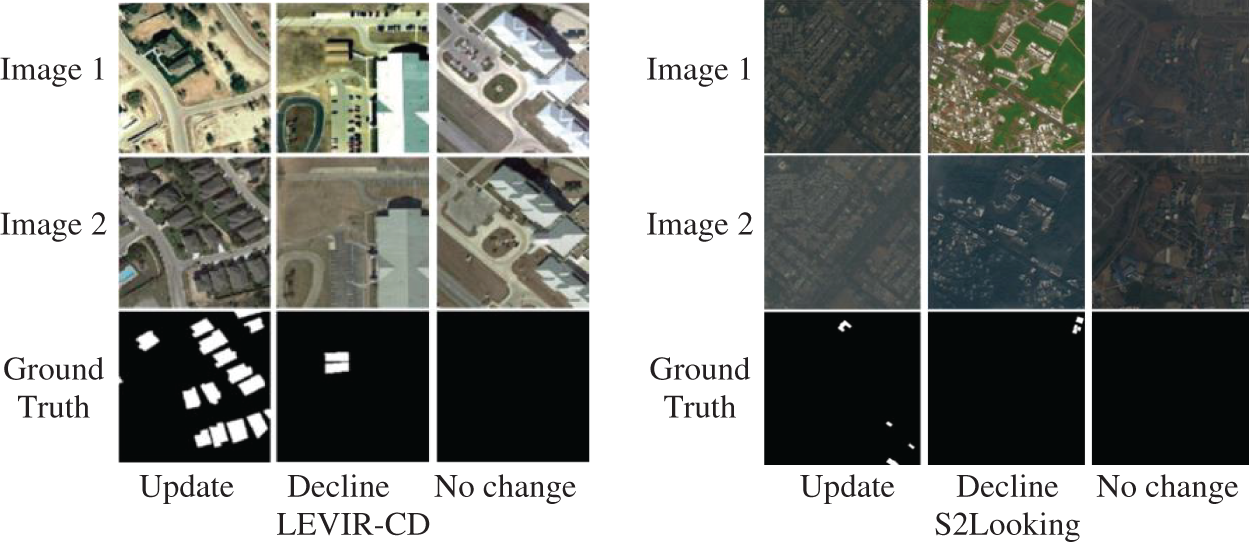
Figure 6: Examples of annotated samples. The chronological order is from Image 1 to Image 2
All experiments were conducted on a workstation equipped with an NVIDIA A40 graphics card with 48 GB of memory, and the batch size was set to 8. The experimental environment was built using Cuda 12.0, Python 3.9, and PyTorch 2.2.2. Common data augmentations for temporal data were applied, including (1) random flipping, (2) random cropping, and (3) photometric distortion. During the training phase, we used the AdamW optimizer with the weight decay set to 0.05 and an initial learning rate of 0.001. Considering the difficulty of the two benchmark datasets, we allocated 40k and 80k training iterations for the LEVIR-CD and S2Looking datasets, respectively.
We compared our method with other advanced change detection methods (Tables 3 and 4), covering both CNN and transformer algorithm architectures:

FC-EF, FC-Siam-Conc, and FC-Siam-Diff [8]: FC-EF is based on the UNet model, which directly fuses two images. FC-Siam-Conc and FC-Siam-Diff are Siamese network extensions of FC-EF that process image pairs through connection and difference methods, respectively.
DTCDSCN [7]: A dual-task constrained deep Siamese convolutional network model (DTCDSCN) was proposed for building change detection in remote sensing images. The model combines a change detection network and a semantic segmentation network, optimizing feature representation through a dual attention module (DAM) and addressing the sample imbalance problem with an improved change detection loss (CDL).
STANet [12]: A neural network (STANet) based on spatial-temporal attention mechanisms for remote sensing image change detection that introduced a new large-scale dataset, LEVIR-CD. Through a self-attention module, STANet can capture spatial-temporal dependencies, improving the accuracy and robustness of change detection.
IFN [9]: A deeply supervised image fusion network (IFN) for detecting changes in high-resolution remote sensing images from different times. The IFN uses a two-stream architecture to extract features and attention modules to improve feature fusion, with deep supervision enhancing the training process.
SNUNet [14]: A densely connected Siamese network for high-resolution remote sensing image change detection that improves localization accuracy and computational efficiency through compact information transfer between the encoder and decoder and an ensemble channel attention module (ECAM).
BIT-CD [18]: An efficient remote sensing image change detection method based on transformers that represents images as a small number of semantic tokens and using a transformer encoder to model the context in a compact token-based spatiotemporal domain and significantly improves the accuracy and efficiency of change detection.
ChangeFormer [21]: A novel transformer-based Siamese network for change detection in remote sensing images. It combines a hierarchical transformer encoder with an MLP decoder to efficiently capture multi-scale details, achieving improved performance over existing convolutional network-based approaches.
ChangeMamba [31]: A remote sensing change detection framework using the Mamba architecture for binary, semantic, and building damage detection tasks. It shows improved performance and robustness over CNN and Transformer models.
Table 3 and Fig. 7 clearly demonstrates that our proposed FIBTNet performs well across various metrics. In the LEVIR-CD dataset, FIBTNet achieved the highest scores in terms of F1, IoU, and Recall, reaching 91.96, 85.12, and 90.64, respectively, which indicates that FIBTNet has a high level of accuracy, intersection-over-union, and detection sensitivity in change detection tasks. Particularly, the performance of IoU and Recall is especially remarkable, suggesting that FIBTNet not only excels in accurately predicting change areas but also maintains a high precision while minimizing the omission of real changes. In the S2Looking dataset, FIBTNet’s F1, IoU, and Recall are 68.60, 52.21, and 61.36, respectively, also ranking the best among all models. This further confirms the comprehensive performance of FIBTNet in change detection tasks. Fig. 7 provides a more intuitive view of the differences between various comparison models. To enhance clarity, we have employed a diverse palette of colors to delineate the various outcomes: correct predictions are highlighted in green, missed detections in red, and false positives in blue. A meticulous analysis reveals that our model, underpinned by FIBTNet, outperforms other comparative approaches in several key areas. Specifically:
(1) Precision in Dense Changes: Our model exhibits exceptional precision in forecasting dense changes, as exemplified in the first row of Fig. 7 (the test data file is named “test_30”). For instance, while some methods may overlook or erroneously flag changes in residential buildings due to the intricacies of the scene, our FIBTNet model consistently provides a more thorough and precise detection outcome.
(2) Mitigation of False Positives: The model excels in curtailing false positives, as demonstrated in the second row of Fig. 7 (the test data file is “test_76”). This proficiency stems from the model’s capacity to discern spurious changes and reduce its susceptibility to such anomalies. For example, in Fig. 7a, many traditional methods mistakenly identify areas with altered roof paint color as instances of building alterations. Conversely, our FIBTNet model and ChangeFormer adeptly discern these inaccuracies.
(3) Recognition of Non-Semantic Changes: The FIBTNet model skillfully identifies and excludes non-semantic changes induced by shifts in illumination or surface characteristics, as depicted in the fifth row of Fig. 7 (the test data file is “1519”). The model’s accurate pinpointing of non-semantic changes in buildings within Fig. 7 is a testament to the rich contextual insights it acquires through spatial and channel exchanges, as well as their combined impact. This nuanced comprehension enables a more precise portrayal of authentic semantic shifts, in contrast to STANet, which displays an excessive level of sensitivity.
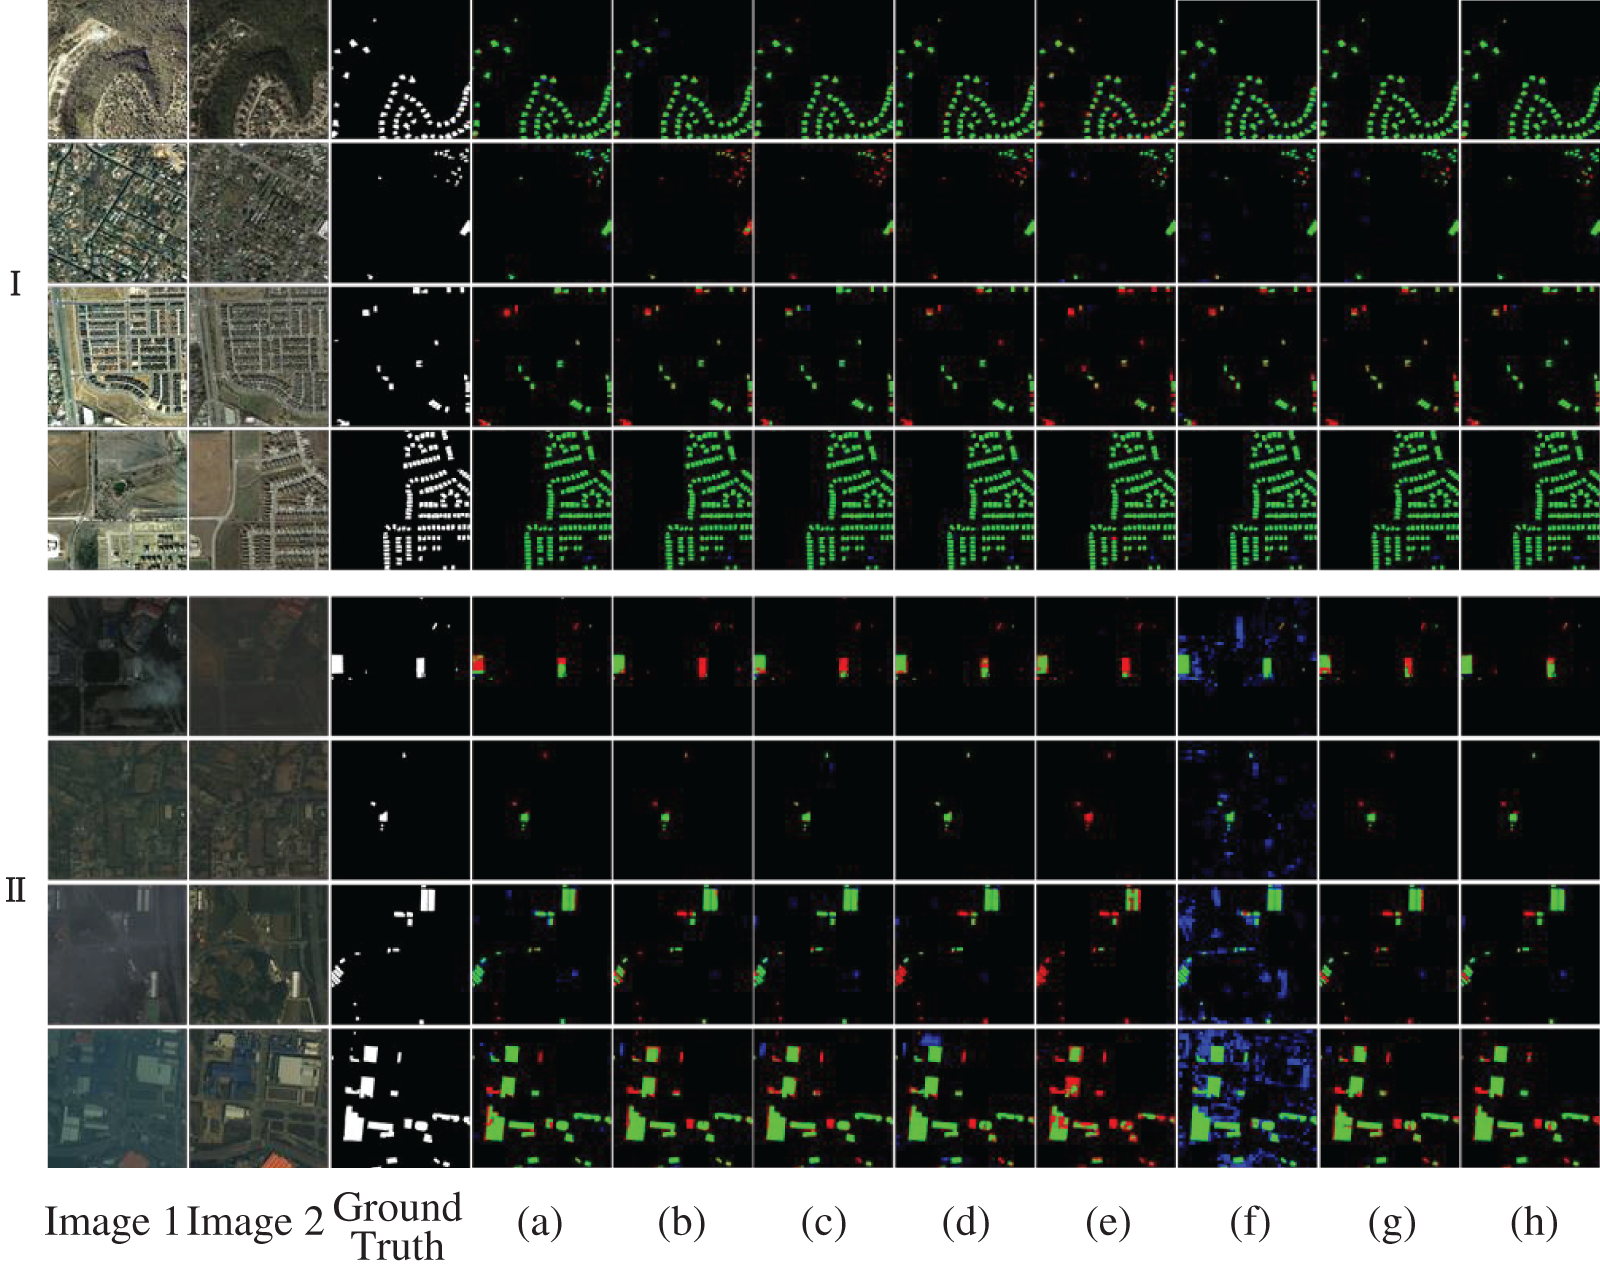
Figure 7: Visualization results of different methods on the LEVIR-CD (Ⅰ) and S2Looking (Ⅱ) test sets. (a) IFN. (b) BIT-CD. (c) ChangeFormer. (d) ChangeMamba. (e) FC-Siam-Diff. (f) STANet. (g) SNUNet. (h) Ours. Color convention: correct predictions, missed detections, and false positives
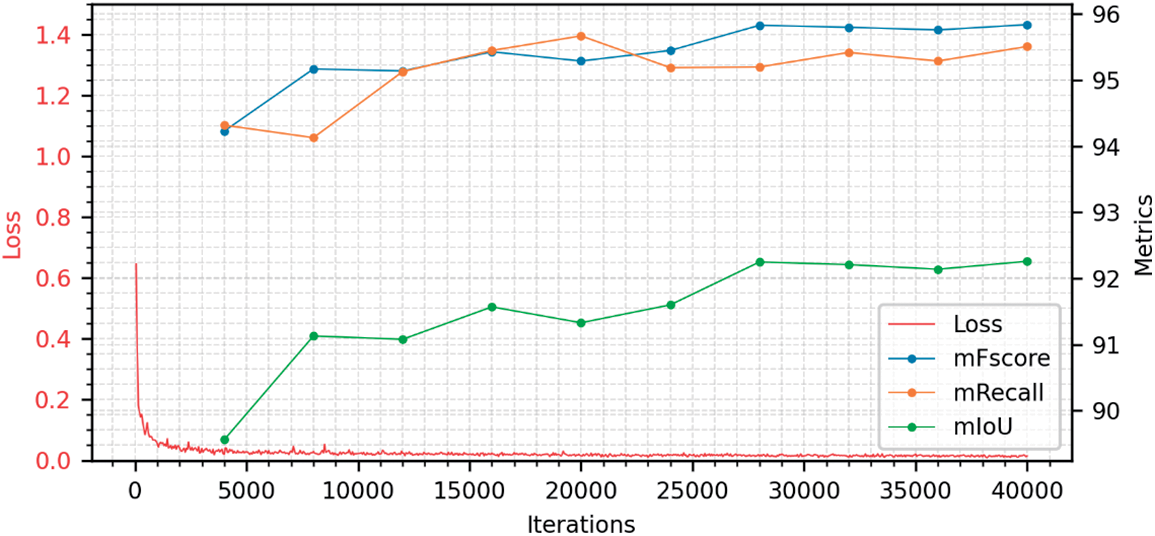
Figure 8: Visualization of training loss and validation metrics on LEVIR-CD
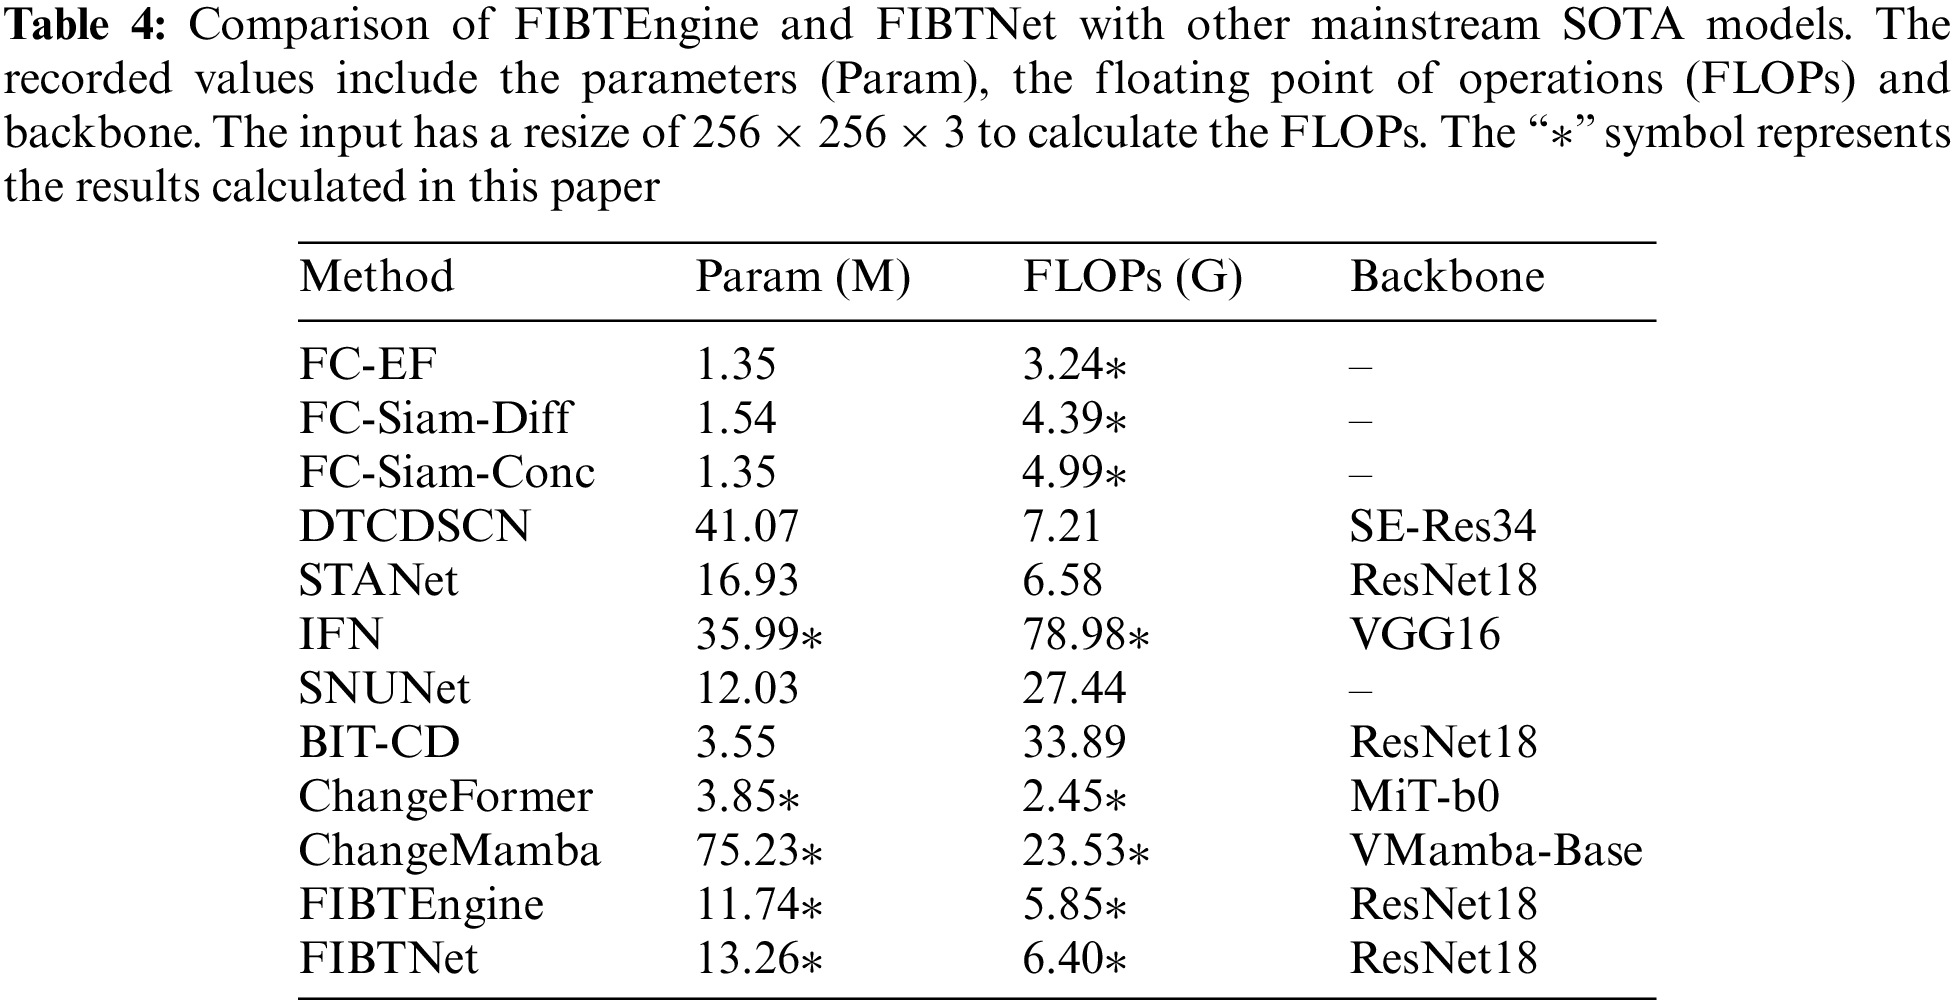
Additionally, in terms of model parameters and computational complexity, FIBTNet also shows high efficiency with a parameter count of 13.26 M and FLOPs of 6.40 G (Table 4). Although its parameter count and computational complexity are slightly higher than those of the FIBTEngine, they remain within a reasonable range and are significantly better than some other models with larger parameter counts and computational complexities, such as IFN and DTCDSCN.
In the experiment exploring advanced loss functions (Table 5), the performance of the FIBTNet model was affected differently by the Focal loss and Dice loss. When using the Focal loss, the Recall on the LEVIR-CD dataset slightly decreased to 90.30, indicating a slight reduction in the model’s sensitivity to change detection. A higher Recall value means that the model is sensitive in capturing actual changes, that is, it tries to miss as few changes as possible. The F1 score and the Intersection over Union (IoU) value slightly decreased at the same time, to 91.71 and 84.69, respectively, indicating that the overall accuracy and the IoU ratio have been slightly compromised. In the S2Looking dataset, the Focal loss also decreased the Recall to 59.03, and the F1 score and IoU value were lower as well, at 64.26 and 47.34, respectively.
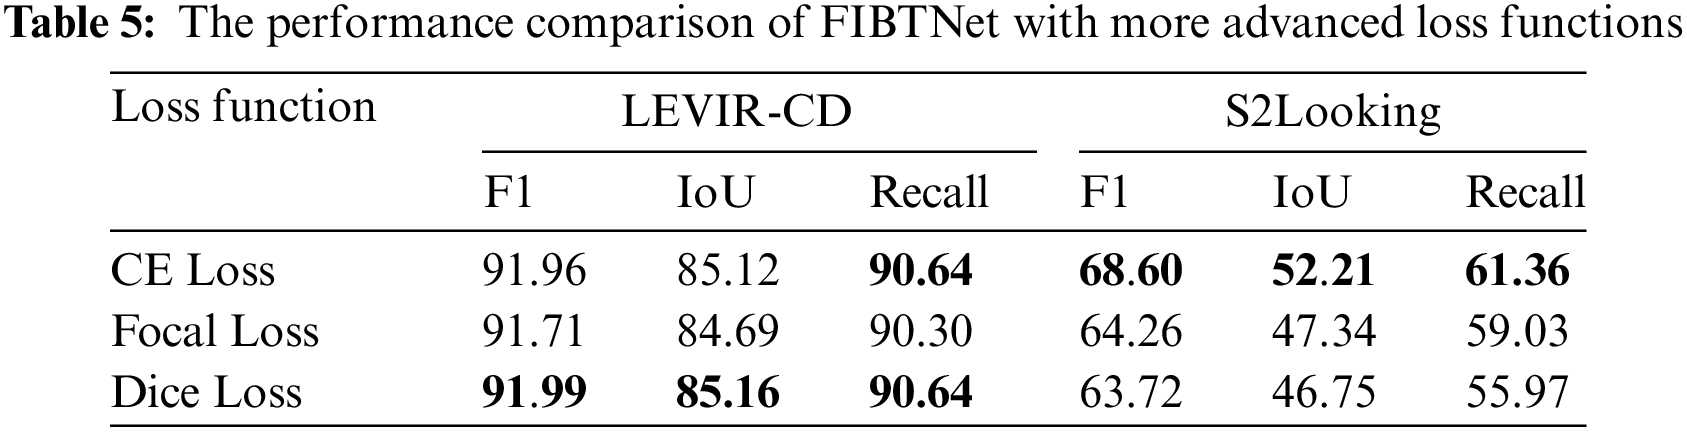
When using the Dice loss, the F1 score and the IoU on the LEVIR-CD dataset reached their highest, at 91.99 and 85.16, respectively, while the Recall also remained at a high level of 90.64, showing a good overall accuracy and IoU ratio. The F1 score is the harmonic mean of precision and recall, reflecting the model’s accuracy comprehensively, and the IoU measures the ratio of the intersection to the union of the predicted results and the actual results, which better reflects the model’s overall accuracy. In the S2Looking dataset, the Dice loss did not improve the F1 score and IoU as previously stated; instead, it resulted in a decrease in all three metrics compared to the default CE (Cross-Entropy) Loss. The F1 score and IoU decreased to 63.72 and 46.75, respectively, and the Recall also dropped to 55.97.
The Focal loss consistently decreases Recall across both datasets. However, this leads to a decrease in Recall, F1 and IoU, reflecting a trade-off in overall accuracy and precision. On the other hand, Dice Loss maintains a balance of high F1 and IoU in the LEVIR-CD dataset, indicating a good overall performance. In contrast, in the S2Looking dataset, Dice Loss does not improve performance but rather results in lower scores across F1, IoU, and Recall compared to CE Loss, highlighting the need to carefully consider the choice of loss function based on the dataset characteristics and desired outcomes.
We conducted ablation experiments based on LEVIR-CD to prove the points and assumptions made in this paper. Fig. 9 visually demonstrates the differences between FIBTNet and the feature-interaction-free FIBTEngine. In Fig. 9, we utilize the visualization of change detection results to demonstrate the conclusions of the ablation study. Different colors represent different types of outcomes: correct predictions are indicated in green, false positives in blue, and false negatives in red. Upon observation, the FIBTNet exhibits the following advantages over the feature-interaction-free FIBTEngine:
(1) FIBTNet is capable of generating more complete predictive results when dealing with large-area changes, as shown in the second and fifth rows of Fig. 9. FIBTNet can decode features at multiple scales, allowing for more accurate detection of large building change areas.
(2) FIBTNet has better discernment of pseudo-changes, reducing the areas of building changes that are misidentified.
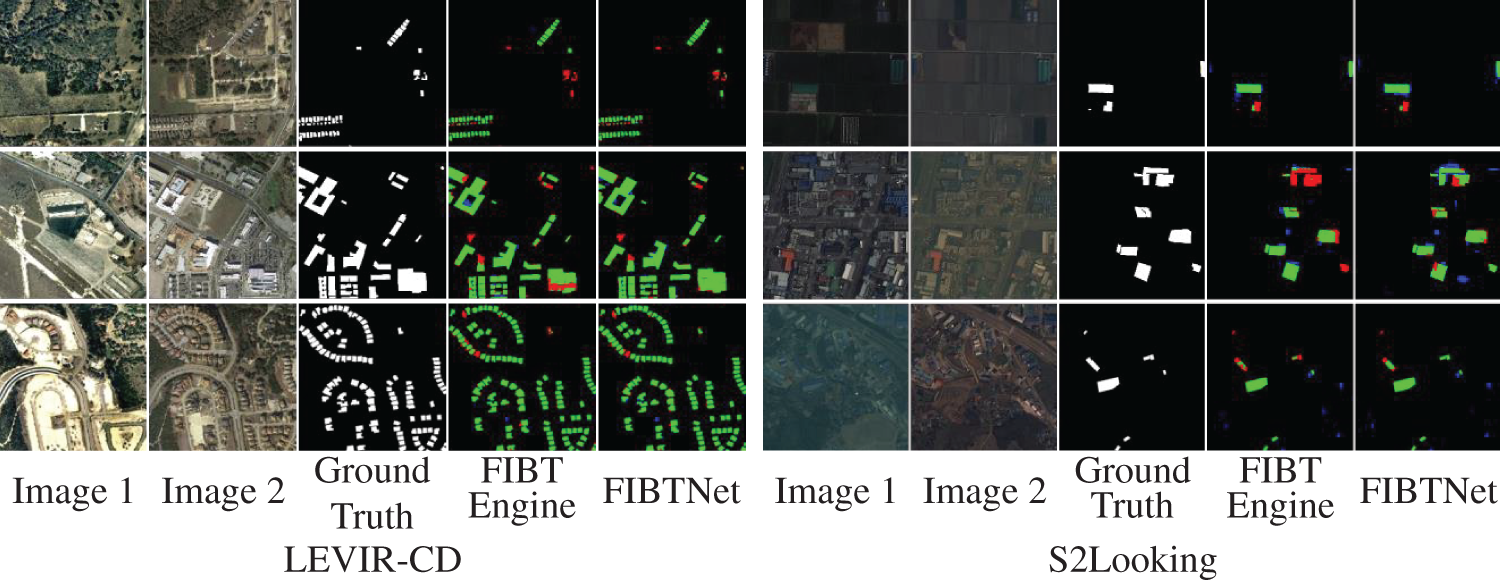
Figure 9: Comparison of the inference results of FIBTNet and FIBTEngine on the LEVIR-CD and S2Looking datasets. Color convention: correct predictions, missed detections, and false positives
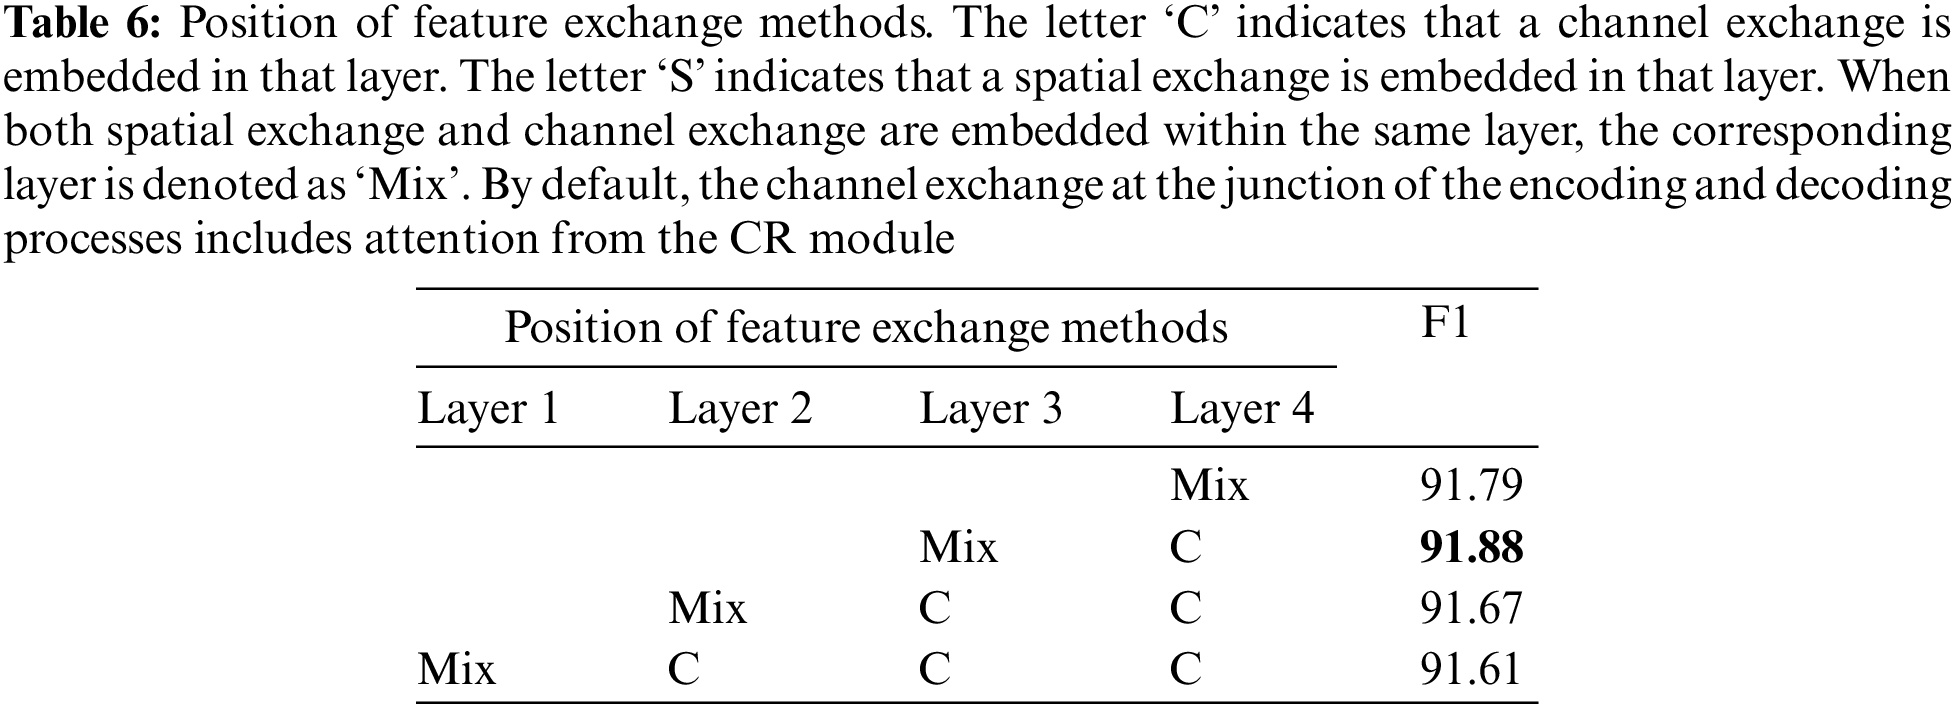
4.4.1 Position of Feature Exchange Mechanisms
This paper explores the location of mix exchange and channel exchange in different layers. Literature [11] suggested using spatial exchange in the shallow layer of the network and using channel exchange in the deep layer. In this paper, four configurations of mix exchange and channel exchange are given, respectively, and experimental comparison is carried out.
The experimental results (Table 6) indicate that the embedding position of the mixed exchange in the third layer provides the most significant FIBTNet improvement. Additionally, the performance improvement performance improvement achieved by moving the mixed exchange to shallower or deeper layers has certain characteristics. When the mixed exchange is embedded in the first layer, the spatial exchange within the mixed exchange utilizes the highest spatial resolution to enhance performance; however, the magnitude of this performance improvement is not substantial. To confirm this idea, we attempted to embed the mixed exchange in the second layer, and there was no significant performance loss. Conversely, when the mixed exchange is embedded in the last layer, where the channel resolution is the highest, the performance gain is more pronounced, once again confirming that the scale range adaptable to channel exchange is broader than that adaptable to spatial exchange. Therefore, when the mixed exchange is moved to the shallower third layer, more scales are involved in the channel exchange, which is sufficient to compensate for the performance loss of the spatial exchange in the deeper network layers and further leverage the role of the channel exchange in the feature exchange mechanism.
We further designed ablation experiments to determine the significance of the mixed exchange of EXA and the channel exchange with attention of DFA. Based on the experimental results (Table 7), we found that the collaboration between the spatial exchange and the channel exchange, along with the broader scale range of action of the channel exchange, can achieve a greater performance enhancement for FIBTNet.
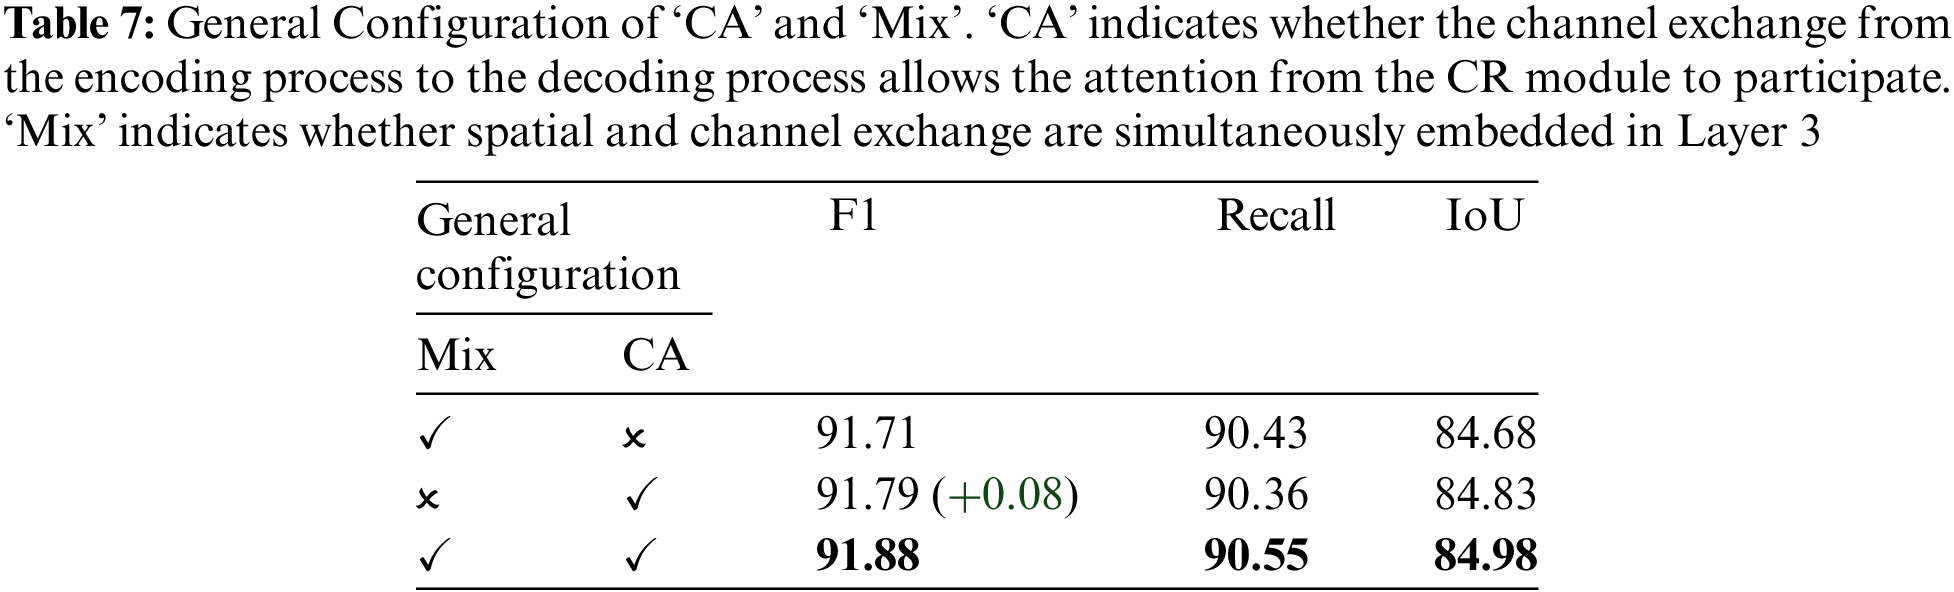
We also introduced SE channel attention from the CR module for the channel exchange at the encoding and decoding junction. To verify the assumptions made in this paper about the significance of this attention weight, we conducted ablation experiments on the introduction of this attention weight to test the local cooperation effect between DFA and EXA, as well as the ability of the CR module attention weight to increase channel exchange. The performance changes recorded in the Table 7 indicate that introducing this attention mechanism improves the performance of FIBTNet significantly.
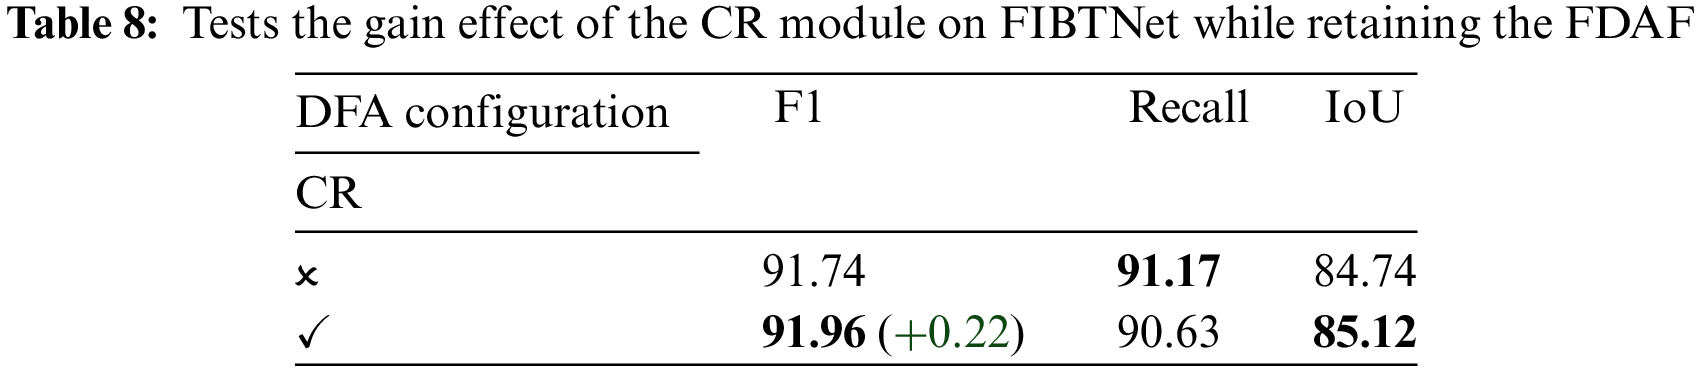
DFA utilizes a combination of upsampling and double convolution to introduce CR modules that span multiple scales, allowing the decoder to mine feature information across a broader range of scales for change extraction. To confirm the ability of the CR module to enhance the scale diversity of the FDAF, we conducted ablation experiments on the CR module while maintaining the FDAF. The experimental results (Table 8) demonstrate that the CR module can improve the performance of FIBTNet significantly when FDAF is present.
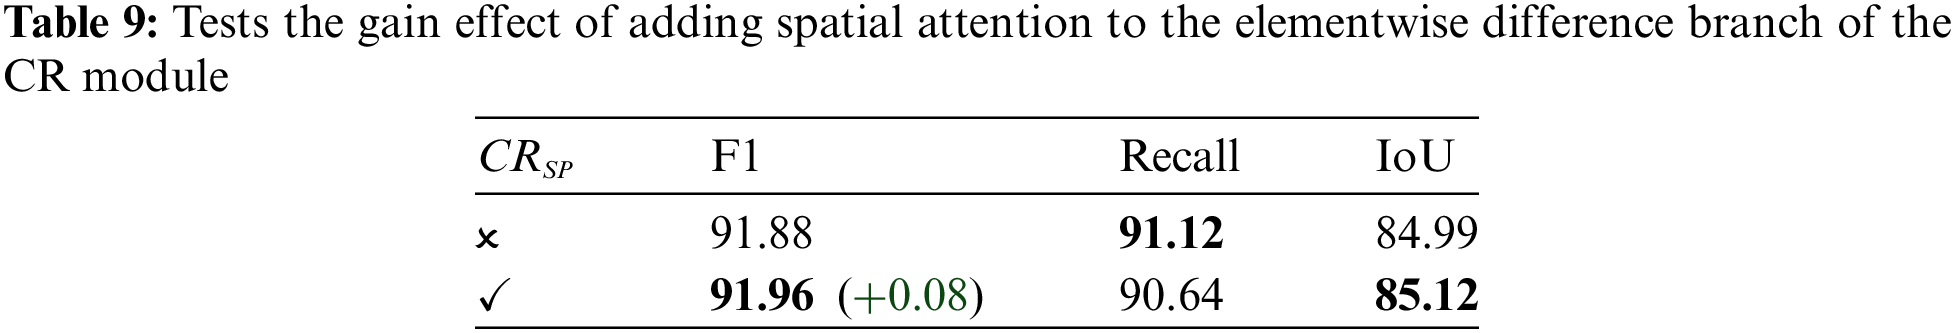
Additionally, the DFA added a spatial attention mechanism to the elementwise difference branch of each CR module to enhance FIBTNet’s understanding of difference features in the spatial dimension. The experimental results (Table 9) demonstrated that the spatial attention mechanism improved the performance of the CR module significantly.
Based on a bi-temporal Siamese encoder-decoder structure, this study introduces a novel feature interactive bi-temporal change detection network (FIBTNet) by incorporating innovative bi-temporal feature exchange architecture (EXA) and bi-temporal difference extraction architecture (DFA). Experimental results demonstrate that FIBTNet has achieved significant performance improvements on the LEVIR-CD and S2Looking benchmark datasets. Compared to other mainstream remote sensing building change detection methods, FIBTNet has shown better performance in evaluation metrics such as F1 score, IoU, and Recall, while also having lower computational requirements. Ablation studies further confirm the effectiveness of the proposed network structure, especially the Mix exchange configuration in EXA and the spatial attention mechanism in the CR module of DFA, both of which play a key role in enhancing network performance. Additionally, the channel exchange with attention mechanism at the encoding and decoding junction. By utilizing the SE Channel Attention within the CR module to assign higher weights to important features, the precision of building change detection has been effectively enhanced. This was clearly confirmed in the ablation study.
FIBTNet offers a new technical approach in the field of remote sensing building change detection, and its innovative structure lays the foundation for further improving accuracy and efficiency. We anticipate that FIBTNet will play a greater role in practical applications in the future and provide valuable references for research in related fields.
Acknowledgement: We express our gratitude to the Anhui Province Key Laboratory of Physical Geographic Environment for providing the equipment and environment for our experiments.
Funding Statement: This work was supported in part by the Fund of National Sensor Network Engineering Technology Research Center (No. NSNC202103), the Natural Science Research Project in Colleges and Universities of Anhui Province (No. 2022AH040155), and the Undergraduate Teaching Quality and Teaching Reform Engineering Project of Chuzhou University (No. 2022ldtd03).
Author Contributions: The authors confirm contribution to the paper as follows: Jing Wang: Study Design, Drafting the Manuscript, Supervision and Funding Acquisition. Tianwen Lin: Data Analysis and Interpretation, Manuscript Revision and Technical Support. Chen Zhang: Manuscript Revision. Jun Peng: Supervision. All authors reviewed the results and approved the final version of the manuscript.
Availability of Data and Materials: A publicly available LEVIR-CD dataset and the S2Looking dataset were used for analyzing our model. Those datasets can be found at https://chenhao.in/LEVIR/ and https://www.rsaicp.com/portal/dataDetail?id=30 (accessed on 1 July 2024).
Ethics Approval: Not applicable.
Conflicts of Interest: The authors declare that they have no conflicts of interest to report regarding the present study.
References
1. Z. Zhang, H. Jiang, S. Pang, and X. Hu, “Review and prospect in change detection of multi-temporal remote sensing images,” Acta Geod. Cartogr. Sin., vol. 51, no. 7, pp. 1091–1107, 2022. [Google Scholar]
2. A. H. Ozcan, C. Unsalan, and P. Reinartz, “A systematic approach for building change detection using multi-source data,” in 2014 22nd Signal Process. Commun. Appl. Conf. (SIU), Trabzon, Turkey, IEEE, Apr. 2014, pp. 477–480. doi: 10.1109/SIU.2014.6830269. [Google Scholar] [CrossRef]
3. X. Feng and P. Li, “Urban built-up area change detection using multi-band temporal texture and one-class random forest,” in 2019 10th Int. Workshop on the Anal. Multitemp. Remote Sens. Images (MultiTemp), Shanghai, China, IEEE, Aug. 2019, pp. 1–4. doi: 10.1109/Multi-Temp.2019.8866936. [Google Scholar] [CrossRef]
4. P. Li, H. Xu, S. Liu, and J. Guo, “Urban building damage detection from very high resolution imagery using one-class SVM and spatial relations,” in 2009 IEEE Int. Geosci. Remote Sens. Symp., Cape Town, South Africa, IEEE, 2009, pp. V-112–V-114. doi: 10.1109/IGARSS.2009.5417719. [Google Scholar] [CrossRef]
5. S. Iino, R. Ito, K. T. Imaizumi, and S. Hikosaka, “CNN-based generation of high-accuracy urban distribution maps utilising SAR satellite imagery for short-term change monitoring,” Int. J. Image Data Fusion, vol. 9, no. 4, pp. 302–318, Oct. 2018. doi: 10.1080/19479832.2018.1491897. [Google Scholar] [CrossRef]
6. H. Jiang, X. Hu, K. Li, J. Zhang, J. Gong and M. Zhang, “PGA-SiamNet: Pyramid feature-based attention-guided siamese network for remote sensing orthoimagery building change detection,” Remote Sens., vol. 12, no. 3, Feb. 2020, Art. no. 484. doi: 10.3390/rs12030484. [Google Scholar] [CrossRef]
7. Y. Liu, C. Pang, Z. Zhan, X. Zhang, and X. Yang, “Building change detection for remote sensing images using a dual-task constrained deep siamese convolutional network model,” IEEE Geosci. Remote Sens. Lett., vol. 18, no. 5, pp. 811–815, May 2021. doi: 10.1109/LGRS.2020.2988032. [Google Scholar] [CrossRef]
8. R. Caye Daudt, B. Le Saux, and A. Boulch, “Fully convolutional siamese networks for change detection,” in 2018 25th IEEE Int. Conf. Image Process. (ICIP), Athens, Greece, IEEE, Oct. 2018, pp. 4063–4067. doi: 10.1109/ICIP.2018.8451652. [Google Scholar] [CrossRef]
9. C. Zhang et al., “A deeply supervised image fusion network for change detection in high resolution bi-temporal remote sensing images,” ISPRS J. Photogramm. Remote Sens., vol. 166, pp. 183–200, Aug. 2020. doi: 10.1016/j.isprsjprs.2020.06.003. [Google Scholar] [CrossRef]
10. F. Rahman, B. Vasu, J. V. Cor, J. Kerekes, and A. Savakis, “Siamese network with multi-level features for patch-based change detection in satellite imagery,” in 2018 IEEE Global Conf. Signal and Inform. Process. (GlobalSIP), Anaheim, CA, USA, IEEE, Nov. 2018, pp. 958–962. doi: 10.1109/GlobalSIP.2018.8646512. [Google Scholar] [CrossRef]
11. S. Fang, K. Li, and Z. Li, “Changer: Feature interaction is what you need for change detection,” in 2009 IEEE Int. Geosci. Remote Sens. Symp., Cape Town, South Africa, IEEE, 2009. doi: 10.1109/IGARSS.2009.5417719. [Google Scholar] [CrossRef]
12. H. Chen and Z. Shi, “A spatial-temporal attention-based method and a new dataset for remote sensing image change detection,” Remote Sens., vol. 12, no. 10, May 2020, Art. no. 1662. doi: 10.3390/rs12101662. [Google Scholar] [CrossRef]
13. M. Yao, L. Zan, B. Li, Q. Li, and Z. Chen, “Building change detection from remote sensing images using CAR-Siamese net,” (in Chinese), J. Univ. Chin. Acad. Sci., vol. 40, no. 3, pp. 380–387, 2023. [Google Scholar]
14. S. Fang, K. Li, J. Shao, and Z. Li, “SNUNet-CD: A densely connected siamese network for change detection of VHR images,” IEEE Geosci. Remote Sens. Lett., vol. 19, pp. 1–5, 2022. doi: 10.1109/LGRS.2021.3056416. [Google Scholar] [CrossRef]
15. Y. Wang, W. Huang, F. Sun, T. Xu, Y. Rong and J. Huang, “Deep multimodal fusion by channel exchanging,” 2020, arXiv:2011.05005. [Google Scholar]
16. Y. Zhang, T. Yao, Z. Qiu, and T. Mei, “Lightweight and progressively-scalable networks for semantic segmentation,” Int. J. Comput. Vis., vol. 131, no. 8, pp. 2153–2171, 2023. doi: 10.1007/s11263-023-01801-1. [Google Scholar] [CrossRef]
17. L. Shen et al., “S2Looking: A satellite side-looking dataset for building change detection,” Remote Sens., vol. 13, no. 24, Dec. 2021, Art. no. 5094. doi: 10.3390/rs13245094. [Google Scholar] [CrossRef]
18. H. Chen, Z. Qi, and Z. Shi, “Remote sensing image change detection with transformers,” IEEE Trans. Geosci. Remote Sens., vol. 60, pp. 1–14, 2022. doi: 10.1109/TGRS.2021.3095166. [Google Scholar] [CrossRef]
19. B. Hou, Q. Liu, H. Wang, and Y. Wang, “From W-Net to CDGAN: Bitemporal change detection via deep learning techniques,” IEEE Trans. Geosci. Remote Sens., vol. 58, no. 3, pp. 1790–1802, Mar. 2020. doi: 10.1109/TGRS.2019.2948659. [Google Scholar] [CrossRef]
20. C. Wu, L. Zhang, and B. Du, “Kernel slow feature analysis for scene change detection,” IEEE Trans. Geosci. Remote Sens., vol. 55, no. 4, pp. 2367–2384, Apr. 2017. doi: 10.1109/TGRS.2016.2642125. [Google Scholar] [CrossRef]
21. W. G. C. Bandara and V. M. Patel, “A transformer-based siamese network for change detection,” vol. 12, pp. 207–210, 2022. doi: 10.1109/IGARSS46834.2022.9883686. [Google Scholar] [CrossRef]
22. J. Lu, J. Yang, D. Batra, and D. Parikh, “Hierarchical question-image co-attention for visual question answering” 2016, arXiv:1606.00061. [Google Scholar]
23. D. -K. Nguyen and T. Okatani, “Improved fusion of visual and language representations by dense symmetric co-attention for visual question answering,” in 2018 IEEE/CVF Conf. Comput. Vis. Pattern Recognit. (CVPR), SaltLake City, UT, USA, pp. 6087–6096, 2018. doi: 10.1109/CVPR.2018.00637. [Google Scholar] [CrossRef]
24. X. Wei, T. Zhang, Y. Li, Y. Zhang, and F. Wu, “Multi-modality cross attention network for image and sentence matching,” in 2020 IEEE/CVF Conf. Comput. Vis. Pattern Recognit. (CVPR), Seattle, WA, USA, IEEE, Jun. 2020, pp. 10938–10947. doi: 10.1109/CVPR42600.2020.01095. [Google Scholar] [CrossRef]
25. Y. Yu, Y. Xiong, W. Huang, and M. R. Scott, “Deformable siamese attention networks for visual object tracking,” in 2020 IEEE/CVF Conf. Comput. Vis. Pattern Recognit. (CVPR), Seattle, WA, USA, 2020, pp. 6727–6736. doi: 10.1109/CVPR42600.2020.00676. [Google Scholar] [CrossRef]
26. X. Zhang, Y. Li, Q. Wang, and S. Wu, “MFI-CD: A lightweight Siamese network with multidimensional feature interaction for change detection,” Int. J. Remote Sens., vol. 45, no. 8, pp. 2548–2566, Apr. 2024. doi: 10.1080/01431161.2024.2334778. [Google Scholar] [CrossRef]
27. Z. Fu, J. Li, L. Ren, and Z. Chen, “SLDDNet: Stagewise short and long distance dependency network for remote sensing change detection,” IEEE Trans. Geosci. Remote Sens., vol. 61, pp. 1–19, 2023. doi: 10.1109/TGRS.2023.3305554. [Google Scholar] [CrossRef]
28. Z. Zheng, Y. Zhong, S. Tian, A. Ma, and L. Zhang, “ChangeMask: Deep multi-task encoder-transformer-decoder architecture for semantic change detection,” ISPRS J. Photogramm. Remote Sens., vol. 183, no. 10, pp. 228–239, 2022. doi: 10.1016/j.isprsjprs.2021.10.015. [Google Scholar] [CrossRef]
29. J. Hu, L. Shen, S. Albanie, G. Sun, and E. Wu, “Squeeze-and-excitation networks,” in 2018 IEEE/CVF Conf. Comput. Vis. Pattern Recognit. (CVPR), Salt Lake City, UT, USA, pp. 7132–7141, 2018. doi: 10.1109/CVPR.2018.00745. [Google Scholar] [CrossRef]
30. S. Woo, J. Park, J. -Y. Lee, and I. S. Kweon, “CBAM: Convolutional block attention module,” in Proc. European Conf. Comput. Vis. (ECCV), 2018, pp. 3–19. doi: 10.1007/978-3-030-01234-2_1. [Google Scholar] [CrossRef]
31. H. Chen, J. Song, C. Han, J. Xia, and N. Yokoya, “ChangeMamba: Remote sensing change detection with spatio-temporal state space model,” IEEE Trans. Geosci. Remote Sensing, vol. 62, pp. 1–20, 2024. doi: 10.1109/TGRS.2024.3417253. [Google Scholar] [CrossRef]
Cite This Article
 Copyright © 2024 The Author(s). Published by Tech Science Press.
This work is licensed under a Creative Commons Attribution 4.0 International License , which permits unrestricted use, distribution, and reproduction in any medium, provided the original work is properly cited.
 Downloads
 Citation Tools