
 Submit a Paper
 Propose a Special lssue
 Open Access
ARTICLE

Analysis and Modeling of Mobile Phone Activity Data Using Interactive Cyber-Physical Social System
School of Computer Science and Engineering, Yeungnam University, Gyeongsan, 38541, Republic of Korea
* Corresponding Author: Gyu Sang Choi. Email:
Computers, Materials & Continua 2024, 80(3), 3507-3521. https://doi.org/10.32604/cmc.2024.053183
Received 26 April 2024; Accepted 15 July 2024; Issue published 12 September 2024
 View Full Text
 Download PDF
Abstract
Mobile networks possess significant information and thus are considered a gold mine for the researcher’s community. The call detail records (CDR) of a mobile network are used to identify the network’s efficacy and the mobile user’s behavior. It is evident from the recent literature that cyber-physical systems (CPS) were used in the analytics and modeling of telecom data. In addition, CPS is used to provide valuable services in smart cities. In general, a typical telecom company has millions of subscribers and thus generates massive amounts of data. From this aspect, data storage, analysis, and processing are the key concerns. To solve these issues, herein we propose a multilevel cyber-physical social system (CPSS) for the analysis and modeling of large internet data. Our proposed multilevel system has three levels and each level has a specific functionality. Initially, raw Call Detail Data (CDR) was collected at the first level. Herein, the data preprocessing, cleaning, and error removal operations were performed. In the second level, data processing, cleaning, reduction, integration, processing, and storage were performed. Herein, suggested internet activity record measures were applied. Our proposed system initially constructs a graph and then performs network analysis. Thus proposed CPSS system accurately identifies different areas of internet peak usage in a city (Milan city). Our research is helpful for the network operators to plan effective network configuration, management, and optimization of resources.Keywords
The smart city is a recent concept that has gained popularity [1,2]. A lot of researchers are working on the development of smart cities because they offer various valuable services such as smart traffic, smart parking, smart telecom, etc. However, privacy, the intelligent use of large-scale big data, connectivity, efficiency, and infrastructure remain concerns in this area. To address these issues, emerging technologies and cyber-physical systems are employed. The cyber-physical systems (CPS) are a recent research area [3–5]. The CPS is an intelligent system and consists of sensors, controllers, and actuators. These smart devices work together and provide a connection between the cyber and physical world [6]. CPS integrates physical and computational components to monitor and control the physical processes seamlessly.
Fig. 1 shows the hierarchical example of CPS. In this figure, it is evident that cyberspace consists of clouds. Here, the cloud connects to network and storage servers. The servers are used for the computation and data storage. The physical sensing layer includes autonomous vehicles, power systems, public health, buildings, etc. These devices are connected to the cyberspace (data storage and computation services) [7]. The key objective of a smart city is to provide valuable services using cyber-physical space [8]. Recently, the global landscape has evolved into a hybrid environment. Thus the integration of cyber, physical, and social aspects is gaining popularity [9]. This phenomenon is known as Cyber-Physical-Social Systems (CPSS) [10,11]. The unique and most important aspect of CPSS from CPS is the existence of social domain. The purpose of a CPSS is to provide efficient, convenient, and personalized services topeople in smart cities [12,13].
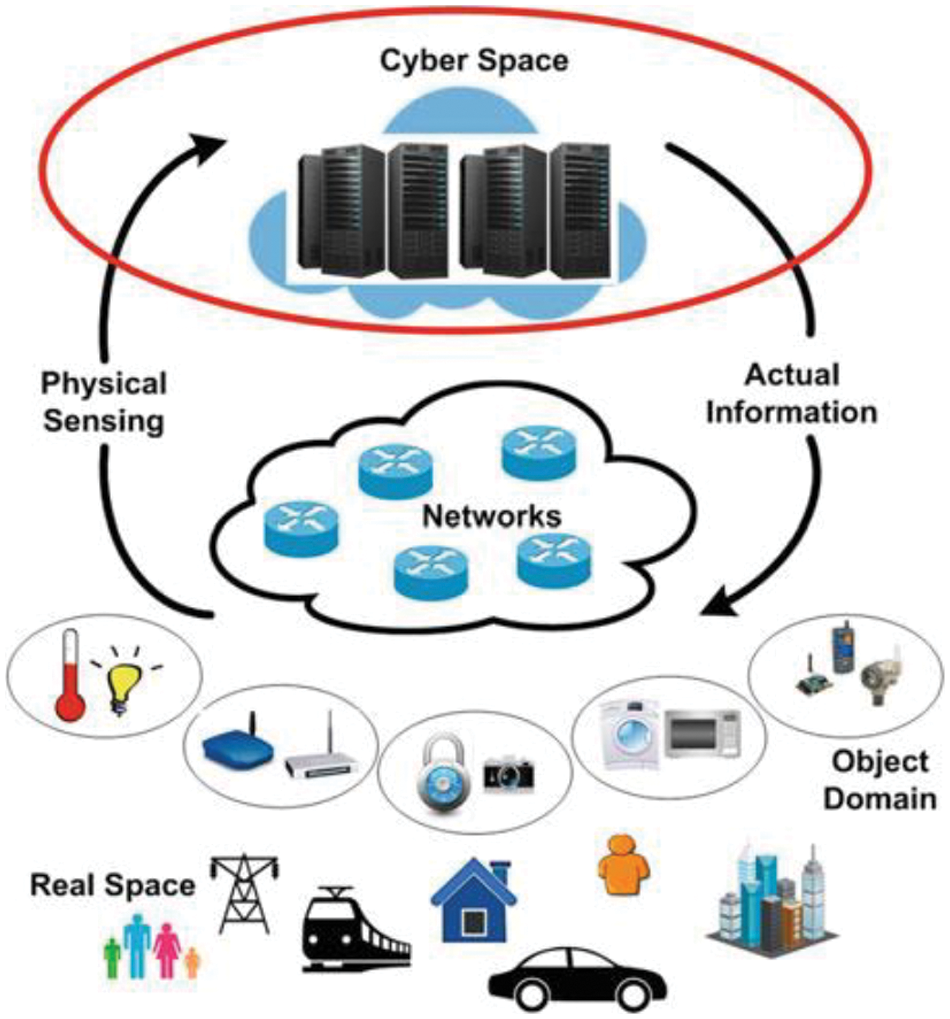
Figure 1: Example of cyber-physical system
Fig. 2 presents the basic structure and the key elements of a CPSS [14]. In this figure, a reader can see that cyber, physical, and social spaces are connected. The component of a social system is people. These people have relations with others and the relations are formed based on interaction, personal experiences, and observations. The second component is the ‘physical system’. This component comprised of sensors and actuators. Herein, the sensing devices are comprised of sensors actuators, etc. These devices are known as smart objects and are connected using communication technologies. The communication component is comprised of wireless and wired technologies. These are used to process data into the system and are shown in virtual space. The promising feature of a CPSS is that it provides an interface between different objects so that they can send and receive the data and as well carry out necessary actions. In general, most telecom companies record their user activity data including, SMS, calls, and internet for the monitoring purpose. This is commonly called Call Detail Record Data (CDR). Apart from calls, it contains various types of data; for instance; text messages and internet usage, etc.

Figure 2: The basic structure and the elements of CPSS
The CDR is considered a gold mine for data scientists due to its usage and high potential [15]. When a person calls another using a mobile phone. In response, a CDR event was generated. In many cases, telecom operators store the data in the system’s database [15]. Due to the importance of CDR in customer analytics, there is a need to investigate this important aspect during planning in a smart city [16,17]. Since a typical telecom company has millions of subscribers and thus it generates a massive data [18,19]. Hence, how to handle the massive telecom data, storage, analysis, and processing remains a key concern. In addition to this, the telecom data should be clean, free from errors, with no duplication, and also fewer missing values [19]. Therefore, to address these issues, we propose a social cyber-physical system (CPSS) for analyzing and modeling large internet usage data. Our proposed system extracts useful information using CDR data and identifies healthy predictability of spatiotemporal patterns within the network traffic. Initially, our proposed model extracts useful information from raw CDR data and then identifies a healthy predictability of spatiotemporal patterns [20] within the network traffic. Briefly, our proposed model is comprised of three levels and each level has different functionality. Initially, the raw Call Detail Data (CDR) data is collected using a data collection layer. Here, preprocessing and error removal processes are performed. Then our proposed system passed it to the next level. In Data processing, CPSS performs pre-processing and data storage functions. Here, our proposed system constructs a graph and performs analysis on it. Briefly, the modeling processis performed, followed by the analysis, and thus the spatiotemporal analysis is conducted. Finally, our proposed CPSS system accurately identifies different areas of internet peak usage in the different regions of a smart city (we consider Milan).
1.1 Problem Statement and the Motivation of Our Research
A typical telecom company has millions of users and thus generates a massive data. Therefore, how to handle large-scale data, storage, analysis, and processing are the key concerns for telecom companies and operators. Telecom companies always care about these concerns to improve the quality of service. Thus, the primary motivation of our research is to propose a novel method that can efficiently process large-scale telecom big data and perform data analyses. Our proposed CPSS system acts as a solution to all challenges associated with large-scale data.
Our research helps telecom network operators to plan efficient network management and the optimization of network resources while planning a smart city.
• In this research, we propose an interactive cyber-physical social system (CPSS) for the analysis and modeling of large-scale mobile phone data. The proposed CPSS model performs spatiotemporal analysis and also explores various features of network traffic in a smart city. This enables the network operators to plan effective network configuration, management, and also optimization of resources.
• Herein, we carefully investigated the correlation between spatial and temporal features to understand the dynamics of network traffic in a smart city.
• In earlier research, a generic model and the framework were proposed and traditional centrality methods were used for the data analysis. In contrast, our proposed model is unique in all aspects because, Herein we have suggested advanced internet activity Record measures named Pearson and Autocorrelation. These suggestions make our proposed model more efficient and thus our proposed model accurately identifies peak usage of internet areas in a smart city.
• The proposed system is technically evaluated using the original real data set and confirms the accuracy using the autocorrelation function. The achieved experimental results prove that our proposed model is helpful in modeling and also in the partitioning of network traffic patterns.
Herein, we propose a CPS system for the analysis and modeling of large internet data. From the current literature, we found that this research is new and also ongoing. However, telecom big data storage, analysis, and data processing are the key concerns. To tackle these issues our proposed system contributes and proposes a novel solution.
State of the art is presented in Section 2. Section 3 proposes a multilevel system. Section 4 explains the achieved results. Section 5 concludes the conclusion of our research.
In this section, we present a review of the most recent literature in this area. Sobb et al. [21] presented a review study. They first highlighted the growing and evolving state of CPSS. Then, reviewed CPSS especially the integration of emerging technologies named the Internet of Things (IoT), big data, machine learning, etc. The research gaps and the challenges were discussed in detail. Similar work has been carried out by Yin et al. [22]. In this study, they presented seven layered frameworks (7C), named D-CPSS using data-driven scenarios. Herein, the authors discussed the most recent development of IoT and the integration of social and large-scale networks.
Amin et al. [23] proposed CPSS for the analysis of hotspots using a smart city scenario. The proposed system uses graph-based metrics for the identification of hotspots in a city. However, the accuracy and the robustness were not measured. Brdar et al. [24] presented a knowledge retrieval model using telecom data [24]. Herein, They suggested traditional centrality measures named closeness and degree centrality [25]. Seufert et al. [26] proposed a Wi-Fi-based hotspot model for smart cities [26]. Herein, the Top-ten Wi-Fi hotspots were identified using a public dataset. They concluded that angles and the gamma distribution can be maintained using minimum distance. Nattapon et al. presented good research on CDRs using a telecom dataset [27]. In this study, they presented a method to clean the large data using “filters to filter”. Later, this method is used to remove anomalies. Kasem Ahmad et al. [28] presented a framework named the churn prediction SNA model. In this model, they combine both big data and machine learning [28]. Onnela et al. presented an analysis of telecom data using CDRs [29]. For this, they have selected a large dataset consisting of millions of CDR data. They have used CDR and considered them as weighted graphs [30]. According to these authors, it helps the readers to understand the structure of a network.
From the above literature review, we made the following observations. First, the research topic is new and thus still evolving. Secondly, limited research has been carried out in this area. Third, in existing studies, a generic model and the framework were presented. Thus, to fill this gap herein, we presented an interactive multilevel system for the analysis and modeling of internet activity data. The complete description details of the proposed multilevel system model are given below.
3 Proposed Interactive Multilevel System
Fig. 3 shows our proposed multilevel system. In this figure, a reader can see a three-level system design model. In this section, we explain the functionality of each level.
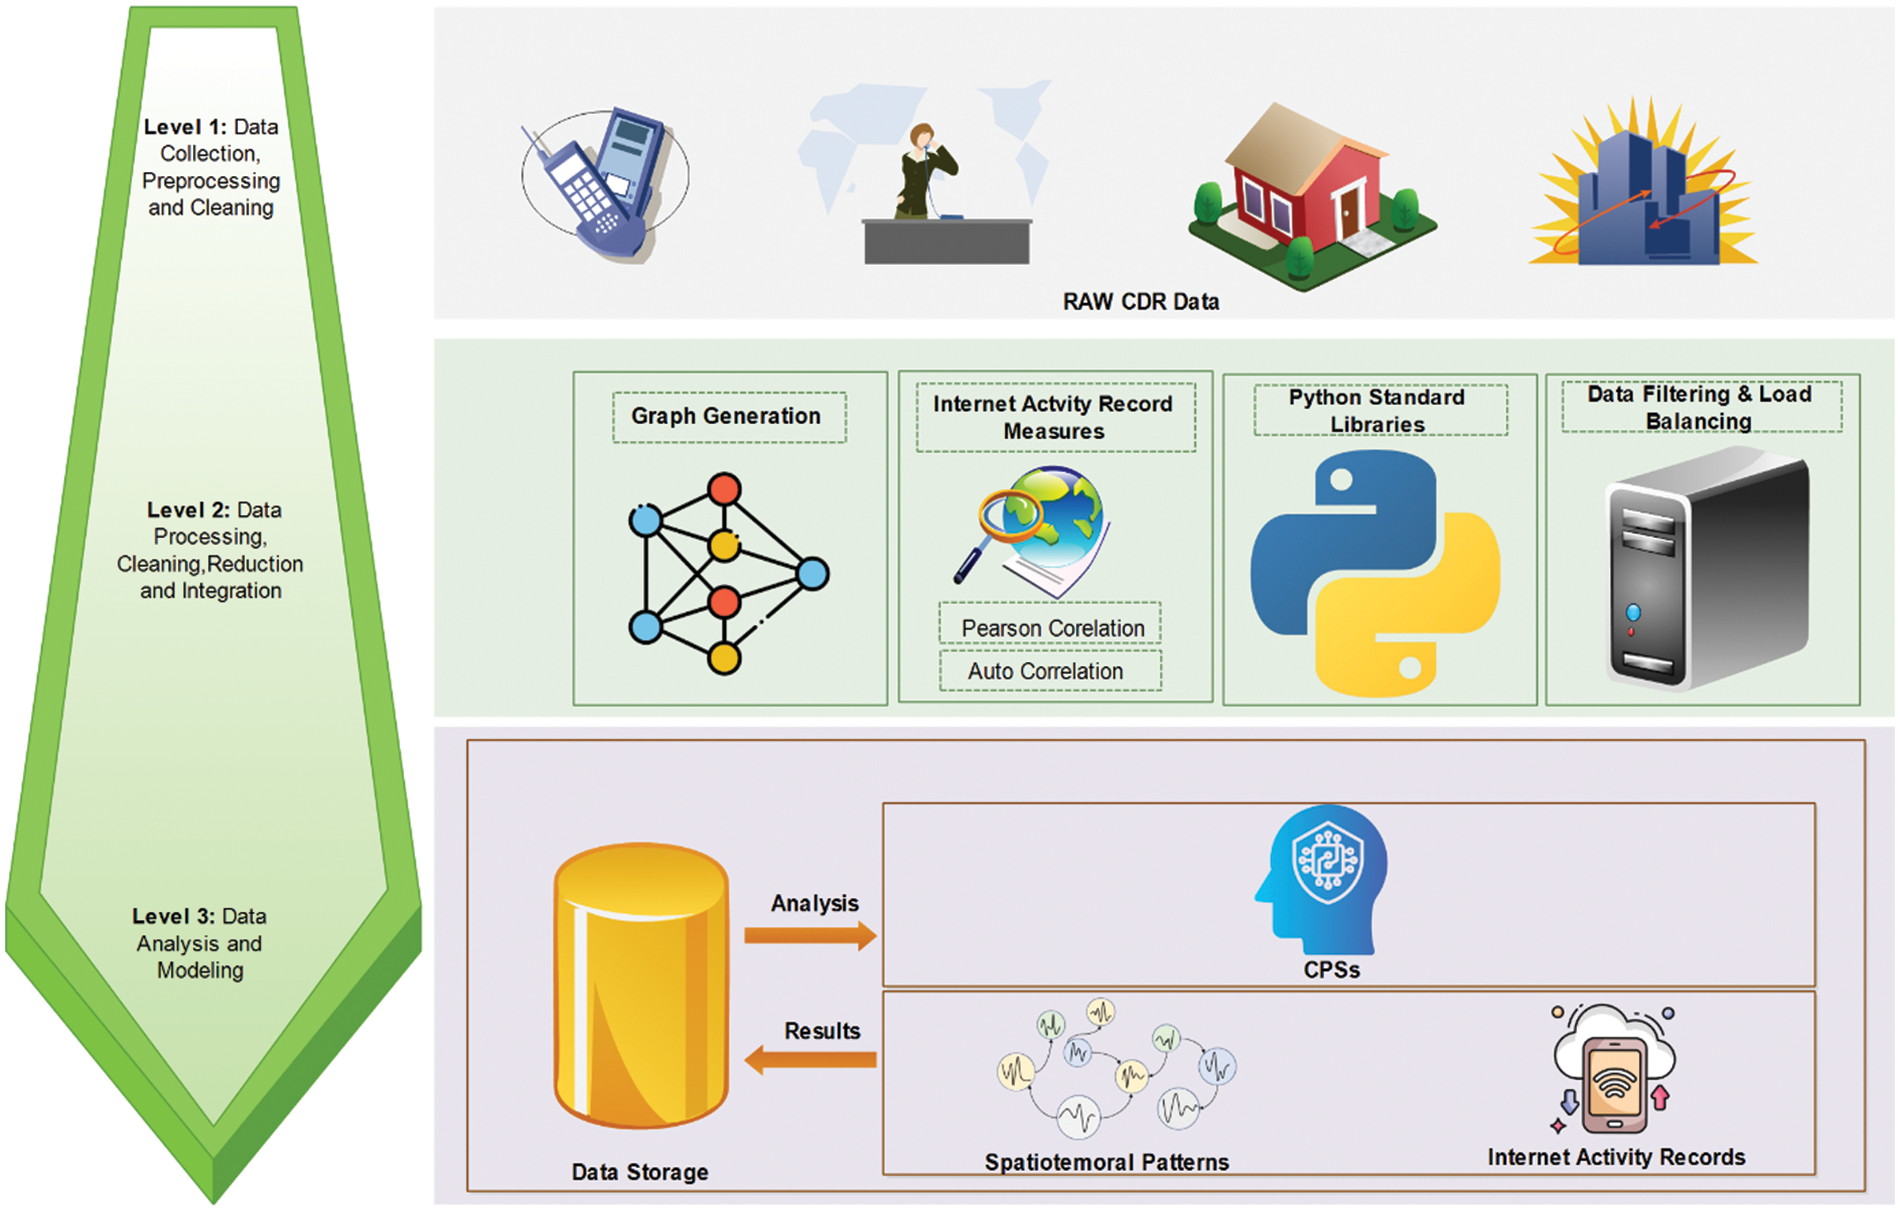
Figure 3: Overview of conceptual interactive multilevel CPSS system
3.1 Level 1: Data Collection, Preprocessing and Cleaning
At first, the raw data is collected and then preprocessed and cleaned. The Raw Data of CDR is collected from Telecom Italia. The key function is to treat the missing values and to reduce the preprocessing. Thus, the data set size is reduced and all unnecessary information is discarded in this stage. Eq. (1) is used to perform this task.
where
Python Data Analysis (Pandas) is used for the handling of incoming data. Initially, our proposed data storage system creates filtered big data. Herein, redundant data and errors were removed. The key responsibility of pandas is to perform transformation and the manipulation of data. For further processing, the load-balancing function is performed and for this purpose, a load-balancing algorithm is used. The objective here is to distribute the load to the various servers in equal sizes. The equal-size distribution is helpful to increase the system’s efficiency. Thus, the servers process an equal amount of output and generate the output at the same time. The processed data data is converted into a graph and the processing of sub-graphs task has been performed. These graphs were sent to the processing server by using intermediate layers. The graph database extracts the suggested internet activity record measures named person correlation and the autocorrelation has been applied to the graph.
This component is a key part of our proposed multi-level system model. Herein the process of graph construction is performed. Milan city is represented as a Graph
The graph-building component increases the efficiency of our proposed system by dividing the graph into various mutually exclusive subgraphs. After completing this task the independent subgraphs are sent to the processing server for further processing. Hence, the overall system load balance is maintained. Herein, the parallel graph processing component processes the graph, and also multiple servers are available to process each sub-graph as shown in Fig. 3. Herein, each parallel graph processing server is equipped with a specific graph algorithm. The specific algorithm runs based on the user’s request. As a result, every server produces corresponding output to each graph algorithm for each subgraph of the main graph. When graph processing is required, the subgraph forwards all independent subgraphs to the processing server, here the load balancing task has been performed.
3.3 Level 3: Modeling and the Analysis of CDR Network
At this level, the data analyses and the modeling task have been performed and the interactive results are displayed to the end users. It contains a storage device and a cloud server. The graph database sends the partial results and is stored in the storage server to the data server. Herein, the basic functions are decision-making and visualization of processed data. The analysis has been performed based on spatiotemporal patterns. Finally, the proposed system displays the desired results (internet activity record) to the end users.
4 Data Analysis and Experimental Results
In this section, we performed detailed experimental data analysis and also initiated a detailed discussion on the achieved experimental results. Herein, we use ‘Network X’ [31] as is a popular network package used for the analysis of networks. Network X core package provides a complete data structure and is comprised of various algorithms used for directed and undirected graphs.
In this section, we first explain the dataset. Secondly, we present a detailed data analysis on pre-processed data and then our proposed system performs spatial-temporal analyses. Herein, we have used the “Telecom Italia Big Data Challenge” [32]. This data was provided by the Italian Telecom.
Data between Trento and Milan cities were collected and a description of the dataset is listed in Table 1. In this table, the dataset type, issuer, and size of the dataset are given. The key elements of this dataset are:

•
•
• Times: It shows the time occurrence of different events.
We have used processed CDR data and then 1-day activity has been performed. In this activity, we used 3 h of raw data and then aggregated it. As a result of aggregation, the data is further divided into 8 different slots, and the time duration for 24 h.
4.1 Spatial Analysis and Internet Activity Record
Fig. 4 presents the spatial analysis (internet activity) for Milan. We have plotted the temporally averaged internet connections for each cell and averaged over the entire week (1–7 November). In this figure, the black ~0 connections and white ~5000 connections were shown. A reader can see that internet activity is higher, especially when going to the center of Milan city. It reduces when we go or move away from the city centers. We repeated this experiment and a similar phenomenon has been observed using different time intervals. Thus, this experiment concludes that most of the internet activity has been observed in the central regions of Milan city. The next step is to identify the different areas of internet peak usage in Milan city.

Figure 4: Spatial variation and the internet activity records for Milan
During our previous experiment, we observed that internet activity distribution is not uniform over the entire Milan city. The sub-regions differ in dynamics because these are residential and commercial areas. Thus, herein, we have suggested a Pearson correlation [33]. This is spatial correlation variation between target grids in a specific area. In general, the target grids comprised of rounding and grids.
The Eq. (2) is used for the computation of Pearson correlation. Herein,
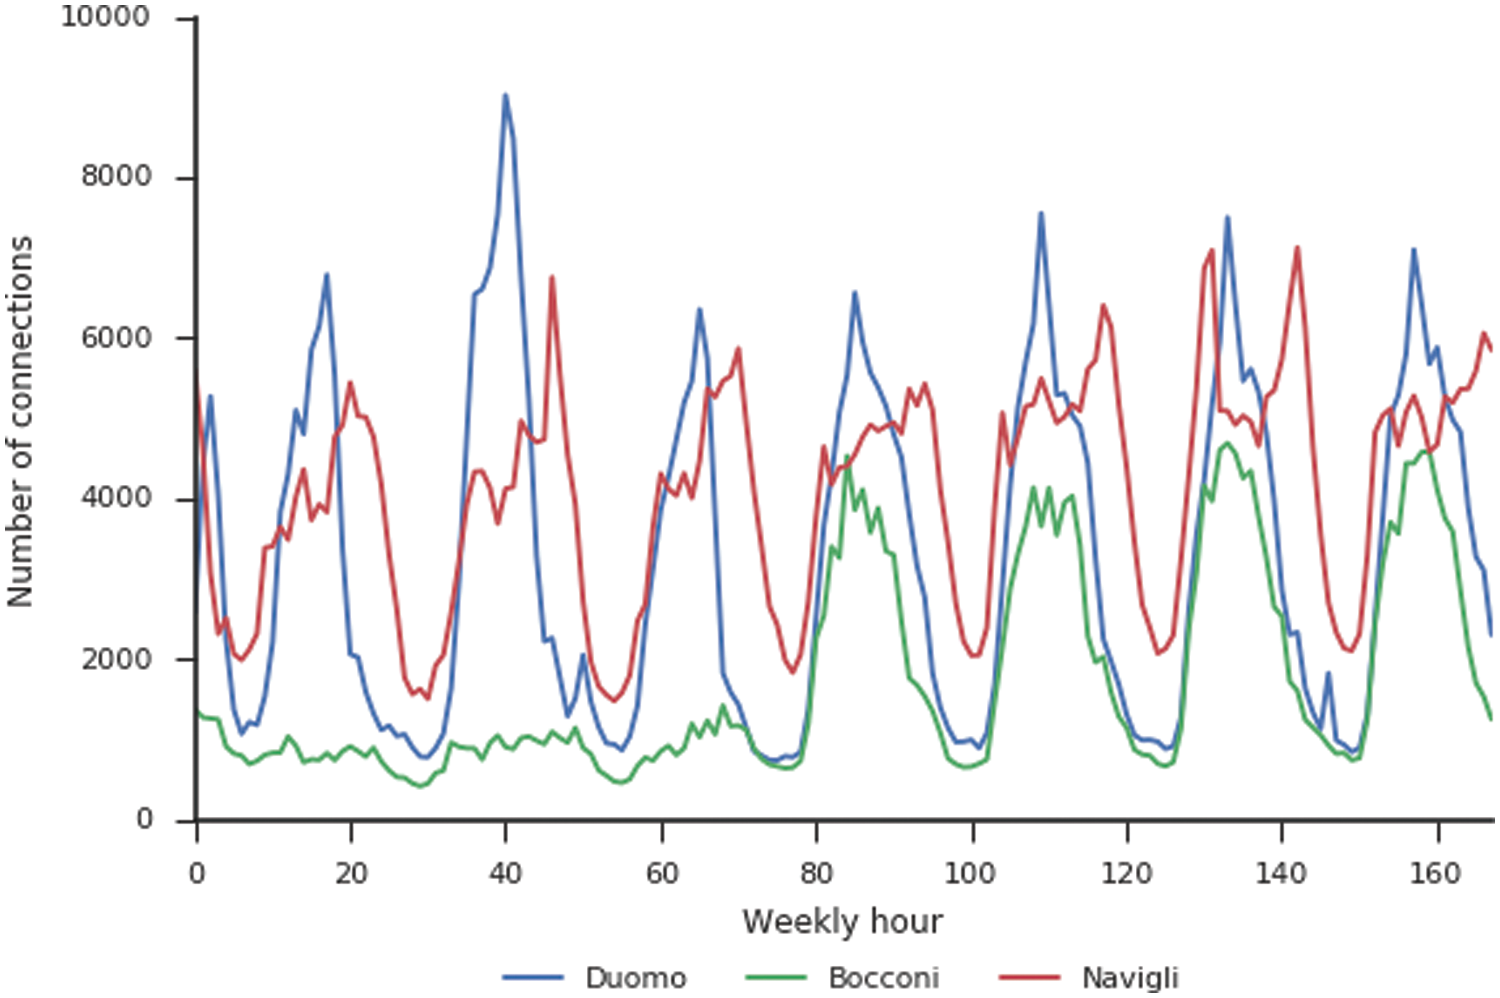
Figure 5: Mobile phone and internet activity in different areas over Milan city
4.2 Temporal Analysis and Internet Activity Map of Specific Areas over Milan
For this experiment, we first fixed spatial variation, and then internet activity was observed for a week. Fig. 6 presents the variation of internet activity records over a week in the Dumo region.

Figure 6: The number of internet connections in Dumo
In this figure, we observed that from midnight to the early morning the use of internet activity increases (over time). Similarly, from noon to afternoon it decreases. Finally, from evening to midnight, it again increases. We check similar patterns and observations using different time slots. Thus, the same pattern is observed over a day, week, and also in a month.
The temporal correlation is a time series data. The autocorrelation function (ACF) is used for the computation of correlation between the current and the previous time series [34].
The above Eq. (3) is used to compute this value. Herein,
Fig. 7 shows the CDR data in a time series curve. The x-axis shows the time or lag. The y-axis shows the number of internet connections. Herein, the autocorrelation function shows a very strong correlation at a lag of 24 h (time duration), which is consistent with visual observation of 24 h in the internet activity. It is observed from this figure that hours patterns exist in CDR data as the autocorrelation function shows the peak data after 20 h.

Figure 7: Auto correlation on the Duomo
4.3 Modeling Internet Usage in Duomo
Herein we propose a model for measuring the high internet activity in the Duomo area. The proposed model assumes sinusoidal behavior for internet activity throughout 24 h.
Herein, we suggest SciPy’s curve fit method to fit a sin curve with a period of 24 h to the Duomo data. The sine model appears to be a reasonable fit for the Duomo data. Fig. 8 shows the modeling of internet usage in the Duomo region. In this figure, the x-axis demonstrates the time measured in hours and the y-axis shows the number of internet connections. Herein, we simulated an original model with the proposed model. The next step is to analyze the residual to determine if it is statically stationary. The autocorrelation function calculation of the residual gives us more clues on the statistical nature of the residual. It is noted that for completely random, statistically stationary data the strongest correlation exists at lag = 0 and decreases as lag increases. Fig. 8 shows the plot of the residual and the modeling of internet usage in Duomo. Herein, we can see that only a weak correlation remains at 24 (and 12) h in our residual. This is contrasted by strong correlations observed in the raw data. From this experiment, a reader can see the efficiency of our proposed model.

Figure 8: Modeling of internet usage in Duomo
4.4 Peak internet Analysis in Duomo and Navigli
In this experiment, we examine the peak internet analyses in Duomo and Navigli. Thus, we have divided our proposed model into

Figure 9: Peak internet analysis in Duomo and Navigli
In Fig. 10, we examine that peak usage (from the model) occurs at roughly hour 14 (2 pm) in Duomo and roughly hour 18 (6 pm) in Navigli. This is intuitive as we would expect downtown areas to be fairly empty in the evening while areas of nightlife have more activity late into the evening, pushing peak usage to later in the evening.

Figure 10: Peak usage in Duomo and Navigli
4.5 Complete Map of Peak Usage
Fig. 11 shows the peak internet usage map using our proposed model across Milan city. In this figure, we can see that the majority of cells have peak usage in the middle of the day (black to red) with a few clusters showing peak usage that has shifted into the evening (orange to white).

Figure 11: Peak usage of internet activity records
Herein, we proposed an interactive CPSS system on a big data platform using telecom data. The interactive CPSS system performs analysis and the modeling of internet usage data provided by Telecom Italia. Our proposed system first converts the large-scale telecom data into a graph and then applies the person correlation and the autocorrelation for peak usage of internet activity in the different regions of Milan. The proposed CPSS model is divided into different levels and each level has different functionality. At first, the data collection receives raw telecom data. The next step is to pass through the next level, named data processing. The data processing performs different functions, for instance, processing, storage and analysis, etc. The suggested internet activity record measures were employed. Finally, our proposed CPSS system accurately identifies different areas of peak internet usage in Milan city. In the future, we will consider the security aspects of our proposed model.
Acknowledgement: We thank our families and colleagues who provided us with moral support.
Funding Statement: This work was supported by Basic Science Research Program through the National Research Foundation of Korea (NRF) funded by the Ministry of Education (NRF-2021R1A6A1A03039493).
Author Contributions: The authors confirm contribution to the paper as follows: study conception and design: Farhan Amin; data collection: Gyu Sang Choi; analysis and interpretation of results: Gyu Sang Choi; draft manuscript preparation: Farhan Amin, Gyu Sang Choi. All authors reviewed the results and approved the final version of the manuscript.
Availability of Data and Materials: In this study, we used a public dataset, which can be downloaded from the website if needed [31].
Ethics Approval: Not applicable.
Conflicts of Interest: The authors declare that they have no conflicts of interest to report regarding the present study.
References
1. J. Yang, Y. Kwon, and D. Kim, “Regional smart city development focus: The south korean national strategic smart city program,” IEEE Access, vol. 9, no. 7, pp. 7193–7210, 2021. doi: 10.1109/ACCESS.2020.3047139. [Google Scholar] [CrossRef]
2. A. K. Jha and N. R. Sunitha, “Evaluation and optimization of smart cities using betweenness centrality,” in Int. Conf. Algorith. Methodol. Models Appl. Emerg. Technol. (ICAMMAET), Chennai, India, 2017, pp. 1–3. [Google Scholar]
3. J. Feng, L. T. Yang, N. J. Gati, and B. S. Gavuna, “Privacy-preserving computation in cyber-physical-social systems: A survey of the state-of-the-art and perspectives,” Inf. Sci., vol. 527, no. 7, pp. 341–355, 2020. doi: 10.1016/j.ins.2019.07.036. [Google Scholar] [CrossRef]
4. S. Zhang, L. T. Yang, J. Feng, Z. Cui, and X. Xie, “A tensor-network-based big data fusion framework for cyber–physical–social systems (CPSS),” Inf. Fusion, vol. 76, no. 8, pp. 337–354, 2021. doi: 10.1016/j.inffus.2021.05.014. [Google Scholar] [CrossRef]
5. S. Kim, K. J. Park, and C. Lu, “A survey on network security for cyber-physical systems: From threats to resilient design,” IEEE Commun. Surv. Tutorials, vol. 24, no. 8, pp. 1534–1573, 2022. doi: 10.1109/COMST.2022.3187531. [Google Scholar] [CrossRef]
6. C. Xu, X. Huang, and K. Zhang, “Research on the construction of sanya smart tourism city based on internet and big data,” in Int. Conf. Intell. Transport. Big Data Smart City (ICITBS), HW, USA, 2018, pp. 125–128. [Google Scholar]
7. Q. Zhu and Z. Xu, “Cross-layer framework for CPSs,” in Cross-Layer Design for Secure and Resilient Cyber-Physical Systems: A Decision and Game Theoretic Approach. Cham: Springer, pp. 9–15, 2020. [Google Scholar]
8. L. Kuang, L. T. Yang, and Y. Liao, “An integration framework on cloud for cyber-physical-social systems big data,” IEEE Trans. Cloud Comput., vol. 8, no. 9, pp. 363–374, 2020. doi: 10.1109/TCC.2015.2511766. [Google Scholar] [CrossRef]
9. A. K. Sangaiah, A. Javadpour, and P. Pinto, “Towards data security assessments using an IDS security model for cyber-physical smart cities,” Inf. Sci., vol. 648, no. 9, 2023, Art. no. 119530. doi: 10.1016/j.ins.2023.119530. [Google Scholar] [CrossRef]
10. S. Pasandideh, P. Pereira, and L. Gomes, “Cyber-physical-social systems: Taxonomy, challenges, and opportunities,” IEEE Access, vol. 10, no. 9, pp. 42404–42419, 2022. doi: 10.1109/ACCESS.2022.3167441. [Google Scholar] [CrossRef]
11. G. G. Wang, X. Cai, Z. Cui, and J. Chen, “High performance computing for cyber physical social systems by using evolutionary multi-objective optimization algorithm,” IEEE Trans. Emerg. Top. Comput., vol. 8, no. 8, pp. 20–30, 2020. [Google Scholar]
12. H. Liu, L. T. Yang, Y. Guo, and J. Ma, “An incremental tensor-train decomposition for cyber-physical-social big data,” IEEE Trans. Big Data, vol. 7, no. 9, pp. 341–354, 2021. doi: 10.1109/TBDATA.2018.2867485. [Google Scholar] [CrossRef]
13. F. Sivrikaya, N. Ben-Sassi, and C. Kuster, “Internet of smart city objects: A distributed framework for service discovery and composition,” IEEE Access, vol. 7, no. 9, pp. 14434–14454, 2019. doi: 10.1109/ACCESS.2019.2893340. [Google Scholar] [CrossRef]
14. X. Ran, X. Zhou, M. Lei, and W. Deng, “A novel k-means clustering algorithm with a noise algorithm for capturing urban hotspots,” Appl. Sci., vol. 11, no. 9, 2021, Art. no. 11202. doi: 10.3390/app112311202. [Google Scholar] [CrossRef]
15. A. A. Khade, “Performing customer behavior analysis using big data analytics,” Proc. Comput. Sci., vol. 79, no. 8, pp. 986–992, 2016. doi: 10.1016/j.procs.2016.03.125. [Google Scholar] [CrossRef]
16. A. Ahmad, M. Babar, S. Din, and M. M. Ullah, “Socio-cyber network: The potential of cyber-physical system to define human behaviors using big data analytics,” Future Gener. Comput. Syst., vol. 92, no. 9, pp. 868–878, 2019. doi: 10.1016/j.future.2017.12.027. [Google Scholar] [CrossRef]
17. S. De, Y. Zhou, and K. Moessner, “Cyber–physical–social frameworks for urban big data systems: A survey,” Appl. Sci., vol. 7, no. 9, pp. 10–17, 2017. doi: 10.3390/app7101017. [Google Scholar] [CrossRef]
18. K. Sultan, H. Ali, and Z. Zhang, “Call detail records driven anomaly detection and traffic prediction in mobile cellular networks,” IEEE Access, vol. 6, no. 9, pp. 41728–41737, 2018. doi: 10.1109/ACCESS.2018.2859756. [Google Scholar] [CrossRef]
19. G. Maji, S. Mandal, and S. Sen, “Identification of city hotspots by analyzing telecom call detail records using complex network modeling,” Expert. Syst. Appl., vol. 215, no. 9, 2023, Art. no. 119298. doi: 10.1016/j.eswa.2022.119298. [Google Scholar] [CrossRef]
20. A. A. Musa, A. Hussaini, W. Liao, and F. Liang, “Deep neural networks for spatial-temporal cyber-physical systems: A survey,” Future Internet, vol. 15, no. 6, 2023, Art. no. 199. doi: 10.3390/fi15060199. [Google Scholar] [CrossRef]
21. T. Sobb, B. Turnbull, and N. Moustafa, “A holistic review of cyber–physical–social systems: New directions and opportunities,” Sensors, vol. 23, no. 9, 2023, Art. no. 7391. doi: 10.3390/s23177391. [Google Scholar] [PubMed] [CrossRef]
22. D. Yin, X. Ming, and X. Zhang, “Understanding data-driven cyber-physical-social system (D-CPSS) using a 7C framework in social manufacturing context,” Sensors, vol. 20, no. 18, 2020, Art. no. 5319. doi: 10.3390/s20185319. [Google Scholar] [PubMed] [CrossRef]
23. F. Amin and G. S. Choi, “Hotspots analysis using cyber-physical-social system for a smart city,” IEEE Access, vol. 8, no. 9, pp. 122197–122209, 2020. doi: 10.1109/ACCESS.2020.3003030. [Google Scholar] [CrossRef]
24. S. Brdar, O. Novović, and S. Benkner, “Big data processing, analysis and applications in mobile cellular networks,” in High-Performance Modelling and Simulation for Big Data Applications: Selected Results of the COST Action. Cham: Springer, pp. 163–185, 2019. [Google Scholar]
25. G. Sabidussi, “The centrality index of a graph,” Psychometrika, vol. 31, no. 7, pp. 581–603, 2012. doi: 10.1007/BF02289527. [Google Scholar] [PubMed] [CrossRef]
26. M. Seufert, T. Griepentrog, and T. Hoßfeld, “A simple wifi hotspot model for cities,” IEEE Commun. Lett., vol. 20, no. 2, pp. 384–387, 2016. doi: 10.1109/LCOMM.2015.2509074. [Google Scholar] [CrossRef]
27. N. Werayawarangura and P. Vateekul, “Social network analysis of calling data records for identifying influencers and communities,” in Int. Joint Conf. Comput. Sci. Softw. Eng. (JCSSE), Khon Kaen, Thailand, 2016, pp. 1–6. [Google Scholar]
28. A. Kasem Ahmad, A. Jafar, and K. Aljoumaa, “Customer churn prediction in telecom using machine learning and social network analysis in big data platform,” J. Big Data, vol. 8, no. 9, pp. 1–24, 2019. [Google Scholar]
29. J. -P. Onnela, J. Saramäki, and K. Kaski, “Analysis of a large-scale weighted network of one-to-one human communication,” New J. Phys., vol. 9, no. 9, 2007, Art. no. 179. doi: 10.1088/1367-2630/9/6/179. [Google Scholar] [CrossRef]
30. L. Cai, H. Wang, C. Sha, F. Jiang, and W. Zhou, “The mining of urban hotspots based on multi-source location data fusion,” IEEE Trans. Knowl. Data Eng., vol. 35, no. 9, pp. 2061–2077, 2023. [Google Scholar]
31. A. Hagberg, P. Swart, and D. S. Chult, “Exploring network structure, dynamics, and function using networkx,” IEEE Access, vol. 8, no. 9, pp. 11–16, 2008. [Google Scholar]
32. G. Barlacchi, M. De Nadai, and R. Larcher, “A multi-source dataset of urban life in the city of Milan and the Province of Trentino,” Sci. Data, vol. 2, no. 9, 2015, Art. no. 150055. doi: 10.1038/sdata.2015.55. [Google Scholar] [PubMed] [CrossRef]
33. C. Zhang, H. Zhang, D. Yuan, and M. Zhang, “Citywide cellular traffic prediction based on densely connected convolutional neural networks,” IEEE Commun. Lett., vol. 22, no. 9, pp. 1656–1659, 2018. doi: 10.1109/LCOMM.2018.2841832. [Google Scholar] [CrossRef]
34. B. Jason, “Introduction to time series forecasting with python,” in Machine Learning Master. Vermont, Australia: Machine Learning Mastery, 2017, pp. 2–18. [Google Scholar]
Cite This Article
 Copyright © 2024 The Author(s). Published by Tech Science Press.
This work is licensed under a Creative Commons Attribution 4.0 International License , which permits unrestricted use, distribution, and reproduction in any medium, provided the original work is properly cited.
 Downloads
 Citation Tools