 Open Access
ARTICLE
Computational Approach for Automated Segmentation and Classification of Region of Interest in Lateral Breast Thermograms
1 Department of Electrical, Computer and Telecommunications Engineering, Botswana International University of Science and Technology, Palapye, Private Bag 16, Botswana
2 College of Computer and Information Sciences, Prince Sultan University, Riyadh, 11586, Saudi Arabia
3 Robotics and Internet of Things Lab, Prince Sultan University, Riyadh, 11586, Saudi Arabia
* Corresponding Authors: Dennies Tsietso. Email: ; Muhammad Babar. Email:
Computers, Materials & Continua 2024, 80(3), 4749-4765. https://doi.org/10.32604/cmc.2024.052793
Received 15 April 2024; Accepted 02 August 2024; Issue published 12 September 2024
Abstract
Breast cancer is one of the major health issues with high mortality rates and a substantial impact on patients and healthcare systems worldwide. Various Computer-Aided Diagnosis (CAD) tools, based on breast thermograms, have been developed for early detection of this disease. However, accurately segmenting the Region of Interest (ROI) from thermograms remains challenging. This paper presents an approach that leverages image acquisition protocol parameters to identify the lateral breast region and estimate its bottom boundary using a second-degree polynomial. The proposed method demonstrated high efficacy, achieving an impressive Jaccard coefficient of 86% and a Dice index of 92% when evaluated against manually created ground truths. Textural features were extracted from each view’s ROI, with significant features selected via Mutual Information for training Multi-Layer Perceptron (MLP) and K-Nearest Neighbors (KNN) classifiers. Our findings revealed that the MLP classifier outperformed the KNN, achieving an accuracy of 86%, a specificity of 100%, and an Area Under the Curve (AUC) of 0.85. The consistency of the method across both sides of the breast suggests its viability as an auto-segmentation tool. Furthermore, the classification results suggests that lateral views of breast thermograms harbor valuable features that can significantly aid in the early detection of breast cancer.Keywords
Breast Cancer is one of the most fatal diseases globally. As per 2020 Global Cancer Observatory (GLOBOCAN) statistics, there were 2.3 million registered cases and 685,000 were fatal,which made it the second most common cause of death among women [1]. In developed countries, the incidence rate is higher than in developing countries [2,3]. Cancer is characterized by uncontrolled cell proliferation [4,5], and if the cells invade other body parts, it is classified as invasive; otherwise, it is categorized as non-invasive [6]. Identifying cancer early on effectively prevents aggressive treatments such as mastectomy [7]. Generally, early detection is conducted through mammography. However, this invasive procedure causes discomfort and uses an ionizing radiation dose, which increases the chances of developing radiation-induced breast cancer [8]. On the contrary, thermography is an economical, radiation-free, and noninvasive screening modality that can also be used, particularly for dense breasts [9]. This approach relies on the observation that the human body exhibits a level of thermal symmetry when in a healthy state. Otherwise, it is abnormal. This anomaly signifies a higher metabolic activity, possibly due to cancerous cells [10].
Thermography measures the surface temperature of the breasts. These temperature variations are visualized as color-coded maps called thermograms. Analysis involves comparing the temperature distribution between corresponding regions (contralateral breasts) for abnormalities. To facilitate this comparison, segmentation techniques are used to isolate the Region of Interest (ROI) from the thermogram. While various methods exist for segmenting frontal view thermograms, which capture a larger portion of the breast, there’s a gap in techniques for segmenting lateral view thermograms. These side-view images hold valuable information for detecting tumors in the lateral breast tissue. Accurate segmentation of both frontal and lateral views is crucial for developing robust Computer-Aided Detection (CAD) systems. Successful CAD systems can potentially reduce workload for pathologists and minimize subjectivity in breast cancer diagnoses [11].
This paper proposes a novel technique for segmenting lateral-view breast thermograms. The method extracts texture features from the segmented ROIs. A subset of these features is then used to train a machine learning algorithm to differentiate between healthy and cancerous thermograms. We evaluated our approach using a dataset of 31 healthy and 26 cancerous subjects acquired with the Static Infrared Thermography (SIT) protocol at a 90-degree angle. The main contributions of this paper are twofold:
• We propose a novel technique for segmenting lateral-view breast thermograms. This fills a critical gap in current methods that focus mainly on frontal views. By including the sides of the breast, where tumors can also arise, our segmentation approach has the potential to improve breast cancer detection in thermography
• We explore the feasibility of using machine learning for breast cancer classification based on the segmented lateral-view thermograms
The rest of the article has been structured in the following manner: Section 2 outlines the related works on breast cancer detection; Section 3 details our methods and the data set used for the experiment. The experimental results are explored in depth in Section 4 and discussed further in Section 5 before all is wrapped up with the conclusion provided in Section 6.
Research has recently been devoted to breast thermography. For example, in [12], fuzzy active contours were employed to segment cancerous tissue regions on frontal and lateral breast thermograms. The segmentation results were validated with manually segmented ground truths. The method achieved 91.98% accuracy 85% sensitivity. Madhavi et al. [13] presented a multi-view breast thermogram analysis by textural feature fusion. The level-set method was used for segmenting lateral breast thermograms in their method. Rather than periodically resetting the level set function to its initial state for controlling numerical errors, they employed the level set evolution without re-initialization. Gray-Level Co-occurrence Matrix (GLCM) features were independently extracted from the frontal, left-lateral, and right-lateral thermograms. Feature fusion was undertaken on the extracted lateral and frontal ROIs to create a composite feature vector. Fused textures achieved 96% accuracy, 92% specificity, and 100% sensitivity.
In Reference [14], a segmentation approach was proposed to consider spatial information pixels in breast thermograms. The approach employed a metaheuristic algorithm referred to as the Dragonfly Algorithm (DA) to seek out the most suitable threshold values for dividing a breast thermogram into distinct regions that are homogeneous and well-defined. This was applied to the image’s energy curve. The DA was evaluated using Kapur and Otsu as objective functions and was found to iterate until it reached an optimal solution. Moreover, four optimization algorithms were applied to the Otsu and Kapur functions and compared with the DA over eight randomly chosen breast thermograms, including lateral views. The DA achieved superior performance compared to other implementations for Otsu and Kapur variants across most metrics, producing thermograms with clear borders.
Kapoor et al. [15] introduced an approach for the automatic segmentation ROI from breast thermograms and analyzing breast thermogram asymmetry to classify a breast as healthy or abnormal. The undesirable body part, which included the waistlines and shoulder region, was initially cropped away to identify the breast limits. The Canny edge detector was then employed to detect edges, and to estimate bottom breast boundary curves. After decimating the area below the bottom boundaries, the remaining region was separated into the left and right breasts. Histograms were created, and features were extracted from each side to analyze the asymmetry of the contralateral breasts. We concur with asymmetry analysis, as it can serve as a second set of eyes for diagnostics.
Venkatachalam et al. [16] presented a segmentation technique resilient to impediments normally encountered in breast thermogram datasets, including low contrast, a low signal-to-noise ratio, and overlapping ROIs. The approach employs the active contour method to segment the ROI affected by inflammation. Initially, the inflamed ROI is localized, and active contours are automatically initialized based on the multi-scale local and global fitted image models. The method’s validity was assessed by comparing its output with ground truths generated by an expert. Their method was resilient against breast thermograms’ severe intensity inhomogeneity and could precisely segment the inflamed ROI. Moreover, second-order statistical descriptors were extracted from the ROIs to classify the images as malignant or benign. The technique was evaluated on two datasets and compared to existing state-of-the-art methods such as fuzzy C-means, K-means, and Chan-Vese, all of which it outperformed in accuracy.
This section details a fully automatic approach for segmenting the ROI from lateral breast thermograms. We begin by outlining the characteristics of the thermogram dataset used in the study. The segmentation process itself follows a multi-step approach. First, the thermal images undergo denoising to remove unwanted noise before edge detection. Morphological operations are then applied to enhance the extracted edges. Subsequently, the approach leverages information from the image acquisition protocol to identify crucial areas for isolating the breast boundary. Utilizing the bottom boundary points, the entire boundary is then estimated. Finally, a binary mask is generated based on the segmented ROI and overlaid onto the original thermogram to create the final ROI image.
This study utilized thermograms from the Database for Mastology Research (DMR). This publicly accessible database with thermograms was acquired from volunteers by Federal Fluminense University in Brazil [17]. It hosts images acquired from numerous views via the Static Infrared Thermography and Dynamic Infrared Thermography (DIT) protocols. For acquisition, a FLIR SC-620 thermal infrared camera with a resolution of
Before removing the breast boundary from undesirable areas, such as the neck and back. The thermogram was converted to grayscale and denoised with a Gaussian kernel. This filter was adopted for its simplicity and robustness against noise [18]. In image processing, a two-dimensional variant of the Gaussian function is used, as defined in Eq. (1).
where
3.2.2 Breast Boundary Extraction
The extraction of the bounding rectangle encompassing the breast region was accomplished by leveraging a gradient image, which was a guiding mechanism for the extraction procedure. A Canny edge detector was used to detect edges in the denoised image. This algorithm detects abrupt changes in image intensity in a small region. It employs a convolution gradient operator to magnify regions with high spatial derivatives to compute image gradient magnitude at each pixel as
Non-border pixels are then suppressed via non-maxima suppression. Finally, hysteresis thresholding is used to identify weak and strong edges based on a threshold. This detector is recognized as the best edge detector due to its superior localization and noise resilience [19], hence its wide adoption in image processing. A threshold of
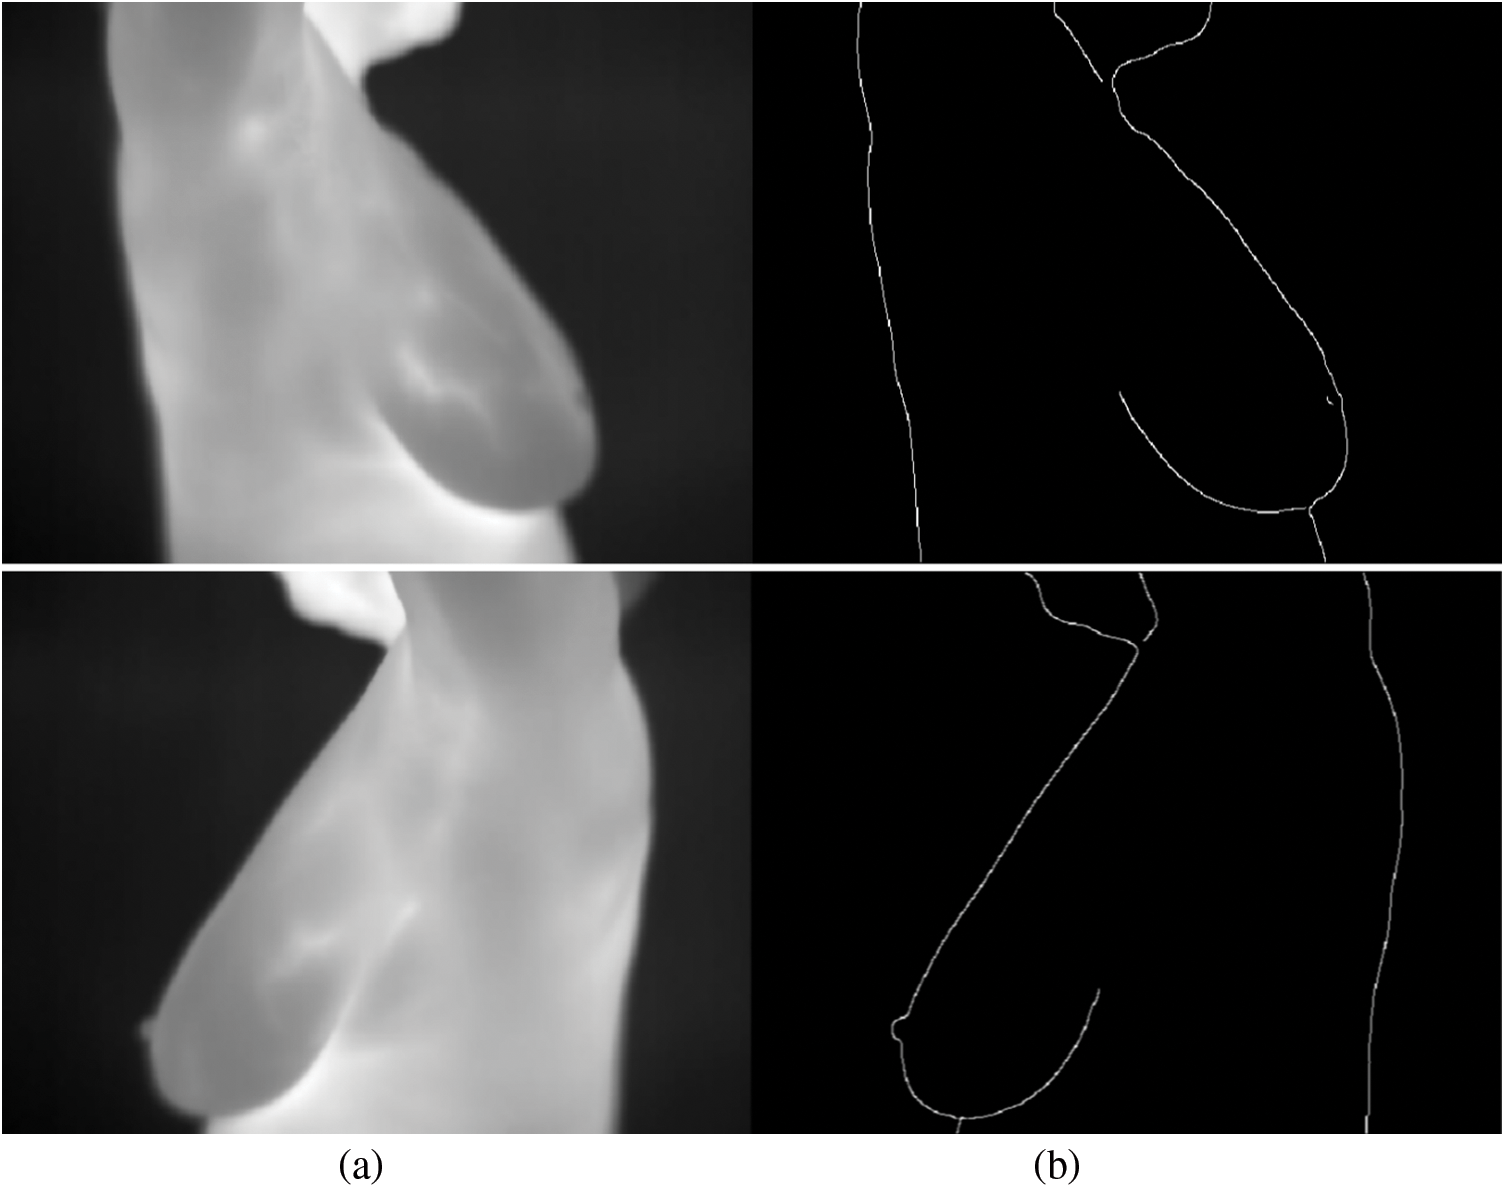
Figure 1: Edges generated by the Canny edge detector. (a) Grayscale images. (b) Gradient image
The morphological operations of closing and dilation were employed to connect disconnected boundaries and enhance the overall boundary. These operations are described in Eqs. (3) and (4).
where
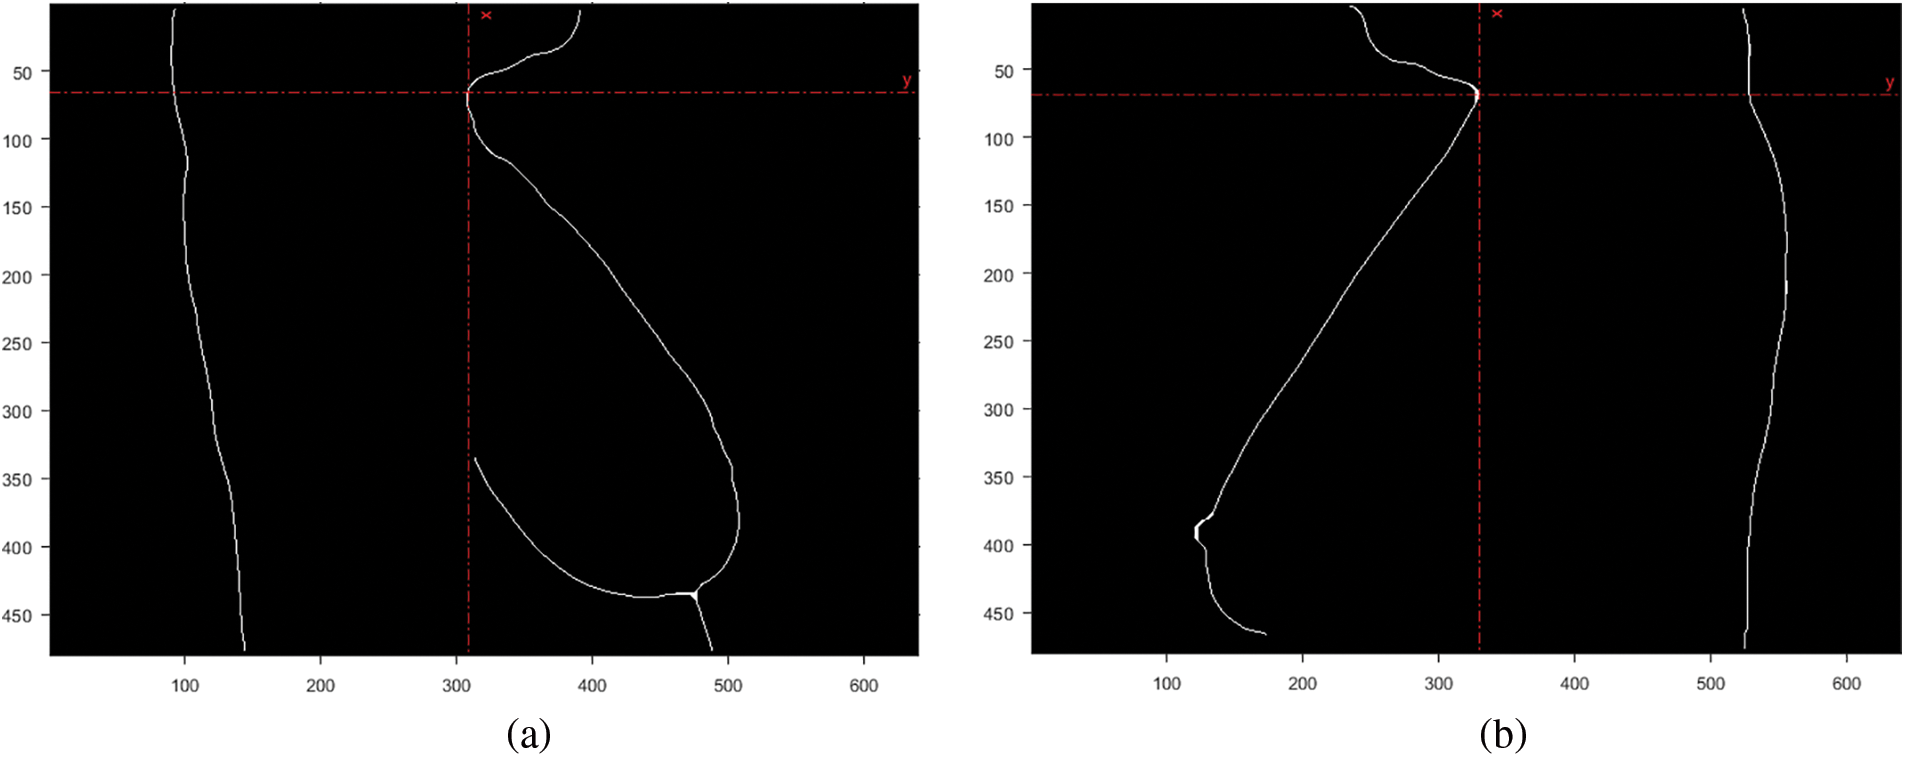
Figure 2: Coordinate for the convex point of the neck area. (a) Right breast. (b) Left breast
3.2.3 Polynomial Curve Fitting
The bottom breast boundary was traced and fitted to a second-degree polynomial to estimate the bottom boundary curve, as shown in Fig. 3a. Finally, the intersection points of the curve and boundary points were calculated and marked, as illustrated in Fig. 3b.
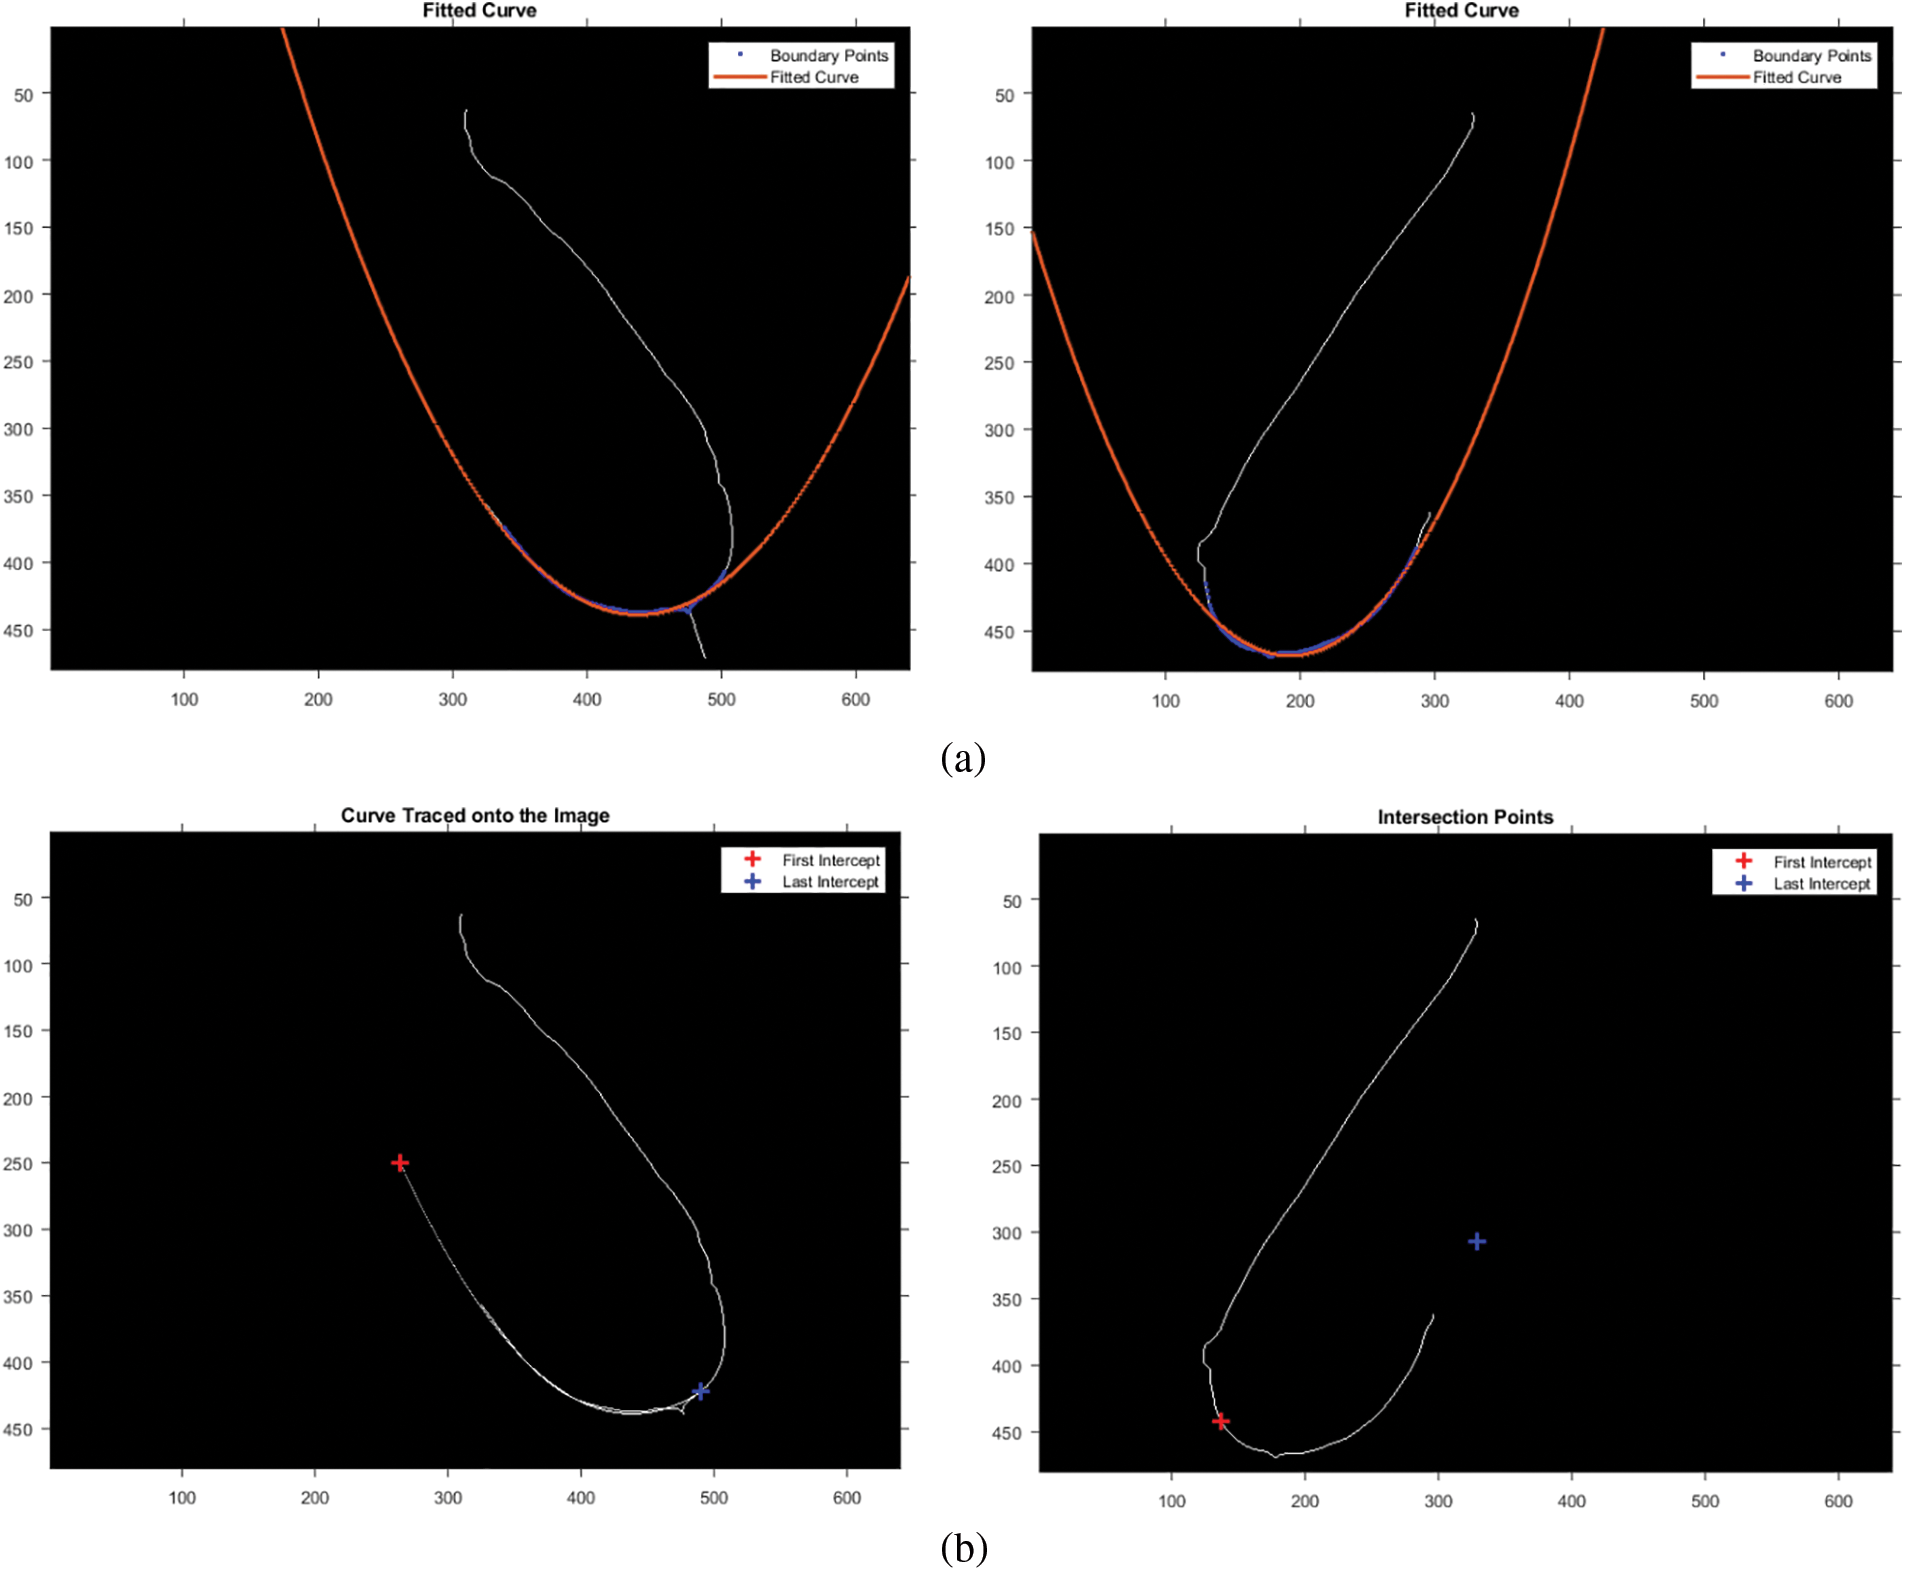
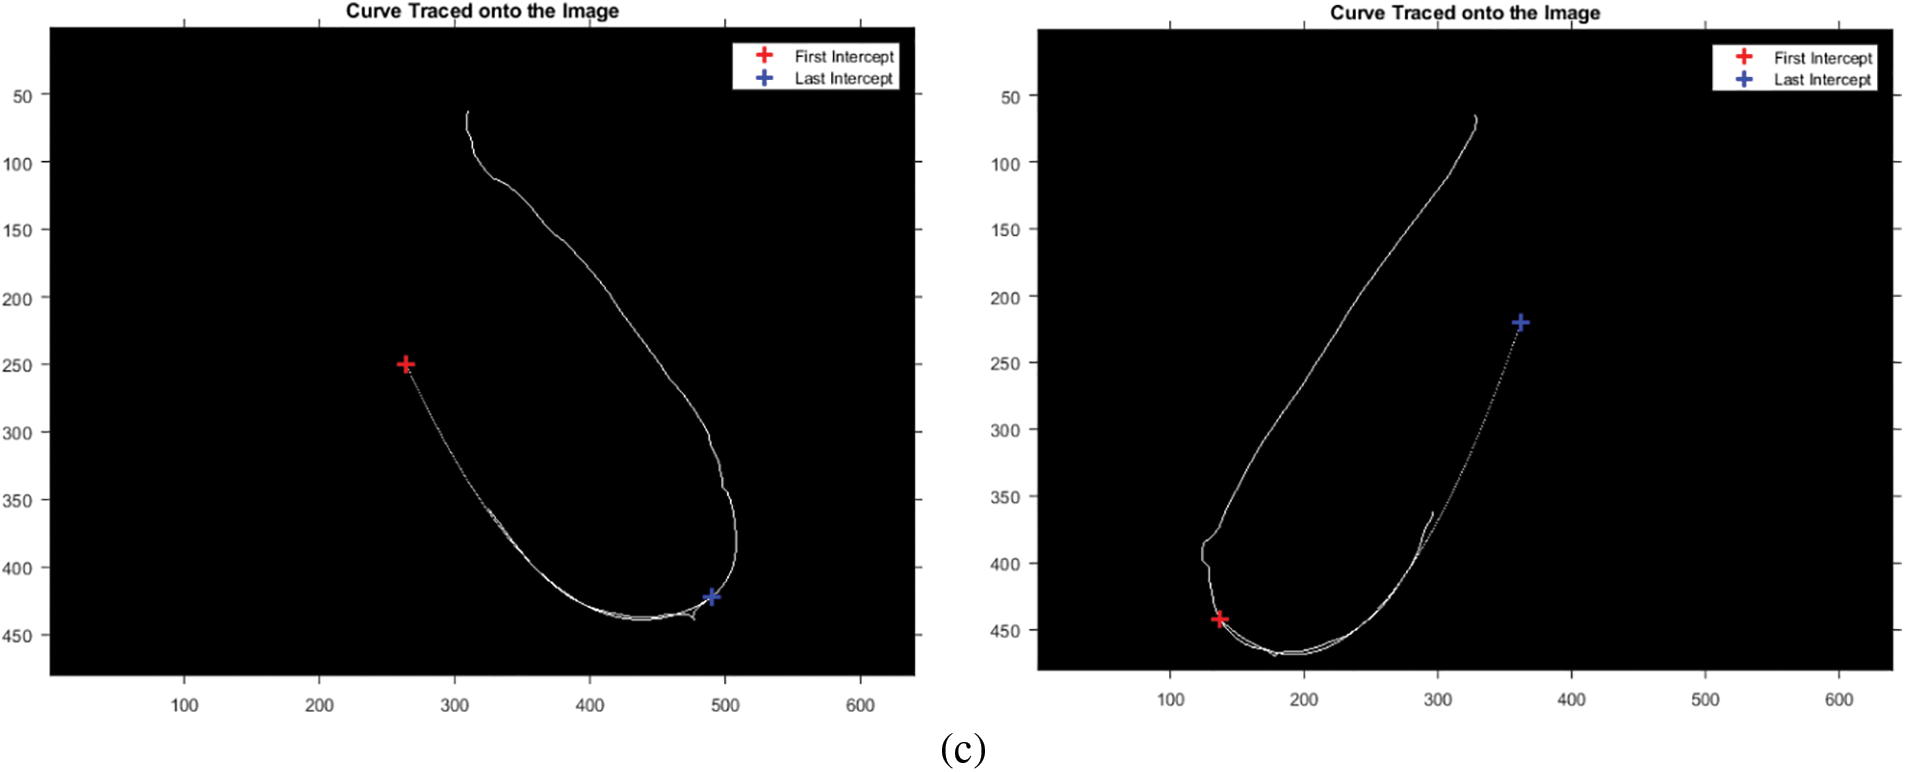
Figure 3: Estimation of the bottom breast boundary. (a) Fitted curve. (b) Intersection points. (c) Intersection points after rotation
The dataset contains images of different breast structures; to preserve data across all ROIs, the intersection of the boundary column
3.2.4 Mask and Region of Interest Generation
After engraving the curve onto the image, a straight line was drawn from
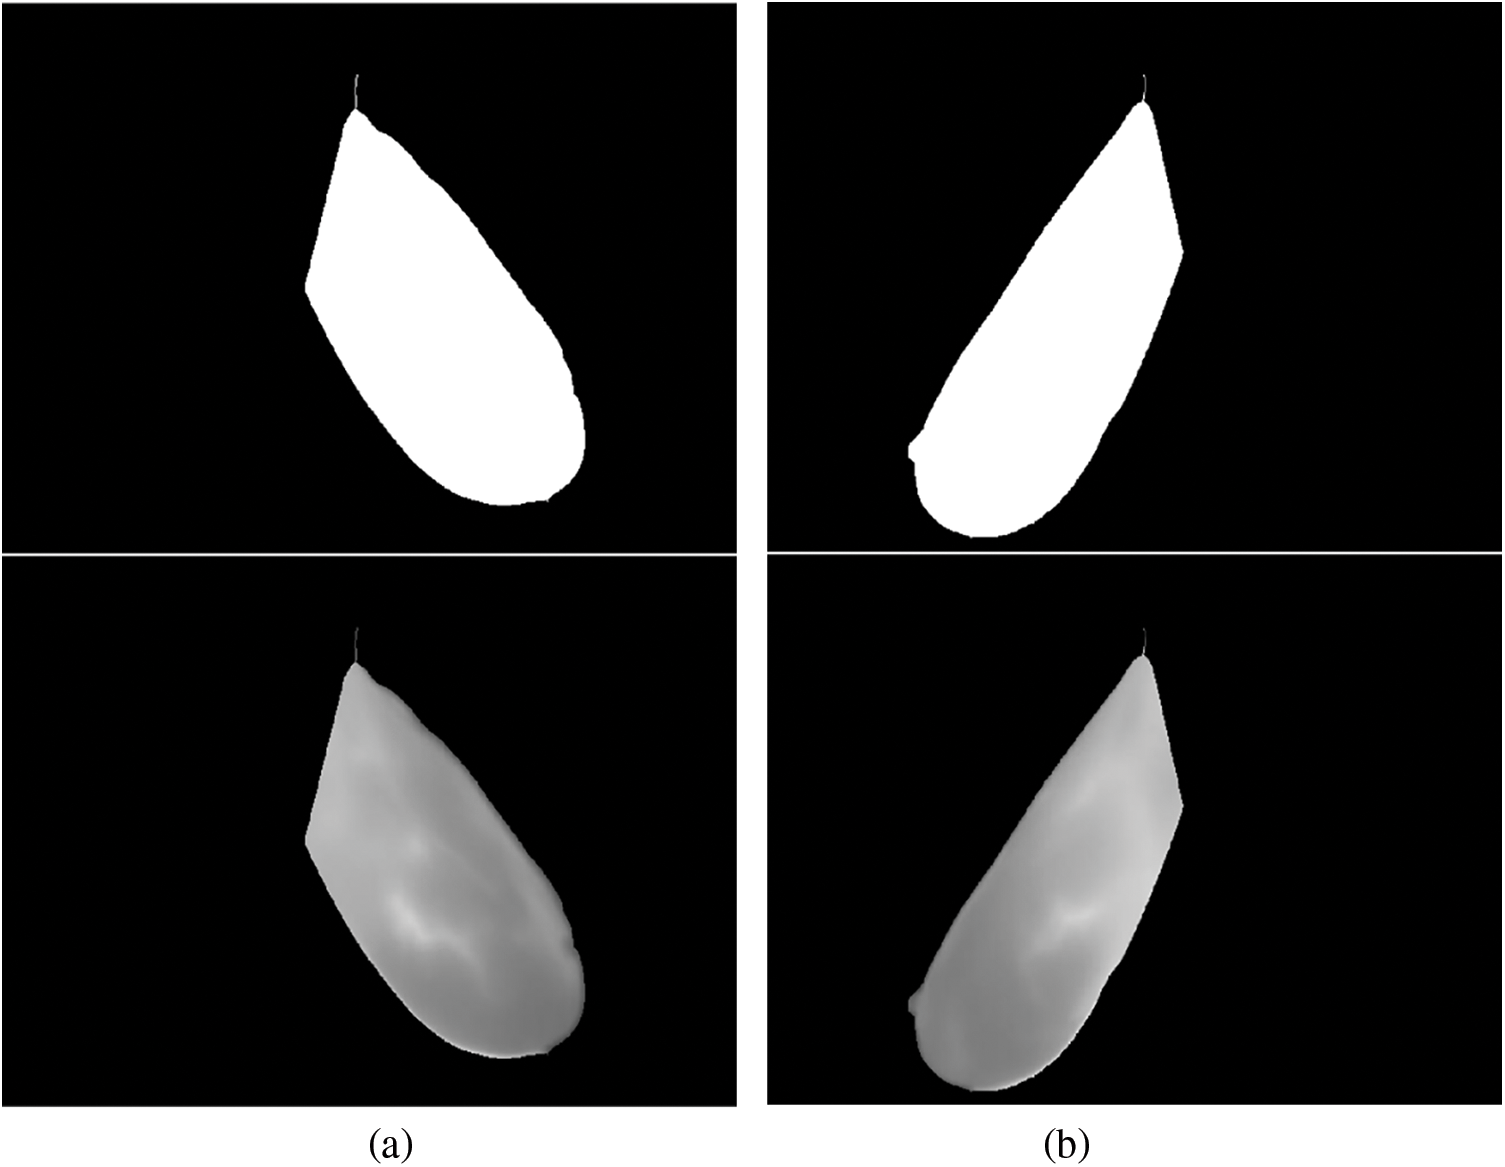
Figure 4: Generated binary masks and ROI for: (a) the right breast; (b) left breast
The segmentation steps for the right-side thermogram can be summarized as follows:
1. Read a grayscale image
2. Identify the coordinates
3. To locate the bottom breast boundary, from
4. Trace the boundary of points bounded by coordinates
5. Fit a second-degree polynomial to the points
6. Rotate the left intersection point
7. Engrave the curve onto the image
8. Perform morphological closing, dilation and imfill to form a ROI mask, as depicted in Fig. 4
9. Impose the mask onto the original image to form a ROI image
The same steps were used for the left-side segmentation but considering some coordinates opposite the right-side view.
3.3.1 Textural Feature Extraction
Texture, which characterizes the spatial organization of pixel values, plays a vital role in thermal image analysis for breast cancer detection, as it can reveal important information about disease progression [20]. The Gray Level Co-occurrence Matrix (GLCM) technique considers the spatial relationship between pixel intensities [21]. It generates a feature matrix describing the image’s texture. In this study, 26 distinct GLCM features were derived from each ROI of breast thermograms. These features, such as contrast, homogeneity, cluster shade, sum entropy, sum variance, and difference entropy, were extracted to capture the complexity and heterogeneity of breast tissue, which is crucial for cancer detection [22].
The Mutual Information (MI) approach was employed for feature selection. This technique quantifies how well a feature distinguishes between healthy and malignant cases, thus helping to identify features with low discriminative power. By eliminating these uninformative features, this can reduce the dimensionality of the feature space, potentially improving classifier performance [23]. The feature selection was performed independently for both left and right lateral thermograms using a threshold value of
To detect breast cancer, we trained two binary classifiers: a K-Nearest Neighbors (KNN) and a Multi-Layer Perceptron (MLP). These classifiers were trained on a composite feature vector, which combined textural, morphological, and statistical features extracted from the left and right breast ROIs. To optimize classifier performance, we employed a 10-fold cross-validation process on the training set (80% of the data). Hyperparameters, which are settings within the models, were adjusted during this process. Finally, the classifiers were evaluated on the remaining 20% of the test set. The effectiveness of the approach was assessed using various performance metrics: precision, accuracy, F1-score, recall, and Area Under the Curve (AUC). The best performing classifier’s results were then compared with existing literature to evaluate its effectiveness in breast cancer detection.
Fig. 5 depicts the patient’s original breast thermograms and the ROIs segmented by the proposed method. Nevertheless, the dataset used in this work does not have ground truths for validation. As a result, they were manually created. These were used to validate the method based on two image similarity metrics: Dice Index (DI) and the Jaccard Index (JI). These are widely used metrics for validating segmentation results. They directly compare a ground truth
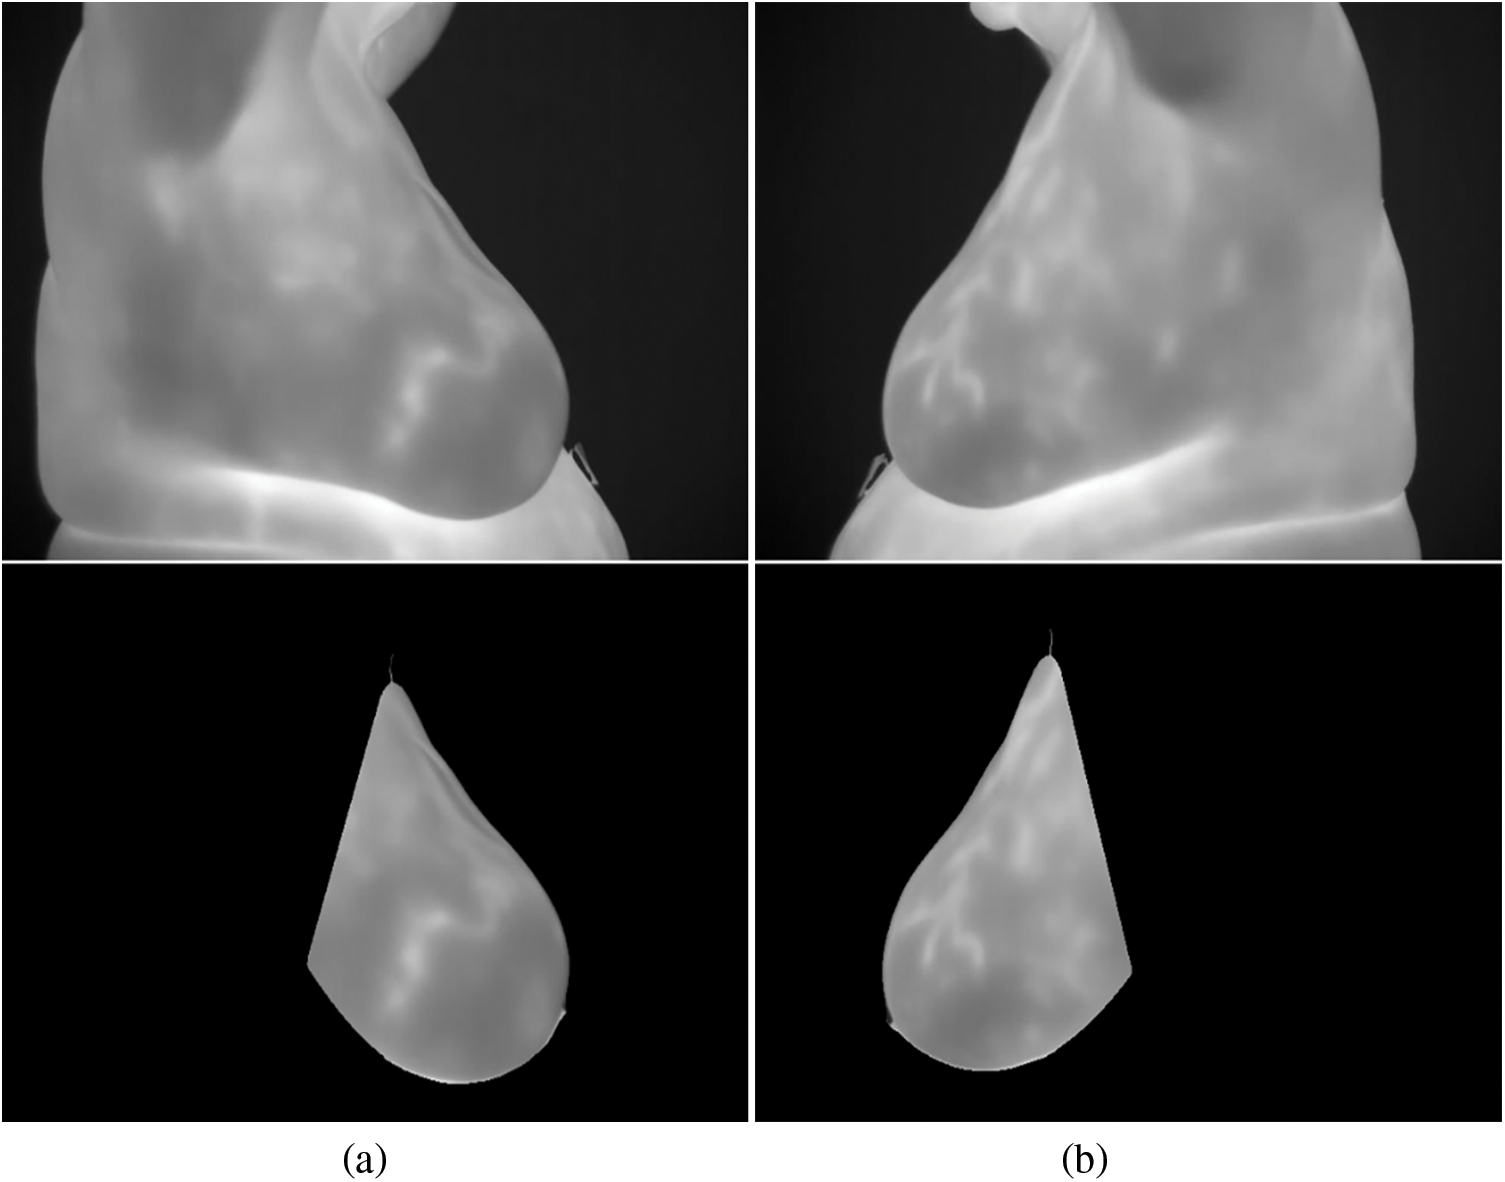
Figure 5: Segmentation results for a particular instance: (a) right breast (b) left breast
It should be noted that all of the segmented images and ground truths are compared in binary form, with white pixels representing the ROI. Fig. 6 depicts the overlap between the ground truth and the generated ROI, and the associated Jaccard and Dice scores for each case. The white region represents the True Positives (TP), the magenta region represents False Negatives (FN), the green region shows the False Positives (FP), and the black pixels for True Negatives (TN). In this instance, the TP area dominates most of the region, resulting in high Dice and Jaccard scores, signifying more similarity between the ground-truth and the segmented ROI.
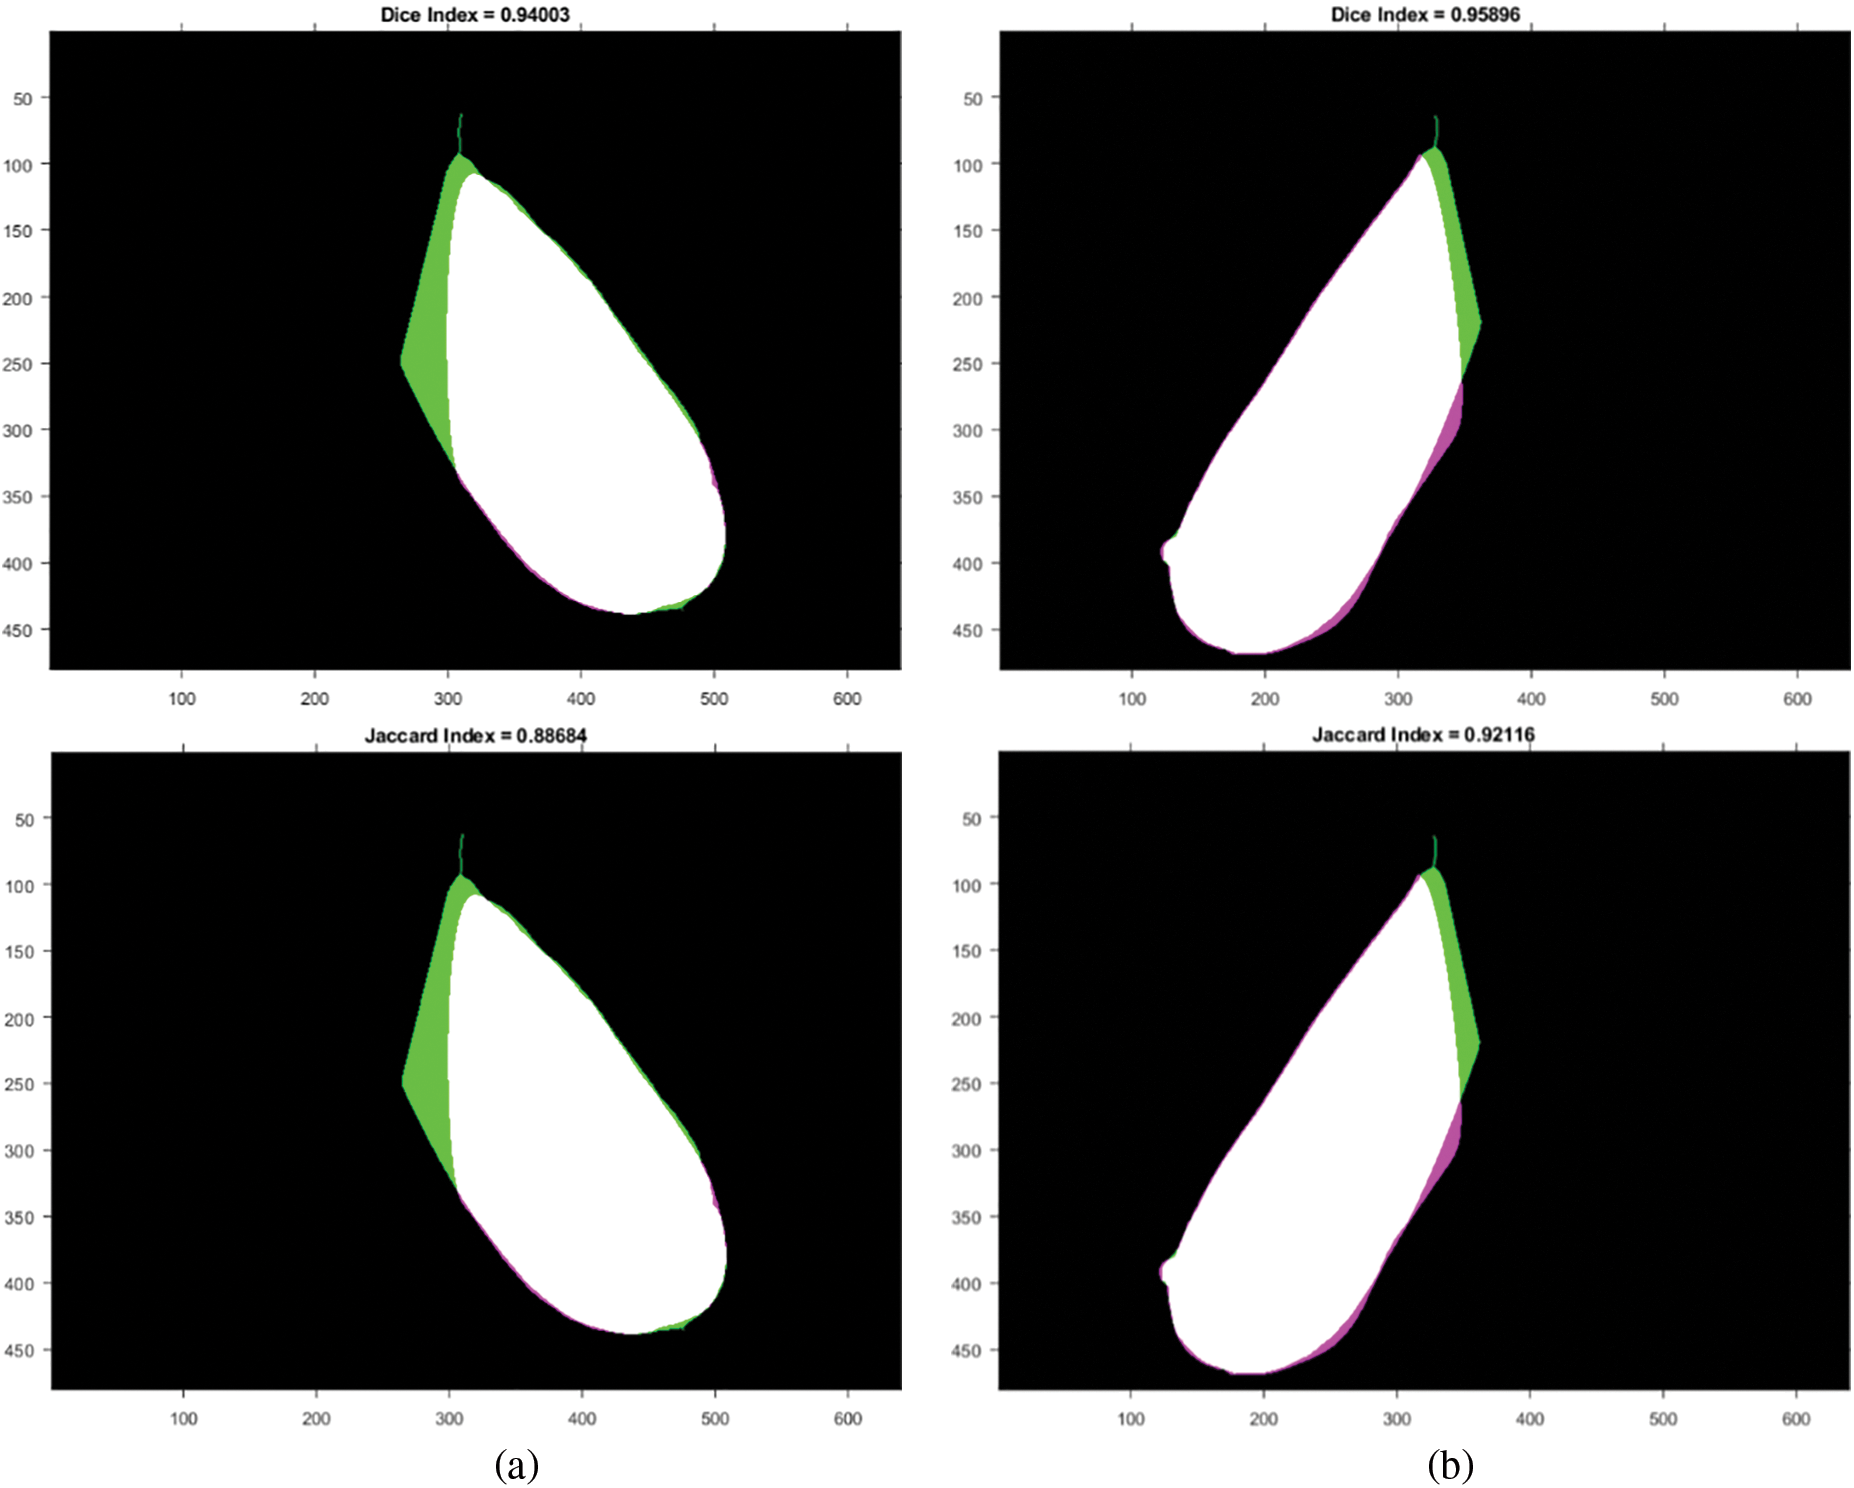
Figure 6: Similarity measures between ground-truth and generated ROI: (a) right breast and (b) left breast
The other performance metrics used in this work are sensitivity (sens), precision (prec), specificity (spec), accuracy (acc), and Matthews Correlation Coefficient (MCC), which are defined from Eqs. (7)–(12).
The approach maintained consistent performance across all metrics on both sides of the breast, as presented in Table 1.

ROIs from left and right lateral view thermograms were used for feature extraction. Each lateral view yielded 26 GLCM texture features, yielding 52 features. The MI was used to perform feature selection on each view separately. As already discussed, features with

The composite feature vector was used to train two classifiers to detect breast cancer: MLP and a KNN. The performance results for these models are summarized in Table 3. Fig. 7 depicts their ROC curves.

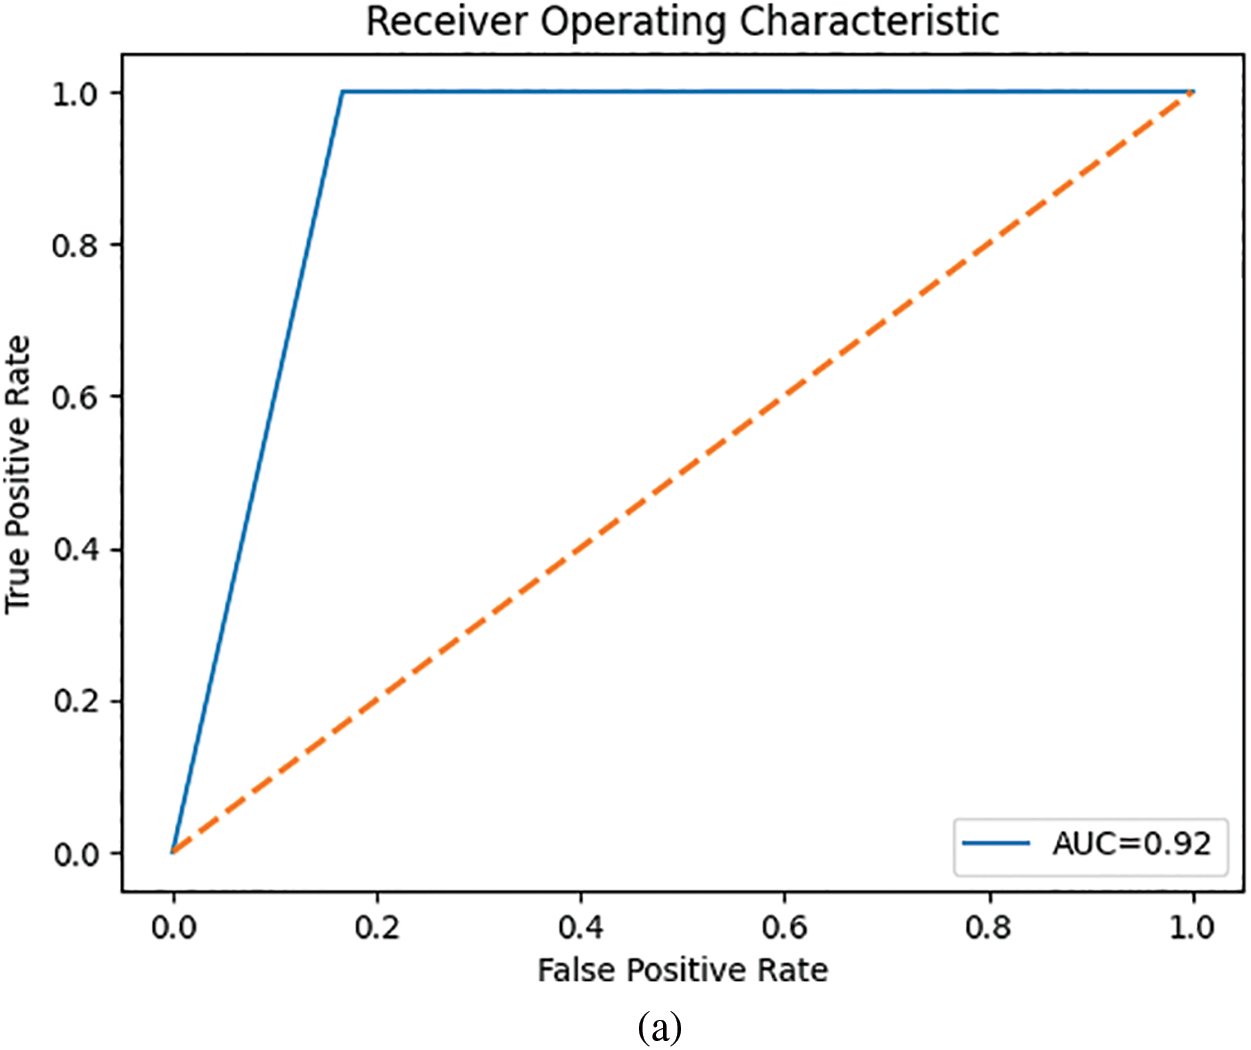
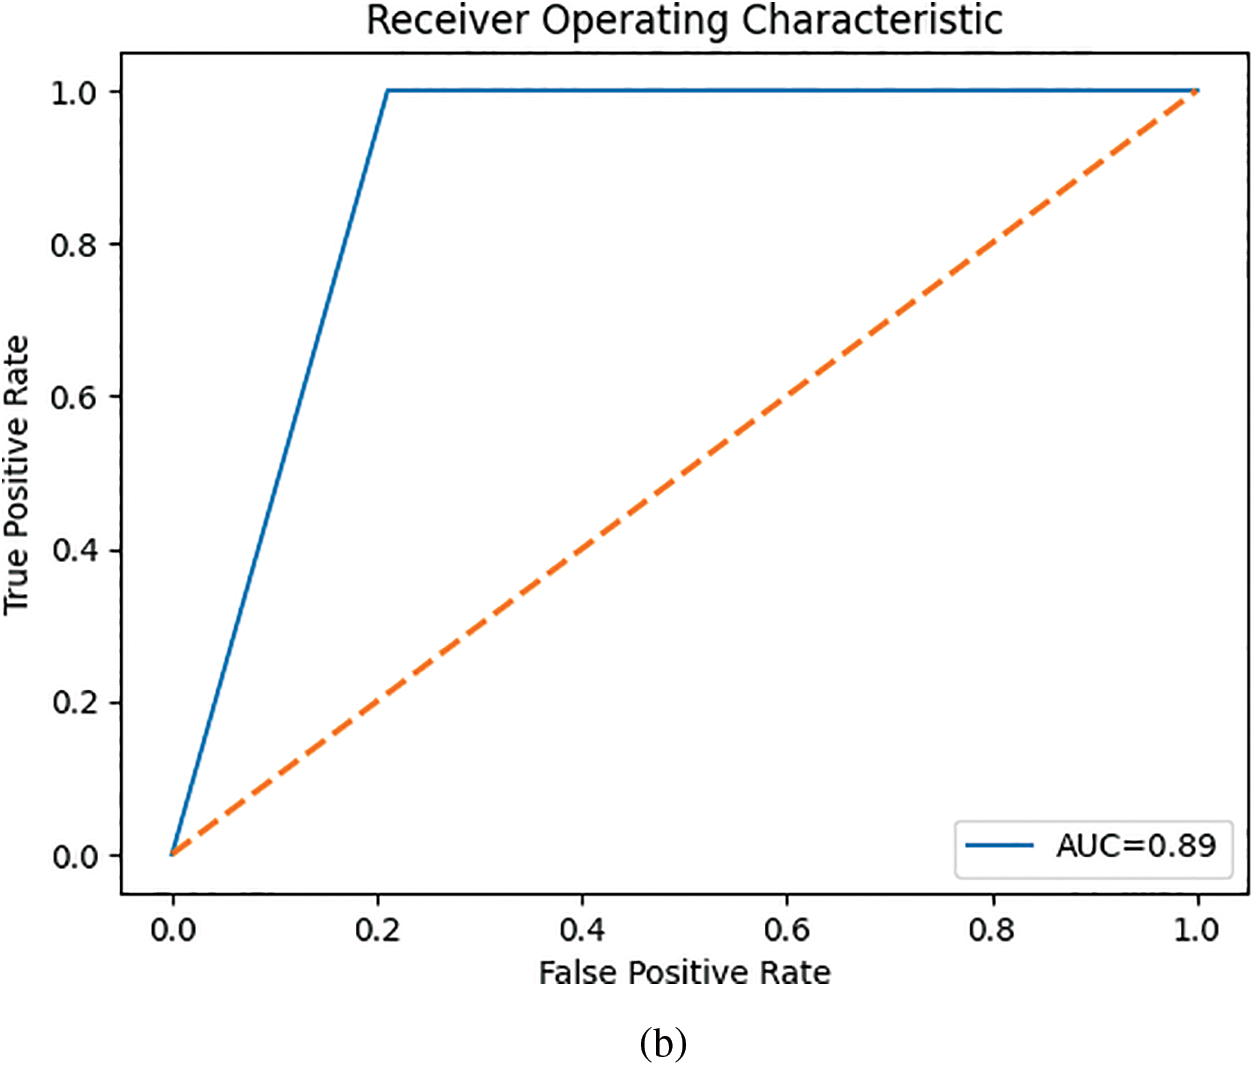
Figure 7: ROC curves for the classifiers: (a) MLP and (b) KNN
The MLP outperformed the KNN classifier.
In this study, we proposed a method for automatically segmenting and detecting breast cancer from lateral thermograms. First, ROIs were extracted from each image view. Then, manually generated ROIs were used to validate the auto-segmented ROIs based on image similarity metrics. The average similarity between the ground-truth and auto-segmented ROI based on the Jaccard index and Dice score was 86% and 92%, respectively. The model performed consistently on both left and right view thermograms. This is evidenced by the low standard deviation of the Jaccard index (left-side:
After extracting GLCM textural descriptors from the ROIs, the MI was calculated from the GLCMs of each view. This MI helped select the most significant features for differentiating between healthy and malignant tissue. As shown in Table 2, the left view thermograms offered more distinguishing features (healthy vs. malignant) compared to the right view (only nine features). These informative features from both sides were then combined into a composite feature vector for training a KNN and a MLP classifier. Table 3 summarizes the performance of the KNN and MLP models on the test set. The KNN achieved a high AUC score, indicating strong performance in identifying positive cases (malignant). However, this came at the expense of a high false negative rate (i.e., low TN), meaning it missed a significant number of actual malignant cases. This could be attributed to the class imbalance in our dataset, with more malignant cases than healthy ones. The MLP, on the other hand, outperformed the KNN across all metrics.
While the MLP outperformed the KNN across all metrics, most existing investigations, as shown in Table 4, relied on GLCM features or their derivatives (i.e., Haralick features). This is likely due to the valuable information GLCM features provide about the spatial relationships between pixels in an image. It is important to note that some related works as shown in Table 4 did not mention using feature selection. This is a crucial step in machine learning, as it reduces model complexity by selecting only the most informative features. Irrelevant features can introduce noise and lead to overfitting on the training data, ultimately increasing generalization error. Additionally, hyperparameter optimization could have further improved performance. Hyperparameters are settings within the machine learning model that can significantly influence its outcome. Despite using only lateral view thermograms, our work achieved competitive results with an accuracy of 86% and an AUC of 0.92. We believe incorporating features from the corresponding frontal thermograms could further enhance these promising results.
Overall, this work proposes a novel, non-invasive method for early breast cancer detection using thermography. By automating image segmentation and classification, it offers a complementary tool for clinicians. This automation can reduce manual workload, promote consistent and accurate results, and streamline the clinical workflow. The generated ROIs can allow radiologists to swiftly identify suspicious areas, thus facilitating faster and more accurate diagnoses. Additionally, these ROIs decrease the processing burden for classifiers by narrowing the analysis to relevant regions. Integration of this approach to other CAD systems can further empower radiologists, reduce their workload, and significantly improve diagnostic efficiency. Furthermore, the potential for self-screening with this technology paves the way for increased patient autonomy and earlier detection of breast cancer.
Accurate segmentation of the ROI in breast thermograms is crucial for effective breast cancer detection. However, achieving high accuracy in this process can be challenging. In this study, we proposed a polynomial fitting-based approach for extracting the ROI from both left and right lateral breast thermograms captured at a 90-degree angle. The method achieved high reliability, with an average Jaccard score of 87.2% and an average accuracy of 98.3%. Following segmentation, textural descriptors were extracted from the ROIs. Then the MI was employed to select the most relevant GLCM features for differentiating between healthy and malignant tissue. A combined feature vector comprising ten GLCM features from both left and right breasts was used to train KNN and MLP classifiers. The MLP classifier achieved promising results, demonstrating 80% specificity, 93% sensitivity, 90% accuracy, and an AUC of 0.85. Addressing the class imbalance in the dataset and incorporating features from frontal thermograms could potentially improve these results, as frontal views offer more additional information. Future work will explore the adoption of deep learning techniques, which can perform automatic feature extraction. Additionally, we aim to investigate the use of optimization algorithms to refine model performance and potentially reduce the dimensionality of the dataset.
Acknowledgement: The authors would like to acknowledge the support of Prince Sultan University for the payment of Article Processing Charges for this research work.
Funding Statement: This work was supported by the research grant (SEED-CCIS-2024-166); Prince Sultan University, Saudi Arabia.
Author Contributions: The authors confirm their contribution to the paper as follows: study conception and design: Dennies Tsietso, Muhammad Babar and Basit Qureshi; data collection: Ravi Samikannu; analysis and interpretation of results: Dennies Tsietso and Abid Yahya. All authors reviewed the results and approved the final version of the manuscript.
Availability of Data and Materials: The data that support the findings of this study are available from the corresponding author, Dennies Tsietso, upon reasonable request.
Ethics Approval: The study was conducted in accordance with the ethical principles outlined by the Botswana International University of Science and Technology and was approved by the Institution's Human Ethics Research Committee (Certificate HREC-004, dated 20/04/2022). Informed consent was obtained from all participants.
Conflicts of Interest: The authors declare that they have no conflicts of interest to report regarding the present study.
References
1. H. Sung et al., “Global cancer statistics 2020: GLOBOCAN estimates of incidence and mortality worldwide for 36 cancers in 185 countries,” CA Cancer J. Clin., vol. 71, no. 3, pp. 209–249, 2021. doi: 10.3322/caac.21660. [Google Scholar] [PubMed] [CrossRef]
2. M. Macedo, M. Santana, W. P. dos Santos, R. Menezes, and C. Bastos-Filho, “Breast cancer diagnosis using thermal image analysis: A data-driven approach based on swarm intelligence and supervised learning for optimized feature selection,” Appl. Soft Comput., vol. 109, Sep. 2021, Art. no. 107533. doi: 10.1016/j.asoc.2021.107533. [Google Scholar] [CrossRef]
3. S. Ahmad, S. Ur Rehman, A. Iqbal, R. K. Farooq, A. Shahid and M. I. Ullah, “Breast cancer research in Pakistan: A bibliometric analysis,” Sage Open, vol. 11, no. 3, 2021. doi: 10.1177/21582440211046934. [Google Scholar] [CrossRef]
4. A. Yousef, F. Bozkurt, and T. Abdeljawad, “Mathematical modeling of the immune-chemotherapeutic treatment of breast cancer under some control parameters,” Adv. Differ. Equ., vol. 2020, 2020, Art. no. 696. doi: 10.1186/s13662-020-03151-5. [Google Scholar] [CrossRef]
5. F. B. Yousef, A. Yousef, T. Abdeljawad, and A. Kalinli, “Mathematical modeling of breast cancer in a mixed immune-chemotherapy treatment considering the effect of ketogenic diet,” Eur. Phys. J. Plus, vol. 135, no. 12, 2020, Art. no. 952. doi: 10.1140/epjp/s13360-020-00991-8. [Google Scholar] [CrossRef]
6. A. -K. Vranso West et al., “Division induced dynamics in non-invasive and invasive breast cancer,” Biophys J., vol. 112, no. 3, 2017, Art. no. 123A. doi: 10.1016/j.bpj.2016.11.687. [Google Scholar] [CrossRef]
7. S. Sapate, S. Talbar, A. Mahajan, N. Sable, S. Desai and M. Thakur, “Breast cancer diagnosis using abnormalities on ipsilateral views of digital mammograms,” Biocybern. Biomed. Eng., vol. 40, no. 1, pp. 290–305, 2020. doi: 10.1016/j.bbe.2019.04.008. [Google Scholar] [CrossRef]
8. M. J. Yaffe and J. G. Mainprize, “Risk of radiation-induced breast cancer from mammographic screening,” Radiology, vol. 258, no. 1, pp. 98–105, 2011. doi: 10.1148/radiol.10100655. [Google Scholar] [PubMed] [CrossRef]
9. A. A. Khan and A. S. Arora, “Thermography as an economical alternative modality to mammography for early detection of breast cancer,” J. Healthc. Eng., vol. 2021, no. 6, pp. 1–8, 2021. doi: 10.1155/2021/5543101. [Google Scholar] [PubMed] [CrossRef]
10. A. Lubkowska and M. Chudecka, “Thermal characteristics of breast surface temperature in healthy women,” Int. J. Environ. Res. Public Health, vol. 18, no. 3, pp. 1–11, 2021. doi: 10.3390/ijerph18031097. [Google Scholar] [PubMed] [CrossRef]
11. J. Amin, M. Sharif, S. L. Fernandes, S. -H. Wang, T. Saba and A. R. Khan, “Breast microscopic cancer segmentation and classification using unique 4-qubit-quantum model,” Microsc. Res. Tech., vol. 85, no. 5, pp. 1926–1936, 2022. doi: 10.1002/jemt.24054. [Google Scholar] [PubMed] [CrossRef]
12. H. G. Zadeh, J. Haddadnia, O. R. Seryasat, and S. M. M. Isfahani, “Segmenting breast cancerous regions in thermal images using fuzzy active contours,” EXCLI J., vol. 15, pp. 532–550, Aug. 2016. doi: 10.17179/excli2016-273. [Google Scholar] [PubMed] [CrossRef]
13. V. Madhavi and C. B. Thomas, “Multi-view breast thermogram analysis by fusing texture features,” Quant. Infrared Thermogr. J., vol. 16, no. 1, pp. 111–128, Jan. 2019. doi: 10.1080/17686733.2018.1544687. [Google Scholar] [CrossRef]
14. M. A. Díaz-Cortés et al., “A multi-level thresholding method for breast thermograms analysis using Dragonfly algorithm,” Infrared Phys. Technol., vol. 93, no. 4, pp. 346–361, Sep. 2018. doi: 10.1016/j.infrared.2018.08.007. [Google Scholar] [CrossRef]
15. P. Kapoor, S. V. A. V. Prasad, and S. Patni, “Image segmentation and asymmetry analysis of breast thermograms for tumor detection,” Int. J. Comput. Appl., vol. 50, no. 9, pp. 40–45, 2012. doi: 10.5120/7803-0932. [Google Scholar] [CrossRef]
16. N. Venkatachalam, L. Shanmugam, G. C. Heltin, G. Govindarajan, and P. Sasipriya, “Enhanced segmentation of inflamed ROI to improve the accuracy of identifying benign and malignant cases in breast thermogram,” J. Oncol., vol. 2021, no. 3, pp. 1–17, 2021. doi: 10.1155/2021/5566853. [Google Scholar] [PubMed] [CrossRef]
17. L. F. Silva et al., “A new database for breast research with infrared image,” J. Med. Imaging Health Inform., vol. 4, no. 1, pp. 92–100, 2014. doi: 10.1166/jmihi.2014.1226. [Google Scholar] [CrossRef]
18. D. Kusnik and B. Smolka, “Robust mean shift filter for mixed Gaussian and impulsive noise reduction in color digital images,” Sci. Rep., vol. 12, no. 1, pp. 1–24, 2022. doi: 10.1038/s41598-022-19161-0. [Google Scholar] [PubMed] [CrossRef]
19. M. Kalbasi and H. Nikmehr, “Noise-robust, reconfigurable Canny edge detection and its hardware realization,” IEEE Access, vol. 8, pp. 39934–39945, 2020. doi: 10.1109/ACCESS.2020.2976860. [Google Scholar] [CrossRef]
20. M. H. Bharati, J. J. Liu, and J. F. MacGregor, “Image texture analysis: Methods and comparisons,” Chemometr. Intell. Lab. Syst., vol. 72, no. 1, pp. 57–71, 2004. doi: 10.1016/j.chemolab.2004.02.005. [Google Scholar] [CrossRef]
21. MathWorks, “Texture analysis using the gray-level co-occurrence matrix (GLCM),” Accessed: Jan. 24, 2024. [Online]. Available: https://www.mathworks.com/ [Google Scholar]
22. Y. Wang, X. Liao, F. Xiao, H. Zhang, J. Li and M. Liao, “Magnetic resonance imaging texture analysis in differentiating benign and malignant breast lesions of breast imaging reporting and data system 4: A preliminary study,” J. Comput. Assist. Tomogr., vol. 44, no. 1, pp. 83–89, 2020. doi: 10.1097/RCT.0000000000000969. [Google Scholar] [PubMed] [CrossRef]
23. P. Gupta, D. Doermann, and D. DeMenthon, “Beam search for feature selection in automatic SVM defect classification,” in 2002 Int. Conf. Pattern Recogniti., Quebec City, QC, Canada, 2002, pp. 212–215. doi: 10.1109/ICPR.2002.1048275. [Google Scholar] [CrossRef]
24. S. Pramanik, D. Bhattacharjee, and M. Nasipuri, “MSPSF: A multi-scale local intensity measurement function for segmentation of breast thermogram,” IEEE Trans. Instrum. Meas., vol. 69, no. 6, pp. 2722–2733, 2020. doi: 10.1109/TIM.2019.2925879. [Google Scholar] [CrossRef]
25. S. Pramanik, S. Ghosh, D. Bhattacharjee, and M. Nasipuir, “Segmentation of breast-region in breast thermogram using arc-approximation and triangular-space search,” IEEE Trans. Instrum. Meas., vol. 69, no. 7, pp. 4785–4795, 2020. doi: 10.1109/TIM.2019.2956362. [Google Scholar] [CrossRef]
26. S. Tello-Mijares, F. Woo, and F. Flores, “Breast cancer identification via thermography image segmentation with a gradient vector flow and a convolutional neural network,” J. Healthc. Eng., vol. 2019, pp. 1–13, 2019. doi: 10.1155/2019/9807619. [Google Scholar] [PubMed] [CrossRef]
27. G. Sayed, M. Soliman, and A. Hassanien, “Bio-inspired swarm techniques for thermogram breast cancer detection,” in Med. Imaging Clin. Appl.: Algorithmic Comput.-Based Approaches, Cham, Springer International Publishing, 2016, pp. 487–506. doi: 10.1007/978-3-319-33793-7_21. [Google Scholar] [CrossRef]
28. D. Sathish, S. Kamath, K. Prasad, and R. Kadavigere, “Role of normalization of breast thermogram images and automatic classification of breast cancer,” Vis. Comput., vol. 35, no. 1, pp. 57–70, Apr. 2019. doi: 10.1007/s00371-017-1447-9. [Google Scholar] [CrossRef]
Cite This Article
 Copyright © 2024 The Author(s). Published by Tech Science Press.
This work is licensed under a Creative Commons Attribution 4.0 International License , which permits unrestricted use, distribution, and reproduction in any medium, provided the original work is properly cited.


 Submit a Paper
 Propose a Special lssue
 View Full Text
 Download PDF
 Downloads
 Citation Tools