
 Submit a Paper
 Propose a Special lssue
 Open Access
ARTICLE

Optimizing Bucket Elevator Performance through a Blend of Discrete Element Method, Response Surface Methodology, and Firefly Algorithm Approaches
Department of Materials Handling and Logistics Engineering, Faculty of Engineering, King Mongkut’s University of Technology North Bangkok, Bangkok, 10800, Thailand
* Corresponding Author: Supattarachai Sudsawat. Email:
Computers, Materials & Continua 2024, 80(2), 3379-3403. https://doi.org/10.32604/cmc.2024.054337
Received 25 May 2024; Accepted 24 July 2024; Issue published 15 August 2024
 View Full Text
 Download PDF
Abstract
This research introduces a novel approach to enhancing bucket elevator design and operation through the integration of discrete element method (DEM) simulation, design of experiments (DOE), and metaheuristic optimization algorithms. Specifically, the study employs the firefly algorithm (FA), a metaheuristic optimization technique, to optimize bucket elevator parameters for maximizing transport mass and mass flow rate discharge of granular materials under specified working conditions. The experimental methodology involves several key steps: screening experiments to identify significant factors affecting bucket elevator operation, central composite design (CCD) experiments to further explore these factors, and response surface methodology (RSM) to create predictive models for transport mass and mass flow rate discharge. The FA algorithm is then applied to optimize these models, and the results are validated through simulation and empirical experiments. The study validates the optimized parameters through simulation and empirical experiments, comparing results with DEM simulation. The outcomes demonstrate the effectiveness of the FA algorithm in identifying optimal bucket parameters, showcasing less than 10% and 15% deviation for transport mass and mass flow rate discharge, respectively, between predicted and actual values. Overall, this research provides insights into the critical factors influencing bucket elevator operation and offers a systematic methodology for optimizing bucket parameters, contributing to more efficient material handling in various industrial applications.Keywords
Nomenclature
| Distance of poles (m) | |
| g | Gravitational acceleration (m/s2) |
| Radius circumscribed by bucket outer edge (m) | |
| Radius circumscribed by bucket inner edge (m) | |
| Distance of mass point center of gravity projection (m) | |
| Distance of mass point center of gravity projection (rad/s) | |
| The velocity of particles at the discharge point (m/s) | |
| Centrifugal force acting on the contents of the bucket (N) |
Bucket elevators are devices designed for the uninterrupted conveyance of bulk materials to precise destinations under specified circumstances. They are comprised of a variable quantity of buckets affixed to a moving belt or chain, which transfers motion to the buckets [1]. These elevators find application across diverse industries including agriculture, food processing, pharmaceuticals, mining, and more [2]. Despite the apparent simplicity of their operation, investigating the movement of granular materials demands the utilization of advanced numerical methods to address materials handling challenges [1]. The initial designs of modern buckets were primarily utilized for moving and releasing granular substances at slow speeds, typically relying on gravity for discharge. In this setup, materials were poured into a designated area due to gravitational forces, but this method had limitations in terms of the quantity and distance of material transport [3]. Experiments revealed that the behavior of the granules resembled that of a viscous fluid, leading to the adoption of straightforward bucket shapes aimed at maximizing material volume. However, the necessity to enhance both volume and distance necessitated an increase in operational speed, prompting the development of discharge mechanisms reliant on centrifugal force. This transition made the mechanics of discharge more complex, demanding precise analytical tools to understand the material’s behavior within the bucket. Recent studies have led to the development of bucket conveyors across different dimensions.
The primary research team prioritized design parameters aimed at achieving optimal performance and efficient material handling [2,4–7]. For instance, the Engineer-to-Order approach is employed alongside a mathematical model for designing bucket shapes, aiming to optimize the creation of new and appropriate buckets suitable for high-speed transportation of bulk materials [4]. Finite Element Method (FEM) analysis is utilized to address the challenges associated with the bucket chain elevator used for handling large lumps in large tunnel manufacturing. The outcomes show a reduction in wear on the main chain and sprocket, along with a decrease in vibration occurrences within the bucket chain elevator [5]. A design methodology has been developed to address bucket-to-bucket interference in chain bucket elevators. This process involves resolving constraint equations using Matlab software, focusing on the inflection points of the bucket and its boundary contour at the discharge position. The outcomes demonstrate improved performance with complete discharge and maximum loading capacity of the bucket [2]. Additionally, research has delved into the relationship between power, bucket speed, bucket elevator capacity, and the slope angle of the bucket elevator. These studies incorporate experiments with both palm oil and cowpea seeds, offering relevant parameters for speed, the operational slope angle of the bucket, power consumption, and the efficient performance of mass flow rate [6,7].
The second research group dedicated their efforts to conducting tolerance analyses that affected various components of the bucket elevator. For example, certain studies utilized finite element analysis to assess stress and deformation effects on the bucket, aiming to refine its design and explore alternative options. These investigations revealed the relationship between bucket geometries and stress and deflection effects [8–10]. Another study specifically examined failures of bucket elevator shafts during both operational and design phases, employing the FEA method to design the head shaft of the bucket elevator. These findings emphasized the effectiveness of the Finite Element Analysis method in ensuring optimal performance design by evaluating fatigue strength, a critical concern in shaft failures [11]. Additionally, other studies delved into stress analysis in chain bucket elevators. In one such study, topology optimization was utilized to develop a new chain, with the aim of reducing failures in conveyor chain links. The results demonstrated that the new chain design increased stress tolerance in the beam and lever by 36% and 47%, respectively [12]. Another research endeavor focused on investigating shaft failures of bucket elevator shafts in chain bucket elevators, particularly under conditions of jerky loading. This investigation provided insights into the causes of failure occurrences, which often included welded regions and misaligned counterweights of the shaft [13]. The following research group centered its efforts on studying operational control. They utilized sensor systems and contemporary software packages to oversee the operations of bucket elevators, with the goal of extending their operational lifespan and decreasing power consumption. Moreover, these tools facilitated the identification of diagnostic signals prior to the onset of failures [14–16]. Furthermore, research has extended beyond machine and operational parameters to address the quality of bulk material mixing and handling. For instance, the carry-over phenomenon on bucket elevators was investigated by studying microtracer deposit behavior during tracer batch passage and subsequent collection. It was emphasized that analyzing deposition and gathering phases separately is essential, revealing that approximately 20% of the initial microtracer mass is deposited during tracer batch passage, with around 32% picked up during collector batch passage. In both cases, the majority of the microtracer is concentrated in the elevator foot and head [15]. Another study aimed to identify operational issues in bucket elevator loading and unloading processes that could cause seed damage. By analyzing and evaluating factors affecting grain damage rates, the research aimed to enhance safety during these processes, consequently reducing crop losses. This analysis holds practical significance for the agricultural sector, facilitating the identification of operational challenges and the development of mitigation measures, thereby improving work efficiency and seed grain quality [16].
The latest research group has employed numerical methods to address both the design and operation of bucket elevators. Specifically, they utilized the discrete element method (DEM) to tackle discharge profiles in bucket elevator operations, recognizing its significance as a key characteristic in bulk material handling [17–20]. Their findings consistently highlight the effectiveness of DEM simulations in optimizing machine parameters for bucket elevators. These simulations can recommend suitable parameters such as belt velocity, bucket angular velocity, and bucket shape tailored to specific material handling needs. Moreover, another study merged DEM with discontinuous deformation analysis (DDA) to enhance bucket shape profiles, aiming to maximize transport distance and minimize remaining materials in the bucket. This approach is deemed valuable for designing the most efficient bucket shapes under various working conditions [1]. Additionally, there’s research that reconfigured the bulk material dimension model (quasi-2-D, 5.6 d) for DEM simulation, thereby validating bucket elevator operations. By doing so, they managed to significantly reduce simulation time and streamline the design process by up to 70% compared to using actual bulk material dimensions [21].
After reviewing existing literature, no research efforts were found aimed at enhancing bucket elevator design and operation through metaheuristic optimization algorithms. Recent studies utilizing metaheuristic optimization algorithms in engineering and industrial applications show their effectiveness in optimizing complex systems. For example, in mechanical engineering, a study used Particle Swarm Optimization (PSO) to identify the mechanical parameters of a Two-Mass electric drive system with flexible couplings. Resonant frequencies and mechanical parameters were estimated via Frequency Response Function (FRF) analysis and validated experimentally, demonstrating the PSO method’s effectiveness [22]. Additionally, Genetic Algorithms (GA) have been used to design compliant mechanisms for following a non-linear path, integrating a Python interface with ANSYS MAPDL (Mechanical APDL) for precise modeling and optimization [23]. Moreover, the Firefly algorithm has been applied to solve unequal facility layout problems, illustrating its versatility and robustness in engineering applications [24]. These examples highlight the broad applicability and success of metaheuristic algorithms in diverse engineering contexts, underscoring their potential in optimizing bucket elevator design parameters as explored in this research. Therefore, this article introduces and validates the combination of the discrete element method (DEM) with the design experiment method (DOE), complemented by the use of a firefly algorithm (FA), a metaheuristic optimization algorithm. This approach offers an alternative analysis of bucket elevators by aiming to maximize transport mass and maximize mass flow rate in the bucket. The genetic optimization algorithm is employed to optimize these aspects for a given granular material under specified working conditions. Through simulation and empirical validation, this method enables the identification of critical bucket parameters affecting granular discharge dynamics and facilitates the design of optimal bucket parameters. Section 3 outlines the experimental process, which involves identifying the main parameters affecting bucket elevator operation through DOE utilizing Response Surface Methodology (RSM) and Analysis of Variance (ANOVA). A fitness function model is then created using RSM methodology, and the FA optimization algorithm is applied to determine suitable bucket elevator operation parameters. In Section 4, the numerical results of the procedure are presented: firstly, the main factors affecting bucket elevator operation are identified through DOE and ANOVA analysis. Secondly, the RSM methodology generates a quadratic equation to serve as the fitness function for maximizing transport mass and mass flow rate discharge in the bucket. Thirdly, the FA algorithm optimizes the parameters to meet the fitness function. Section 5 showcases simulations and empirical experiments of transport mass and mass flow rate discharge using thousands of particles to compare discharge profiles between DEM simulation and experimental cases. Finally, Section 6 concludes the article by presenting optimized bucket parameters for various operational conditions and materials.
2 The Discrete Element Method Materials and Methods
The Discrete Element Method (DEM) is a computational approach employed for modeling granular flows at the individual grain level, offering significant potential as an optimization tool in various industries dealing with granular materials. At each computational iteration, DEM tracks every discrete particle in the system, computing the forces between particles as well as between particles and boundaries. A contact force model is applied for each collision, with multiple models of varying complexities available. However, it remains uncertain whether a more intricate, and thus computationally demanding, force model is necessary at the particle level to precisely predict the behavior of extensive particle assemblies. Therefore, the Hertz-Mindlin contact model is adopted for particle interactions in DEM simulations, which includes both elastic and damping components for normal and tangential forces. Eq. (1) presents the formula governing the contact forces in the normal direction (Fe) [25,26].
Eqs. (2) and (3) can be inserted into Eq. (1), where
The tangential contact force
Eqs. (6) and (7) can be incorporated into Eq. (5), where
The symbol
3 Materials and Machine Experiment
Fig. 1a,b depicts the geometric characteristics of polypropylene and soybean particles, as detailed by Sudsawat et al.’s research [25,26]. Their dimensions were assessed using a Vernier caliper, with 100 random samples measured. The mass of particles was determined by weighing 200 polypropylene and soybean particles on a precise digital scale [27]. To create the DEM model for both polypropylene and soybeans, EDEM software from DEM Solutions Ltd., in Edinburgh, UK, was employed to generate a single sphere. The material properties of the DEM model are presented in Table 1, drawing on material parameter properties from the aforementioned references [25,26].
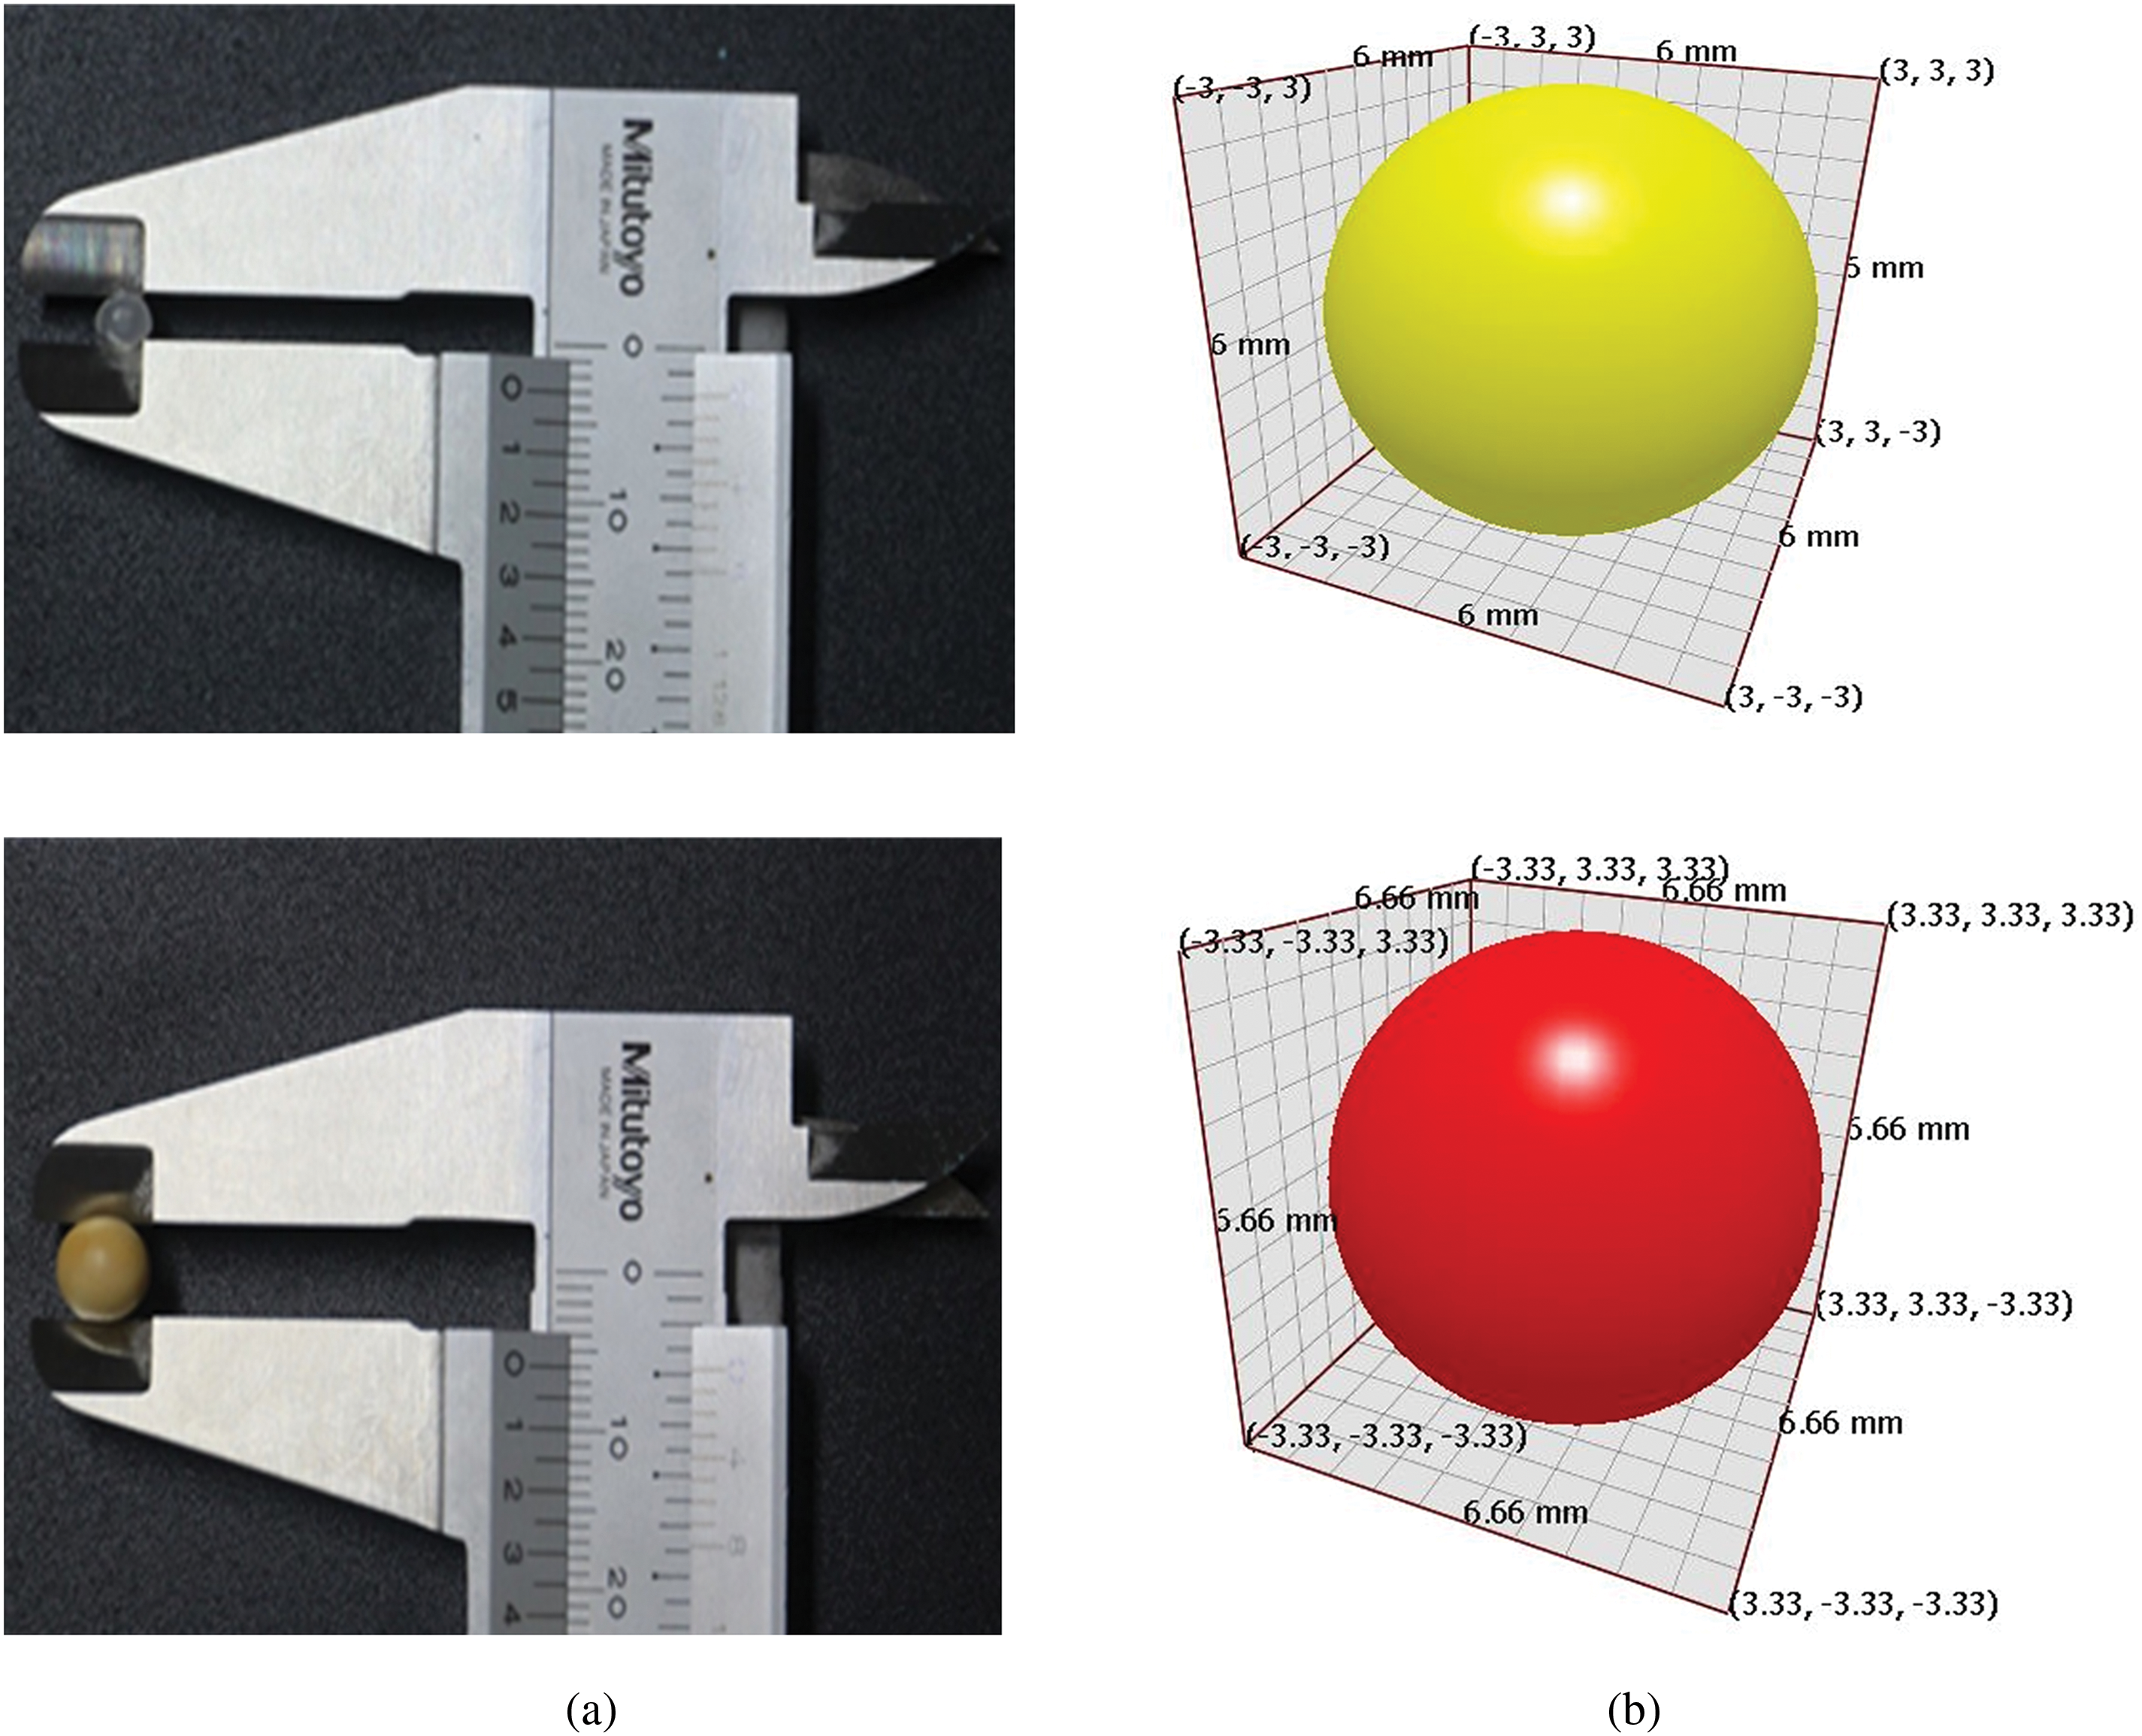
Figure 1: The DEM models for polypropylene and soybean grains. (a) Shows the dimensions of polypropylene and soybean grains measured using a Vernier caliper. (b) Depicts the DEM models of polypropylene and soybean grains, with particle diameters of 6 and 6.66 mm, respectively, as indicated in references [25,26]
In this research, the bucket elevator was utilized to validate the results as depicted in Fig. 2. The bucket elevator consists of several key components: the head section, which includes the head pulley and cover; the buckets, made of steel, used for conveying materials; the boot section, located at the bottom of the elevator, which allows easy adjustment of the take-ups for the tail pulley; the feed chute section, which serves as the inlet for feeding bulk materials; and the discharge section, a crucial part of the system, responsible for handling and transferring bulk materials to other parts of the material handling system.
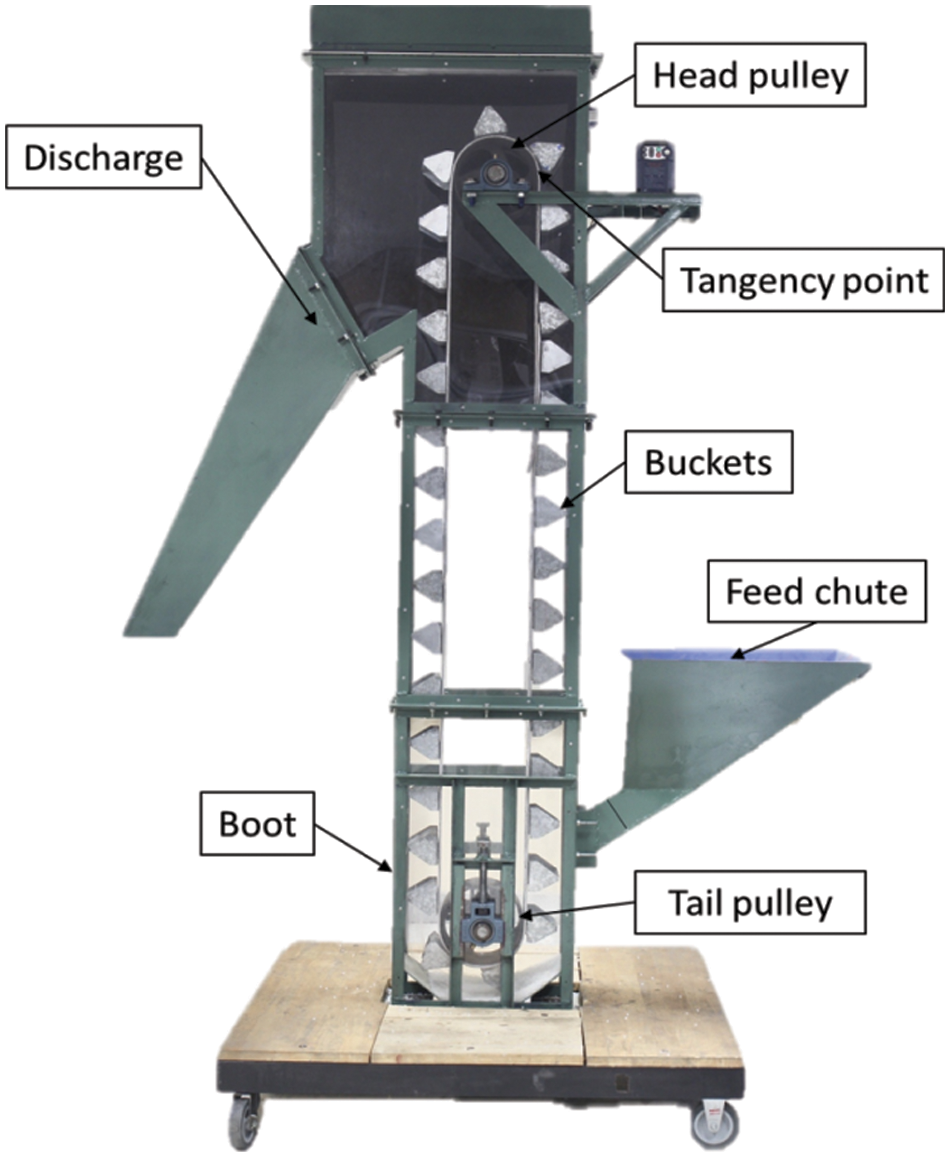
Figure 2: Bucket elevator
The computational complexity of the algorithms proposed in this study encompasses multiple stages and methodologies, including Discrete Element Method (DEM) simulations, Response Surface Methodology (RSM), and the Firefly Algorithm (FA) for optimization. DEM simulations involve intensive computation due to the modeling and tracking of interactions among numerous particles, typically expressed as O(nlogn), where n denotes the number of simulated particles. This complexity leverages efficient data structures like spatial grids to manage interactions, though it can escalate to O(n2) under certain conditions, mitigated by neighbor search algorithms. Response Surface Methodology (RSM) constructs predictive models from simulation data, with computational complexity O(k3), dependent on the number k of factors and the volume of experiments. This arises from polynomial fitting and regression operations, which involve matrix manipulations of cubic complexity. The Firefly Algorithm (FA), a metaheuristic for optimization, scales with O(nf⋅ni⋅d), where nf is the number of fireflies, ni is the iterations, and d is the problem’s dimensionality. This algorithm’s complexity derives from pairwise comparisons and movements between fireflies, influenced by the problem’s dimensional complexity. Integrating these methods yields an overall computational complexity of O(nlogn) + O(k3) + O(nf⋅ni⋅d). The dominant term varies based on specific parameter settings: for instance, DEM simulations dominate with high particle counts, RSM with numerous factors, and FA with extensive optimization tasks. Managing computational costs through parallel computing and optimized algorithms is crucial for maintaining efficiency across all stages.
The research methodology can be succinctly outlined as a step-by-step process, depicted in Fig. 3. Initially, an experimental orthogonal array is crafted through screening factor processes using the Plackett-Burmann method and EDEM simulation to identify significant factors [25]. Following this, a central composite design (CCD) is formulated to encapsulate all factors influencing the maximization of transport mass and mass flow rate discharge via EDEM simulation. The computational elements’ time step for polypropylene and soybean grains is determined using the Rayleigh method [28], resulting in time steps of 8.34 and 12.3 μs, respectively. Subsequently, a predictive model is constructed using response surface methodology (RSM), which is then employed in the Firefly Algorithm (FA) to optimize the transport mass and mass flow rate discharge. The next phase involves comparing the results obtained from the FA algorithms with those from exact experimental tests to determine the optimal transport mass and mass flow rate discharge through laboratory testing with a bucket elevator, as depicted in Fig. 3. Additionally, velocity profiles of the most promising simulations are analyzed in comparison with empirical tests.
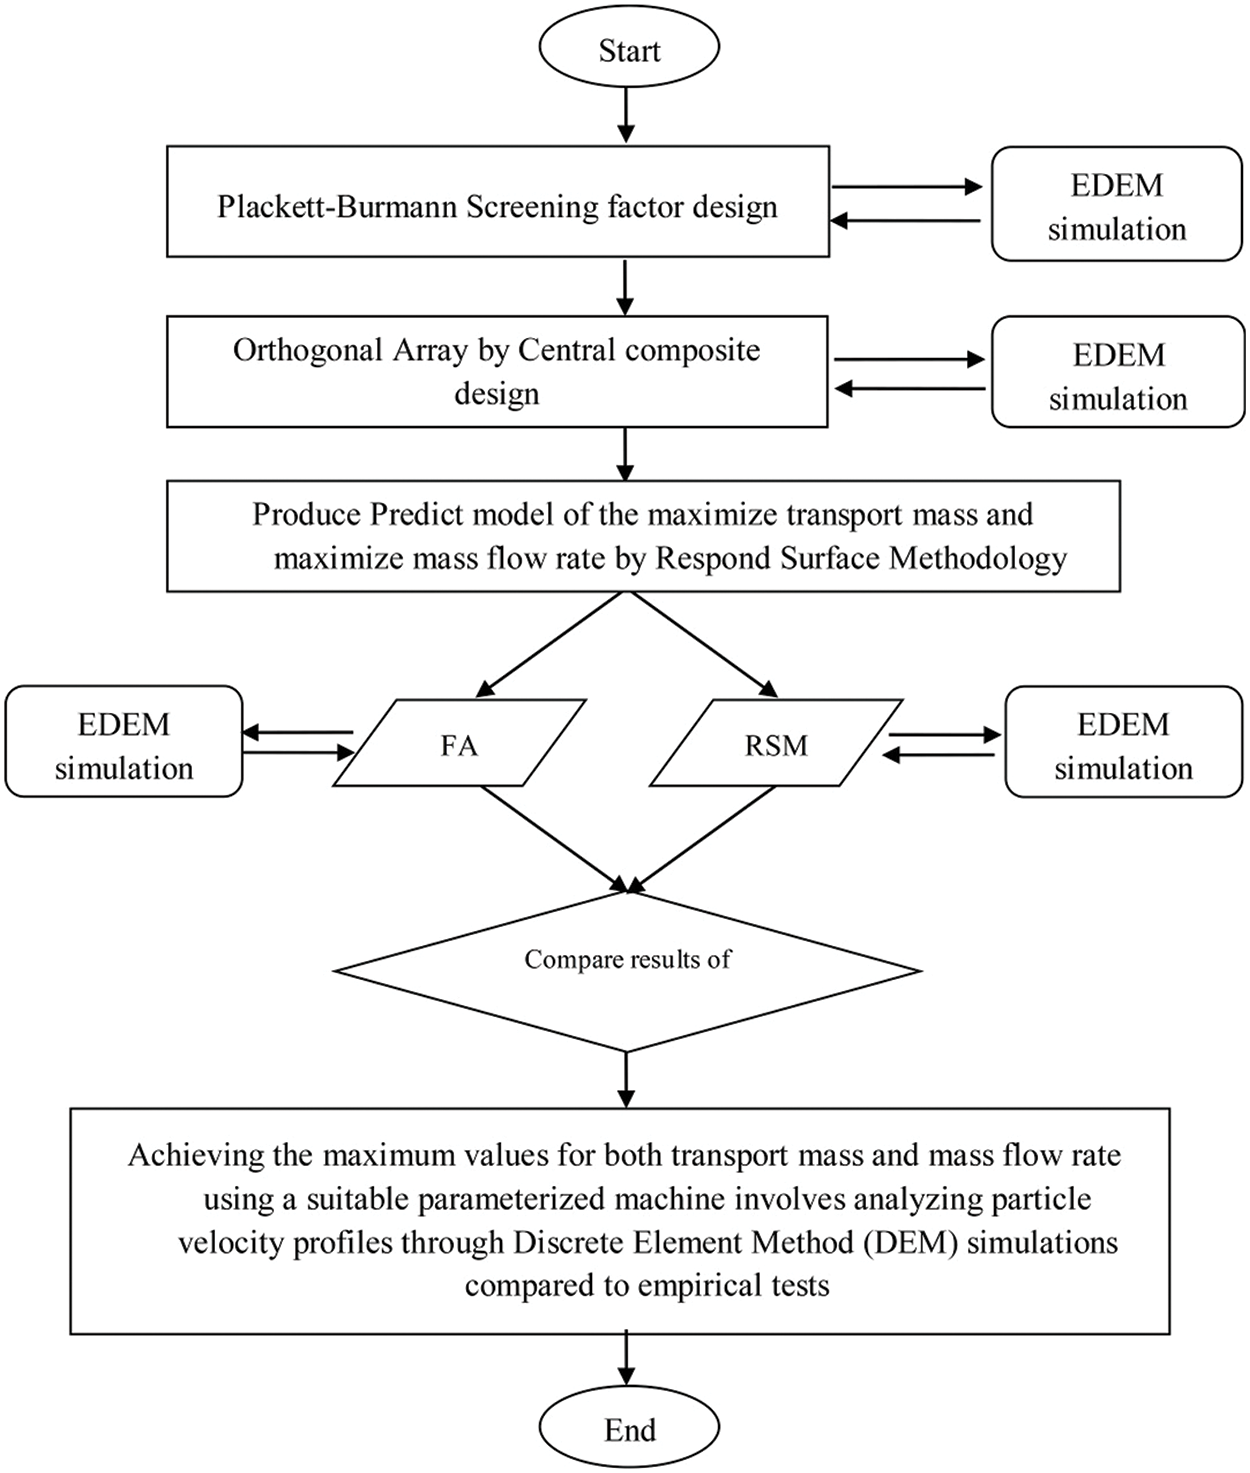
Figure 3: Flow chart of methodology
4.1 Plackett-Burmann Screening Experiment of Process Parameters
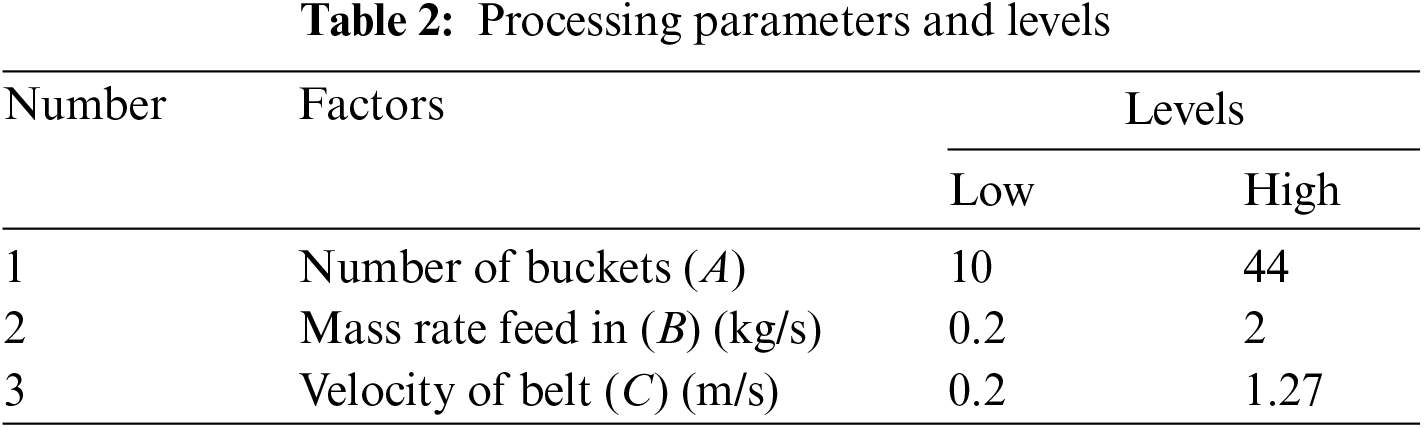
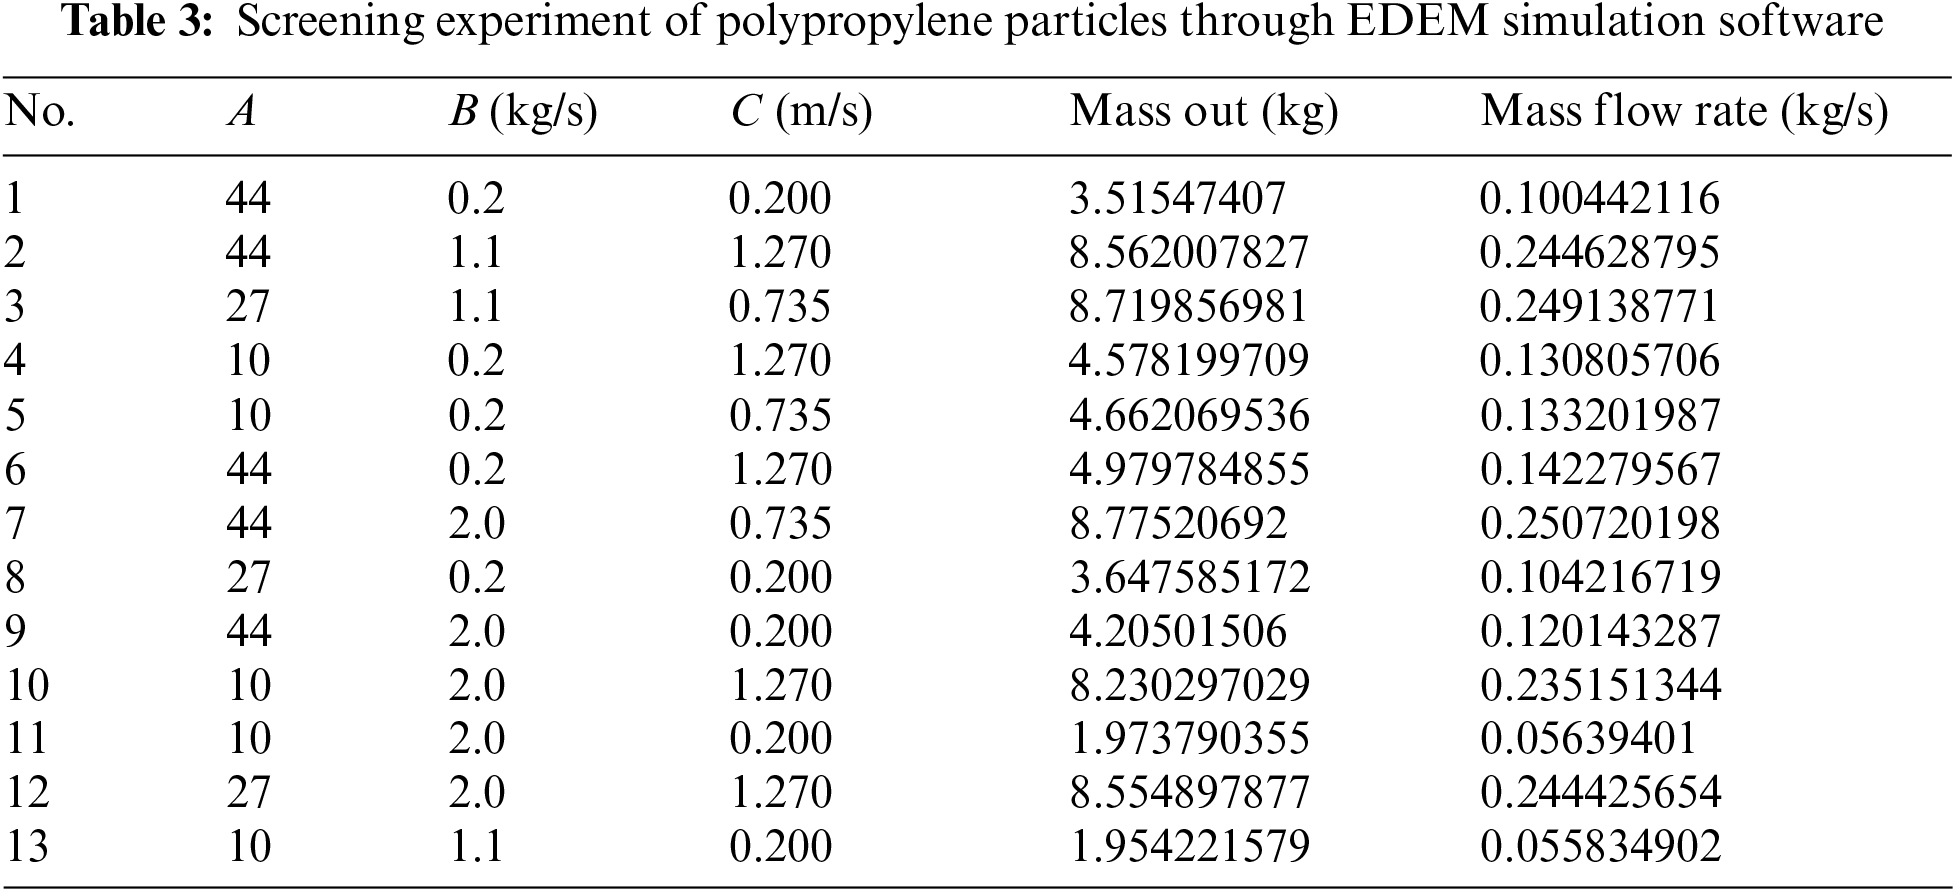
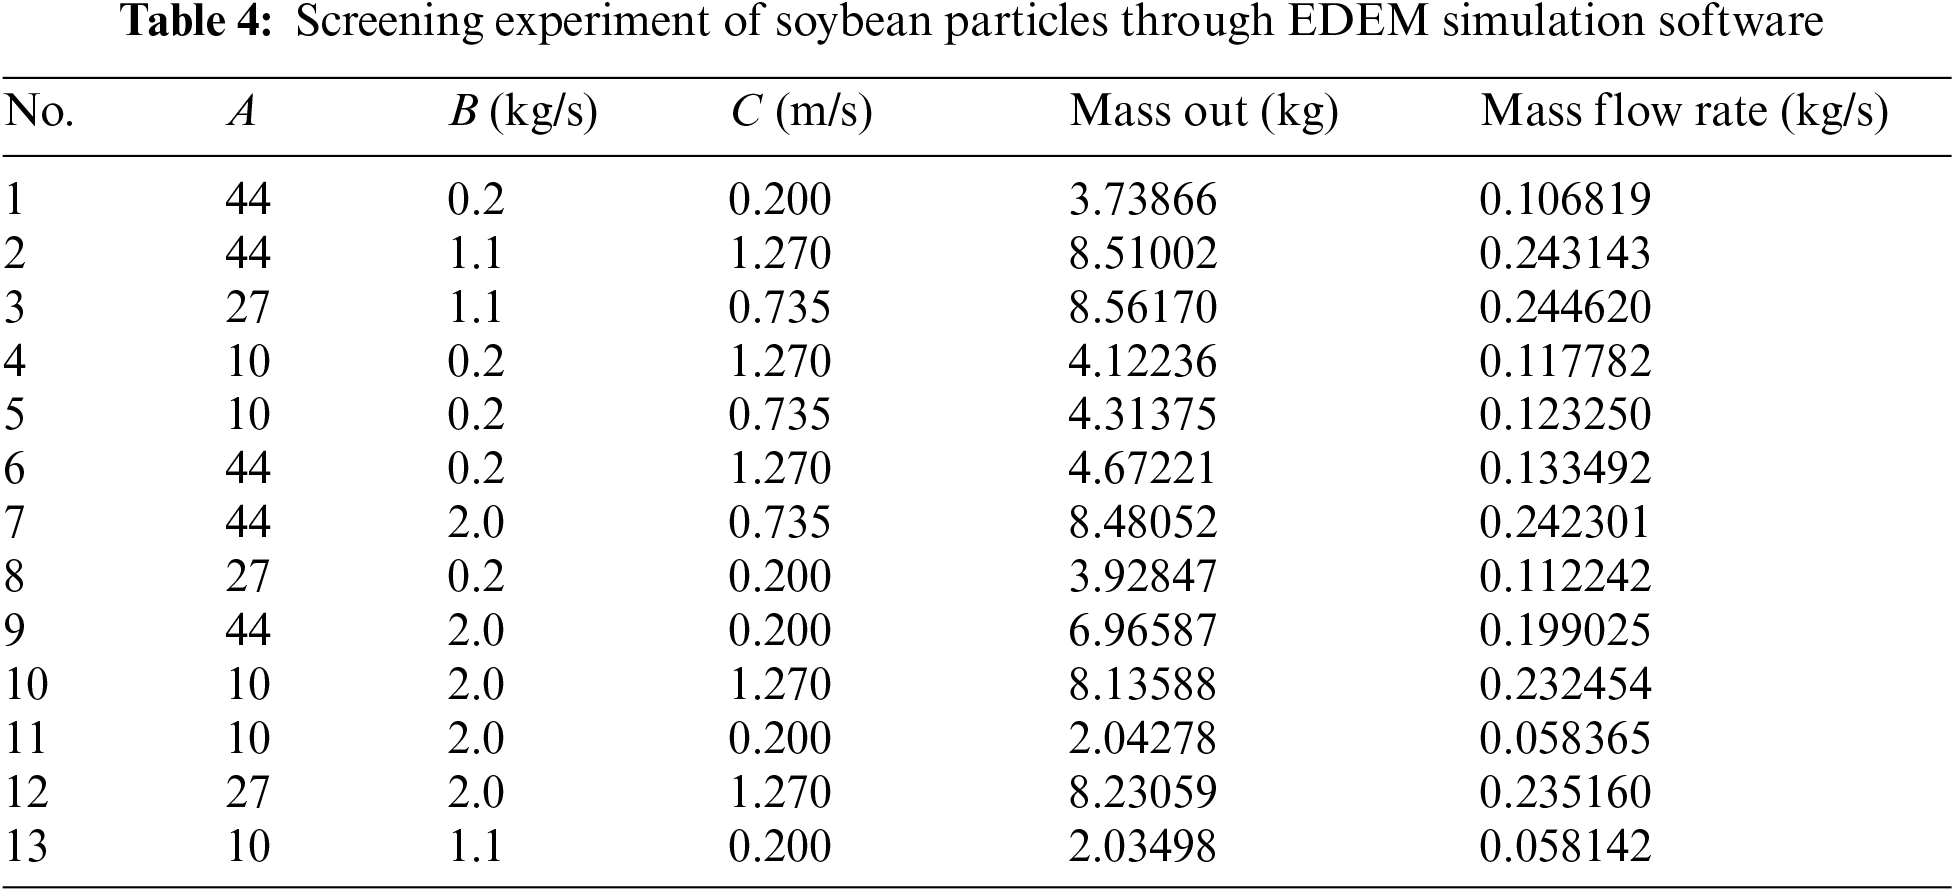
In the initial stage of these experiments, the focus was on screening all factors by assessing their main effects and interactions, rather than prioritizing the development of the final quadratic model. The screening process involved delineating the design space, as illustrated in Table 2, followed by conducting simulation experiments using EDEM simulation software, as detailed in Tables 3 and 4. Subsequently, factors identified through screening were chosen for integration into the central composite design (CCD) phase.
4.2 Central Composite Design (CCD) for Process Variables
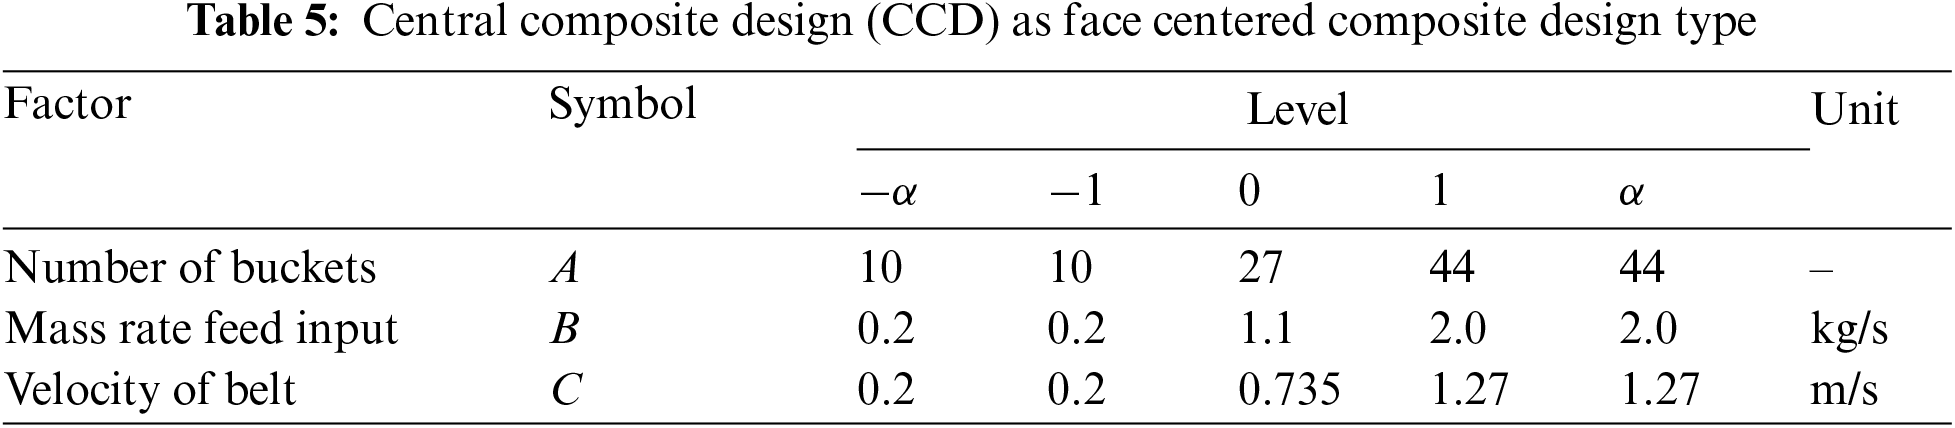
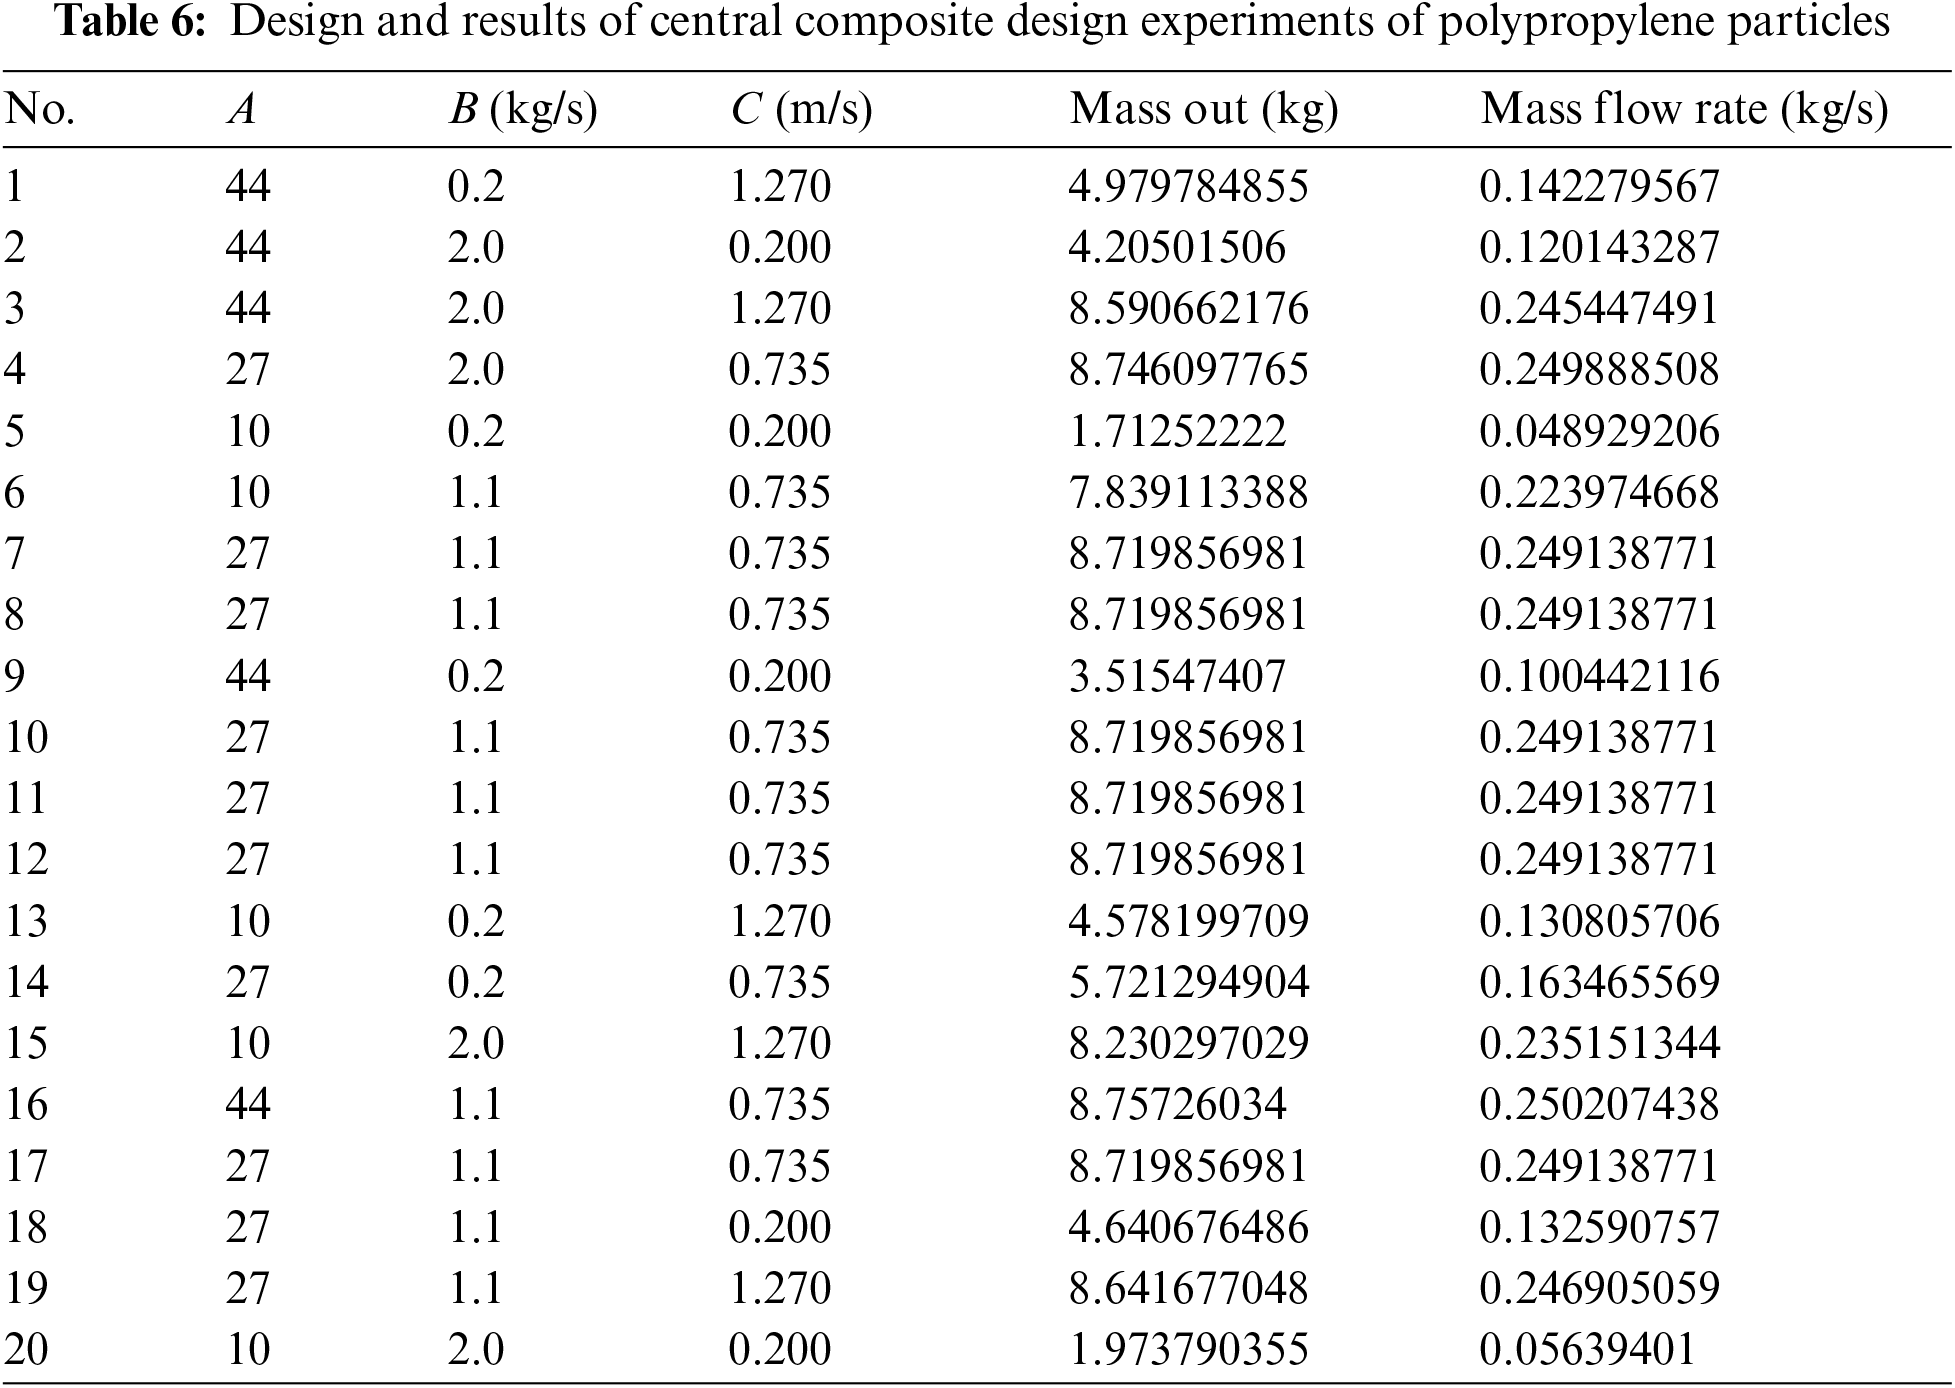
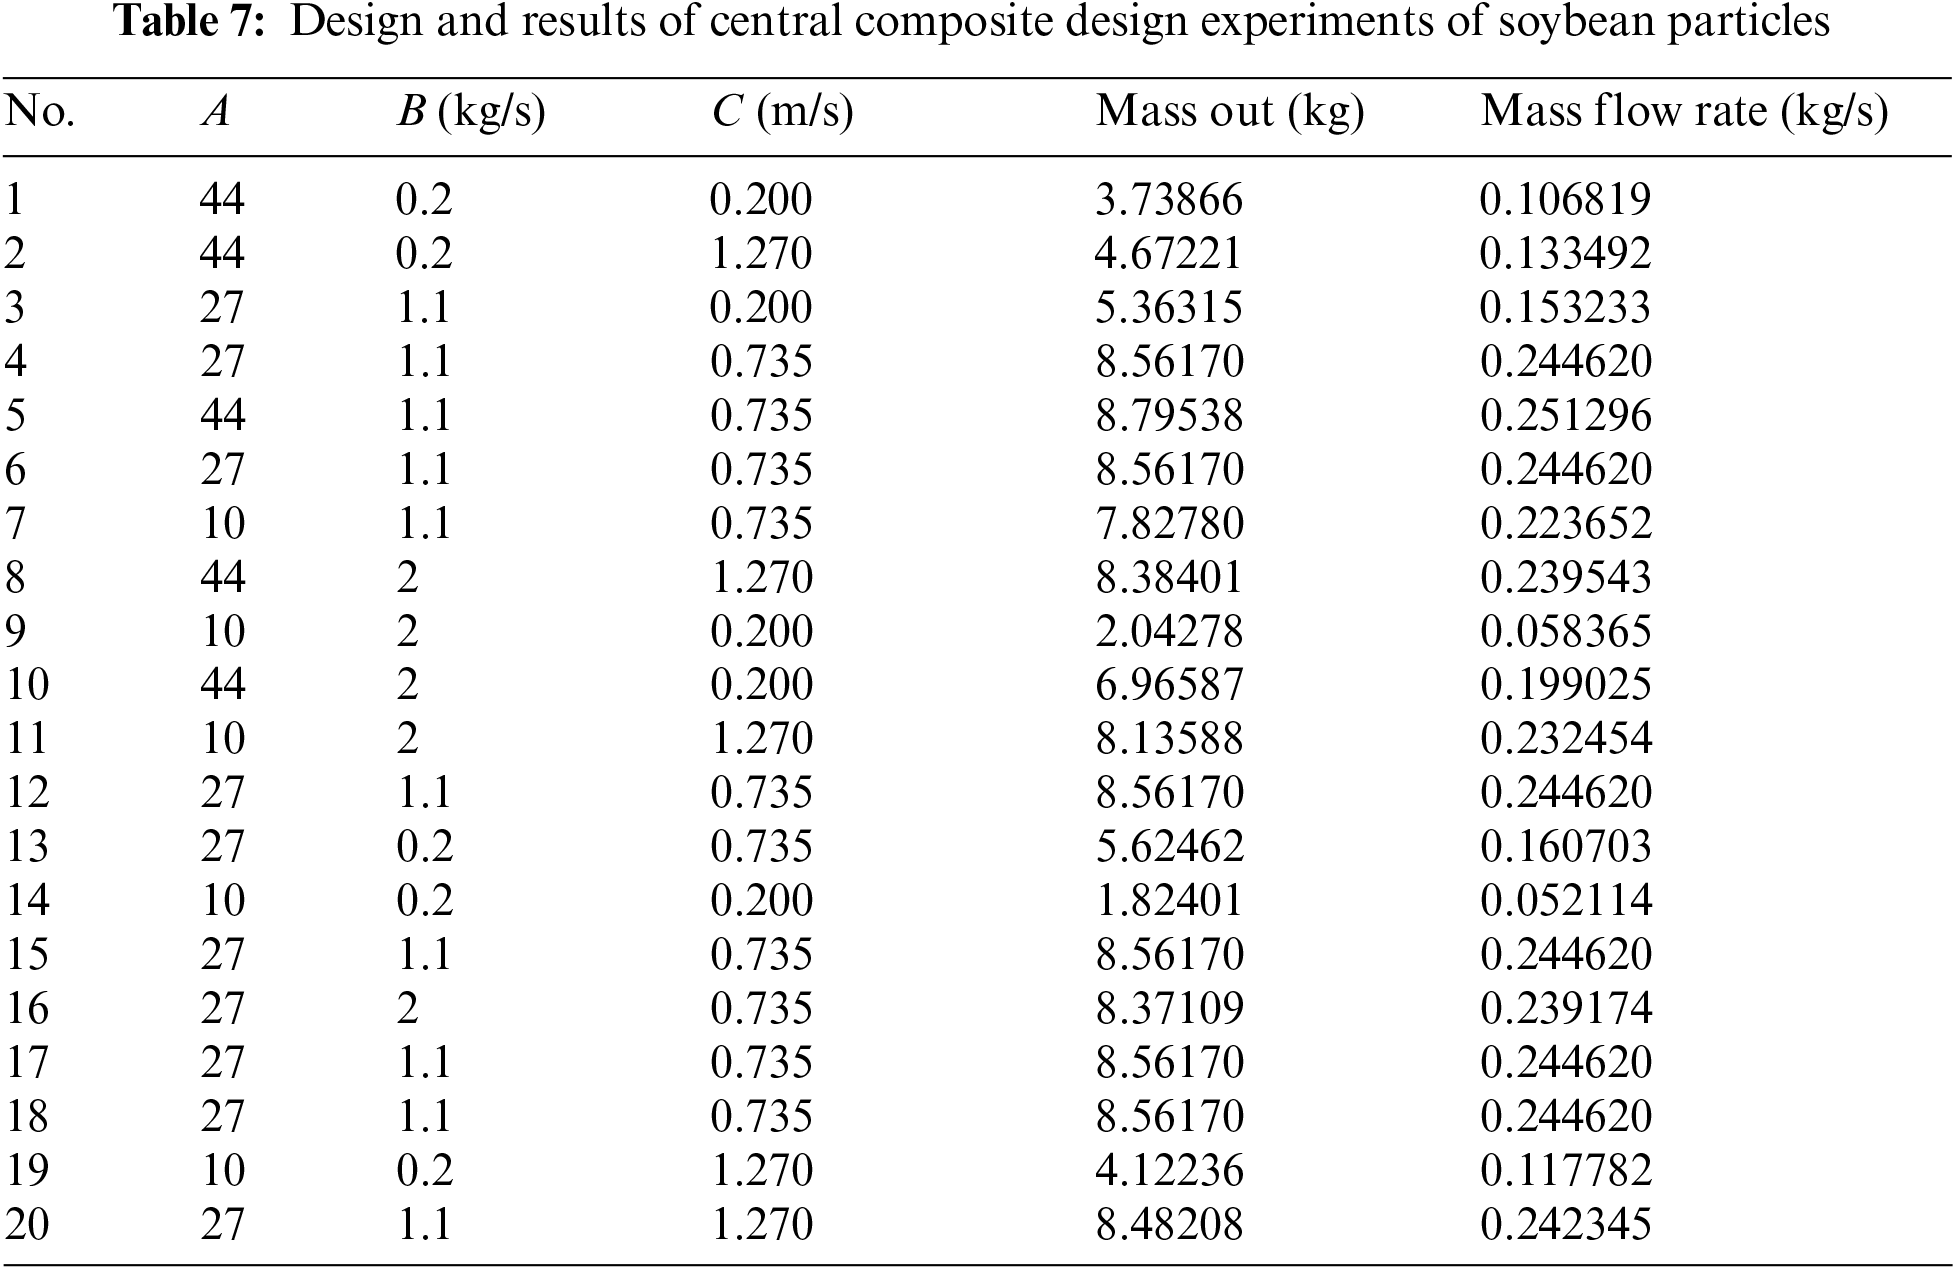
During this phase, a Face Centered Composite Design, known as the Central Composite Design (CCD), is employed to orchestrate experiments conducted via EDEM simulation. Following the screening phase, specific process parameters influencing the optimization of transport mass and mass flow rate discharge are identified for inclusion, detailed in Table 5. Adhering to the CCD methodology outlined in reference [29], three factors are selected and categorized into five levels, comprising eight cube points, six central points, and six axial points, with an α value of 1. Subsequently, 20 experimental runs are established according to the CCD method, presented in Tables 6 and 7. Upon establishing the CCD results, the Response Surface Methodology (RSM) is utilized to formulate nonlinear mathematical models based on second-order quadratic equations for maximizing transport mass and mass flow rate discharge, as depicted in Eqs. (9) and (10), respectively.
4.3 Generating a Predictive Model
Prior to advancing to the optimization methodology stage, it is essential for the response surface methodology to construct a nonlinear mathematical model founded on polynomial equations aimed at maximizing both transport mass and mass flow rate discharge, illustrated in Eqs. (9) and (10), respectively.
In the given context, Xi denotes the independent variables, while M represents the response for transport mass and MR represents the response for mass flow rate discharge. Here, k stands for the number of design variables, A0 and B0 represent the constant coefficients, Ai and Bi denote the coefficients for the linear terms, Aij and Bij signify the coefficients for cross-product terms, and Aii and Bii indicate the coefficients for quadratic terms.
4.4 The Firefly Algorithm Implemented for Optimizing Process Parameters
The Firefly Algorithm (FA) is a metaheuristic optimization method inspired by the natural behavior of fireflies, developed by Yang [30]. It mimics the flashing behavior fireflies use to attract mates or prey, where the brightness of a firefly indicates its attractiveness, causing less bright fireflies to be attracted to brighter ones. In optimization, this brightness corresponds to the objective function to be maximized. The FA operates on three principles: all fireflies are unisex and can attract each other regardless of sex; attractiveness is proportional to brightness, with less bright fireflies moving towards brighter ones and brightness diminishing over distance, causing random movement if no brighter firefly is found; and the brightness is determined by the objective function, reflecting the solution’s quality. In this research, the FA is used to optimize the design and operational parameters of bucket elevators to improve their performance. Its suitability for this task lies in its ability to effectively explore large, complex solution spaces and find near-optimal solutions, making it ideal for optimizing parameters that influence transport mass and mass flow rate discharge in bucket elevators. Polynomial equations for transport mass and mass flow rate discharge to be a fitness in a multi-objective function (transport mass and mass flow rate discharge) in Firefly Algorithm (FA) were created. Firstly, transport mass and mass flow rate discharge equations were employed to be a combined objective function as shown in Eq. (11).
Here
A firefly will try to approve other fireflies by seeking a firefly which has a high proportion of brightness that can calculate the movement of firefly i to another attractive firefly j in Eq. (12).
Here β and α are parameters of attractiveness and randomization by which both parameters were affected from Cartesian distance (rij) (distance between two fireflies).
The attractiveness parameter can be generated from Eq. (13).
Here
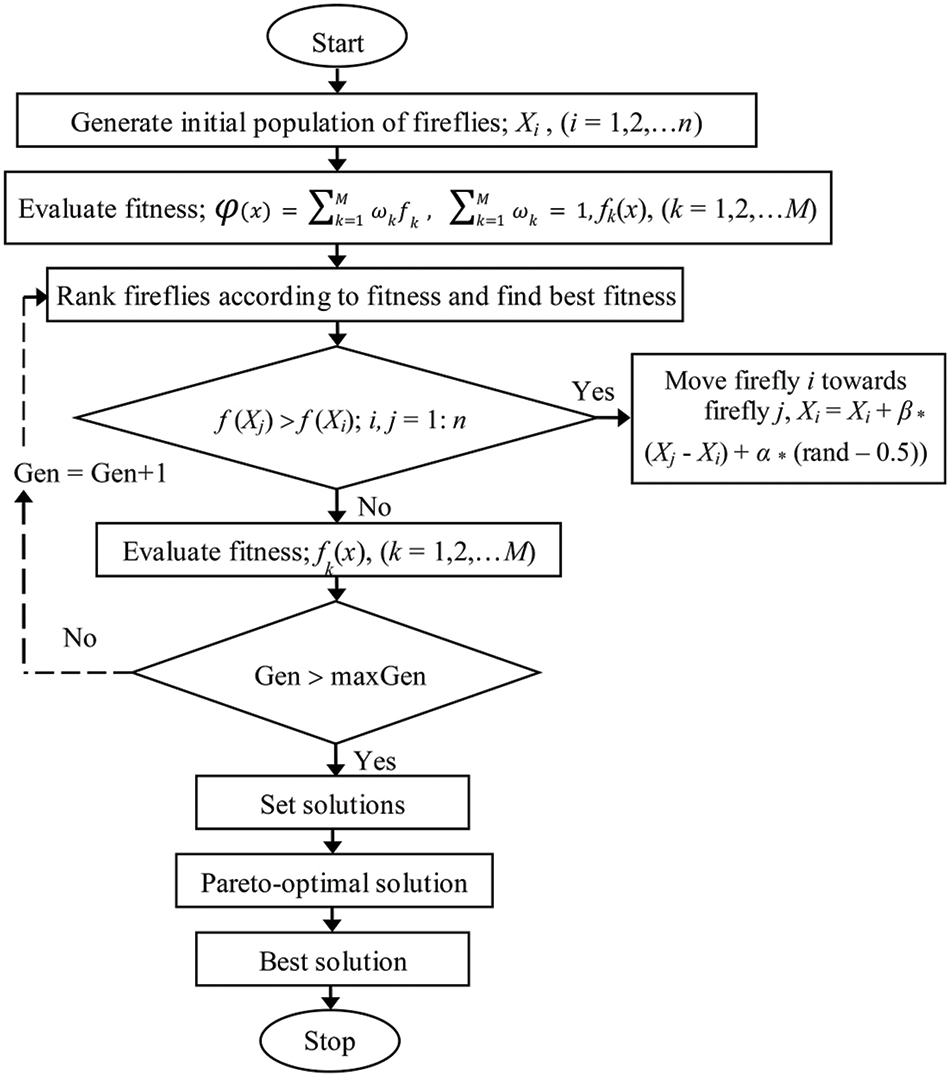
Figure 4: Flow chart of multi-objective firefly algorithm
The optimization process aims to create a multi-objective model that maximizes both transport mass and mass flow rate discharge, as shown in Eqs. (14) and (15), respectively.
With reference to Table 1, which outlines the micro material properties of polypropylene and soybean grains, the function
At this stage, the outcomes from screening factors, central composite design, and multi-objective firefly algorithm experimentation are presented, along with velocity profiles derived from DEM simulation and empirical tests.
5.1 Plackett-Burmann Screening Experiments of Process Parameters
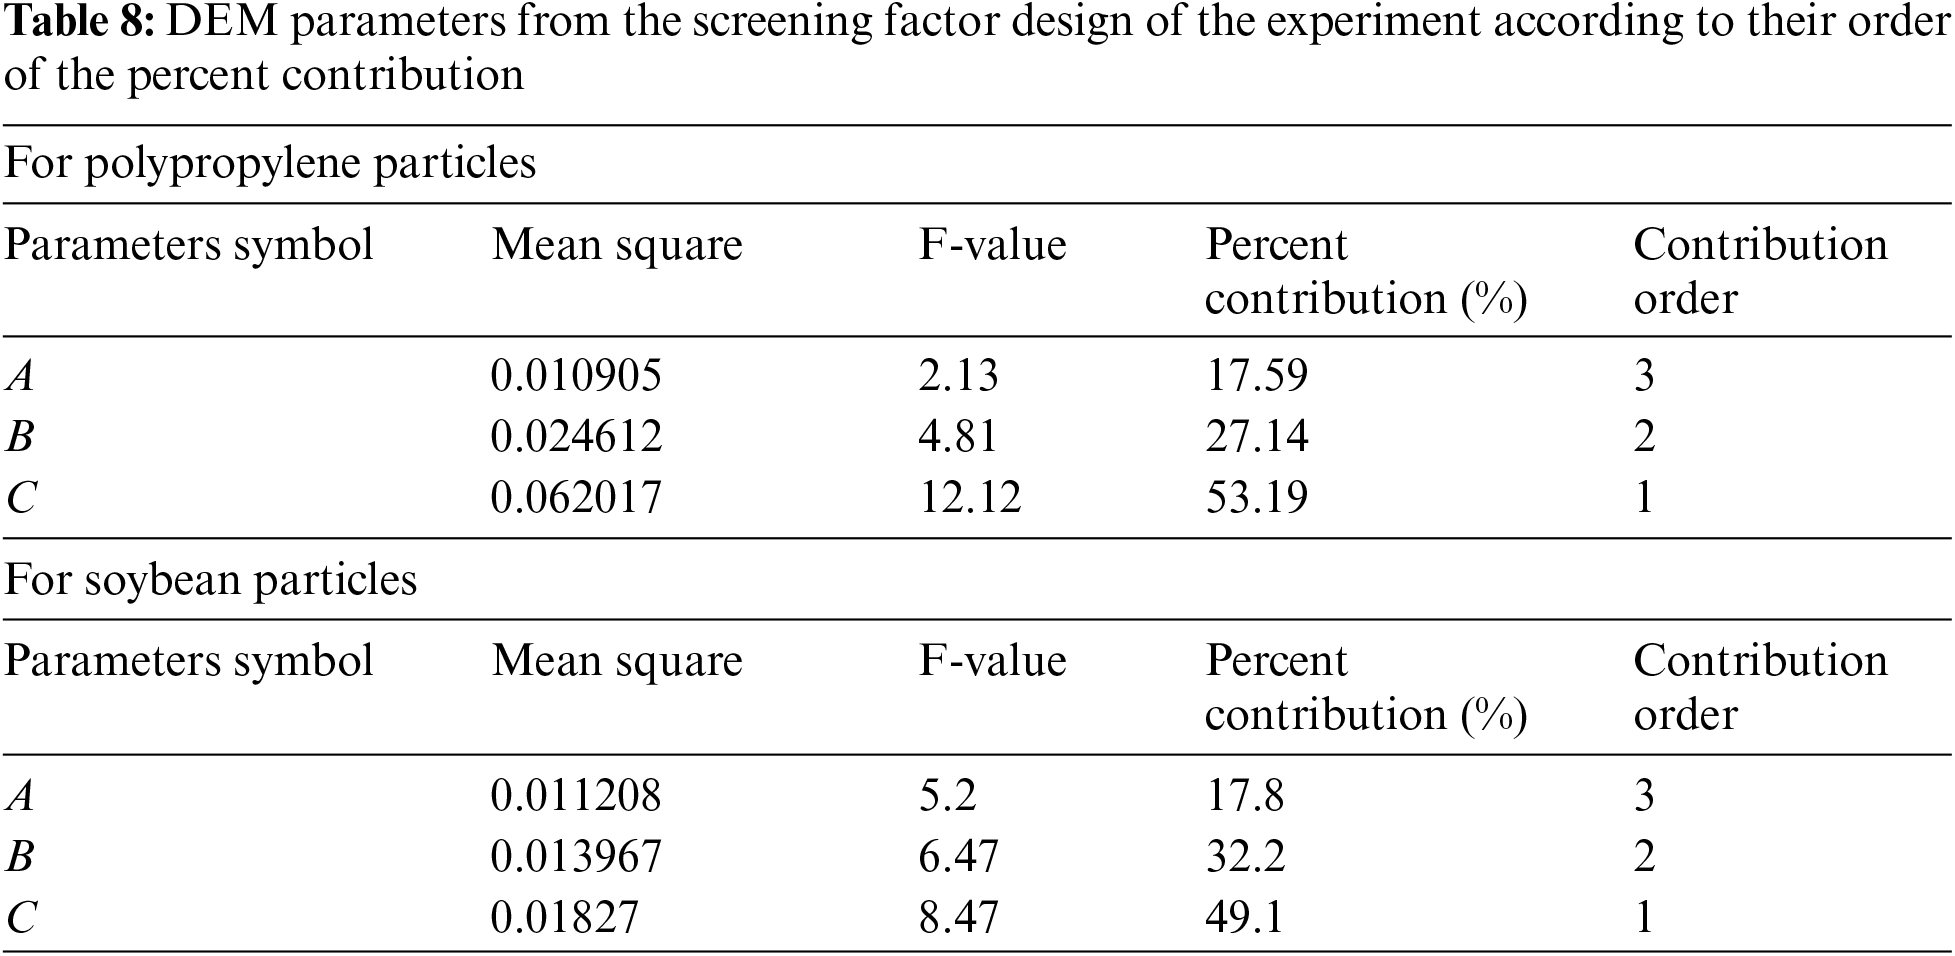
After analyzing the simulation results generated by EDEM software, as outlined in Tables 3 and 4, an assessment of variance was performed on three variables. ANOVA revealed significant factors affecting both transport mass and mass flow rate discharge, with Table 8 showing contributions exceeding 90%. These tables highlight that the Number of buckets (A), Mass rate feed input (B), and Belt velocity (C) substantially influence transport mass and mass flow rate discharge. Table 8 further illustrates the significant impact of belt velocity (C) on both polypropylene and soybean particles, contributing 53.19% and 49.1%, respectively, to transport mass and mass flow rate discharge. This highlights the critical importance of belt velocity in enhancing system performance.
5.2 Creating Modeling through Central Composite Design
Simulation tests conducted using EDEM are documented in Tables 6 and 7. Subsequently, the CCD method was utilized to generate predicted models for transport mass and mass flow rate discharge objectives. ANOVA was then applied, as illustrated in Tables 9 and 10, respectively, to assess the significance of model terms for both objectives. Key terms in ANOVA include “Seq SS” for the sum of squares validating the data, “df” indicating degrees of freedom contributing to error prediction, and “Adj SS” representing the adjusted sum of squares for a term. Following parameter validation, a backward-term elimination stage was employed to remove unnecessary factors. An important consideration during ANOVA is the “p-value,” which should be below 0.05, and the “R-Sq (prediction)” values, which should exceed 80% for both objectives. In Tables 9 and 10, the “R-Sq (prediction)” values were above 90% for both objectives. Consequently, these tables indicate a situation of backward elimination where the Number of buckets (A), Mass rate feed input (B), and Velocity of the belt (C) predominantly influence transport mass and mass flow rate discharge. Furthermore, Tables 9 and 10demonstrate factor interactions between A, B, and C factors, and the squared action of A, B, and C for both transport mass and mass flow rate discharge models of polypropylene and soybean particles. Applying the response surface methodology [29] to create polynomial equations, the final predictive models for transport mass (Mpp) and mass flow rate discharge (MRpp) for polypropylene are shown in Eqs. (19) and (20), while the final predictive models for transport mass (Msb) and mass flow rate discharge (MRsb) for soybean particles are detailed in Eqs. (21) and (22), respectively.
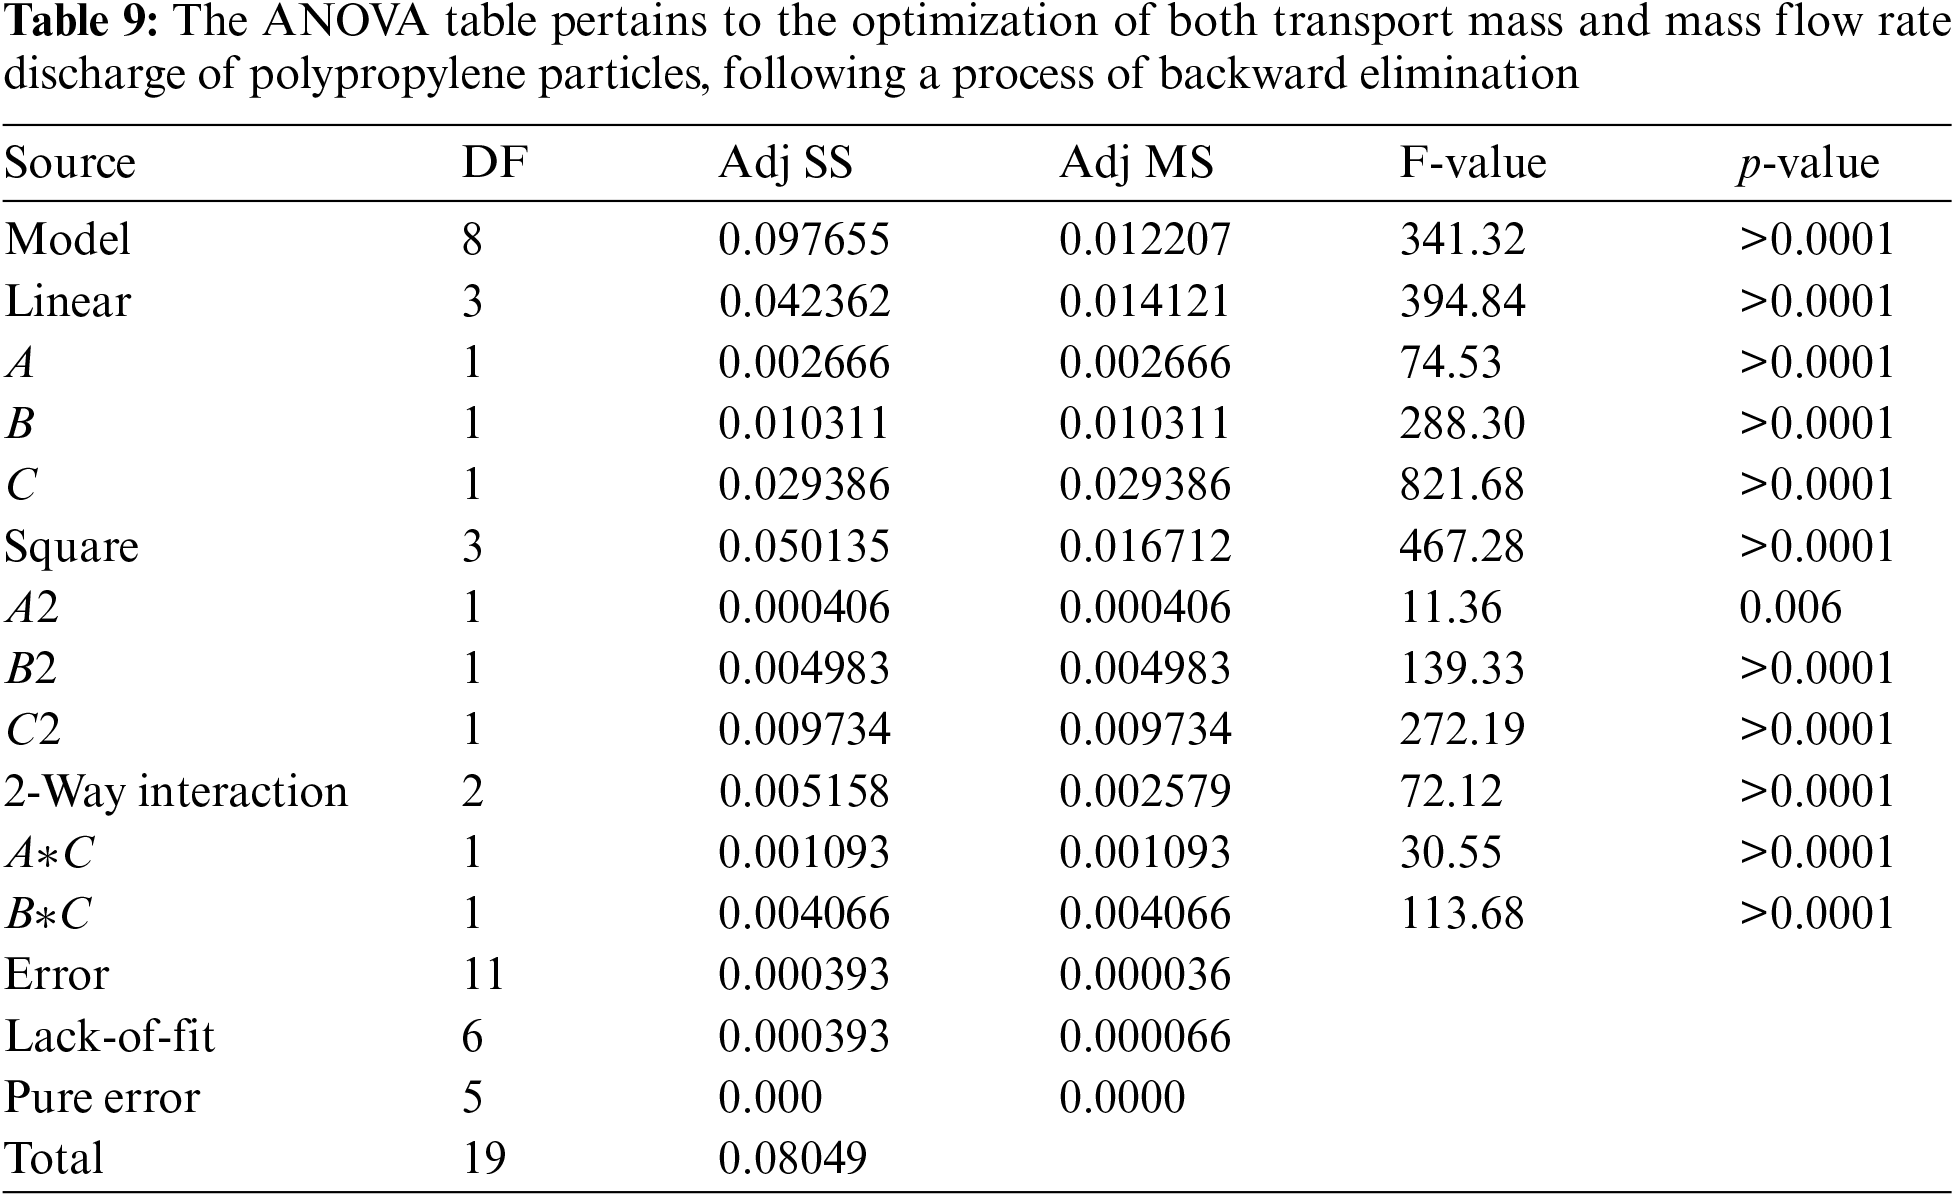
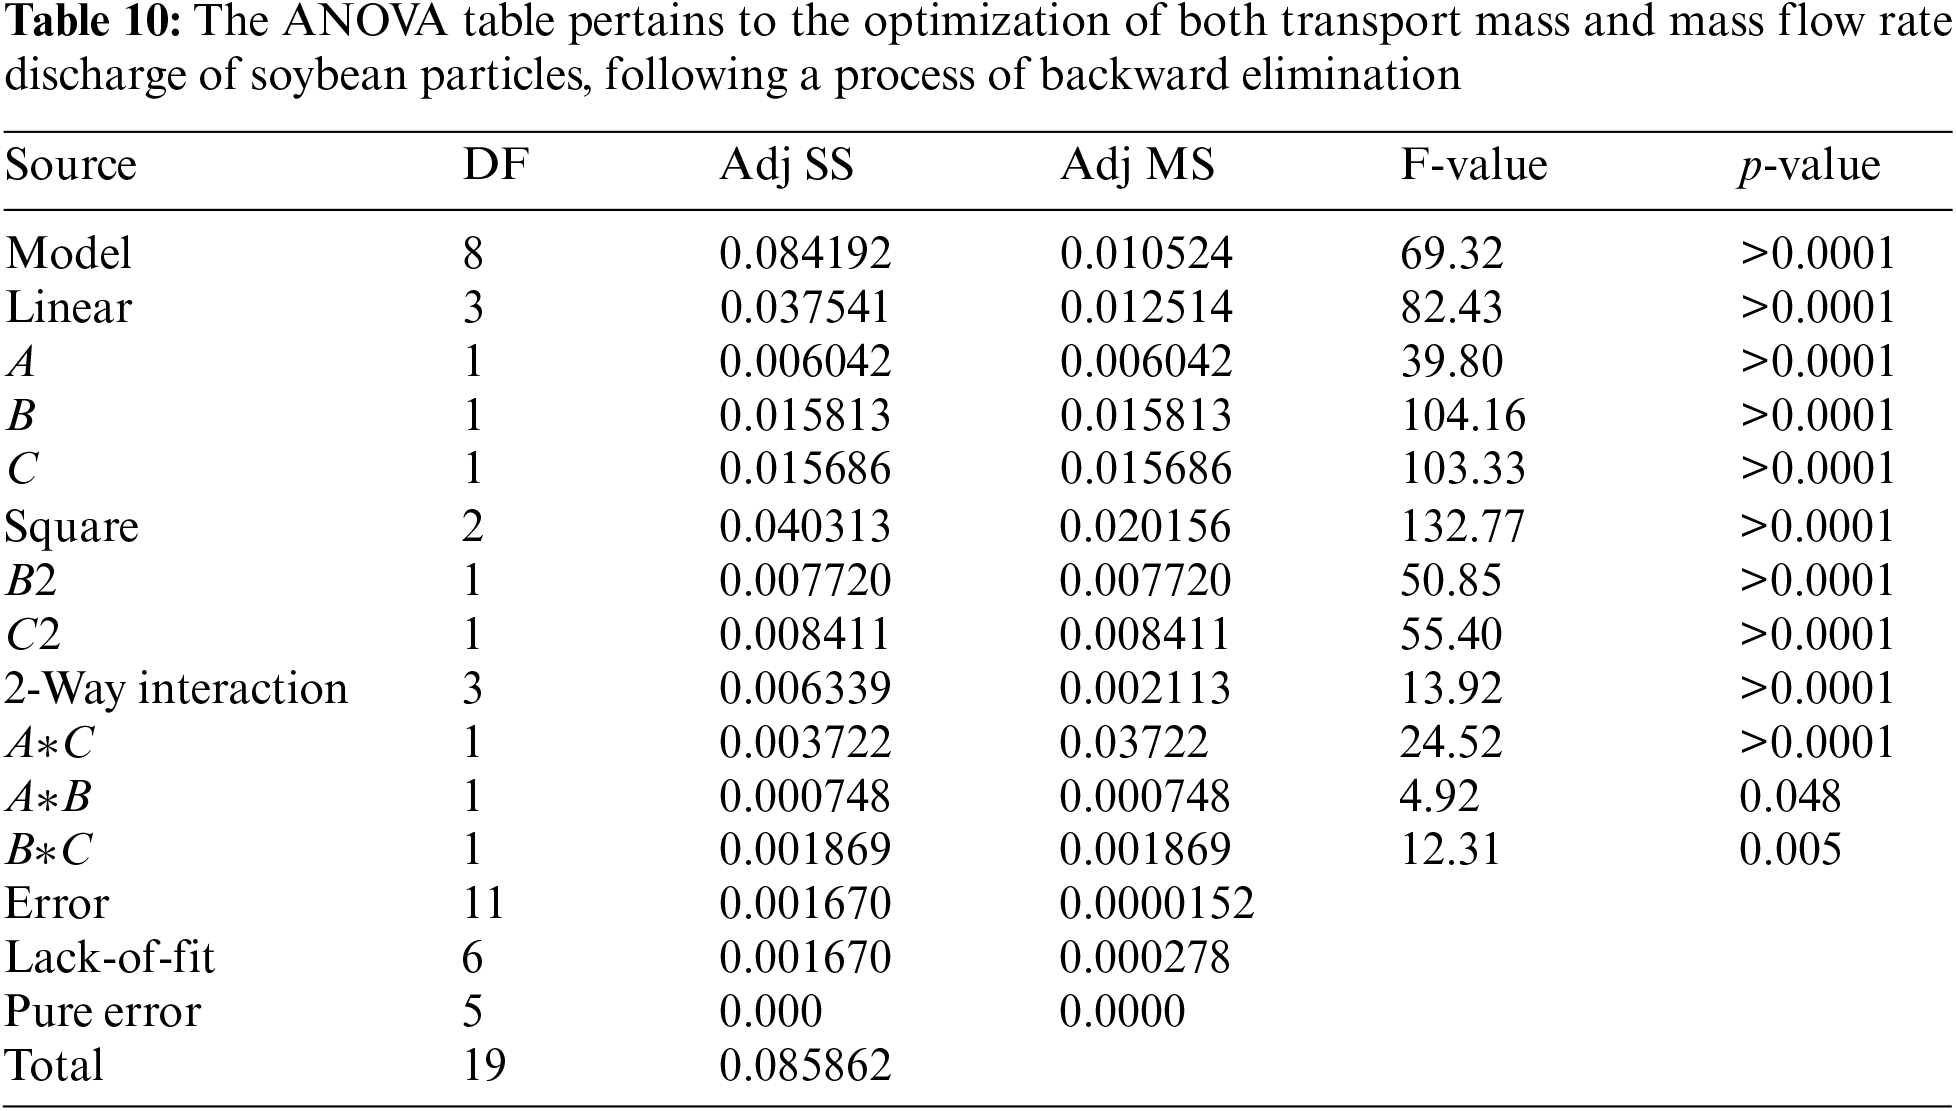
Tables 9 and 10further validate these findings by employing backward elimination to enhance model accuracy, achieving R-Sq (prediction) values exceeding 90%. This rigorous process confirms the reliability of models in predicting transport mass and mass flow rate discharge. Overall, the ANOVA results not only identify critical factors influencing these outcomes but also validate their significance through thorough statistical analysis and model refinement. The high R-Sq (prediction) values (>90%) underscore the robustness of predictive models derived from DEM simulations and empirical tests, ensuring their effectiveness in optimizing bucket elevator performance for polypropylene and soybean particles.
During this phase, Eqs. (19)–(22) are inserted into Eq. (15) for each material experiment to optimize parameter processes using the FA method. Tables 9 and 10showcase the outcomes of identifying the Number of buckets (A), Mass rate feed input (B), and Velocity of the belt (C) through the Firefly algorithm, with parameters set at a population size of 50, 200 iterations, maximum attractiveness at 0.5, absorption coefficient at 0.5, and random perturbation rate at 0.2, following Sudsawat et al.’s methodology [31]. The attainment of convergence within 200 iterations indicates effective performance with these parameter configurations. Subsequently, the results highlight significant parameters: 34 for the Number of buckets (A), 1.56 kg/s for Mass rate feed input (B), and 1.01 m/s for Velocity of belt (C) concerning polypropylene particles, and 44 for the Number of buckets (A), 1.58 kg/s for Mass rate feed input (B), and 0.87 m/s for Velocity of belt (C) regarding soybean particles.
The models’ validation was then conducted using optimal values derived from the FA algorithm for experimental tests consisting of 5 test runs, as detailed in Table 11. The results yielded the average absolute percentage deviation of each model for transport mass and mass flow rate discharge, compared against both simulation and empirical tests. Upon examination, the investigation focused on the objective values (transport mass and mass flow rate discharge) of the predicted model, DEM simulation results, and actual tests, revealing the percentage deviation between predicted and simulated values, predicted and actual test values, as well as simulated and actual test values for both polypropylene and soybean particles. It was observed that the percentage deviations for transport mass and mass flow rate discharge of both polypropylene and soybean particles were less than 10% and 15%, respectively. Consequently, it can be concluded that these models exhibit reliability and can be effectively utilized in the optimization phase.
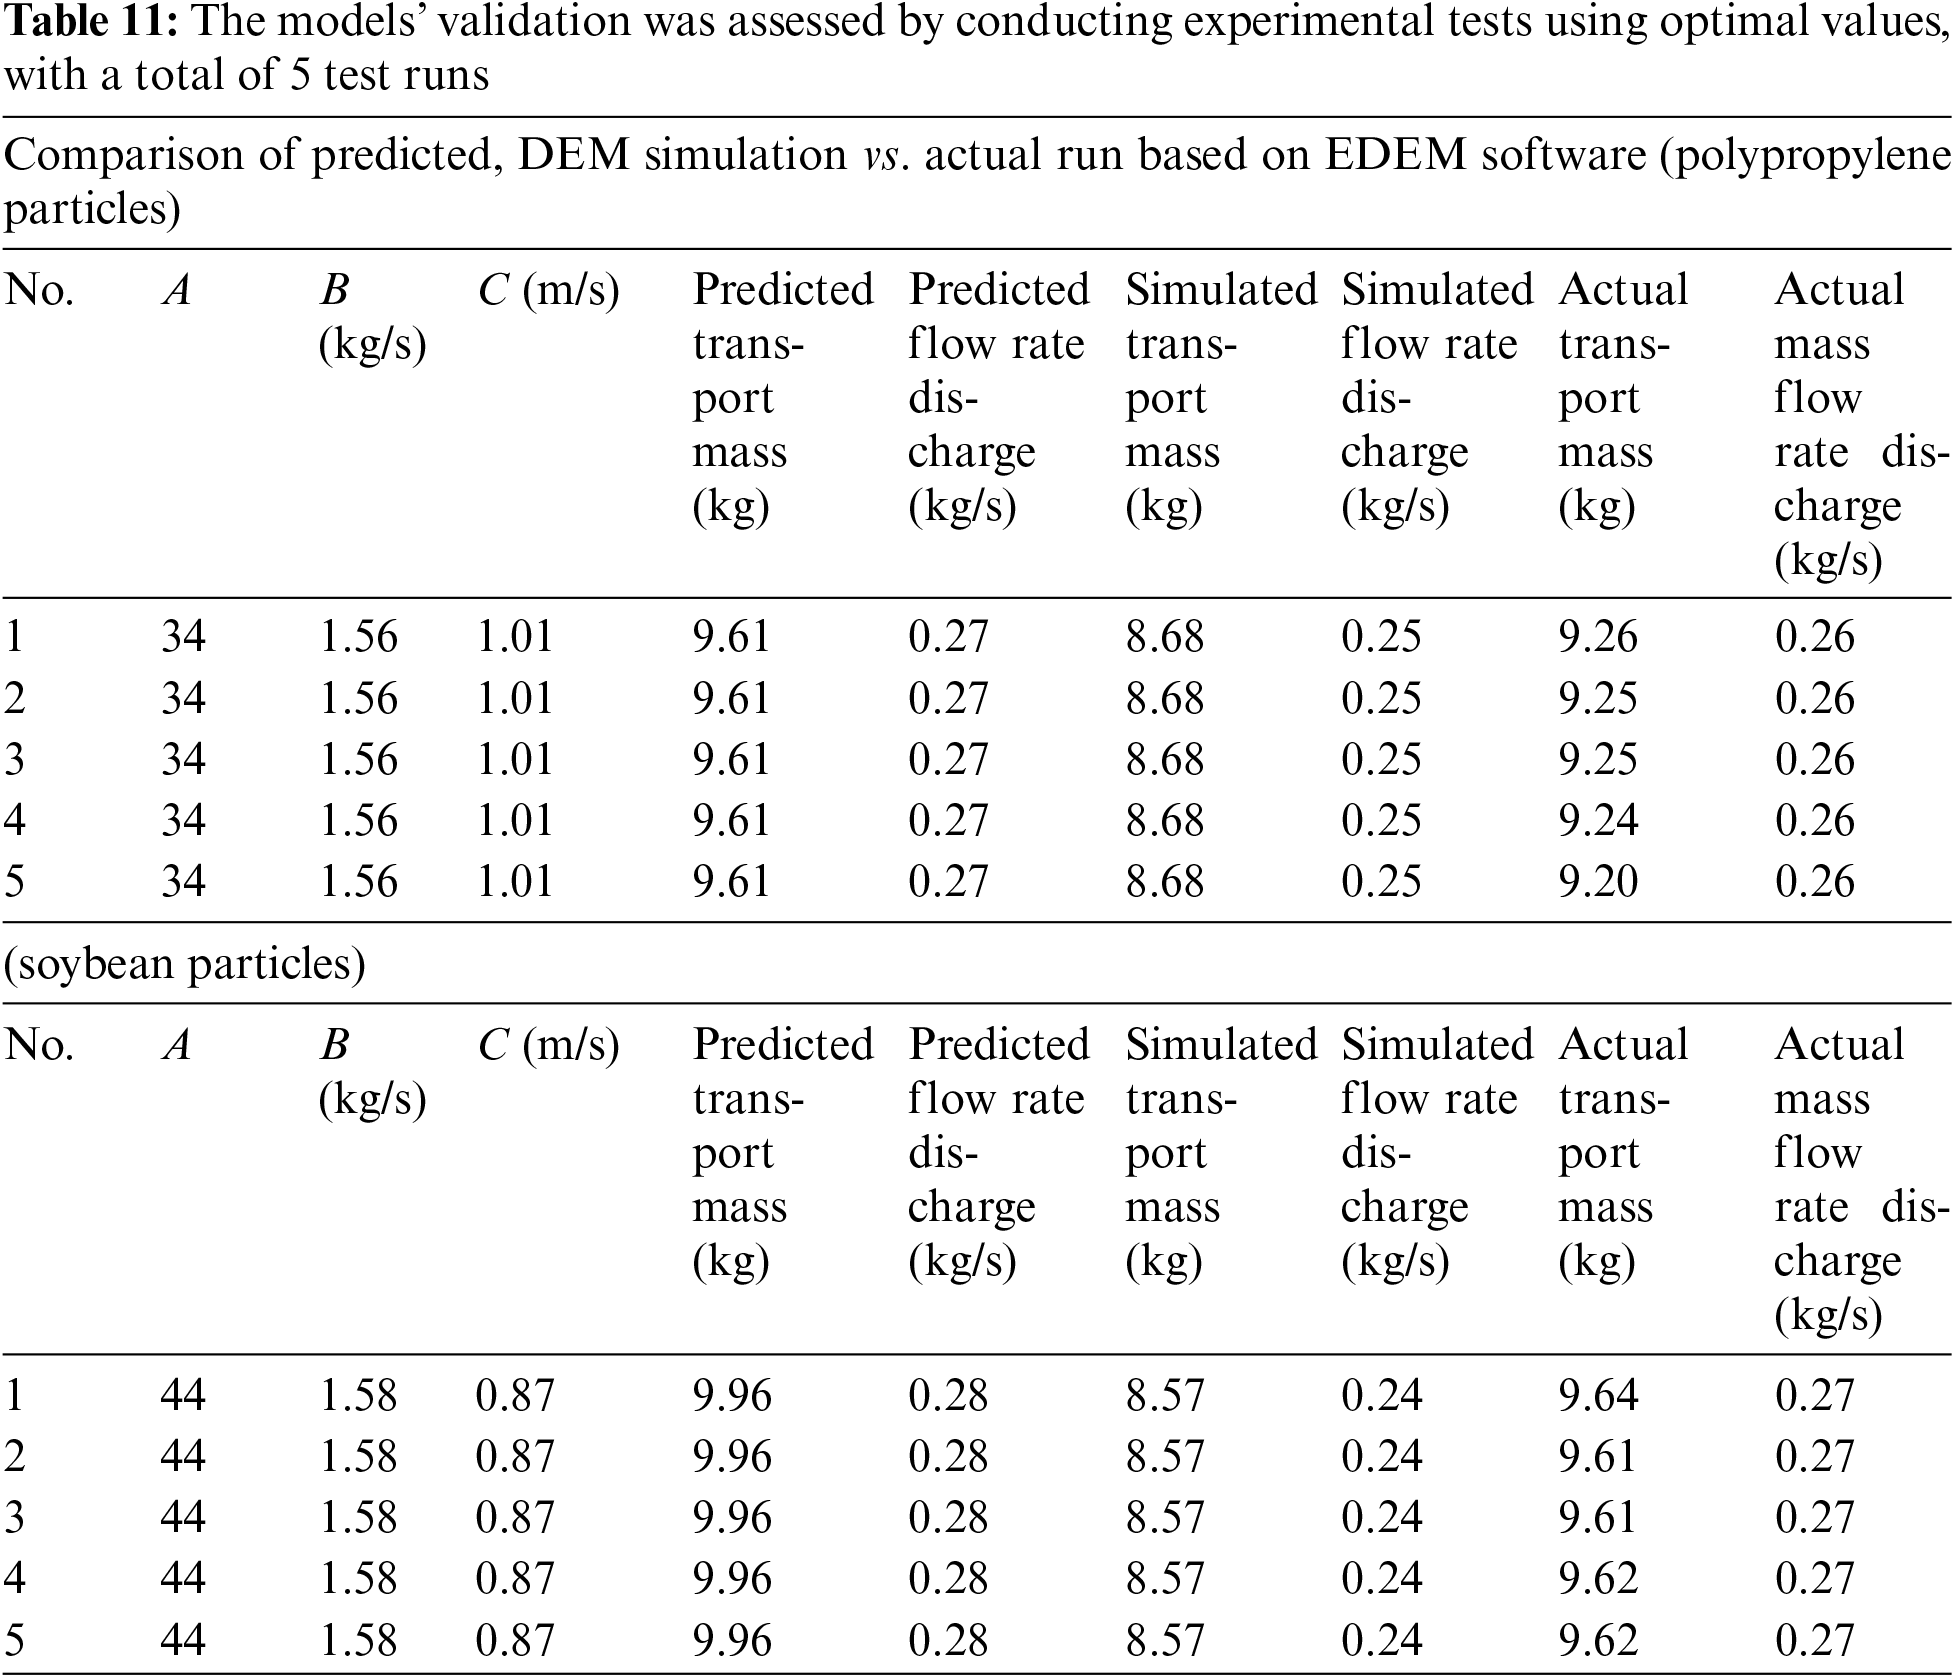
Based on the optimal values presented in Table 11, the maximized values of transport mass and mass flow rate discharge obtained through the FA method offer suitable operating parameters for each material experiment. It is evident that the results for the bucket elevator, which handles polypropylene particles, suggest a significantly different number of buckets compared to soybean particles, with 34 and 44 buckets, respectively. This outcome underscores the substantial influence of material properties on material handling via bucket elevators. Consequently, conventional methods for designing bucket elevators, often derived from basic mathematical equations, may prove insufficient, given the significant impact of material properties and particle geometry on handling behavior. Additionally, when examining belt velocity, which is typically categorized into gravitational, mixed, and centrifugal discharge sections [18,28], It is common practice to set belt velocities below 1 m/s, around 1 m/s, and above 1 m/s for operational parameters [28]. However, the results in Table 11 demonstrate notable differences in belt velocity for handling polypropylene and soybean particles, recorded at 1.01 and 0.87 m/s, respectively, even within the same bucket elevator structure.
Moreover, focusing on the mass flow rate for inlet feeding parameters in both material tests, the results indicate slight variations in the inlet feed rates for bulk materials. Furthermore, a comparison of the objective results derived from quadratic models, EDEM simulation, and empirical tests reveals a consistent trend, with the majority of results aligning closely. Specifically, the percentage of deviation between results from quadratic equations and empirical tests is consistently less than 5%.
5.4 Velocity Profiles of Optimization Values
Following the DEM simulations to validate both objectives (maximum transport mass and mass flow rate discharge), another crucial aspect to consider is the velocity profiles of particles. This is important because the velocity profiles during bucket elevator operation directly impact the performance of bulk material handling.
In Fig. 5, the velocity profiles for polypropylene and soybean particles are depicted, showcasing variations that can be discerned by the color of particle velocities. Despite the inlet feed particles being mostly similar and the belt velocity used to track the buckets for handling bulk materials having slight differences for both materials, around the discharge section, the discharge angle and velocity values for polypropylene particles are notably similar or higher compared to the discharge profiles of soybean particles.
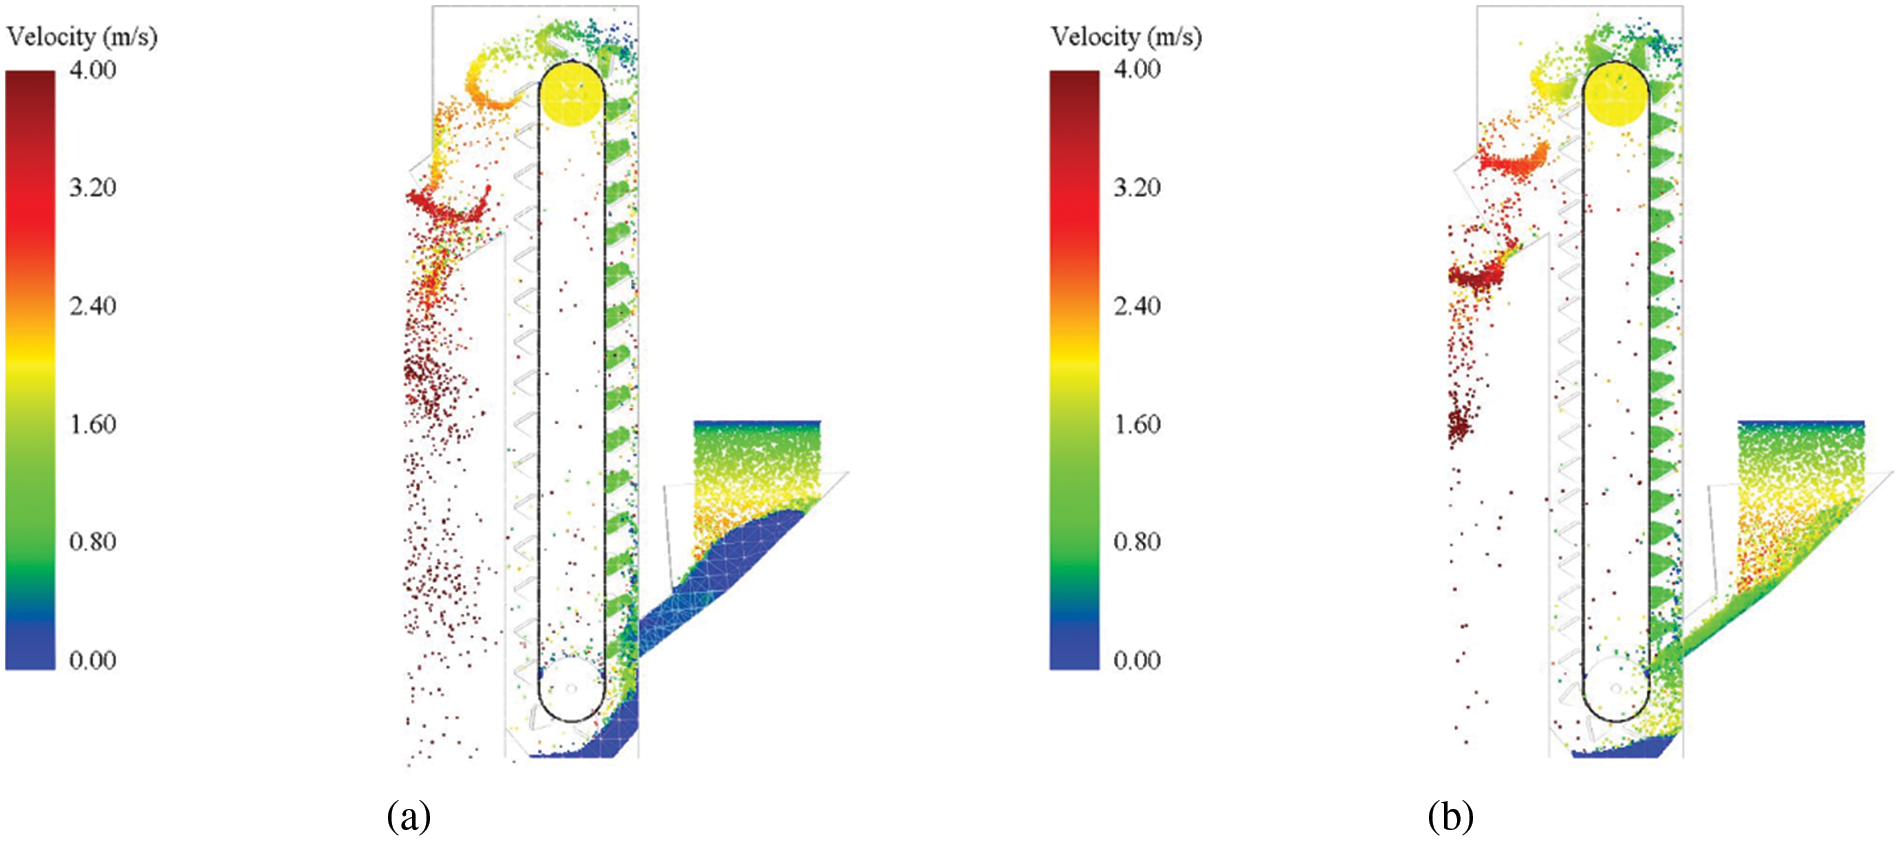
Figure 5: Simulation of a bucket elevator using the DEM approach involved (a) simulating the handling of polypropylene particles and (b) simulating the handling of soybean particles
Further examination of the head bucket elevator section in Fig. 6 clarifies the velocity profiles. Fig. 6a shows that the discharge profiles of polypropylene particles resemble centrifugal discharge profiles, while Fig. 6b illustrates that the discharge profiles of soybean particles resemble mixed discharge profiles. These observations align with the theoretical distance of poles related to the discharge velocity of particles as described in Eq. (20) [18,28].
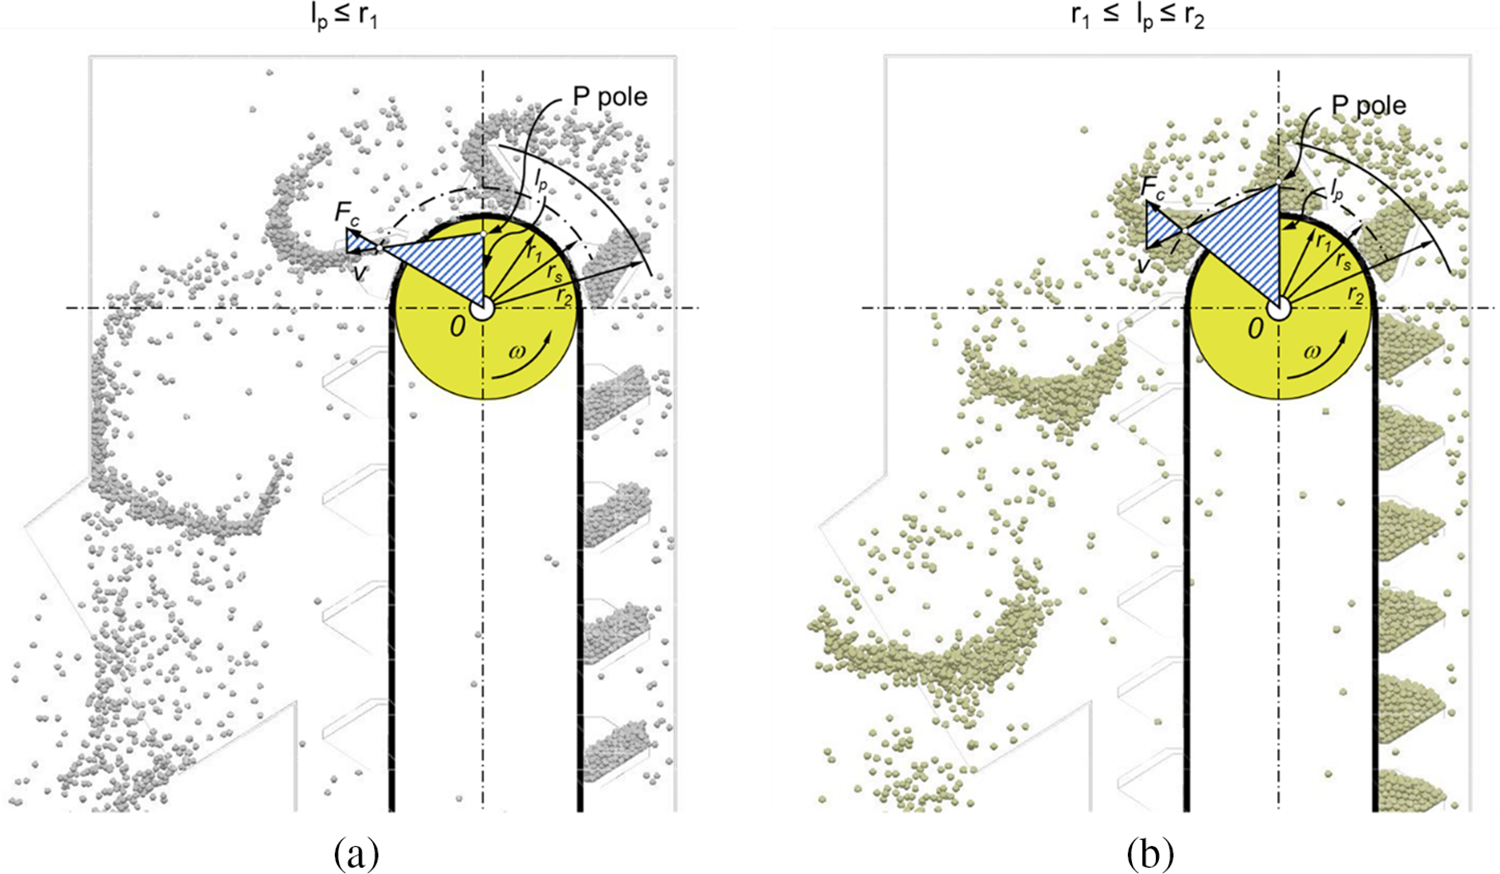
Figure 6: The DEM method used in the simulation of the bucket elevator focused on the behavior of discharged material, with (a) simulating the handling of polypropylene particles and (b) simulating the handling of soybean particles
By considering the discharge profiles according to the distance of poles, as shown in Fig. 6, the classification algorithm is as follows: for gravity discharge,
Figs. 5 and 6 illustrate the velocity profiles during the handling of polypropylene and soybean particles using the DEM approach. In Fig. 5, the velocity profiles at the discharge section show that polypropylene particles exhibit higher velocities resembling centrifugal discharge, while soybean particles display mixed discharge characteristics. This distinction is further clarified in Fig. 6, where polypropylene particles maintain high velocities throughout the discharge process, characteristic of centrifugal discharge, whereas soybean particles exhibit varying velocities indicative of mixed discharge behavior. These differences can be attributed to operational parameters such as belt velocity and the number of buckets. Higher belt velocities, as seen with polypropylene particles, contribute to centrifugal discharge patterns where particles are thrown outward due to centrifugal forces. In contrast, lower belt velocities, as observed with soybean particles, lead to mixed discharge profiles where particles follow a more varied trajectory.
Additionally, in Fig. 7, one of the particles was tracked to observe the transportation behavior of these materials. For the polypropylene particle (PP), it can be observed that initially, the velocity profile is nearly identical to that of the soybean particles. However, as it reaches the discharge section, the velocity profile of the PP particles appears to have a higher velocity compared to the soybean particles, as depicted in Fig. 7. Specifically, when the particle emerges from the discharge section, it reaches a velocity of 4.53 m/s, whereas the soybean particle reaches a velocity of 3.05 m/s at the discharge section. This difference highlights the impact of operational settings, such as belt velocity adjustments, on the final discharge characteristics.
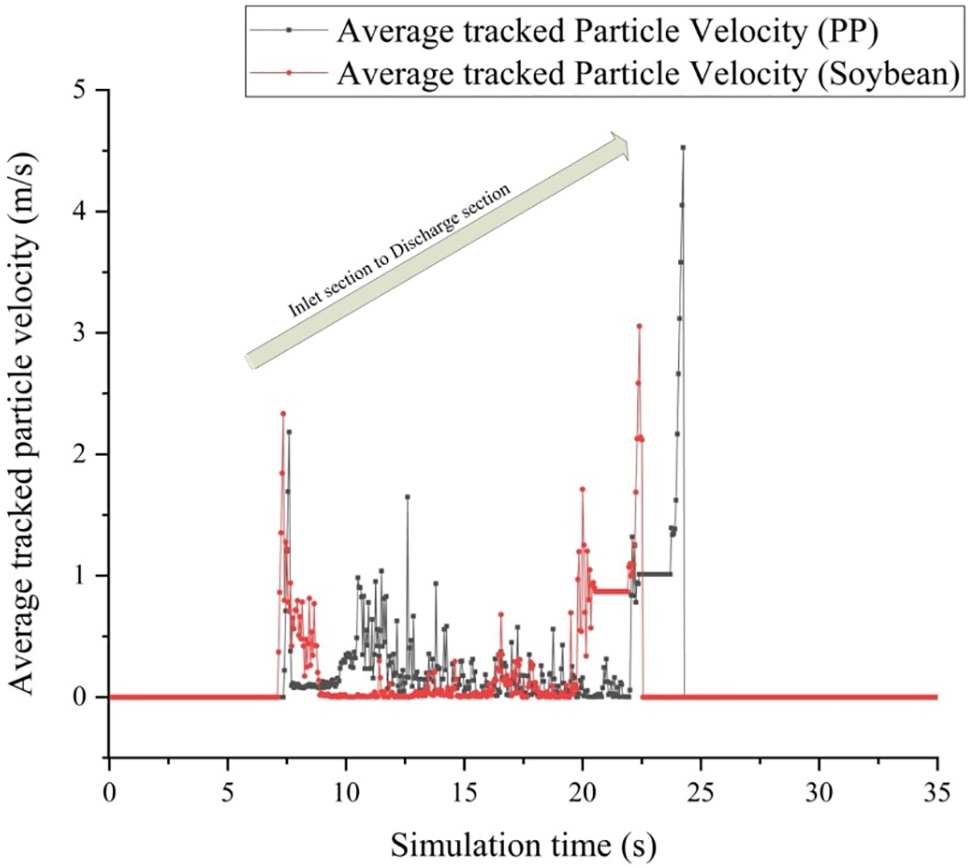
Figure 7: The velocity pattern of a tracked particle, which was introduced as an inlet particle into a bucket elevator, was examined through DEM simulation alongside both polypropylene and soybean particles until it exited around the discharge section
Figs. 8 and 9 compare DEM simulations with experimental data on the handling behavior of polypropylene and soybean particles. The results indicate that DEM simulations accurately reproduce the discharge output seen in empirical tests, as shown in Fig. 8a,b. These figures highlight the distinct velocity profiles of each material. Additionally, Fig. 9 presents the mass flow rate and total handling mass, demonstrating a close match between simulation and experimental results. The maximum mass flow rate for soybean is 1.89 kg/s, while for polypropylene, it is 1.13 kg/s, as depicted in Fig. 9a. The cumulative handling mass from Fig. 9b shows an error percentage of less than 10% between DEM simulations and empirical tests. These figures demonstrate that DEM simulations closely replicate empirical results, confirming the reliability of the simulation approach in predicting particle handling characteristics. This suggests that polypropylene particles are well-suited for centrifugal discharge handling, while soybean particles are more suitable for mixing discharge handling. The observed velocity profiles highlight that adjusting operational parameters like belt velocity and optimizing the number of buckets significantly impacts particle handling efficiency. For polypropylene particles, characterized by centrifugal discharge, higher belt velocities and specific bucket configurations are optimal. Conversely, soybean particles, exhibiting mixed discharge behavior, benefit from lower belt velocities and different bucket configurations. Understanding these velocity profiles helps in optimizing bucket elevator designs tailored to specific material properties, enhancing overall handling efficiency and minimizing operational discrepancies. This detailed analysis underscores the importance of simulation-based optimization approaches like DEM coupled with empirical validation, ensuring accurate predictions and effective operational adjustments in industrial material handling systems.
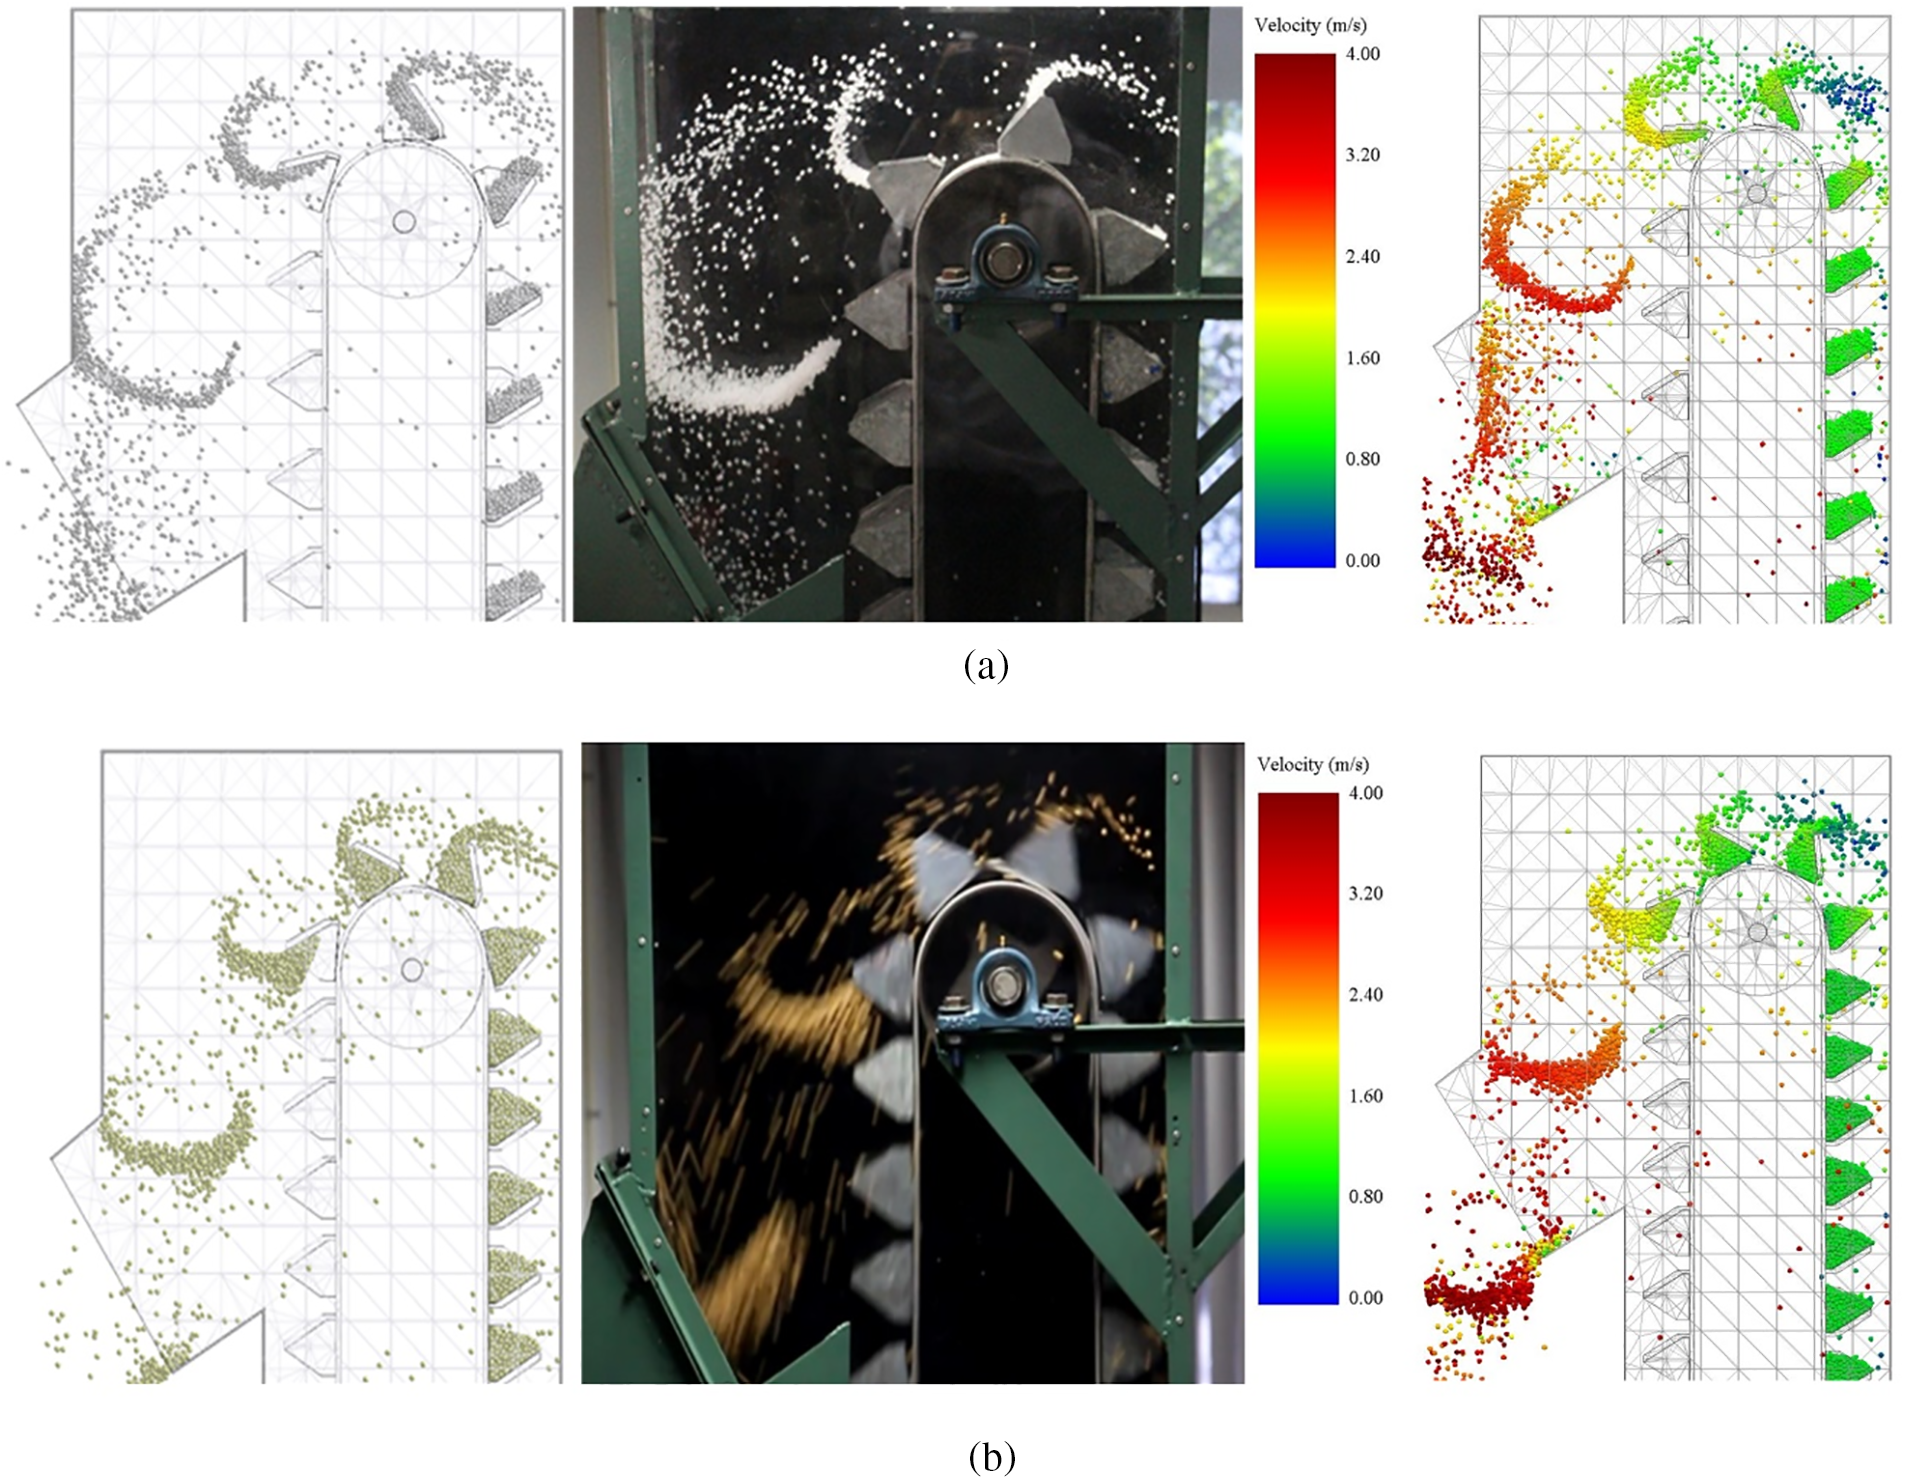
Figure 8: The DEM method employed in simulating the bucket elevator was juxtaposed with empirical tests, emphasizing the behavior of discharged material, with (a) simulating the handling of polypropylene particles and (b) simulating the handling of soybean particles
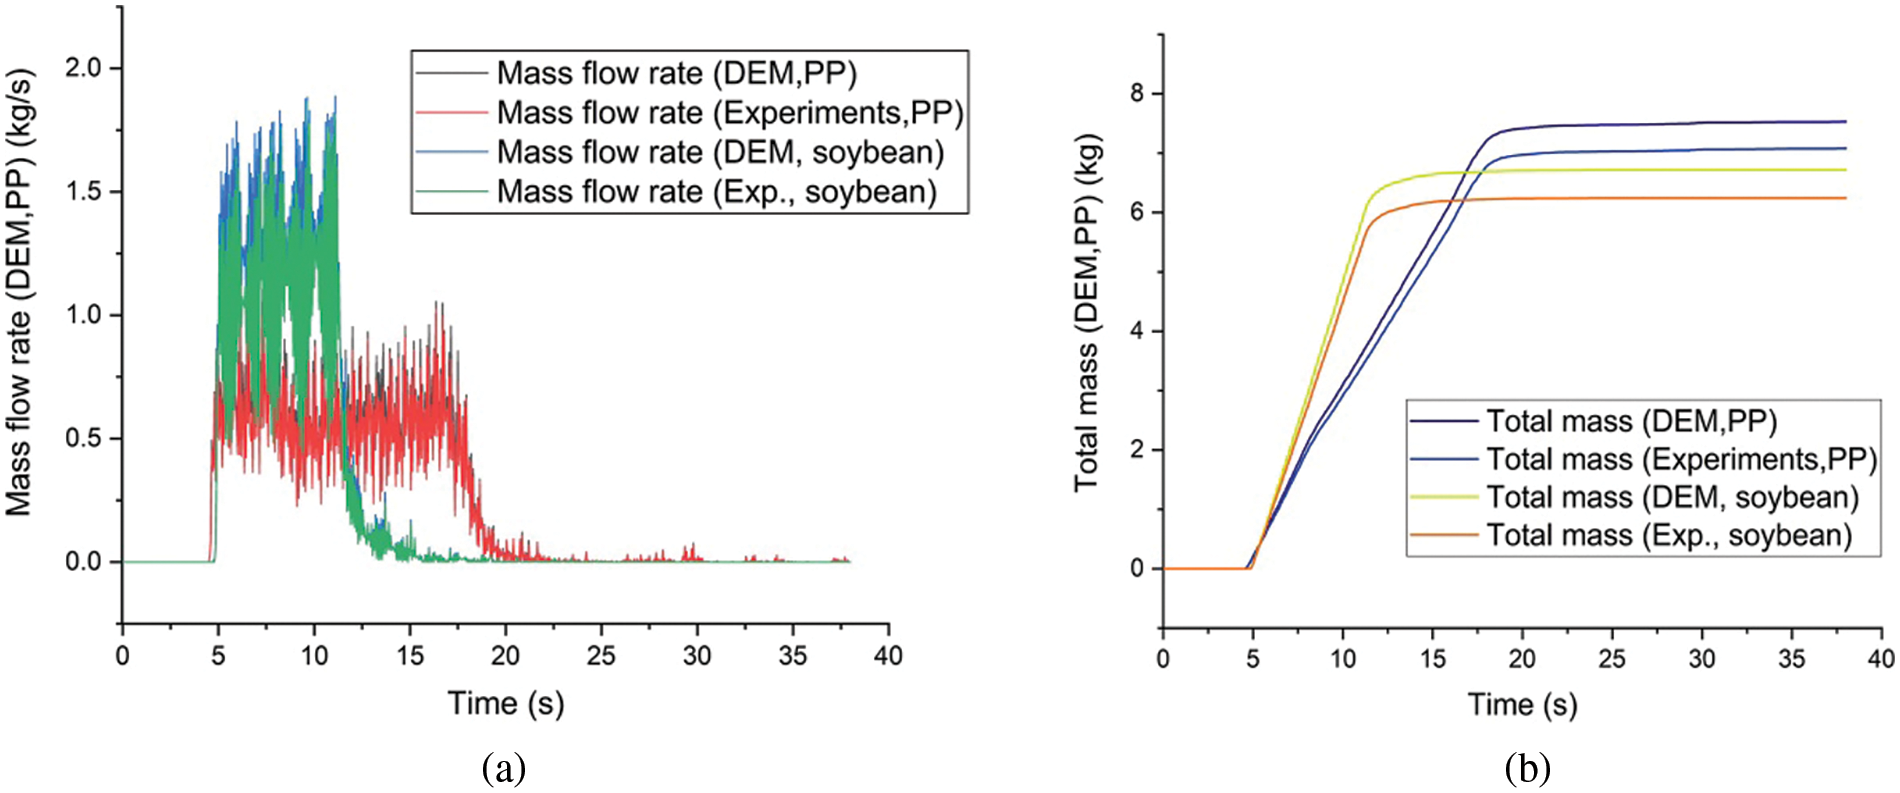
Figure 9: The mass flow rate (a) and cumulative total mass (b) of both polypropylene and soybean particles
Overall, the integration of CCD, FA, and DEM simulations allows for the precise optimization of bucket elevator operations, tailored to specific material properties, thereby enhancing handling efficiency and minimizing operational discrepancies. The detailed analysis of velocity profiles further supports the theoretical models and empirical observations, ensuring accurate predictions and effective operational adjustments.
Based on the comprehensive analysis conducted throughout this research, several key findings and conclusions can be drawn:
• A systematic optimization approach, combining experiments and FA algorithms, identifies the best parameters for maximizing transport mass and flow rate.
• Key factors influencing transport mass and flow rate include the number of buckets, feed input rate, and belt velocity.
• Models developed were validated with experiments, showing reliable predictions closely matching actual results.
• The optimized parameters derived from the FA algorithm offer practical operating parameters for handling polypropylene and soybean particles. The study highlights the importance of considering material properties and particle geometry in designing bucket elevators, to ensure efficient and effective operation.
• Analysis of velocity profiles reveals differences in particle behavior, emphasizing the importance of understanding particle movement for system optimization.
In summary, the study offers valuable insights into enhancing material handling processes within bucket elevators. It underscores the importance of factoring in material properties, process parameters, and particle behavior to ensure industrial systems operate efficiently and effectively.
Acknowledgement: The authors extend their appreciation to the Department of Materials Handling and Logistics Engineering, Faculty of Engineering, King Mongkut’s University of Technology North Bangkok for assisting in obtaining equipment and facilities for the research process.
Funding Statement: This research was funded by the Faculty of Engineering, King Mongkut’s University of Technology North Bangkok. Contract No. ENG-NEW-66-39.
Author Contributions: Conceptualizing: Pirapat Arunyanart and Supattarachai Sudsawat; methodological approach: Pirapat Arunyanart and Supattarachai Sudsawat; software utilization: Pirapat Arunyanart and Supattarachai Sudsawat; formal analysis: Pirapat Arunyanart and Supattarachai Sudsawat; data management: Pirapat Arunyanart and Supattarachai Sudsawat; initial draft composition: Supattarachai Sudsawat; revision and editing: Supattarachai Sudsawat and Pirapat Arunyanart; overseeing: Nithitorn Kongkaew. All authors reviewed the results and approved the final version of the manuscript.
Availability of Data and Materials: There is no associated data with this research.
Ethics Approval: Not applicable.
Conflicts of Interest: The authors declare that they have no conflicts of interest to report regarding the present study.
References
1. J. L. Pérez-Aparicio, R. Bravo, and J. J. Gómez-Hernández, “Optimal numerical design of bucket elevators using discontinuous deformation analysis,” Granul. Matter, vol. 16, no. 4, pp. 485–498, Feb. 2014. doi: 10.1007/s10035-014-0485-5. [Google Scholar] [CrossRef]
2. X. Xiong, Y. Gong, X. Wang, P. Dai, and X. Gong, “A design process to eliminate bucket-to-bucket interference on chain bucket elevator,” Adv. Mech. Eng., vol. 8, no. 9, pp. 1–6, Sep. 2016. doi: 10.1177/1687814016668104. [Google Scholar] [CrossRef]
3. M. D. Sinnott, J. E. Hilton, W. McBride, and P. W. Cleary, “Coupled gas-particulate discharge from a bucket elevator,” Powder Technol., vol. 314, pp. 203–217, Jun. 2017. doi: 10.1016/j.powtec.2016.12.018. [Google Scholar] [CrossRef]
4. A. Jaskulski, “Engineer-to-order approach to high speed bucket elevator design in a small enterprise,” Appl. Eng. Agric., vol. 24, no. 5, pp. 545–557, May 2008. doi: 10.13031/2013.25266. [Google Scholar] [CrossRef]
5. M. Gholami, “Design bucket chain elevator for transporting digging materials in Tohid tunnel,” presented at the 24th Annu. Int. Conf. Mech. Eng.-ISME2016, Yazd, Iran, Apr. 26–28, 2016. [Google Scholar]
6. A. Hamsi, T. B. Sitorus, and M. Fauzan, “The relationship of power speed and bucket elevator capacity to the slope angle of the bucket at the Palm Oil Mill,” IOP Conf. Series: Mat. Sci. Eng., vol. 725, pp. 12019, Jan. 2020. doi: 10.1088/1757-899X/725/1/012019. [Google Scholar] [CrossRef]
7. C. I. Obineche, B. O. Unanka, N. U. Ezechike, A. E. Akuwudike, and C. A. Ojiaku, “Design and performance evaluation of a variable speed bucket elevator,” Turkish J. Agric. Eng. Res., vol. 4, no. 2, pp. 225–238, Dec. 2023. doi: 10.46592/turkager.1378650. [Google Scholar] [CrossRef]
8. S. T. Shinde, V. S. Dixit, M. R. Nukulwar, and S. S. Pimpale, “Material optimization and modal analysis of elevator bucket,” Int. J. Curr. Eng. Technol., vol. 6, no. 2, pp. 574–580, Apr. 2016. [Google Scholar]
9. H. Chaudhary, A. Dhumal, N. Mali, and T. Waghe, “Optimisation of rectangular bucket elevator system by analysis bucket and shafts,” Int. J. Res. Eng. Technol., vol. 8, no. 5, pp. 4360–4363, May 2021. [Google Scholar]
10. P. V. Boslovyak and V. R. Shagimardanov, “Calculation and comparative analysis of bucket of the belt elevator,” IOP Conf. Ser.: Mater. Sci. Eng., vol. 1129, pp. 12069, Apr. 2021. doi: 10.1088/1757-899x/1129/1/012069. [Google Scholar] [CrossRef]
11. P. O. Chikelu, S. C. Nwigbo, O. W. Obot, P. C. Okolie, and J. L. Chukwuneke, “Modeling and simulation of belt bucket elevator head shaft for safe life operation,” Sci. Rep., vol. 13, no. 1083, pp. 1–25, Jan. 2023. doi: 10.1038/s41598-022-26060-x. [Google Scholar] [PubMed] [CrossRef]
12. E. Yin, E. M. Seckley, E. K. Asiedu, and S. Cobbinah, “Stress analysis and topology optimization of a chain bucket elevator using Ansys,” Acta Polytech., vol. 61, no. 1, pp. 292–306, Mar. 2021. doi: 10.14311/AP.2021.61.0292. [Google Scholar] [CrossRef]
13. B. Gurudath, K. K. Kumawat, V. Tejaswi, P. R. Sondar, J. K. Rakshan Kumar and S. R. Hegde, “Failure analysis of a bucket elevator shaft,” J. Fail. Anal. Preven., vol. 21, no. 2, pp. 563–569, Jan. 2021. doi: 10.1007/s11668-020-01101-7. [Google Scholar] [CrossRef]
14. V. M. Bohomaz, K. T. Hlavatskyi, and O. A. Mazur, “Research of influencing of project discriptions of elevator on parameters of its drive,” Sci. Transp. Prog., vol. 2, no. 56, pp. 189–206, Apr. 2015. doi: 10.15802/stp2015/42178. [Google Scholar] [CrossRef]
15. M. Leloup, F. Putier, C. Solliec, and L. L. Coq, “Micro-ingredients carry-over during bucket elevator handling in feed industry: Influence of process parameters,” J. Food Process Eng., vol. 36, no. 5, pp. 675–685, Jul. 2013. doi: 10.1111/jfpe.12031. [Google Scholar] [CrossRef]
16. P. Sokolski, “Assessment of suitability for long-term operation of a bucket elevator: A case study,” Energies, vol. 16, no. 23, pp. 1–16, Nov. 2023. doi: 10.3390/en16237852. [Google Scholar] [CrossRef]
17. A. Nurmagambetov, A. Kurmanov, K. Ryspayev, Z. Bekmyrza, and A. Keklis, “Analysis of grain damage by the bucket elevator during loading/unloading,” Commun.-Sci. Lett. Univ. Zilina, vol. 26, no. 1, pp. B54–B62, 2024. doi: 10.26552/com.c.2024.013. [Google Scholar] [CrossRef]
18. A. Katterfeld and T. Gröger, “Application of the discrete element method–Part 4: Bucket elevators and scraper conveyors,” in Bulk Solids Handling, 2007, vol. 27, no. 4, pp. 228–234. [Google Scholar]
19. W. McBride, M. Sinnott, and P. W. Cleary, “Discrete element modelling of a bucket elevator head pulley transition zone,” Granul. Matter, vol. 13, no. 2, pp. 169–174, Jan. 2011. doi: 10.1007/s10035-010-0243-2. [Google Scholar] [CrossRef]
20. C. Richter, A. Katterfeld, and T. Rößler, “Dem Bechernicken auf der Spur. Investigation of the bucket tilting in bucket elevators,” (in GermanLogist J.: Proc, vol. 2017, no. 10, pp. 1–8, Oct. 2017. doi: 10.2195/lj_Proc_richter_de_201710_01. [Google Scholar] [CrossRef]
21. J. M. Boac, M. E. Casada, R. G. Maghirang, and J. P. Harner III, “3-D and quasi-2-D discrete element modeling of grain commingling in a bucket elevator boot system,” Trans. ASAE/ASABE, vol. 55, no. 2, pp. 659–672, 2012. doi: 10.13031/2013.41367. [Google Scholar] [CrossRef]
22. I. Hafez and R. Dhaouadi, “Application of particle swarm optimization for the identification of two-mass electric drive systems,” presented at the 8th Int. Conf. on Control Decis. Inf. Technol., Istanbul, Turkey, May 17–20, 2022. doi: 10.1109/CoDIT55151.2022.9804056. [Google Scholar] [CrossRef]
23. J. Wollmann, L. Muschalski, Z. Wang, M. Zichner, A. Winkler and N. Modler, “Application of genetic algorithm for the synthesis of path-generating compliant mechanisms,” Smart Mater. Struct., vol. 33, pp. 1–9, Dec. 2023. doi: 10.1088/1361-665X/ad0b93. [Google Scholar] [CrossRef]
24. G. Scalia, R. Micale, A. Giallanza, and G. Marannano, “Firefly algorithm based upon slicing structure encoding for unequal facility layout problem,” Int. J. Ind. Eng. Comput., vol. 10, no. 3, pp. 349–360, Feb. 2019. doi: 10.5267/j.ijiec.2019.2.003. [Google Scholar] [CrossRef]
25. S. Sudsawat, P. Chongchitpaisan, and P. Arunyanart, “Calibrating polypropylene particle model parameters with upscaling and repose surface method,” Eureka: Phys. Eng., no. 6, pp. 34–46, Nov. 2023. doi: 10.21303/2461-4262.2023.002968. [Google Scholar] [CrossRef]
26. P. Arunyanart and S. Sudsawat, “Optimizing design parameters for maximizing mass discharge rates in silos for soybeans using dem simulations,” Chem. Eng. Trans., vol. 102, pp. 331–336, Sep. 2023. doi: 10.3303/CET23102056. [Google Scholar] [CrossRef]
27. S. Zhang, M. Z. Tekeste, Y. Li, A. Gaul, D. Zhu and J. Liao, “Scaled-up rice grain modelling for DEM calibration and the validation of Hopper flow,” Biosyst. Eng., vol. 194, pp. 196–212, Jun. 2020. doi: 10.1016/j.biosystemseng.2020.03.018. [Google Scholar] [CrossRef]
28. D. Gelnar and J. Zegzulka, Discrete Element Method in the Design of Transport Systems Verification and Validation of 3D Models. Cham, Switzerland: Springer Cham, 2019. [Google Scholar]
29. L. Shuaiqi and Z. Yeming, “Optimal design of conveyor truss structure based on response surface methodology,” Glob Res. Dev. J. Eng., vol. 7, no. 1, pp. 9–14, Dec. 2021. [Google Scholar]
30. X. -S. Yang, “Multiobjective firefly algorithm for continuous optimization,” Eng. Comput., vol. 29, no. 2, pp. 175–184, Jan. 2012. doi: 10.1007/s00366-012-0254-1. [Google Scholar] [CrossRef]
31. S. Sudsawat and W. Sriseubsai, “Optimized plastic injection molding process and minimized the warpage and volume shrinkage by response surface methodology with genetic algorithm and firefly algorithm techniques,” Indian J. Eng. Mater. Sci., vol. 24, pp. 228–238, Jun. 2017. [Google Scholar]
Cite This Article
 Copyright © 2024 The Author(s). Published by Tech Science Press.
This work is licensed under a Creative Commons Attribution 4.0 International License , which permits unrestricted use, distribution, and reproduction in any medium, provided the original work is properly cited.
 Downloads
 Citation Tools