
 Submit a Paper
 Propose a Special lssue
 Open Access
ARTICLE

CAEFusion: A New Convolutional Autoencoder-Based Infrared and Visible Light Image Fusion Algorithm
1 Key Laboratory of Modern Power System Simulation and Control & Renewable Energy Technology, Ministry of Education, School of Electrical Engineering, Northeast Electric Power University, Jilin, 132012, China
2 School of Electrical Engineering, Northeast Electric Power University, Jilin, 132012, China
3 School of Electronic Information Engineering, Bozhou University, Bozhou, 236800, China
* Corresponding Author: Mei-Ling Ren. Email:
Computers, Materials & Continua 2024, 80(2), 2857-2872. https://doi.org/10.32604/cmc.2024.053708
Received 08 May 2024; Accepted 07 July 2024; Issue published 15 August 2024
 View Full Text
 Download PDF
Abstract
To address the issues of incomplete information, blurred details, loss of details, and insufficient contrast in infrared and visible image fusion, an image fusion algorithm based on a convolutional autoencoder is proposed. The region attention module is meant to extract the background feature map based on the distinct properties of the background feature map and the detail feature map. A multi-scale convolution attention module is suggested to enhance the communication of feature information. At the same time, the feature transformation module is introduced to learn more robust feature representations, aiming to preserve the integrity of image information. This study uses three available datasets from TNO, FLIR, and NIR to perform thorough quantitative and qualitative trials with five additional algorithms. The methods are assessed based on four indicators: information entropy (EN), standard deviation (SD), spatial frequency (SF), and average gradient (AG). Object detection experiments were done on the M3FD dataset to further verify the algorithm’s performance in comparison with five other algorithms. The algorithm’s accuracy was evaluated using the mean average precision at a threshold of 0.5 (mAP@0.5) index. Comprehensive experimental findings show that CAEFusion performs well in subjective visual and objective evaluation criteria and has promising potential in downstream object detection tasks.Keywords
Currently, the application of infrared and visible light image fusion is highly valuable in military security, medicine, and other domains due to its ability to offer comprehensive and precise information [1,2]. Infrared images can capture the information of heating targets, while visible light images have clear texture information [3]. Thus, utilizing the complementary nature of the information helps enhance the image’s performance in all weathers performance [4,5]. Nevertheless, the disparity between the two leads to blurred details and insufficient contrast in the fused image. It even affects the performance of downstream tasks, such as object detection [6].
There are two main groups for infrared and visible light image fusion algorithms: traditional approaches and deep learning-based methods. Traditional methods design intricate rules to enhance fusion performance, but further progress is impeded. Deep learning methods can be categorized into three main groups. The first type is founded on generative adversarial networks. Qi et al. [7] designed a discriminator with a multi-classification structure to achieve significant improvements in running speed and fused image quality. Li et al. [8] combined GAN with a relativistic discriminator to generate a more accurate and reliable fusion image. The second group is extending the image multi-scale transform. Bavirisetti et al. [9] proposed a fusion algorithm based on guided image filtering to achieve a shorter running time. Lahoud et al. [10] combined visual saliency and pre-trained neural networks for the image fusion stage, which greatly improves the operation efficiency. The third group is based on automatic encoders. Gao et al. [11] integrated the Transformer into the automatic encoder to form a fusion strategy, which solved the problem of background blur caused by aircraft fusion. Wang et al. [12] proposed a dual-branch decomposition fusion network to enhance the local contrast and detail information of the fused image. The second set of methods uses deep learning solely during the fusion stage while employing filter-based or optimization-based methods during the deconstruction stage. Hence, this research proposes a new infrared and visible light image fusion algorithm and its primary contributions as follows:
1. This paper presents a novel image fusion technique dubbed CAEFusion, which merges infrared and visible light images using a convolutional autoencoder. The algorithm has been evaluated on various public datasets and has shown remarkable performance.
2. A novel region attention module is suggested to autonomously acquire knowledge from the network and focus on critical spatial data places to enhance the accuracy and robustness of feature expression.
3. A proposed multi-scale convolution attention module is recommended to collect spatial input at several dimensions and dynamically assess the importance of features at different scales, hence enhancing the network’s ability to identify complex features.
4. Proposing a feature transformation module to enhance the interaction and merging of features by acquiring knowledge about the relationship among features, aiming to more precisely depict the underlying structure of the merged image.
This study introduces a novel infrared and visible image fusion algorithm, named CAEFusion, which utilizes a convolutional autoencoder. The algorithm consists of three components: an encoder, decoder, and fusion layer. Fig. 1 illustrates the diagrammatic representation of the algorithm framework. In Fig. 1, the input comprises an infrared image and a visible light image, both with dimensions H × W × 1, where H and W represent the height and width, respectively, and 1 denotes the number of channels in the image. The final image is the merging image generated by the utilization of the CAEFusion algorithm. Initially, the infrared and visible light images are subjected to encoding procedures to produce the background and detail feature maps, respectively. Afterwards, the background and detail feature maps from both images are merged using a fusion layer. The merginged feature map is ultimately sent to the decoder to generate the final fused image.
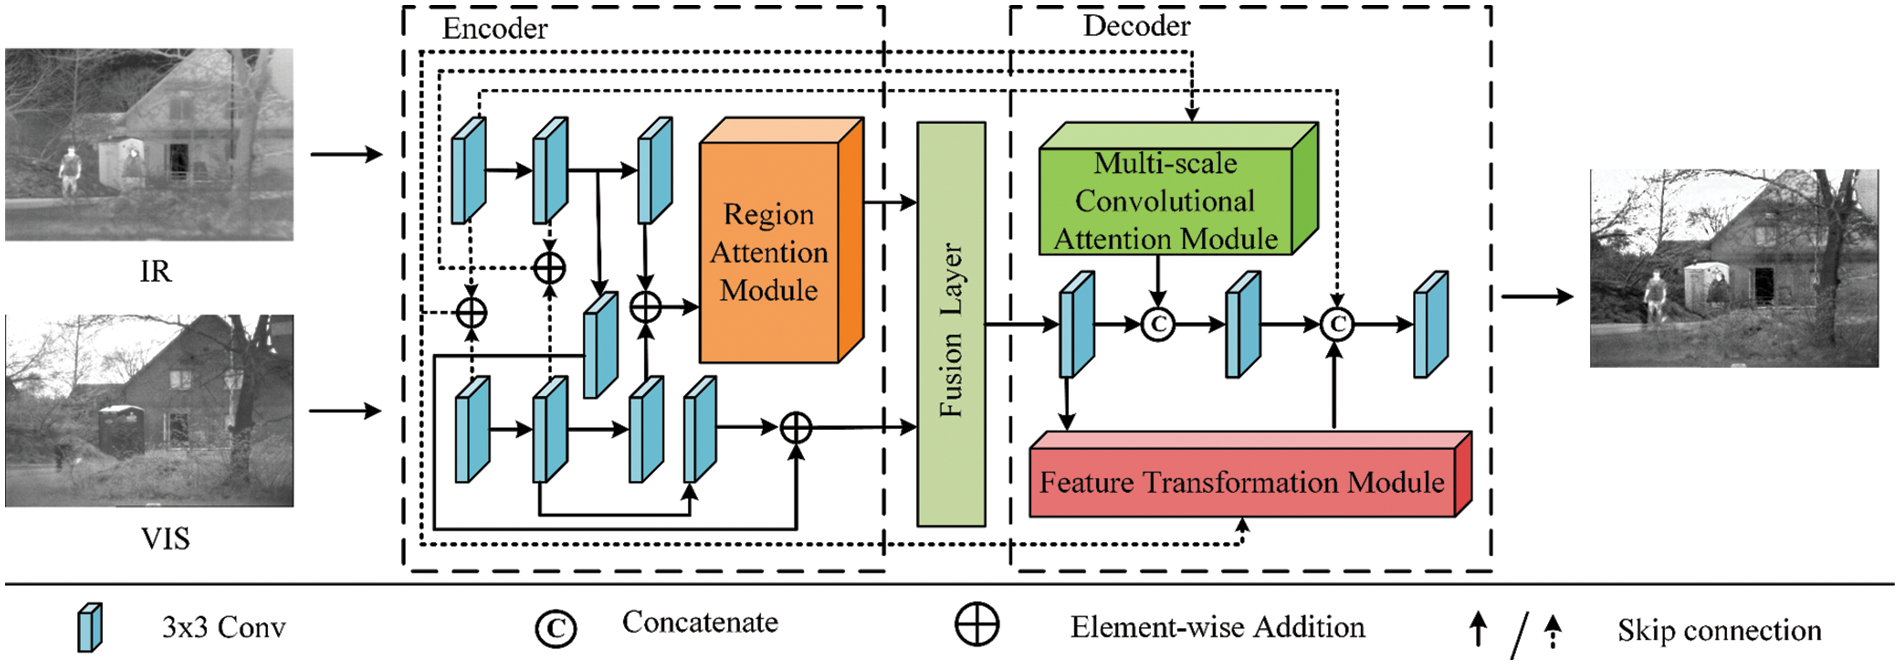
Figure 1: Neural networks framework of CAEFusion
During the training phase, this study trains the network’s encoder and decoder to use them in the test process, as shown in Fig. 2. The image is normalized to a consistent size to ensure input data uniformity before being sent to the encoder for feature extraction. Subsequently, the background and detail feature maps obtained from the encoder are merginged along the channel dimension. Finally, the merginged feature map is sent to the decoder to reconstruct the image.

Figure 2: Structure diagram of the training phase of CAEFusion
In the encoder stage, after going through three 3 × 3 convolutions in the upper and bottom branches, the input image generates feature maps using element-wise addition to integrate features from many scales and levels. The obtained feature map is passed to the region attention module to produce a background feature map that encompasses the low-frequency information of the input image. The feature map obtained from the first two 3 × 3 convolutions in the upper branch and the 3 × 3 convolution of the middle branch merges element by element with the feature map generated by the first two 3 × 3 convolutions and the subsequent fourth convolution in the lower branch, which yields detail feature maps that contain the high-frequency information in the input image.
In the decoder stage, the feature maps produced by the first two 3 × 3 convolutions in the top and bottom branches of the encoder are merginged by element-wise addition. The feature maps obtained are subsequently transmitted to the decoder’s multi-scale convolution attention module. The feature map produced by the multi-scale convolution attention module is merginged with the feature map generated by the first 3 × 3 convolution operation in the decoder along the channel dimension. After performing element-wise addition on the initial 3 × 3 convolutional feature maps from the upper and lower branches of the encoder, along with the feature map generated by the first 3 × 3 convolution operation in the decoder, the resulting feature map is sent to the feature transformation module. Then, the acquired feature maps are merged with the feature map acquired from the initial 3 × 3 convolution in the upper branch of the encoder and the feature map from the second 3 × 3 convolution in the decoder. Ultimately, the merging feature map is processed by the third 3 × 3 convolutional layer in the decoder, resulting in the final output image.
ODConv distinguishes itself from conventional convolution techniques by taking into account not only the spatial dimension of the convolution kernel but also the dimensions of the input and output channels [13]. ODConv employs a parallel methodology that integrates a multi-dimensional attention mechanism to collect supplementary attention across the four dimensions of the kernel space. This facilitates a more comprehensive utilization of the diversity and intricacy in the input data, hence simplifying the acquisition of correlation information between features during the convolution operation and enhancing feature extraction. ODConv sequentially employs four attention computation algorithms to different dimensions of the convolution kernel. The procedure is illustrated in Fig. 3 and is carried out sequentially from (a) to (d).

Figure 3: Illustration of four types of attention in ODConv multiplied by convolution kernel step by step, ⊙ denotes the multiplication operations along different dimensions of the kernel space
First, the term “(a)” denotes the element-wise multiplication of each position of the convolution kernel along the spatial dimension. This operation applies weights to the input features at different points. The term “(b)” signifies that each channel of the convolution kernel undergoes an element-wise multiplication operation along the input channel dimension to assign weights to various input channel features. The term “(c)” signifies that the channel attention multiplication is initially performed along the output channel dimension. This is followed by the element-by-element multiplication operation on each filter of the convolution kernel to achieve the feature weighting of various output channels. The convolution kernel’s core is multiplied element-wise along the output channel dimension to apply further weighting, as denoted by (d). Each attention multiplication provides a distinct perspective for examining the correlation between features in multiple dimensions, enabling ODConv to more efficiently adjust the weight of the convolution kernel and improve feature extraction.
The feature map generated using ordinary convolution lacks spatial awareness in specific regions and fails to capture local variations in features. This study utilizes ODConv as the fundamental component and a region attention module is proposed. Optimize the transfer efficiency of detailed information across different positions within the feature map and enhance the correlation between several channels to achieve more efficient features. The structure is depicted in Fig. 4. The spatial perception features and channel perception features from the input feature map obtained using1 × 1 ODConv in the upper and lower branches are merginged in the channel dimension to integrate information and improve the network’s representation capability. Next, it is sent to a 1 × 1 ODConv to produce a regional attention feature map with detailed regional information, which enhances the precision of the network’s feature extraction process.

Figure 4: The structure diagram of the region attention module
2.3 Multi-Scale Convolution Attention Module
During image fusion, the feature extraction and reconstruction process may not effectively utilize the input feature information, leading to a fused image that lacks clarity and sharpness. Multi-scale feature extraction uses numerous convolution branches with convolution kernels of varying sizes to extract feature information at various scales. This method facilitates the capture of both global and local features of the image. This paper combines multi-scale feature extraction with a multi-channel feature fusion network to propose a multi-scale convolution attention module to improve the image fusion effect. The structure is shown in Fig. 5.

Figure 5: Structure diagram of multi-scale convolution attention module
In Fig. 5, the red virtual box represents a multi-channel feature fusion network. Within the multi-channel feature fusion network, two input features undergo dimensionality reduction and mapping by 1 × 1 convolution. The upper and lower branch outputs are merged to enhance feature diversity through channel-wise addition. The features are normalized by the normalization layer to enhance the stability and convergence speed of the model. A 1 × 1 convolution is employed to refine feature information and introduce non-linear mapping. The obtained features are merged with the two input features to preserve the original information and facilitate gradient propagation during model training. The output of the multi-channel feature fusion network is initially passed through a normalization layer in the multi-scale convolution attention module to maintain feature consistency and stability. The normalized features are subsequently inputted into the parallel multi-scale convolution, which comprises convolutions of size 3 × 3 and 1 × 1. This is done to thoroughly capture feature representations of various levels and scales, encompassing a wide range of object scales and shapes. The weight of each scale feature is dynamically adjusted using addition operation, allowing the network to efficiently merge information from different scales for feature extraction. The obtained featured is inputted into the 1 × 1 convolution in both the upper and lower branches to establish a residual connection, hence enhancing the network’s capacity to represent nonlinear patterns. The output of the residual connection is transmitted to the 5 × 5 convolution layer to identify complex patterns and structures, enhancing the model’s capacity for learning.
2.4 Feature Transformation Module
Iterative convolutional operations lead to the gradual deterioration of spatial details in the feature map. Skip connections may lead to inadequate feature fusion, resulting in incomplete fusion of visual information. This study proposes a feature transformation module that incorporates nonlinear transformations to enhance the usability and adaptability of the model. The goal is to retain more semantic information when merging to create accurate and lifelike fusion images. Fig. 6 displays the structure. The input in the feature transformation module undergoes two consecutive 3 × 3 convolutions in the bottom branch to capture the semantic information of the input image globally, improving the model’s understanding of the image content. The acquired output features are merged with the residual features generated by the Bottle2neck module, using the channel dimension to enable the exchange of information. This method aims to maintain the edges in the image fusion process. The output features mentioned above are combined element by element with morphological features created by a cascade 1 × 1 convolution to create topological features. This method strengthens the visual representation of the fused image and improves the model’s robustness.

Figure 6: The structure diagram of the feature transformation module
2.5 Design of Fusion Layer and Loss Function
The algorithm proposed in the study exclusively employs the fusion layer solely during the testing phase. This study utilizes conventional summation fusion rules and concatenation processes to construct the fusion layer. Here is the detailed description:
In the formula,
More image information needs to be acquired to enhance the model’s performance in image reconstruction and feature extraction. The network structure’s total loss function during the training phase is as follows:
In the formula,
LE: The hyperbolic tangent function and L1 loss are utilized to highlight differences in background features and minimize discrepancies in detailed features. The description is as follows:
In the formula,
LD: The SSIM loss and MSE loss are weighted summation to evaluate the structural similarity and pixel-level difference between the reconstructed and the source images. The gradient sparse penalty is employed for regularization in order to maintain texture consistency, as the visible light image contains abundant texture information. Decreasing its value enhances the quality of image restoration. Here is the detailed description:
In the formula,
2.6 Time Complexity Calculation
During the training phase, we use the following assumptions: the number of training epochs is denoted as E, the number of iterations in each epoch is denoted as I, and the input image has dimensions H × W × C, where H represents the height of the input image, W represents the width of the input image, and C represents the number of input channels. The time complexity of the region attention module, multi-scale convolution attention module, and feature transformation module described in this study may be estimated as O (H × W × C). Similarly, the time complexity of the encoder and decoder is also O (H × W × C). Hence, the time complexity of the training phase of the suggested algorithm can be estimated as O ( E × I × H × W × C ).
During the testing phase, it is presumed that the test data collection contains a total of N photographs. The time complexity of the test phase in this paper is approximately O (N × H × W × C), where N is the number of test samples, H is the height of the input image, W is the width of the input image, and C is the number of input channels. The input image has dimensions H × W × C.
The CAEFusion algorithm’s performance is assessed using the TNO, FLIR, and NIR datasets in this study [14–16]. The datasets encompass various scenarios and settings, facilitating a thorough assessment of the algorithm’s suitability and robustness. The M3FD dataset was used for object detection experiments to confirm the suitability of the CAEFusion method in downstream tasks [17]. This paper’s algorithm relies on the PyTorch framework. The experiment utilized a 2.60 GHz Intel Xeon Platinum 8350 C CPU and NVIDIA RTX A5000 hardware with a 24 GB memory capacity. The system operates on the Ubuntu 18.04 operating system.
TNO contains the multispectral nighttime impacts across various military-related situations. FLIR includes 221 aligned visible light and infrared image pairs, displaying various scenarios of highways, vehicles, pedestrians, and other elements. The NIR collection has 477 photos categorized into nine groups: country, field, forest, mountain, old building, street, urban, and water. M3FD includes high-resolution infrared and visible light images. There are annotations for six types of 33,603 objects: people, car, bus, motorcycle, lamp, and truck.
In this paper, information entropy (EN), standard deviation (SD), spatial frequency (SF), and average gradient (AG) are used to evaluate the quality of the fused image.
EN: The information content of the fused image is determined by examining the distribution of gray-scale value in the image. The mathematical expression is as follows:
In the formula,
SD: Evaluate the image’s contrast. The mathematical expression is as follows:
In the formula,
SF: The image’s spatial domain activity is measured to determine its capacity to capture fine details. The mathematical expression is as follows:
In the formula,
AG: Measure the image’s edge richness and level of detail. The mathematical expression is as follows:
In the formula,
This study assesses the efficacy of object detection in the object detection task stage using mean Average Precision (mAP) and evaluates it at an IoU thresholding of 0.5. The precise mathematical equations are as follows:
In the formula,
In the training phase, Adam optimized the network for 120 epochs, and the batch size was set to 16. The learning rate is set to 10−3, which is reduced by ten times per 40 epochs. The tuning parameters in the loss function are empirically set as follows: α1 = 0.5, α2 = 2, α3 = 2, α4 = 10, and λ = 5. The correlation between the loss function and epoch is illustrated in Fig. 7. Fig. 7 demonstrates that after 120 epochs, all the loss curves tend to be stable, demonstrating that the network can converge through this setup.

Figure 7: Loss curves during the training phase
The proposed algorithm is compared with DATFuse, YDTR, SwinFusion, SeAFusion, and LDRepFM on the TNO, FLIR, and NIR datasets [18–22]. The selected photographs from datasets are visually inspected and analyzed to assess the disparities in fusion performance among various algorithms. Red and green boxes highlight the prominent areas in each fused image. Fig. 8 displays the experimental results of the TNO dataset. By examining the contents of the red box in the fused image: The mound texture in the DATFuse, YDTR, and LDRepFM algorithms is observed to be blurred. The mound texture of the SwinFusion and SeAFusion algorithms is more distinct; however, there are still areas with indistinct boundaries. The proposed algorithm accurately represents the textural features of the gully edge on the mound and enhances the natural brightness of the image. Observing the branches inside the green box: The SwinFusion, SeAFusion, and LDRepFM algorithms tend to excessively prioritize the content of the infrared image, resulting in distortion in the fused image. The boundaries between the branches of DATFuse and YDTR algorithms are indistinct. Conversely, the branch edges of the proposed algorithm are distinct and natural.

Figure 8: Experimental results on the TNO dataset
The experimental results of the FLIR dataset are shown in Fig. 9. Regarding the cables in the red box: The DATFuse and LDRepFM algorithms demonstrate a preference for the visible light image, leading to the failure to recover the presence of wires. The YDTR and SeAFusion algorithms effectively recover the wire’s shape, although there are some blurred. The wire of SwinFusion resembles the algorithm proposed in this work. The wire of the proposed approach provides a more distinct subjective visual impression. For the automobile part in the green box: The edge features of the car wheels in the DATFuse, YDTR, and SeAFusion algorithms are indistinct. While the SwinFuse algorithm has more refined wheel details compared to the algorithms mentioned above, they are still vague. The proposed algorithm is comparable to SwinFuse and even better in contour clarity. Yet, the proposed algorithm cannot depict wheel details as distinctly as the LDRepFM algorithm.

Figure 9: Experimental results on FLIR dataset
Fig. 10 displays the experimental results of the NIR dataset. Regarding the mountain part in the red box: Certain information is absent because the DATFuse and LDRepFM algorithms favour visible light images. The YDTR, SwinFuse, and SeAFuse algorithms fail to adequately depict the complex features of the mountain, including the nuanced variations between bright and dark areas. The proposed algorithm effectively highlights the textural intricacies of the light-dark transitions on the mountain. Regarding the cloud’s shape in the green box: The DATFuse, YDTR, SwinFuse, SeAFuse, and LDRepFM algorithms demonstrate different degrees of information loss, resulting in incomplete restoration of the entire cloud structure. In contrast to the previously mentioned algorithm, the suggested algorithm’s cloud representation merges data from both infrared and visible light photographs to provide a comprehensive depiction of the cloud’s whole structure.

Figure 10: Experimental results on NIR dataset
The experimental results demonstrate that the fused image generated by the proposed method greatly enhances the visual quality of natural landscapes, including mountains, clouds, trees, and automobiles. The proposed algorithm efficiently selects and processes complex data from both infrared and visible light sources to generate a fused image. By properly merging the two, it produces high-resolution images with distinct boundaries, rich textures, and authentic brightness, resulting in a favourable subjective impression on viewers.
Quantitative comparison between the proposed algorithm and DATFuse, YDTR, SwinFusion, SeAFusion, and LDRepFM on three datasets in this section. The TNO dataset’s experimental results are displayed in Table 1. The table data clearly demonstrate that the proposed algorithm attains the highest value across four metrics. More precisely, the EN measure exceeds the second-highest SeAFusion approach by exactly 0.0692 points. The SD metric is 10.285 points greater than the second-highest LDRepFM algorithm. The SF metric surpasses the second-highest SwinFuse method by 2.266 points. The AG metric exceeds the second-highest SeAFusion algorithm by 0.7465 points.

Table 2 displays the experimental findings from the FLIR dataset. The table statistics clearly demonstrate that the algorithm described in this study reaches the highest values in four criteria. The EN metric is 0.3018 points greater than the SeAFusion algorithm which is the second-highest. The SD metric exceeds the second-highest LDRepFM method by 5.8854 points. The SF metric surpasses the second-highest SeAFusion algorithm by 2.9885 points, while the AG metric exceeds the second-highest SeAFusion method by 0.5114 points.

Table 3 displays the experimental results of the NIR dataset. The suggested algorithm achieves the second highest ranking in the EN metric and surpasses the performance of the other five algorithms in three criteria. The SD metric exceeds the second-highest SwinFusion algorithm by 13.9006 points. The SF metric exceeds the second-highest SwinFusion algorithm by 8.5326 points. The AG metric is 2.5652 points greater than the second-highest SwinFusion algorithm.

The aforementioned experimental results illustrate that the suggested algorithm excels in various elements of fused image quality, resulting in a fused image that exhibits enhanced clarity, intricate details, and a harmonious distribution of brightness.
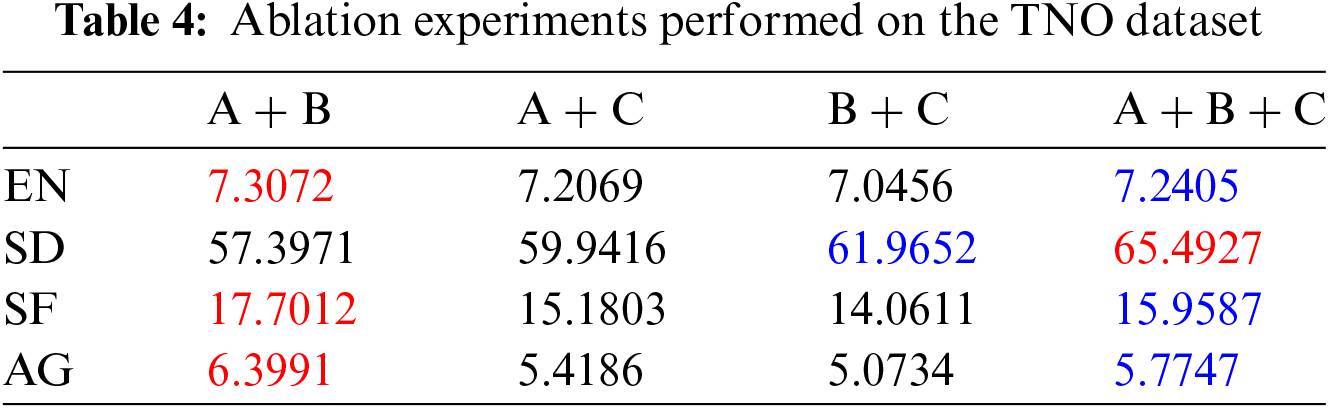
In this section, A represents the region attention module, B represents the multi-scale convolution attention module, and C represents the feature transformation module. The efficiency of the suggested three modules is validated through ablation experiments done on the TNO dataset. The experimental results are shown in Table 4. In Table 4, the red marker with the highest value and the blue marker with the second-highest value are used in this section. The data in the table shows that incorporating the C module into the A + B module results in a modest fall in the EN, SF, and AG metrics compared to the A + B module, while the SD metric increases by 8.0956 points. In general, the combined average of the four metrics in module A + B + C is higher than that of the A + B module. By integrating the B module into the A + C module, the four metrics show improvement compared to using simply the A + C module. After adding A module, which is based on B + C, the four metrics demonstrate enhancement compared to using only B + C. In general, the introduction of new modules may cause a slight decrease in certain metrics. However, the overall impact of the three modules can greatly improve the quality of fused images.
3.7 Object Detection Experiment
This article employs mean average precision (mAP) as a measure to assess detection performance, with an Intersection over Union (IoU) threshold of 0.5. Fig. 11 displays the experimental outcomes. The suggested method outperforms the five fusion methods with the best top-2 accuracy across many categories, ranking first on average across all categories and showing more stable overall performance. The experimental results unambiguously demonstrate that the fusion algorithm described in this research offers substantial benefits for improving the capability of downstream object object detection tasks.

Figure 11: The experimental outcomes of object detection utilizing M3FD
The paper introduces the CAEFusion algorithm, which infrared and visible light image fusion through a convolutional autoencoder. The approach utilizes a region attention module that consists of dynamic convolution to enhance the perception of spatial information in various places. The multi-scale convolution attention module broadens the network’s receptive field range and improves its effectiveness in utilizing image information. The CAEFusion algorithm incorporates semantic features through the feature transformation module to direct the fusion process, improve the structural coherence of the original image more effectively, and minimize information loss. As demonstrated by the above experiments, the CAEFusion algorithm outperforms other algorithms in terms of edge identification and brightness balance. This algorithm enhances the clarity and visibility of the fused image, effectively improving its quality. Meanwhile, the proposed algorithm’s potential in several applications, including object detection and recognition and environmental monitoring, is confirmed. However, this algorithm has several limitations. In future development, it is necessary to address the following issues: (1) The algorithm model presented in this paper exhibits potential issues with overfitting. To address this, future work could focus on making the model more lightweight using techniques such as data augmentation or unstructured pruning. (2) In future research, the technique presented in this study could be expanded upon by integrating the fusion algorithm with 3D image processing technologies. This integration has the potential to enhance the visualization and understanding of 3D scenes. (3) There is a significant disparity between the current public data sets and the data distribution of particular situations. Adding data collection in future studies would enhance the evaluation of the model’s performance across various circumstances.
Acknowledgement: Thanks to the providers of TNO, FLIR, NIR, and M3FD datasets [14–17].
Funding Statement: The authors received no specific funding for this study.
Author Contributions: Study conception and design: Chun-Ming Wu, Mei-Ling Ren; data collection, analysis, and interpretation of results: Jin Lei, Zi-Mu Jiang; draft manuscript preparation: Mei-Ling Ren. All authors reviewed the results and approved the final version of the manuscript.
Availability of Data and Materials: The data and materials used to support the findings of this study are available from the corresponding author upon request.
Conflicts of Interest: The authors declare that they have no conflicts of interest to report regarding the present study.
References
1. M. Feng and J. Su, “Sparse mixed attention aggregation network for multimodal images fusion tracking,” Eng. Appl. Artif. Intell., vol. 127, no. 7, pp. 107273, 2024. doi: 10.1016/j.engappai.2023.107273. [Google Scholar] [CrossRef]
2. J. Li, X. Wu, P. Liao, H. Song, X. Yan and R. Zhang, “Robust registration for infrared and visible images based on salient gradient mutual information and local search,” Infrared Phys. Technol., vol. 131, no. 9, pp. 104711, 2023. doi: 10.1016/j.infrared.2023.104711. [Google Scholar] [CrossRef]
3. C. M. Wu, W. K. Liu, and X. Ma, “Infrared and visible image fusion based on Res2Net-Transformer automatic encoding and decoding,” Comput. Mater. Contin., vol. 79, no. 1, pp. 1441–1461, 2024. doi: 10.32604/cmc.2024.048136. [Google Scholar] [CrossRef]
4. K. Bhalla, D. Koundal, S. Bhatia, M. K. I. Rahmani, and M. Tahir, “Fusion of infrared and visible images using fuzzy based siamese convolutional network,” Comput. Mater. Contin., vol. 70, no. 3, pp. 5503–5518, 2022. doi: 10.32604/cmc.2022.021125. [Google Scholar] [CrossRef]
5. S. X. Liu et al., “Real-time implementation of hybrid visible light/infrared communications supporting full-range dynamic dimming control,” IEEE Photonics J., vol. 16, no. 1, pp. 1–14, 2024. doi: 10.1109/JPHOT.2024.3353776. [Google Scholar] [CrossRef]
6. Z. Shi, W. R. Song, J. H. Shan, and F. Liu, “Augmented deep multi-granularity pose-aware feature fusion network for visible-infrared person re-identification,” Comput. Mater. Contin., vol. 77, no. 3, pp. 3467–3488, 2023. doi: 10.32604/cmc.2023.045849. [Google Scholar] [CrossRef]
7. Q. Jin et al., “Visible and infrared image fusion of forest fire scenes based on generative adversarial networks with multi-classification and multi-level constraints,” Forests, vol. 14, no. 10, pp. 1952, 2023. doi: 10.3390/f14101952. [Google Scholar] [CrossRef]
8. Q. L. Li et al., “Coupled GAN with relativistic discriminators for infrared and visible images fusion,” IEEE Sens. J., vol. 21, no. 6, pp. 7458–7467, 15 Mar. 2021. doi: 10.1109/JSEN.2019.2921803. [Google Scholar] [CrossRef]
9. D. P. Bavirisetti, G. Xiao, J. H. Zhao, R. Dhuli, and G. Liu, “Multi-scale guided image and video fusion: A fast and efficient approach,” Circuits Syst. Signal Process, vol. 38, no. 12, pp. 5576–5605, 2019. doi: 10.1007/s00034-019-01131-z. [Google Scholar] [CrossRef]
10. F. Lahoud and S. Susstrunk, “Fast and efficient zero-learning image fusion,” arXiv preprint arXiv:1905.03590, 2019. [Google Scholar]
11. X. Gao, Y. Shi, Q. Zhu, Q. Fu, and Y. Wu, “Infrared and visible image fusion with deep neural network in enhanced flight vision system,” Remote Sens., vol. 14, no. 12, pp. 2789, 2022. doi: 10.3390/rs14122789. [Google Scholar] [CrossRef]
12. X. J. Wang, J. X. Zhang, Y. Tao, X. L. Yuan, and Y. F. Guo, “BDPartNet: Feature decoupling and reconstruction fusion network for infrared and visible image,” Comput. Mater. Contin., vol. 79, no. 3, pp. 4621–4639, 2024. doi: 10.32604/cmc.2024.051556. [Google Scholar] [CrossRef]
13. C. Li, A. J. Zhou, and A. B. Yao, “Omni-dimensional dynamic convolution,” arXiv preprint arXiv:2209.07947, 2022. [Google Scholar]
14. A. Toet and M. A. Hogervorst, “Progress in color night vision,” Opt. Eng., vol. 51, no. 1, pp. 1–20, 2012. doi: 10.1117/1.OE.51.1.010901. [Google Scholar] [CrossRef]
15. H. Xu, J. Y. Ma, Z. L. Le, J. J. Jiang, and X. J. Guo, “FusionDN: A unified densely connected network for image fusion,” The Thirty-Fourth AAAI Conf. Artif. Intell. (AAAI-20), vol. 34, no. 7, pp. 1–8, Palo Alto, CA, USA, 2020. doi: 10.1609/aaai.v34i07.6936. [Google Scholar] [CrossRef]
16. M. Brown and S. Süsstrunk, “Multi-spectral SIFT for scene category recognition,” in Conf. Comput. Vis. Pattern Recognit. (CVPR), Colorado Springs, CO, USA, 2011, pp. 177–184. [Google Scholar]
17. J. Liu et al., “Target-aware dual adversarial learning and a multiscenario multi-modality benchmark to fuse infrared and visible for object detection,” in 2022 IEEE/CVF Conf. Comput. Vis. Pattern Recognit. (CVPR), New Orleans, LA, USA, 2022, pp. 5792–5801. [Google Scholar]
18. W. Tang, F. He, Y. Liu, Y. Duan, and T. Si, “DATFuse: Infrared and visible image fusion via dual attention transformer,” IEEE Trans. Circuits Syst. Video Technol., vol. 33, no. 7, pp. 3159–3172, Jul. 2023. doi: 10.1109/TCSVT.2023.3234340. [Google Scholar] [CrossRef]
19. W. Tang, F. He, and Y. Liu, “YDTR: Infrared and visible image fusion via Y-shape dynamic transformer,” IEEE Trans. Multimed., vol. 25, pp. 5413–5428, 2023. doi: 10.1109/TMM.2022.3192661. [Google Scholar] [CrossRef]
20. J. Ma, L. Tang, F. Fan, J. Huang, X. Mei and Y. Ma, “SwinFusion: Cross-domain long-range learning for general image fusion via swin transformer,” IEEE/CAA Journal of Automatica Sinica, vol. 9, no. 7, pp. 1200–1217, Jul. 2022. doi: 10.1109/JAS.2022.105686. [Google Scholar] [CrossRef]
21. L. F. Tang, J. T. Yuan, and J. Y. Ma, “Image fusion in the loop of high-level vision tasks: A semantic-aware real-time infrared and visible image fusion network,” Inf. Fusion, vol. 82, no. 10, pp. 28–42, 2022. doi: 10.1016/j.inffus.2021.12.004. [Google Scholar] [CrossRef]
22. M. Lu, M. Jiang, J. Kong, and X. Tao, “LDRepFM: A real-time end-to-end visible and infrared image fusion model based on layer decomposition and re-parameterization,” IEEE Trans. Instrum. Meas.,vol. 72, pp. 1–12, 2023. doi: 10.1109/TIM.2023.3329222. [Google Scholar] [CrossRef]
Cite This Article
 Copyright © 2024 The Author(s). Published by Tech Science Press.
This work is licensed under a Creative Commons Attribution 4.0 International License , which permits unrestricted use, distribution, and reproduction in any medium, provided the original work is properly cited.
 Downloads
 Citation Tools