
 Submit a Paper
 Propose a Special lssue
 Open Access
ARTICLE

Fortifying Smart Grids: A Holistic Assessment Strategy against Cyber Attacks and Physical Threats for Intelligent Electronic Devices
1 School of Computer Science, Zhengzhou University of Aeronautics, Zhengzhou, 450046, China
2 Henan Xin'an Century Technology Co., Ltd., Henan Data Security Engineering Technology Research Center, Zhengzhou, 450046, China
3 Key Laboratory of Aerospace Information Security and Trusted Computing, Ministry of Education, School of Cyber Science and Engineering, Wuhan University, Wuhan, 430072, China
* Corresponding Author: June Li. Email:
(This article belongs to the Special Issue: Best Practices for Smart Grid SCADA Security Systems Using Artificial Intelligence (AI) Models)
Computers, Materials & Continua 2024, 80(2), 2579-2609. https://doi.org/10.32604/cmc.2024.053230
Received 28 April 2024; Accepted 08 July 2024; Issue published 15 August 2024
 View Full Text
 Download PDF
Abstract
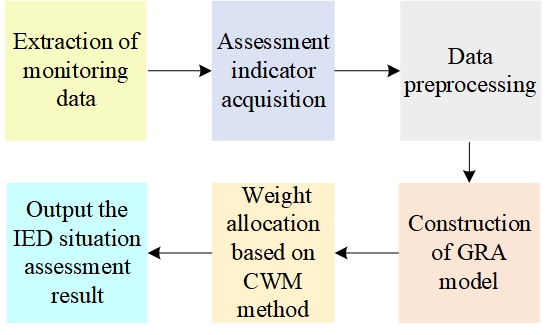
Intelligent electronic devices (IEDs) are interconnected via communication networks and play pivotal roles in transmitting grid-related operational data and executing control instructions. In the context of the heightened security challenges within smart grids, IEDs pose significant risks due to inherent hardware and software vulnerabilities, as well as the openness and vulnerability of communication protocols. Smart grid security, distinct from traditional internet security, mainly relies on monitoring network security events at the platform layer, lacking an effective assessment mechanism for IEDs. Hence, we incorporate considerations for both cyber-attacks and physical faults, presenting security assessment indicators and methods specifically tailored for IEDs. Initially, we outline the security monitoring technology for IEDs, considering the necessary data sources for their security assessment. Subsequently, we classify IEDs and establish a comprehensive security monitoring index system, incorporating factors such as running states, network traffic, and abnormal behaviors. This index system contains 18 indicators in 3 categories. Additionally, we elucidate quantitative methods for various indicators and propose a hybrid security assessment method known as GRCW-hybrid, combining grey relational analysis (GRA), analytic hierarchy process (AHP), and entropy weight method (EWM). According to the proposed assessment method, the security risk level of IEDs can be graded into 6 levels, namely 0, 1, 2, 3, 4, and 5. The higher the level, the greater the security risk. Finally, we assess and simulate 15 scenarios in 3 categories, which are based on monitoring indicators and real-world situations encountered by IEDs. The results show that calculated security risk level based on the proposed assessment method are consistent with actual simulation. Thus, the reasonableness and effectiveness of the proposed index system and assessment method are validated.Graphic Abstract
Keywords
Intelligent electronic devices (IEDs) in smart grids are devices that function as power monitoring, metering, protection, control, and communications [1–5]. Deploying IEDs is an inevitable trend to enable advanced power automation. However, IEDs have brought significant security risks to smart grids due to the complex application, diverse functional types, and unsound credibility mechanisms[6–9]. If attackers gain control of IEDs, they can obtain and manipulate relevant data, perform malicious operations, bypass professional protection, launch attacks on a global scale, and potentially cause severe consequences [10–13], such as the blackouts in Ukraine and Venezuela [14–18]. Therefore, ensuring the secure operation of IEDs has been recognized as a crucial issue for power grids.
The assessment of IEDs’ safety state can help operation and maintenance personnel in monitoring the real-time operating state of IED, detecting device anomalies, and taking preventive measures to avoid potential security risks, thereby ensuring the safe and stable operation of the power system. Currently, IEDs in smart grids have various types, multiple communication protocols (such as Modbus, DNP3, IEC 61850, IEC 60870, and DL/T 698.45), and a large number of nodes. Additionally, the impact of IEDs on the smart grid differs in various business scenarios when they are attacked [19–22] Traditional security assessment methods based on network traffic are inadequate in providing a comprehensive analysis of IEDs. This situation highlights the urgent need for a more practical and reasonable security assessment method for evaluating the operation state of IED.
To assess and enhance IEDs’ security, researchers have conducted extensive studies on power grid security, categorizing their work into three levels: device, system, and protocol.
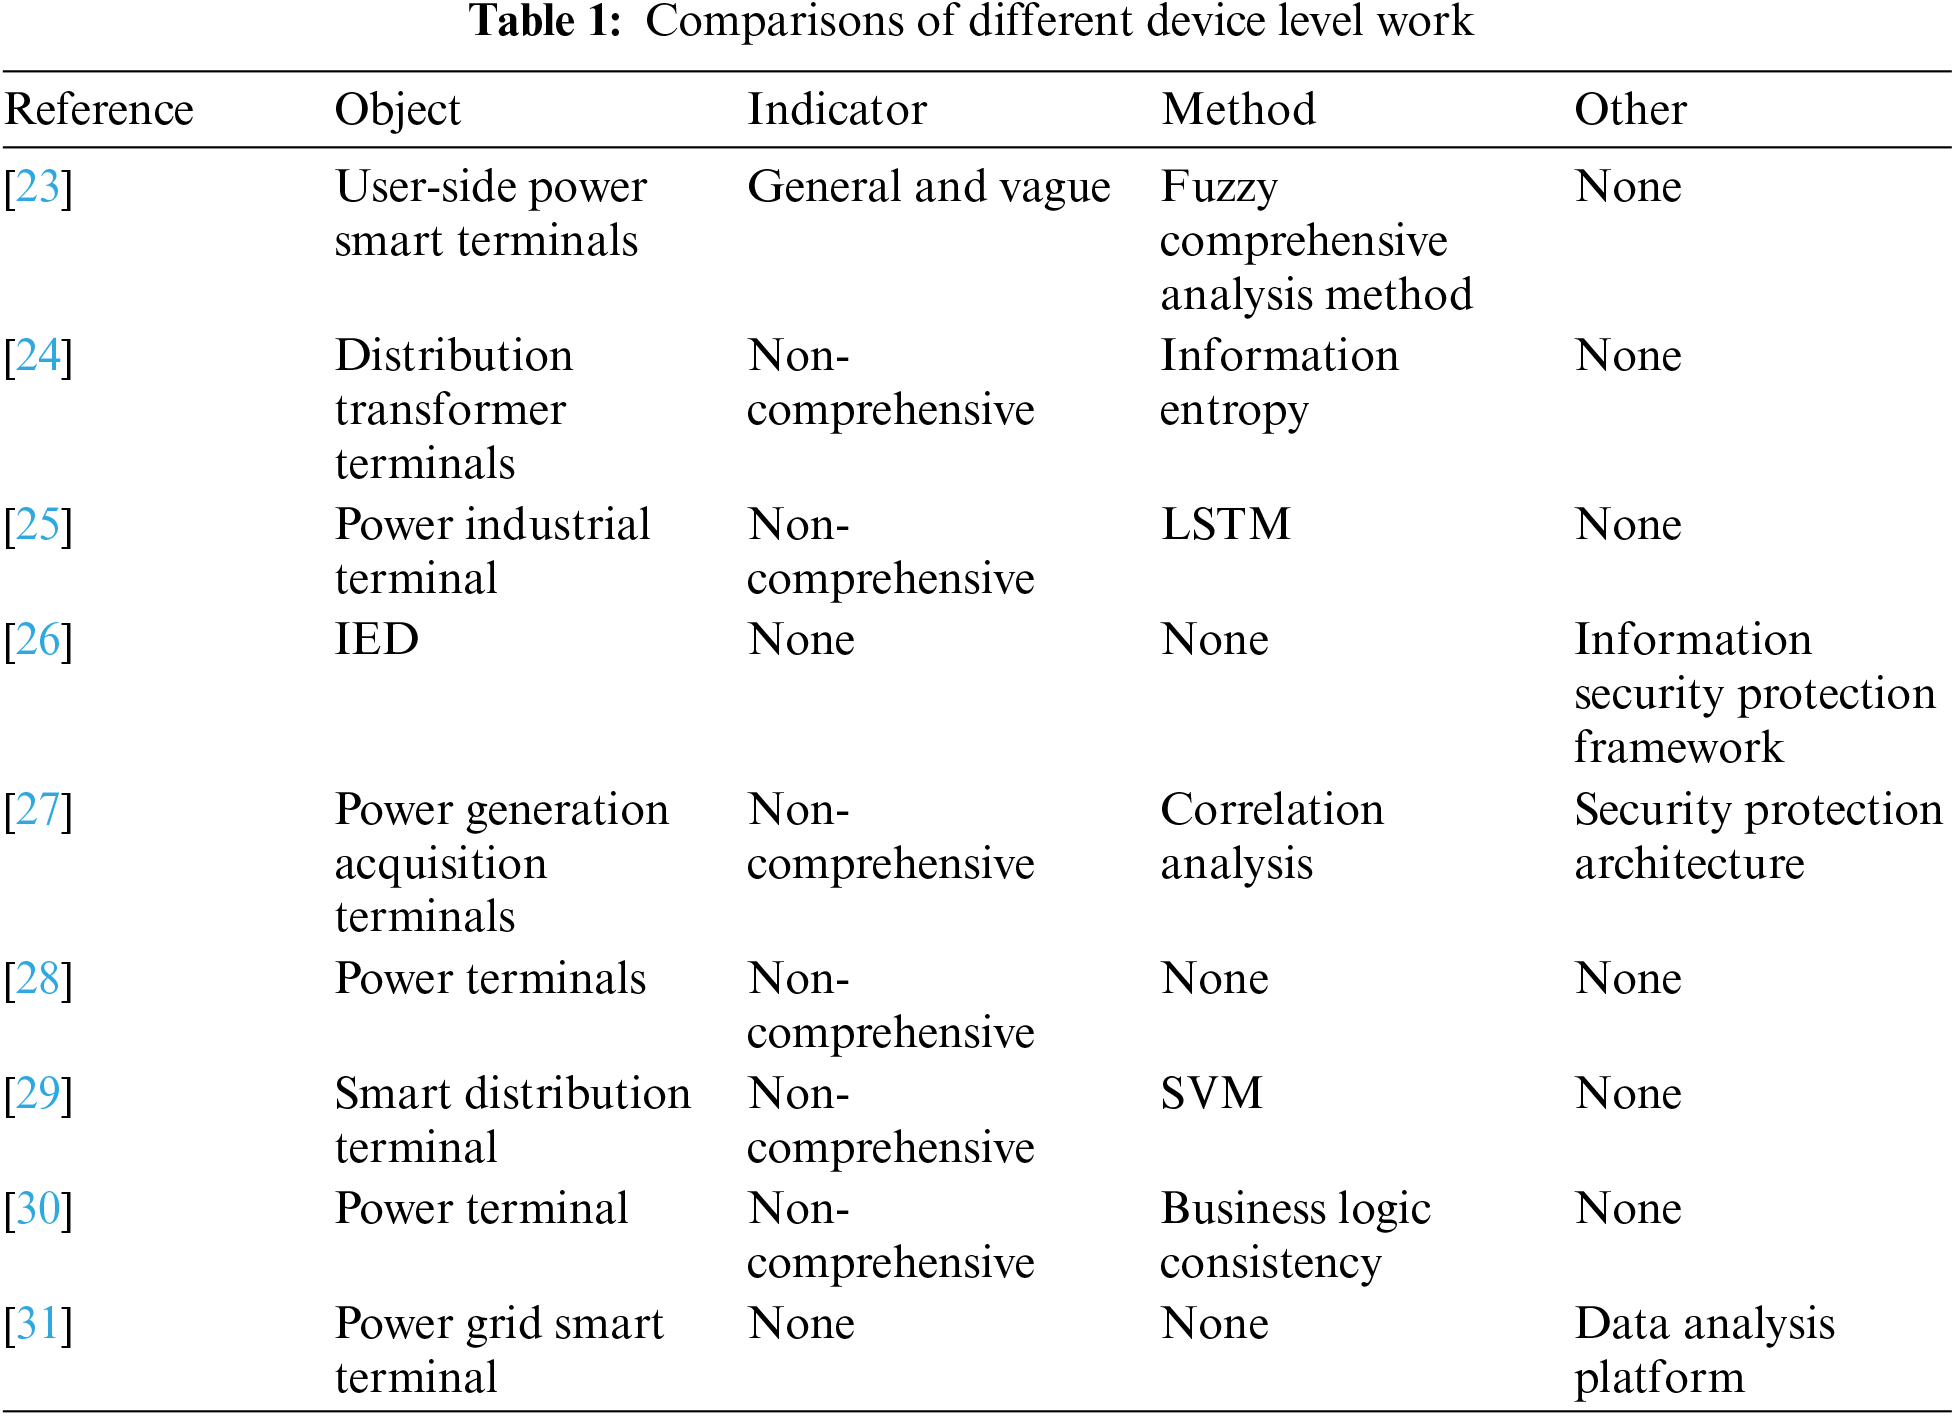
At the device level, reference [23] designed a security evaluation index system for user-side power smart terminals that function in electricity metering, incident alarm, and quality monitoring. Meanwhile, fuzzy comprehensive analysis method is introduced to the security analysis of power smart terminals. While, this work only targets specific terminals, and indicators are general and vague. Reference [24] proposed a security situation assessment method based on information entropy for intelligent distribution transformer terminals. However, the testing indexes include only peak traffic, power consumption, and alarm events, which are not comprehensive. To predict the running states of power industrial terminal, reference [25] proposed an anomaly detection method based on long short-term memory (LSTM) neural network and used the open Numenta Anomaly Benchmark (NAB) data for algorithm verification. Reference [26] constructed an information security protection research framework of power systems covering the chip layer, terminal layer, and interactive layer, laying a foundation for further research on IEDs’ security protection. Reference [27] constructed a security protection architecture, risk evaluation index system, and evaluation model for power generation acquisition terminals in a new energy plant (PGATNEP), thus realizing the quantitative evaluation of PGATNEP and improving the cyber security defense capability of PGATNEP. Based on the three levels of terminal itself security, terminal network security and terminal business application security, reference [28] established quantitative indicators for analyzing the impact of power terminals after being attacked, so as to determine the depth and breadth of the impact of the attack on power terminals and provide a realistic basis for the next defense measures. Reference [29] analyzed the main security problems faced by the smart distribution terminal deployed in the distribution station and proposed an support vector machine (SVM)-based smart distribution terminal security situation assessment method. This work used the similar indexes to reference [24] (i.e., peak traffic, power consumption, and alarm events). Reference [30] proposed a power terminal security monitoring method based on business logic consistency, which can effectively correlate “time label”, “equipment status characteristics” and “business processes”, and realize security monitoring of power industrial control terminals from the business level. However, the indicators only include energy consumption, voltage, current, and memory usage. Reference [31] designed a data analysis platform based on data mining for the power grid smart terminal and the platform can be used for performing various experiments, e.g., security assessment. Table 1 shows the comparisons of device level work.
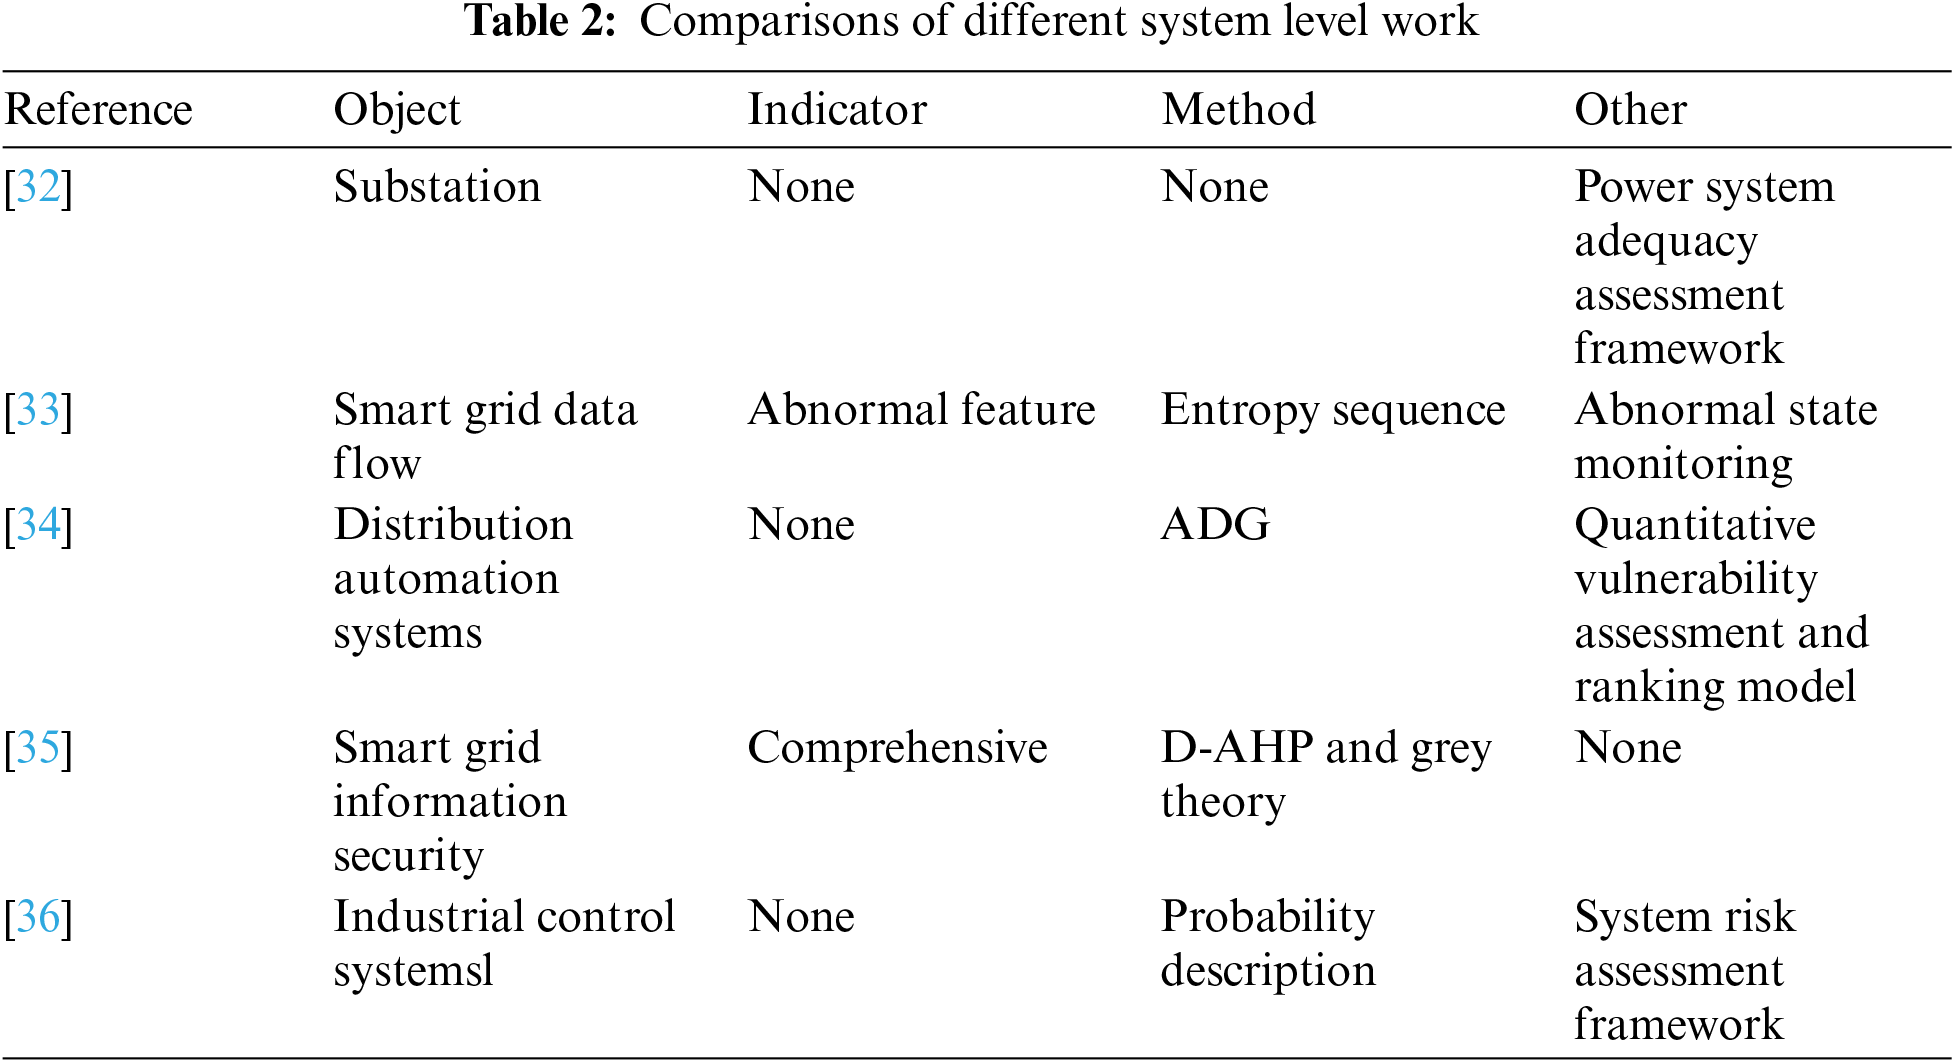
At the system level, to quantify the effect of substation cyber vulnerabilities on power supply adequacy, reference [32] proposed a holistic power system adequacy assessment framework considering cyber-attacks. In this framework, the consecutive attack and individual attack are modeled by Markov game and static game, respectively. Aiming at the problems of slow monitoring speed and low accuracy of current power grid monitoring methods, reference [33] proposed a smart grid data flow abnormal state monitoring method based on entropy sequence, which has high monitoring accuracy and strong practicability. Reference [34] proposed a novel quantitative vulnerability assessment and ranking model for distribution automation systems (DAS). This model can be used for analyzing the potential consequences of cyber-attacks. In addition, the attack processes are modeled as a series of attack-defense games (ADGs) and relationships among different vulnerabilities are analyzed by introducing vulnerability adjacency matrix. Based on this, the operators can rank the vulnerabilities and take corresponding measures to enhance the cyber security of the DAS. Reference [35] established a smart grid information security risk assessment (ISRA) method combining the D-AHP method and the Grey theory method. This work established a smart grid ISRA system according to the characteristics and development reality of smart grid technology. The proposed system includes 5 first-level indexes as an intelligent terminal, a wireless communication channel, password security, application code and embedded system, and corresponding 13 secondary indexes. Reference [36] achieved holistic system risk assessment in the smart terminal process for industrial control systems based on probability description. Table 2 shows the comparisons of system level work.
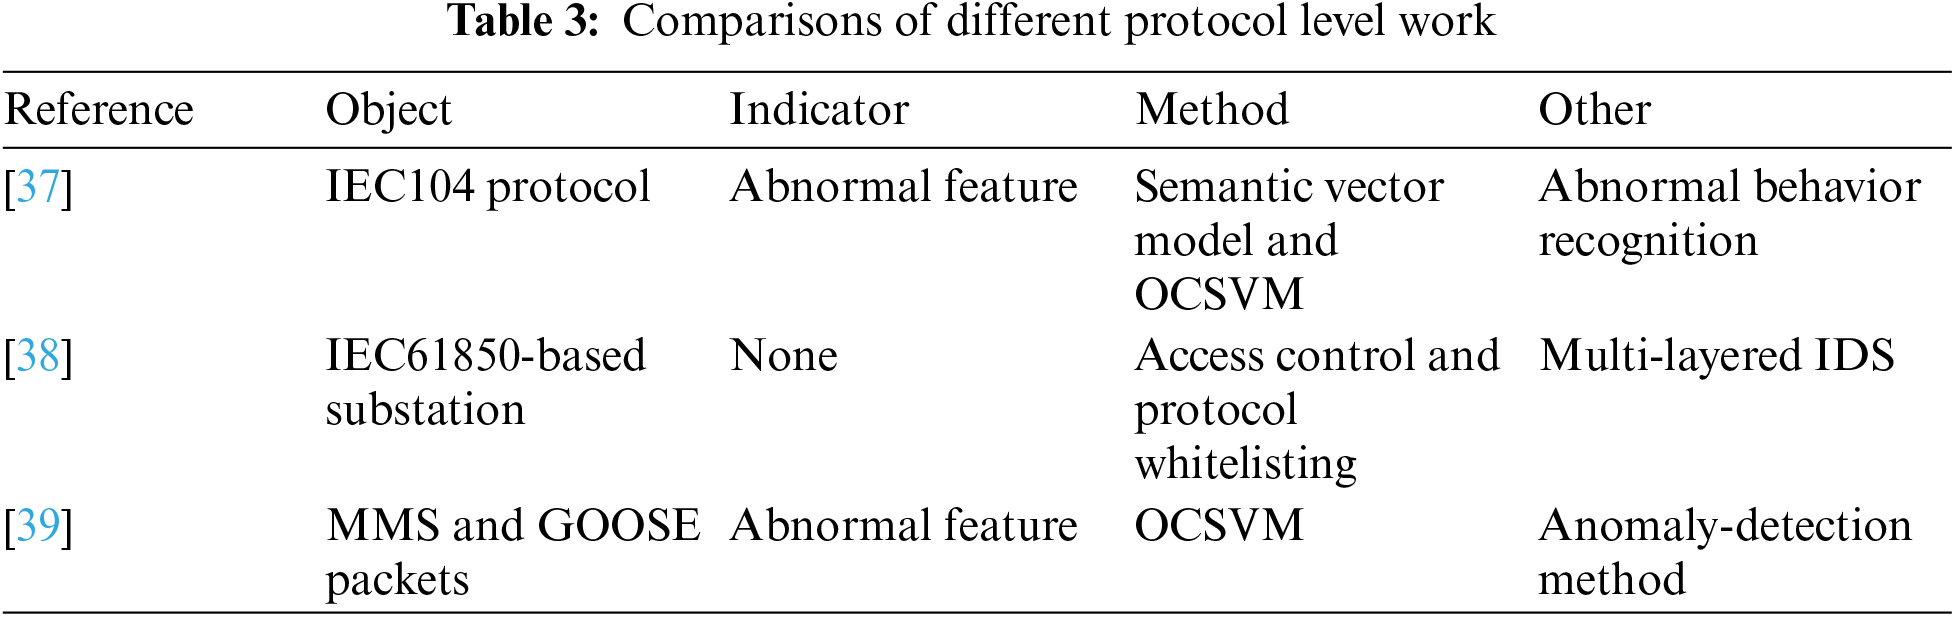
At the protocol level, reference [37] used time window division and deep packet inspection to transform the content of end-to-end communication in an actual production environment into a sequence of control actions. Then, according to the control protocol’s semantic features, semantic vector model and One Class SVM (OCSVM) are used for realizing the construction of an abnormal behavior recognition model. However, this model is limited to the IEC104 protocol. Reference [38] proposed a multi-layered intrusion detection system (IDS) tailored for the cyber security of IEC 61850-based substations. The proposed IDS consisted of access control detection, protocol whitelisting detection, model-based detection, and multi parameter-based detection. It offers a significant advancement in protecting modern substations against cyber-attacks. Reference [39] proposed an anomaly-detection method for MMS and GOOSE packets based on OCSVM. This method including three steps, i.e., 3-phase preprocessing, normal behavior learning, and anomaly detection. The 3-phase preprocessing (single packet process, sequence packet process, and packet traffic process) is used for grouping MMS and GOOSE packets into different sets of data. Table 3 shows the comparisons of protocol level work.
Based on the above analysis, there are some concerns about current studies. (1) The research object is relatively simple, and the assessment methods are difficult to be directly applied to the security assessment of complex and diverse IEDs. (2) Current security assessment methods are mainly a combination of network traffic analysis and machine learning methods, lacking the analysis of abnormal behaviors of IEDs. Above all, few schemes can be directly used for assessing the security of IEDs in smart grids. Hence, it is essential to propose a security assessment method, which integrates multiple factors and has wide applicability, for IEDs in smart grid.
The paper presents significant contributions to the field of IED security monitoring and assessment in smart grids.
(1) IEDs are categorized into four categories based on their encryption status and control capabilities. This classification enables a more efficient security assessment of various IED types by taking into account their inherent characteristics and vulnerabilities in the communication environment.
(2) A comprehensive security monitoring index system is constructed for IED, comprising monitoring indicators related to the running state, network traffic, and abnormal behaviors of IEDs. By incorporating diverse data from IED monitoring points, the index system covers various aspects of IED security, including terminal operation, network, and behavior security. This ensures a holistic evaluation of IED security.
(3) Quantitative methods are introduced for evaluating IED security using the established monitoring index system. Seven security assessment index values are determined, including factors like security risk levels in IED running state, network traffic volatility, and frequency of specific cyber-attacks. These indices serve as a foundation for further security assessment and analysis of IEDs.
(4) When quantifying frequency of specific cyber-attacks, this paper innovatively proposed message data length checking method based on ASN.1 syntax encapsulation, context data length quantification method based on the IEC61850 data model, whitelist access control method based on service source address, and GOOSE message configuration information check method based on SCD File. These methods are implemented by checking the syntax and semantic features of service messages, and extracting the application layer content (e.g., service type, service data fields, and addresses) of messages.
(5) A novel IED security assessment method, called the GRCW-hybrid method, is introduced. This method integrates Grey relational analysis (GRA), analytic hierarchy process (AHP), and entropy weight method (EWM). The rationality and effectiveness of the proposed monitoring indicators and assessment method are validated through a case study.
The rest of this paper is organized as follows. In Section 2, security monitoring technologies for IEDs are analyzed, IEDs are classified, and a security monitoring index system for IEDs is built. In Section 3, the quantitative methods for three types of security monitoring indicators, namely, running state, network traffic, and abnormal behaviors are presented. In Section 4, an IEDs security assessment method, which combines GRA, AHP, and EWM, is proposed. In Section 5, the rationality of the proposed monitoring indicators and security assessment method is verified through a case study. In Section 6, a summary and a future outlook are given.
2 Monitoring Indicators for IEDs Security Assessment
Unlike devices on the Internet, the electric power services provided by IEDs in the smart grid have stringent real-time and continuous requirements, directly impacting the secure operation of the primary power system. Various types of IEDs exist in smart grids, each with distinct software and hardware systems, communication protocols, services supported, and network environments. Therefore, establishing comprehensive and specific security monitoring indicators is essential for assessing IEDs’ security.
The quantity of monitoring information depends on the available monitoring technologies for an IED. Therefore, from the perspective of data sources required for IEDs’ security assessment, this section initially presents the security monitoring technologies to be utilized, categorizes IEDs within the smart grid, and outlines the security monitoring indicators for various types of IEDs.
2.1 Security Monitoring Technologies
Based on the different locations of IEDs monitoring and referring to [40–42], we divide security monitoring technologies into two categories: device-based monitoring technology and network-based monitoring technology (including system-based and protocol-based technologies). Device-based monitoring technology is used for monitoring the operating data of IEDs, such as the software running states of the device, computing resource utilization (i.e., CPU utilization, memory utilization), and important file modification information. Network-based monitoring technology is used for monitoring network traffic, such as traffic feature data, abnormal alarm message information, message semantic features, etc.
(1) Device-based monitoring technology
Some IEDs within the smart grid possess ample computing resources and are capable of self-checking and reporting information, such as their operational status, external connectivity status, status of remote port openings, information on local maintenance interface access, tripping and closing operations, data from meters, status indicators, and other relevant details. However, in practical applications, most IEDs have restricted computing capabilities and are unable to conduct self-assessment or report complex device running state information, which undoubtedly hinders the security evaluation of IEDs. Therefore, given the requirement for the monitoring program to operate on IEDs with varying computing resources and restricted computing capabilities, an efficient log agent (i.e., adding a log recording process to the IEDs to record the running state data of the IEDs) can be used to obtain the running state data of the IEDs.
The monitoring method of the lightweight log agent can effectively obtain the running states of the IEDs, has strong scalability, and can flexibly design the required device information proxy tasks for engineers. The following is the specific content of using a lightweight log agent to obtain the running state information of IEDs, and the obtained information can be used for analyzing whether there are abnormal states in the IEDs.
① Modification information about important file. Important files refer to the configuration and system files of IEDs. The modification operations made to important files and their contents is recorded in the log through the agent.
② System task call sequence. The running states of the IEDs system tasks is generally delayed, blocked, ready, suspended, or running. Once the task state is abnormal, the task will be suspended and cannot participate in the system’s task scheduling. The IEDs system task ID (identity), the number of task list items, and whether the task is accidentally suspended are recorded in the log through the agent.
③ Kernel variable information. There are usually some kernel global variables in the IEDs system. The kernel virtual memory is accessed through the agent, and the values of global variables are regularly read and stored in the log.
④ System call frequency. The system call frequency of IEDs refers to the frequency that the system calls a certain task. The events that need to be collected through the agent are set, and the number of certain tasks called by the system in a unit of time is counted and stored in the log.
⑤ Process stack state. Due to the relatively scarce resources of embedded systems, the allocation of resources is relatively demanding, so it is necessary to monitor the occupation of the stack. The stack size, the number of stack bytes currently in use, the maximum number of stack bytes used, and the number of unused stack bytes are written to the log through the agent.
⑥ Memory usage state. Based on dynamic instrumentation technology, the agent executes and throws out program-derived feature data through the probe, and writes the feature data to the log.
⑦ Software running state. When the IEDs system software is running, it may crash or stop serving due to some unexpected factors. A monitoring task can be designed to obtain the application name and application running states by calling the system function, and then the information is recorded in the log.
(2) Network-based monitoring technology
The security of IEDs is not only related to the running states of the device but also related to the network traffic and abnormal behaviors (i.e., malicious attacks). Therefore, network traffic analysis technology [43] and protocol analysis technology [44] need to be combined to monitor abnormal network traffic events and malicious attacks. Network traffic analysis technology extracts all IEDs network traffic data based on switch port mapping. After extracting the traffic data, traffic feature analysis technology is used for obtaining IEDs network traffic features, including bandwidth features and time-domain features such as period and interval. Protocol analysis technology identifies smart grid security events through deep analysis tools that support IED communication protocols.
Common IEDs found in smart grids encompass protective devices such as line relays, transformer relays, breaker relays, and bus relays, alongside digital fault recorders, data concentrators, and data acquisition devices. These IEDs exhibit inherent characteristics across four key aspects: system details like the operating system and version number, software elements including installed software authorization, update and upgrade services, and port services, computing factors such as CPU performance and memory size, and interface specifics related to local hardware interfaces.
Variations in the characteristics of IEDs necessitate the utilization of distinct security monitoring technologies. For instance, analyzing and extracting the application layer data of communication messages transmitted by encrypted IEDs using protocol analysis technologies is infeasible. While decryption and analysis of application layer data is feasible upon obtaining the encryption methods of IEDs, the resource-intensive nature of analyzing extensive communication messages renders it impractical. Achieving a thorough and efficient evaluation of IED security necessitates the detailed categorization of IEDs.
IEDs can be categorized as encrypted or non-encrypted based on the presence of a security chip. Encrypted IEDs incorporate a standardized security chip with a secure access module (ESAM). Non-encrypted IEDs, such as those commonly found in substations, lack security chips due to the real-time data transmission demands necessitating plaintext communication.
Based on its service functionality, IEDs can be classified into control IEDs and non-control IEDs. The protection and control (P&C) devices at the bay level of substation can control the opening and closing of breakers, making them control IEDs. Merging units (MUs) only have data acquisition functionality and no control functionality, making them non-control IEDs. Control IEDsusually function in self-checking and reporting, such as a P&C device reporting command execution and function module anomalies, while non-control IEDs do not function in self-checking and reporting.
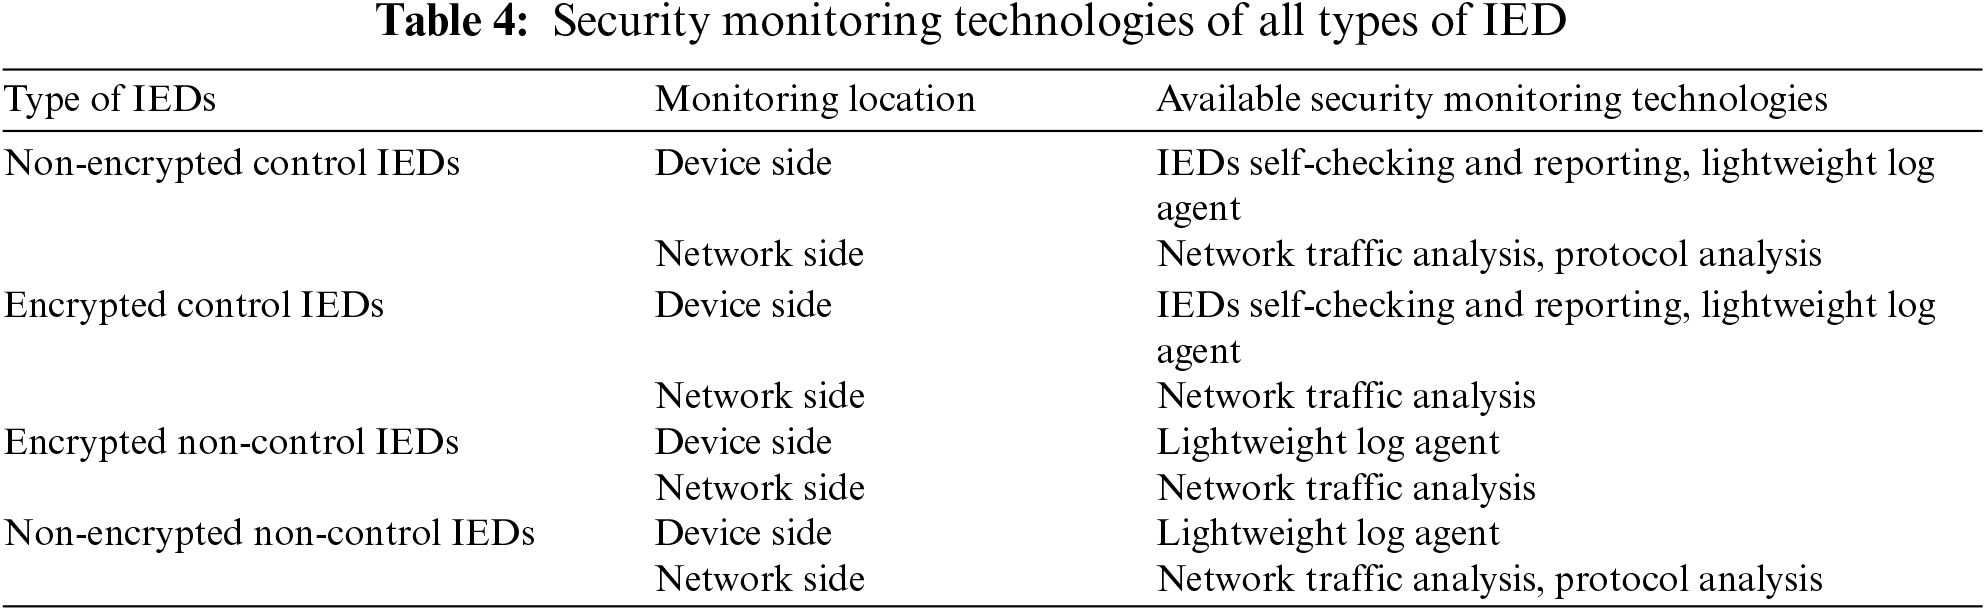
Based on the above analysis, IEDs are classified as illustrated in Fig. 1, with corresponding security monitoring technologies detailed in Table 4 for each type of IED.
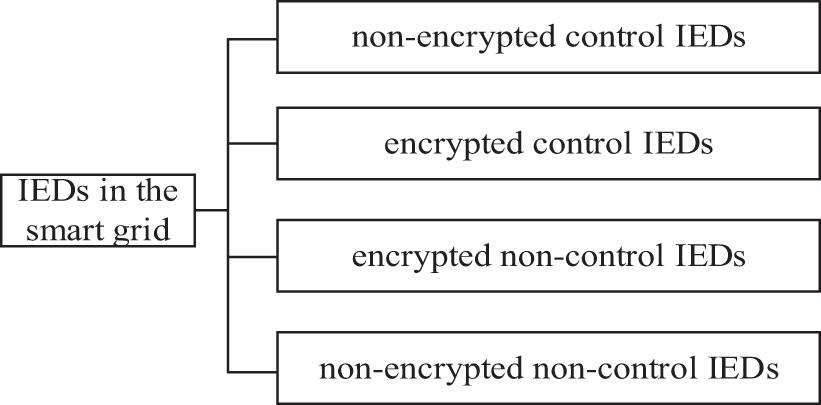
Figure 1: Types of IEDs
2.3 Security Monitoring Index System for IEDs
Based on the analysis of monitoring technologies in Section 2.1, device-based monitoring technologies effectively capture the operational status of IEDs, while network-based monitoring technologies can identify abnormal network traffic and malicious attacks. Consequently, an IEDs security monitoring index system is developed based on three key aspects: operational status, network traffic, and abnormal behaviors, as depicted in Fig. 2. The operational status monitoring indicators assess the operational risk of IEDs from the device perspective; network traffic monitoring indicators describe the traffic patterns of IEDs from a network perspective; and abnormal behavior monitoring indicators identify the behavioral traits of IEDs. These three categories of security monitoring indicators are readily accessible and provide a comprehensive depiction of IED characteristics.
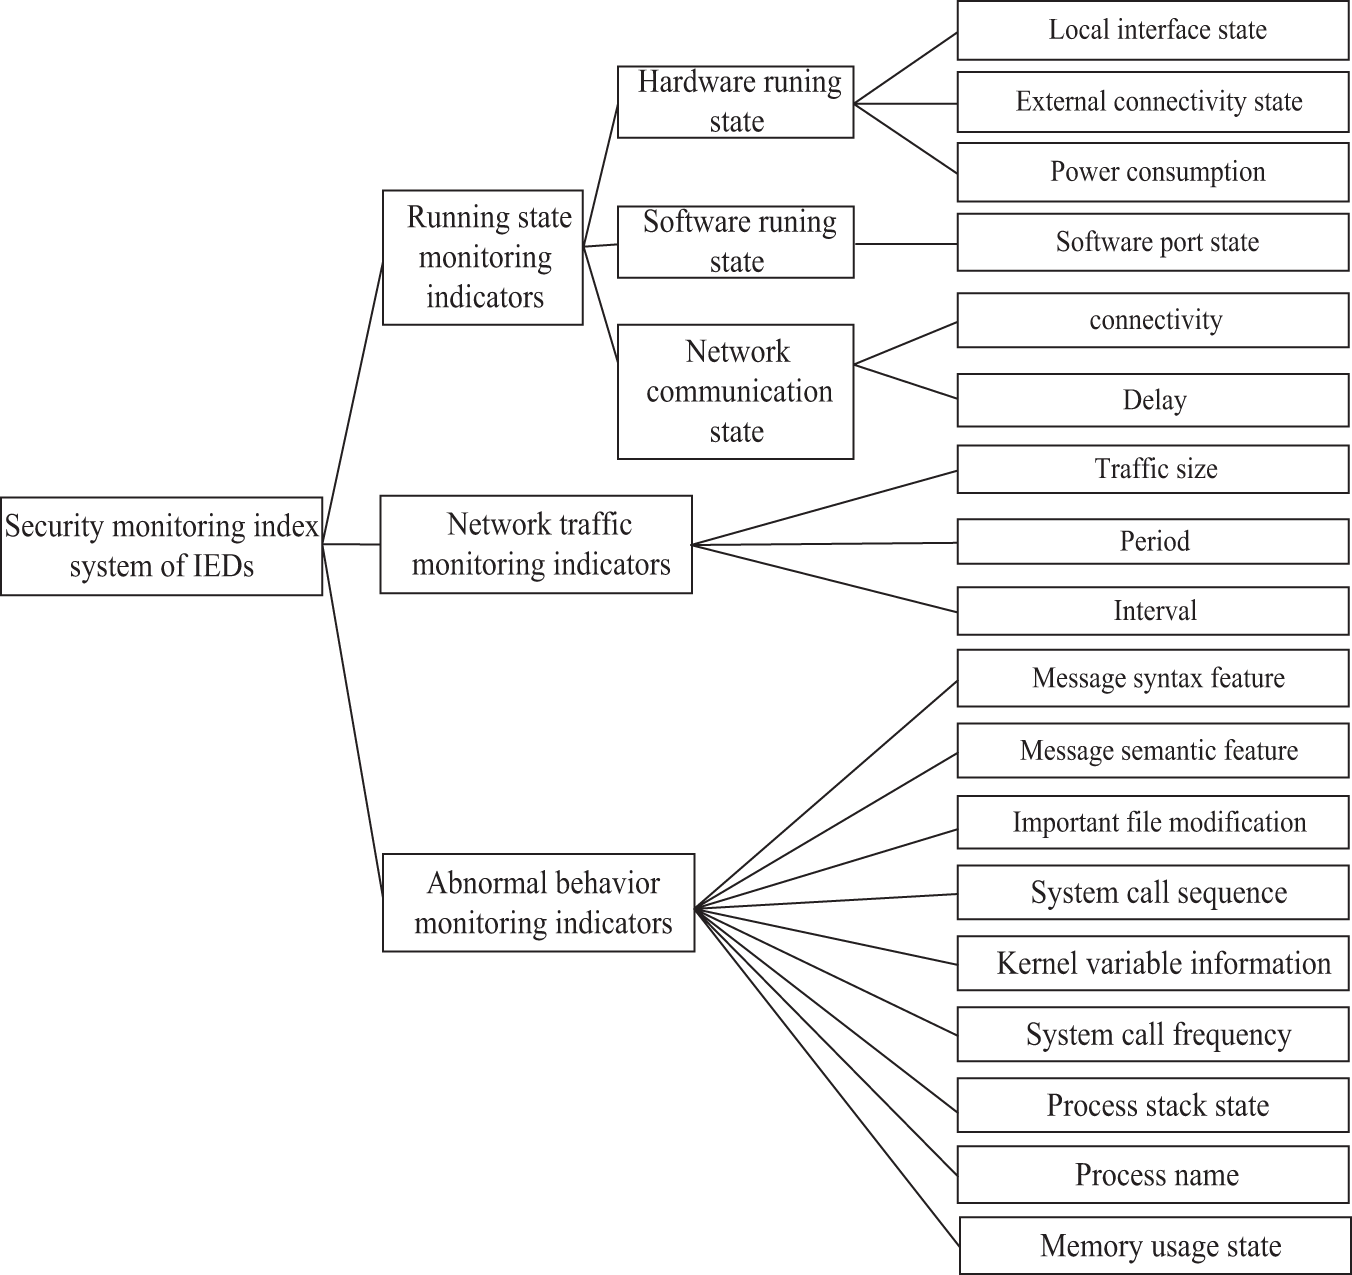
Figure 2: Security monitoring index system for IEDs
In Fig. 2, the specific content of each type of monitoring indicator is as follows:
(1) Running state monitoring indicators
The running states of IEDs mainly refer to the software and hardware environment, as well as the communication environment. The running state monitoring indicators of IEDs include hardware running state, software running state, and network communication state. The hardware running state mainly includes the external connectivity state, local interface state, power consumption, etc. The external connectivity and local interface state can be obtained by monitoring the abnormal information reported by IEDs. For IEDs with built-in power consumption monitoring modules, power consumption information can be obtained through collection and reporting. For other IEDs, the power consumption information can be calculated by monitoring the voltage and current. The software running state mainly refers to the software port state, which can be obtained by the monitoring agent (i.e., lightweight log agent) deployed on the IEDs. The network communication state primarily encompasses connectivity and communication delay, which can be monitored through the heartbeat messages transmitted by IEDs maintaining long connections with the master station.
(2) Network traffic monitoring indicators
The network traffic of IEDs mainly refers to the communication traffic on the network side. Compared with traditional IT networks, the smart grid operating environment is relatively closed, the data fields of communication messages are shorter, and the transmission frequency is higher; communication messages have strong periodicity; communication has high real-time and fast response speed; data flow is relatively fixed and has a certain time sequence feature. Based on these characteristics and network traffic acquisition methods, the network traffic monitoring indicators of IEDs in this paper mainly include traffic size, period, and interval.
(3) Abnormal behavior monitoring indicators
The abnormal behavior of IEDs mainly refers to the features of communication messages on the network side and behaviors on the device side. Based on the analysis of security monitoring technologies in Section 2.1, the abnormal behavior monitoring indicators of IEDs in this paper mainly include message syntax feature, message semantics feature, important file modification, system call sequence state, kernel variable information, system call frequency, process stack state, and memory usage state. Among them, message syntax and message semantic features can be obtained through protocol analysis technology, and other information can be obtained through the monitoring agent deployed on IEDs.
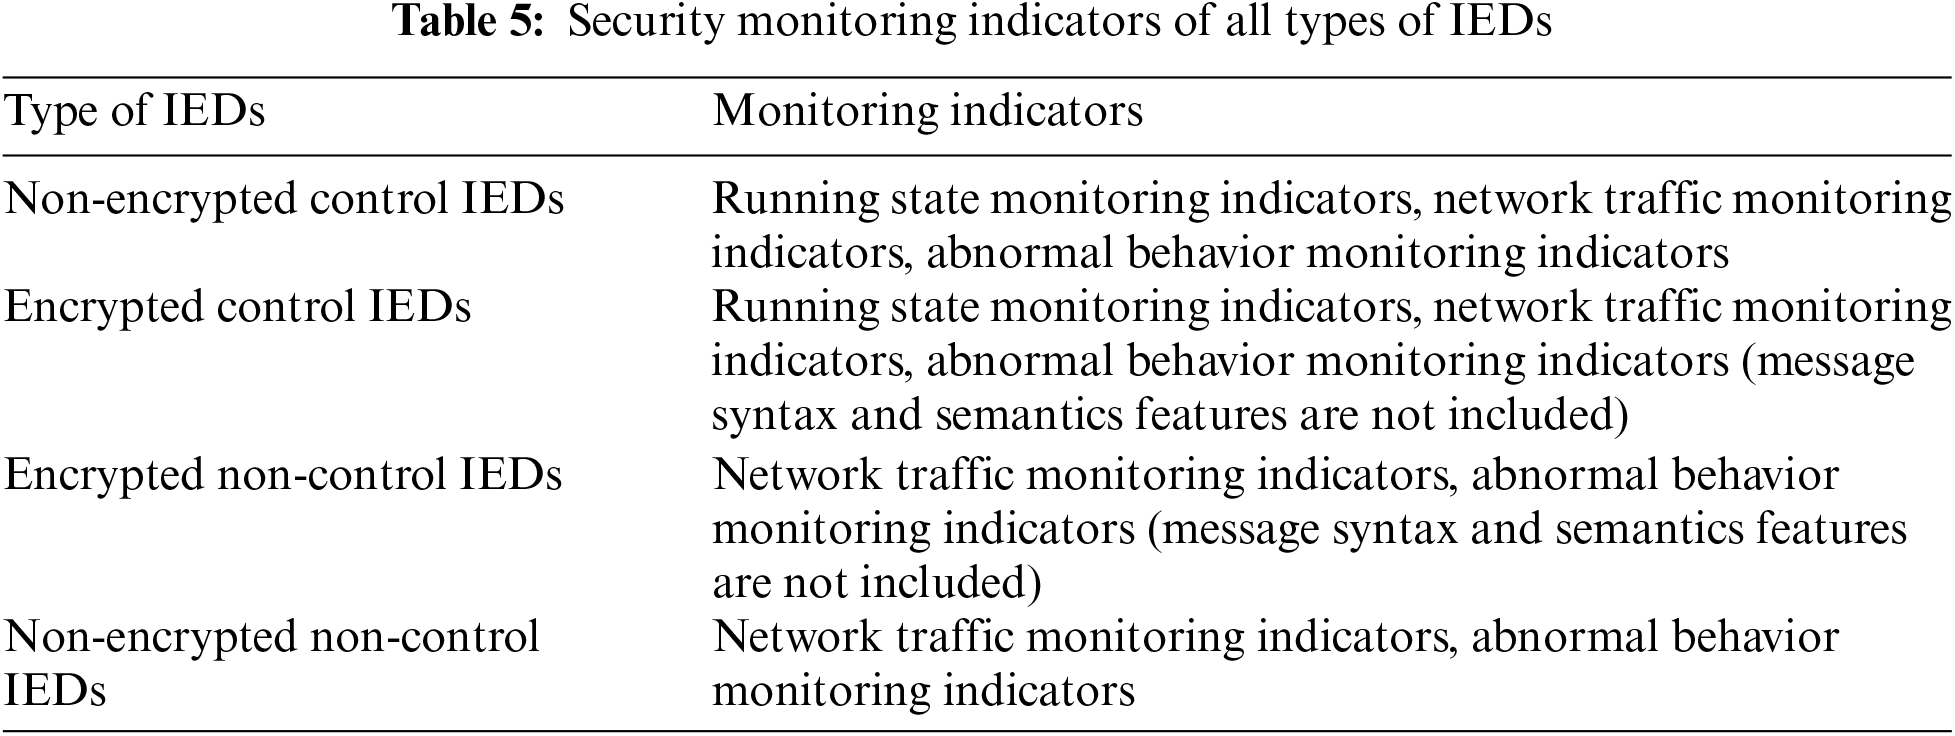
Based on Section 2.2, when monitoring a specific type of IED, the actual security monitoring indicator content is shown in Table 5.
3 Quantification of IEDs Security Monitoring Indicators
Section 2 introduces security monitoring indicators for IEDs. Once the relevant monitoring data is acquired, quantifying the security monitoring indicators and proposing effective assessment methods are essential for conducting IEDs security assessment. This section outlines quantification methods for three categories of monitoring indicators: operational status, network traffic, and anomalous behavior.
3.1 Quantification of Running State
Compared with other classification methods, the K-means method is a partition-based clustering algorithm. Given a data set of
Considering the actual application of IEDs, the need for quantifying the running state monitoring indicators and further security assessment in the rest paper,
The quantification process of the running state monitoring indicators is as in Fig. 3.
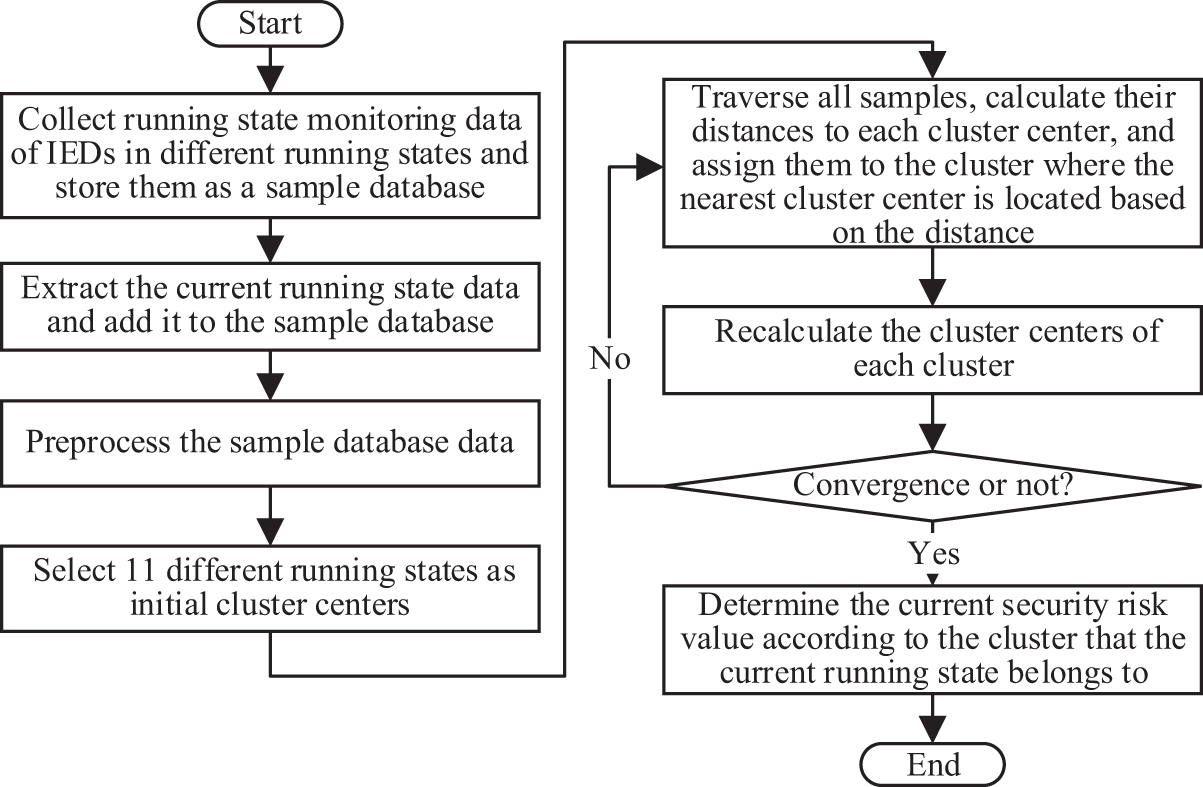
Figure 3: Quantification process of the running state monitoring indicators
The key steps are as follows:
Step 1: Collect running state monitoring data of IEDs in different running states and store them as a sample database.
Step 2: Preprocess the sample database data and select 11 significantly different running states as initial cluster centers.
Step 3: Traverse all samples, calculate their distances to each cluster center, and assign them to the cluster where the nearest cluster center is located based on the distance.
Step 4: Recalculate the cluster centers of each cluster.
Step 5: Repeat steps 3–5 until the position of the cluster center no longer changes or the set iteration times are reached.
3.2 Quantification of Network Traffic
Time-related features have good performance in network traffic analysis. In the traditional Internet, the network environment is prone to changes, and time-related features are greatly affected. Using time-related features may lead to poor robustness. However, if time-related features are used for analyzing specific networks, they will not produce bad effects. In the smart grid, communication messages have strong periodicity, fixed data flow, and certain time sequence features. Therefore, we propose to use time-related features to quantify the network traffic monitoring indicators of IEDs. The quantification process of the running state monitoring indicators is as in Fig. 4.
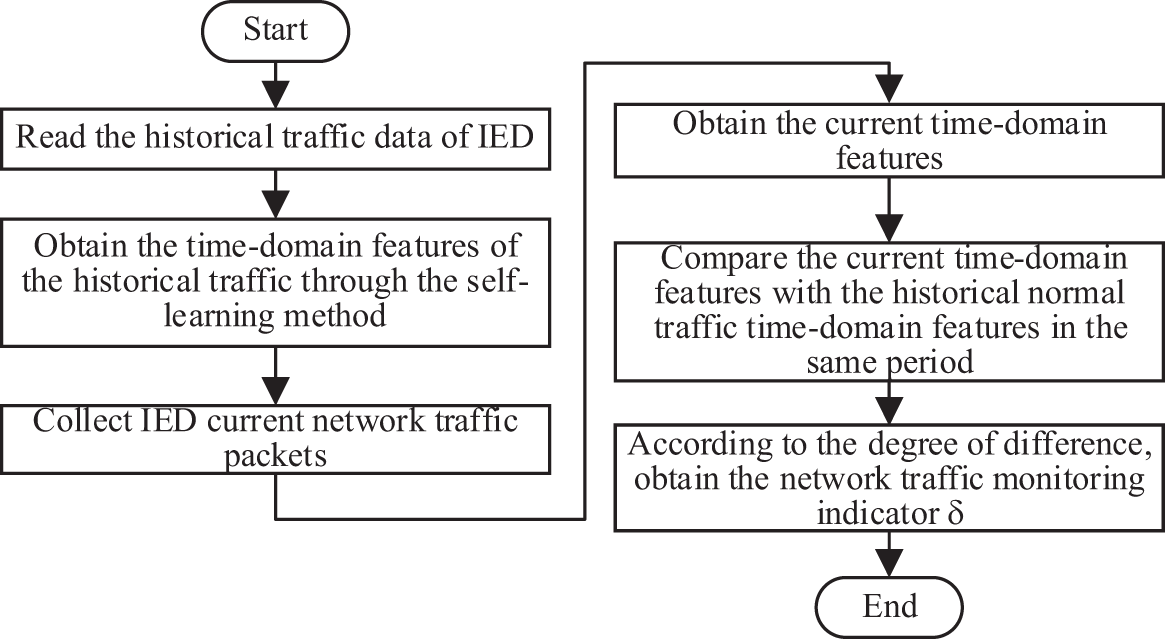
Figure 4: Quantification process of network traffic monitoring indicators
The key steps are as follows:
Step 1: Read the historical normal traffic data of IEDs.
Step 2: Obtain the time-domain features of the historical normal traffic of IEDs through the self-learning method of machine learning.
Step 3: Collect IEDs’ network traffic packets.
Step 4: Statistics of traffic packets to obtain the current time-domain features.
Step 5: Compare the current statistical time-domain features with the historical normal traffic time-domain features in the same period. According to the degree of difference, the network traffic monitoring indicator value, i.e., the traffic volatility
where
This method can quickly and efficiently extract network traffic features from a large amount of network communication data and show the current traffic situation based on the difference between the traffic features and the historical normal traffic features in the same period.
3.3 Quantification of Abnormal Behaviors
At present, the mainstream protocols used for communication in IEDs include the IEC 61850 protocol, TCP/IP protocol, and DL/T 698.45 protocol. The TCP/IP protocol is the most basic protocol of the Internet and has a large number of references available, so it will not be further elaborated here. This paper mainly analyses the IEC 61850 protocol and DL/T 698.45 protocol. By checking the syntax of service messages, and extracting the application layer content (e.g., service type, service data fields, and addresses) of messages, the syntax features, semantic features, and anomaly alarms of messages can be obtained. Based on the characteristics of these two protocols, this section provides quantitative methods for abnormal behavior monitoring indicators of IEDs from the following five aspects.
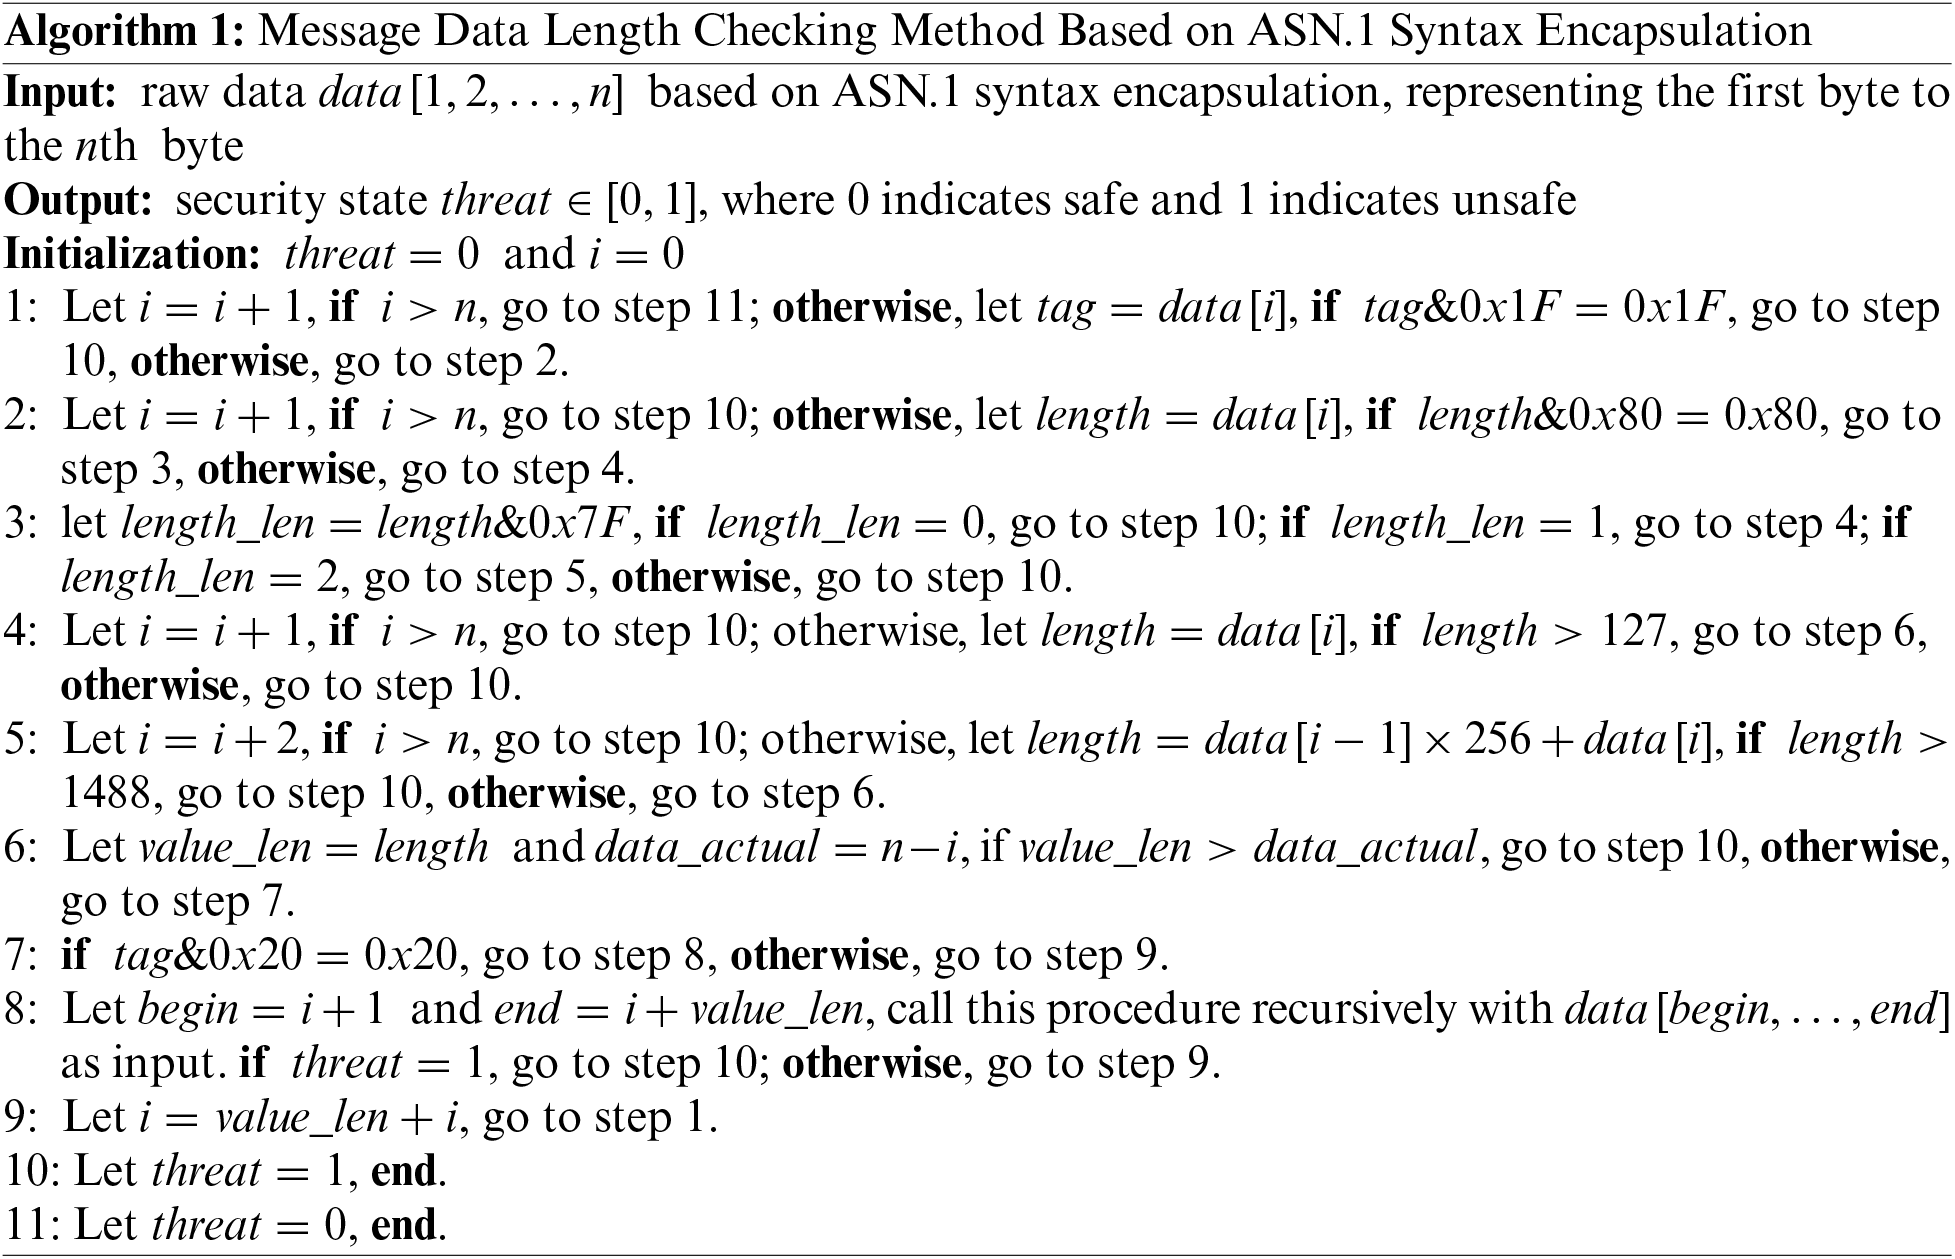
(1) Common GOOSE, sampled value (SV), manufacturing message specification (MMS) messages, and DL/T 698.45 messages all use ASN.1 syntax for data encapsulation. The type and length of data encapsulated based on ASN.1 syntax can be freely edited. At the same time, most message-processing programs in the smart grid run on various embedded systems, and memory usage is controlled by developers. Both of these aspects pose many threats to IEDs. Attackers can achieve their goals by unreasonably editing the Tag, Length, and Value fields of data encapsulated by ASN.1 syntax. For the data encapsulated by ASN.1 syntax, Tag describes the data type, Length describes data length, and Value represent real data values.
Therefore, to ensure the security of service messages and IEDs, it is necessary to perform syntax checks on data encapsulated using ASN.1 syntax. To address this type of threat, we adopt a message data length checking method based on ASN.1 syntax encapsulation, as shown in Algorithm 1. The compliance can be judged through strict ASN.1 syntax checks on the length of the Tag, Length, Value, and actual data. The frequency
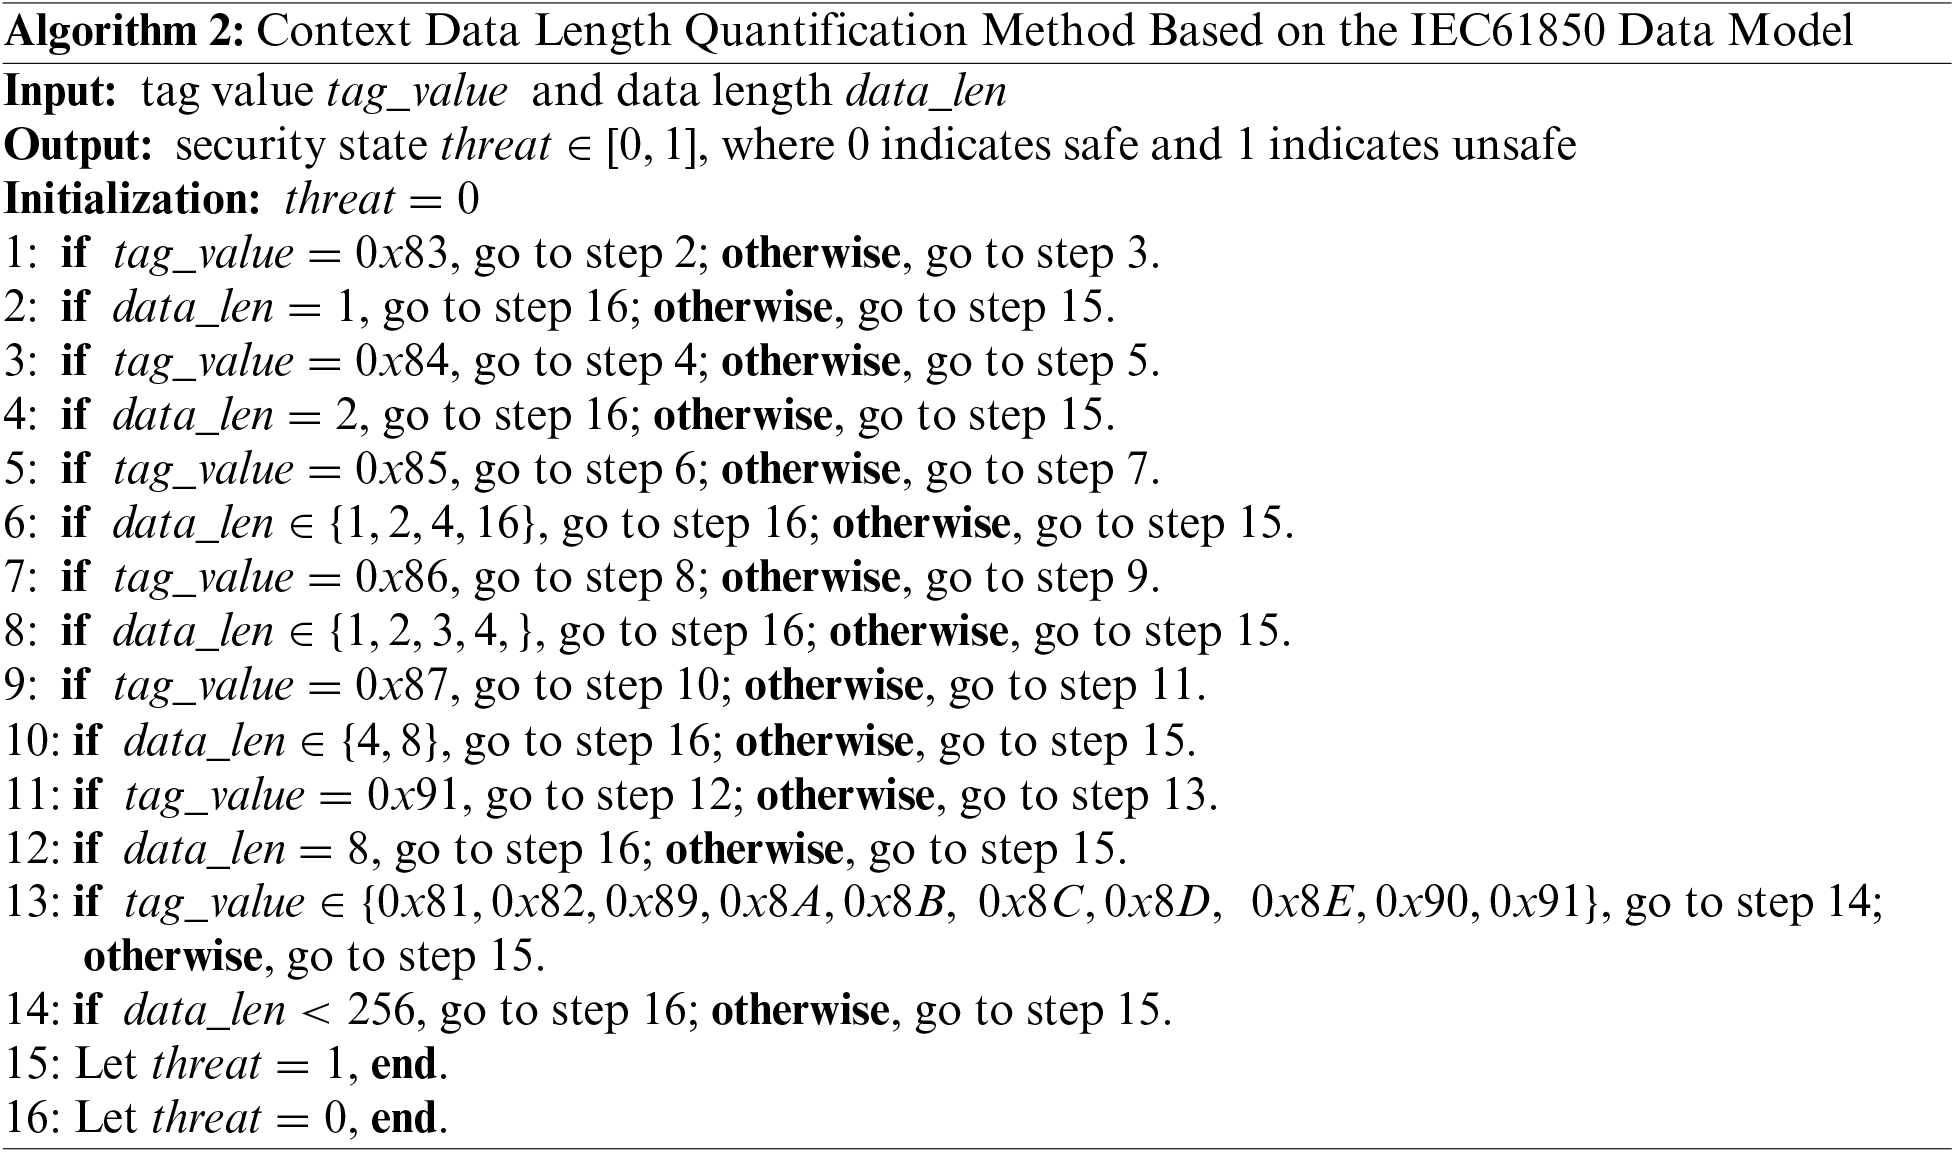
(2) GOOSE messages are used for transmitting service data, and the
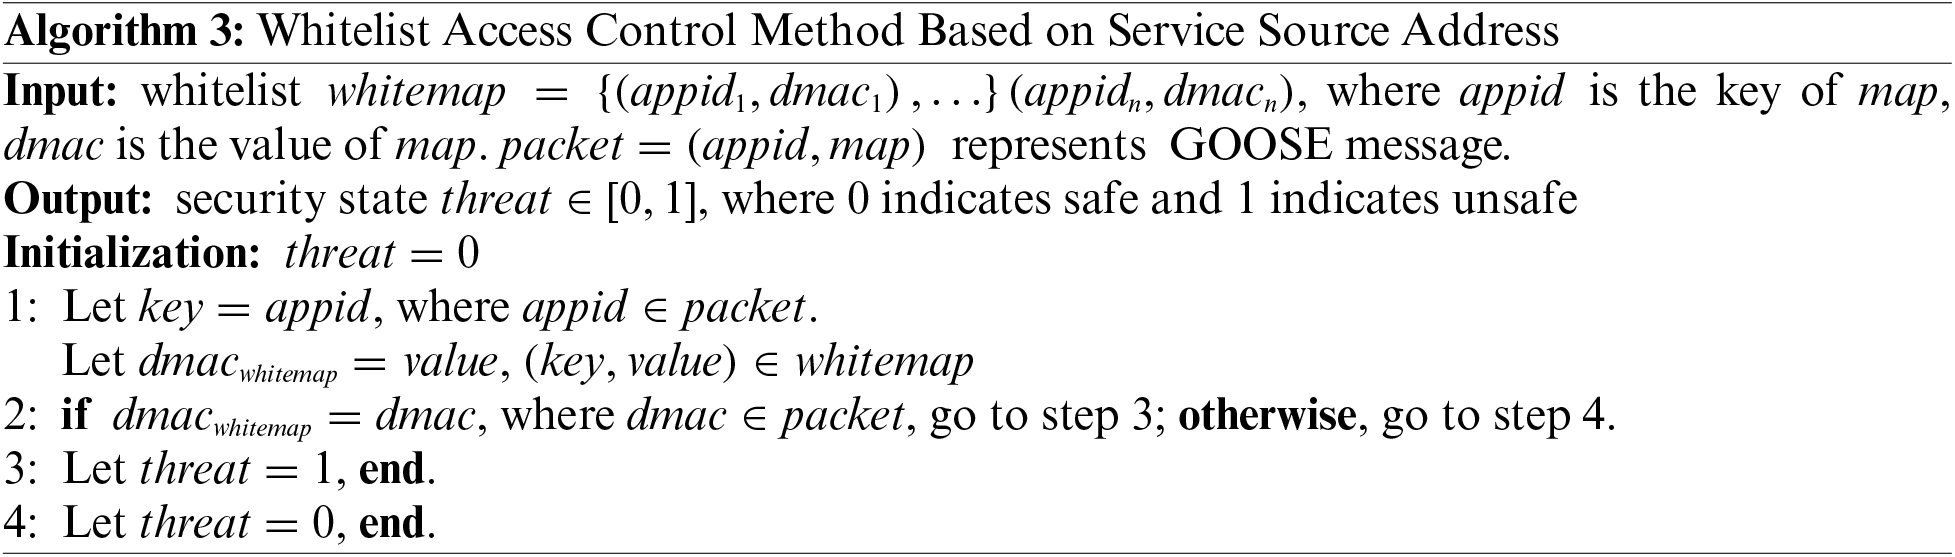
(3) Based on the publish and subscribe mode of GOOSE protocol, attackers can control the subscribed nodes (i.e., IEDs) of a multicast group by modifying the destination multicast MAC address. At the same time, IEDs do not check the source address, so they cannot identify whether the attacker is the actual publisher. When IEDs are designed, the main consideration is their service needs, and checking the source MAC address of received messages is not considered. Therefore, when attackers use the above method to attack, IEDs cannot identify the malicious control messages, nor can they detect anomalies. To address this type of attack, we adopt a whitelist access control method based on service source address, as shown in Algorithm 3, to detect whether service publishers are legitimate identities and calculate the frequency
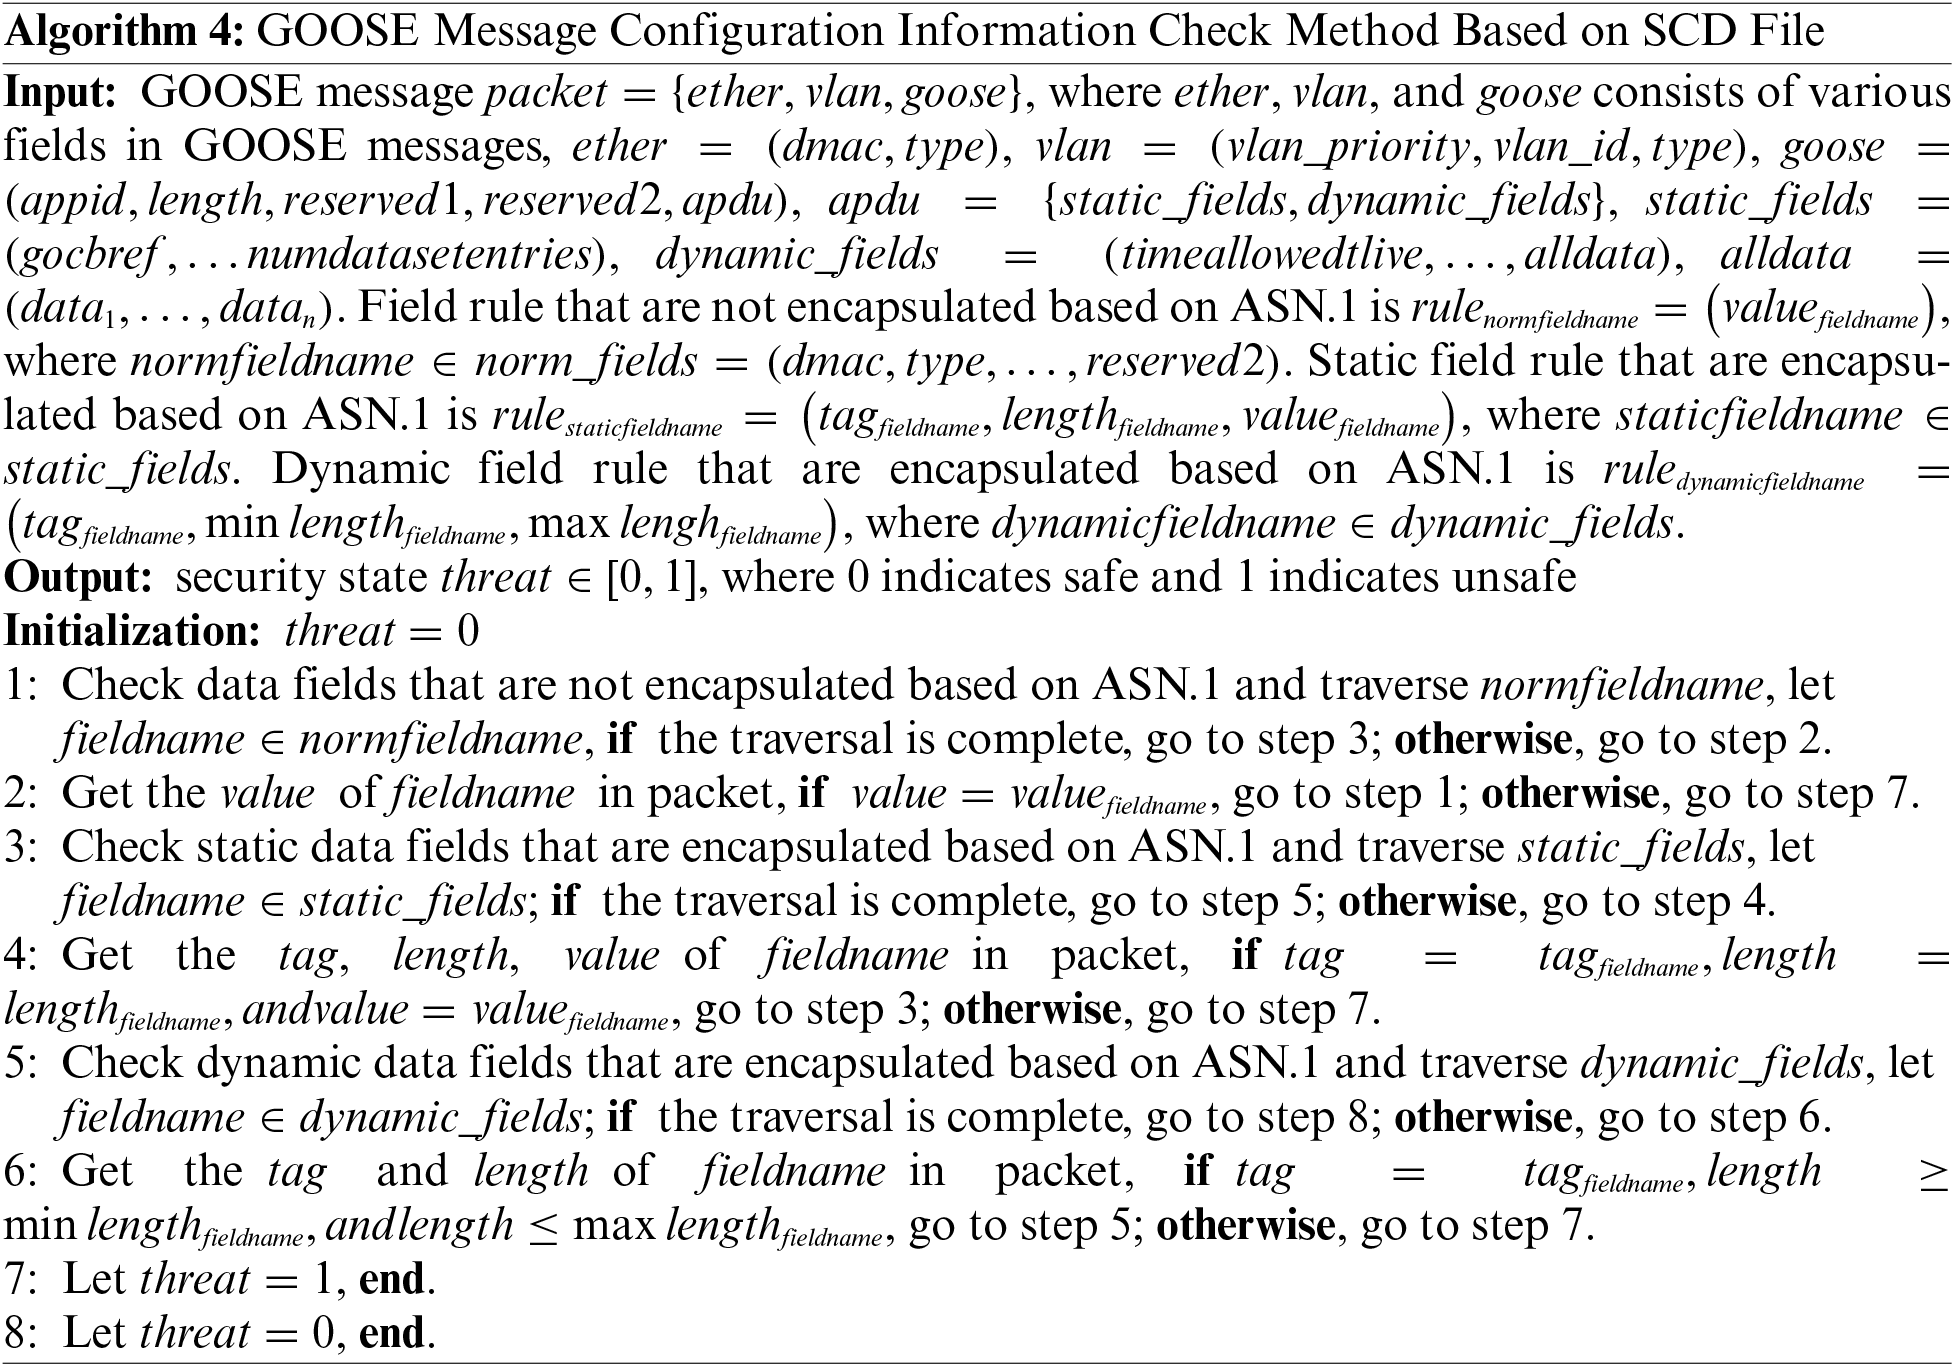
(4) For GOOSE messages, most data fields have a one-to-one mapping relationship with the service type of the transmitted message, and these field values can be obtained from the substation configuration description (SCD) file. In practice, IEDs are configured using offline configuration methods, and the values of these fields that have a mapping relationship will generally not change once the configuration is completed. Therefore, we use a GOOSE message configuration information check method based on the SCD file, as shown in Algorithm 4, to identify GOOSE malformed messages that IEDs may be subjected to, calculate the frequency
(5) Due to the vulnerability of IEDs themselves, malicious code attacks pose a significant security threat to them. Currently, commonly used malware attack detection technologies mainly include integrity-based detection technologies, feature-based detection methods, behavior-based detection methods, heuristic detection methods, and machine learning-based detection methods. Considering the limited resources of IEDs and to avoid affecting the service functions of the power system, dedicated hosts can be used for detection, that is, the required analysis data is obtained by deploying information collection agents on IEDs, and analysis is conducted on an independent detection host. This deployment mode will limit the detection methods that can be used. For example, behavior-based detection methods have a significant impact on service functions and are not suitable for use.
Reference [46] compared the classification effect of three machine learning methods (i.e., random forest method, support vector machine and K-nearest neighbor) using probability matrix as input, and the results showed that random forest method had the most significant and stable classification effect. Therefore, we use random forest method to detect malicious code attacks, with the following specific steps:
Step 1: Select a sufficiently large set of malicious and normal codes as the training set, and extract the N-gram and variable-length N-gram of the code binary sequence as features.
Step 2: Feature selection. Calculate the weighted information gain for each feature, sort them in descending order according to their weighted information gain, and select several features with high scores as effective features. A Boolean vector space is constructed based on whether each training sample contains these effective features for the classifier to learn.
Step 3: Extract the N-gram and variable-length N-gram of the binary sequence of the code to be tested as features. Based on whether each code to be tested contains the effective features selected from the training set, a Boolean vector space is constructed. The random forest method is used for analyzing this vector space, determine whether IEDs have been attacked by malware, and count the number
where
4 Security Assessment Method for IEDs
Considering the need to fully cover IEDs’ security monitoring indicators and the limited computing resources and capabilities of IEDs, this section proposes the GRCW-hybrid method combining GRA, AHP and EWM for the security assessment of IEDs.
In this section, we briefly introduce the GRA, EWM, and AHP. Some important features of them for which our proposal relies are explained.
Grey system theory was first proposed by Chinese scholar Deng in 1982 [47]. It mainly focuses on the uncertain systems of “small data” and “poor information” as research objects, mines and extends the already mastered information in the system, extracts relevant valuable information, and uses the system’s multi-possibility to transform unknown information into known information, thus achieving the correct description and effective monitoring of the running state and evolution law of the system.
GRA [48] is an important part of Grey theory. The essence of GRA is to judge the relation degree between the reference sequence and sequence to be analyzed. Compared with the mathematical statistics method, GRA does not require large-scale sampled data and satisfies typical probability distribution law. The GRA calculation is very simple with a small amount of calculation. The calculation results are consistent with the qualitative analysis, and hence GRA is widely used.
For IEDs, the actual obtainable information is limited, and the obtained information has uncertain relationships with each other. Therefore, the running IED can be regarded as a grey system, and the security state changes of the IED can be quantitatively compared and reflected by grey correlation degree. In addition, GRA requires a small amount of data, which is also beneficial for the security assessment of IEDs with limited resources and computing capabilities. Meanwhile, in the process of determining the reference sequence, the optimal value of the assessment index can be used for determining it.
However, the determination of the optimal value of the assessment index in GRA is too subjective. Therefore, in the security assessment of IEDs, we use the rated value of some indicators as the optimal value and use the normal operating data of IEDs when they are not attacked as the optimal value for other indicators. This way, there is no strong subjectivity in the selection of the optimal value. In addition, GRA takes the average value of all indicator correlations in each sample and then calculates the sample correlation. This method lacks the analysis of primary and secondary indicators. To solve this problem, introducing indicator weights is a common improvement measure.
As mentioned in Section 4.1.1, it is necessary to introduce a weighting method to compensate for the shortcomings of GRA. Currently, common weighting methods can be divided into objective weighting methods (e.g., coefficient of variation method, and EWM) and subjective weighting methods (e.g., expert scoring method and AHP). Among them, AHP has a prominent advantage in determining weights based on the meanings of the indicators themselves, while EWM has a prominent advantage in determining weights without considering the actual meanings of the indicators [49,50].
The basic idea of EWM is to determine objective weights based on the size of the variability of the indicators. According to the characteristics of entropy, when the entropy value of a certain indicator data is large, it means that the variability of the indicator is smaller and its contribution to the overall evaluation is smaller; when the entropy value of a certain indicator data is small, it means that the variability of the indicator is larger and its contribution to the overall evaluation is greater, and weights of each indicator are determined based on this. EWM only relies on the discreteness of the indicator data. AHP is a decision analysis method that combines qualitative and quantitative analysis to solve complex problems with multiple objectives [50].
However, using AHP or EWM alone has certain limitations. AHP has poor objectivity, EWM cannot absorb the decision maker’s engineering experience, and in extreme cases, EWM might even produce indicator weights that contradict the actual contribution. We should combine the advantages and disadvantages of both methods, reduce the subjectivity of weighting while achieving the unity of subjectivity and objectivity in the weighting of indicators, and make the decision results more authentic and reliable. Therefore, we adopt combination weight method (CWM) by combining AHP and EWM to determine the weights of indicators.
On the basis of the above, the workflow of the IEDs security assessment method, as shown in Fig. 5, is designed as follows. First, according to Section 2.1, we determine the type of IEDs that need to be assessed and monitor the data required for the security assessment of such IEDs (see Section 2.3 for details). Then, we analyze and process the monitored data according to the corresponding quantitative methods to obtain the monitored indicator values of the IED. Subsequently, we preprocess the monitored indicator values, establish the GRA model of IEDs, calculate the correlation coefficients of each monitored indicator value, modify the weights of each indicator based on the CWM, and calculate the correlation degree of each assessment sample to the reference sample. Finally, we determine the security assessment results of IEDs based on the graded security risk level.
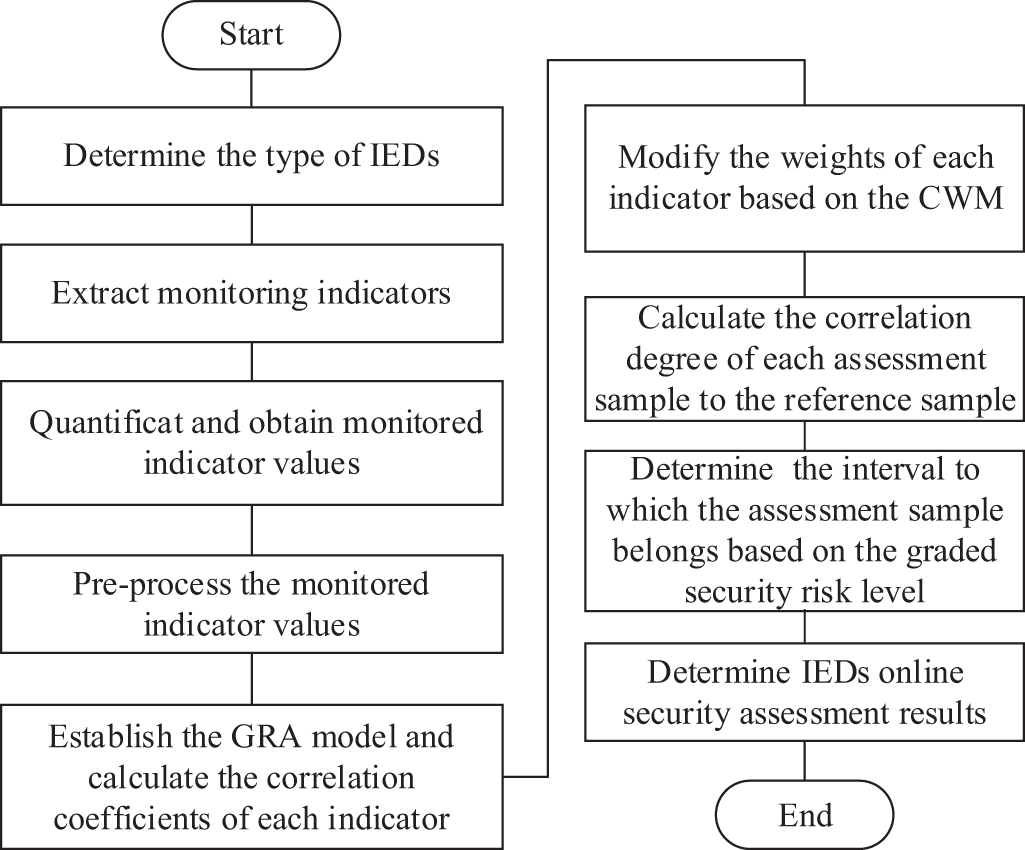
Figure 5: Workflow of the proposed security assessment method for IEDs
Although there are differences in monitoring indicators for different categories of IEDs, the workflow shown in Fig. 5 is fully applicable to the four categories of IEDs we have defined, with only slight differences in the calculation process due to the differences in monitoring indicators. This section selects non-encrypted control IEDs to explain the calculation process of the proposed security assessment method and other types of IEDs can be analyzed and calculated by analogy.
Step 1: Determine the type of IEDs. Based on the classification criteria and monitoring index system in Section 2, we determine the type and security monitoring indicators of the assessed IEDs. As stated in Section 2.3, the monitoring indicators for non-encrypted control IEDs include running states, network traffic, and abnormal behaviors.
Step 2: Extract corresponding monitoring indicators. Obtain the running state data, network traffic data, and abnormal behavior data of the IEDs.
Step 3: Quantify IEDs’ security monitoring indicators. According to the quantitative method in Section 3, we obtain the security monitoring indicator values for running state security level
Step 4: Preprocess the monitoring indicator values. After obtaining all the monitoring indicator values, they need to be standardized to make them dimensionless. Security monitoring indicators typically include positive indicators and negative indicators, where positive indicators have the property that a larger value means better performance, while negative indicators have the property that a smaller value means better performance. All the indicators for IED security monitoring are negative indicators. The range transformation method (as in (3)) can be used for preprocessing the IEDs security monitoring indicator values.
For negative indicators:
In (3),
Step 5: Establish the grey correlation model and calculate the correlation coefficients of each monitoring indicator value.
When conducting grey relational analysis on IEDs, it is necessary to determine a reference sequence in advance. The numbers of indicators and samples are set as
Meanwhile, the optimal value of each indicator is selected to form a reference sequence, as shown in (5).
Then, we calculate the difference sequence and determine the maximum and minimum values of the difference sequence by (6) and (7).
Finally, we calculate the correlation coefficient by (8).
where
Step 6: Based on AHP and EWM, the weights of each indicator are modified. After calculating the weights of each indicator based on EWM [49] and AHP [50], respectively, the combined weight of each indicator is calculated according to (9).
where
Step 7: Calculate the correlation degree. Eq. (10) is used for calculating the correlation degree of IED to be assessed.
where
Step 8: Determine the security assessment results. Based on the security risk level graded in Table 6, the correlation degree calculation under each sample is determined in the interval, and the final security risk level of IEDs under different scenarios is obtained.
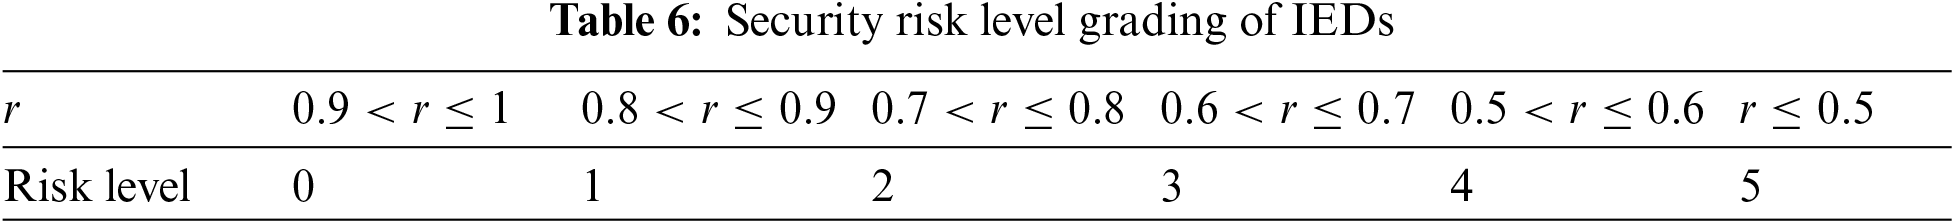
Based on the above calculation process, the security risk level of IEDs increases with the decrease in relevance. According to the proposed assessment method for IEDs, the security risk degree of IEDs can be determined by the correlation degree. It means if the security risk degree is high, the correlation degree will be low. Therefore, according to the numerical range of the correlation degree, the security risk level can be graded into six levels, namely 0, 1, 2, 3, 4, and 5. The numerical range of the correlation degree of each security risk level is shown in Table 6. The higher the level, the greater the security risk.
In Table 6, level 0 indicates that the IEDs are in a safe state. When the risk level is level 1, attention should be paid. If the risk level does not decrease within a certain period of time, targeted operations should be carried out, such as issuing cutting generators or shedding load commands. When the risk level is level 3, attention should be paid. If the risk level does not decrease within a certain period of time and no change occurs after intervention, the power grid can be restarted under the condition of ensuring normal system functions. When the risk level is level 5, the dangerous IEDs should be isolated or directly removed quickly and accurately to limit the failure scope to a minimum and effectively prevent the failure from continuing to expand. In practice, the classification and definition of security risk levels can be adjusted according to the actual situation.
Based on the description of the calculation process of the proposed GRCW-hybrid method for IEDs, it can be concluded that this method has small computation, high efficiency, and can achieve the unity of subjectivity and objectivity in weighting while reducing the subjectivity in weighting. Therefore, the GRCW-hybrid method can effectively improve the efficiency of IED security assessment.
Protective IEDs play a crucial role in modern power grids. Some malicious actions (e.g., undesired tripping and failure to operate) may occur because of cyber-attacks. Then the smart grid reliability is affected by malicious outage events caused by successful malicious actions on protective IEDs [1]. Therefore, we choose protective IEDs as analysis objects to verify the rationality of the security monitoring index system and the GRCW-hybrid method.
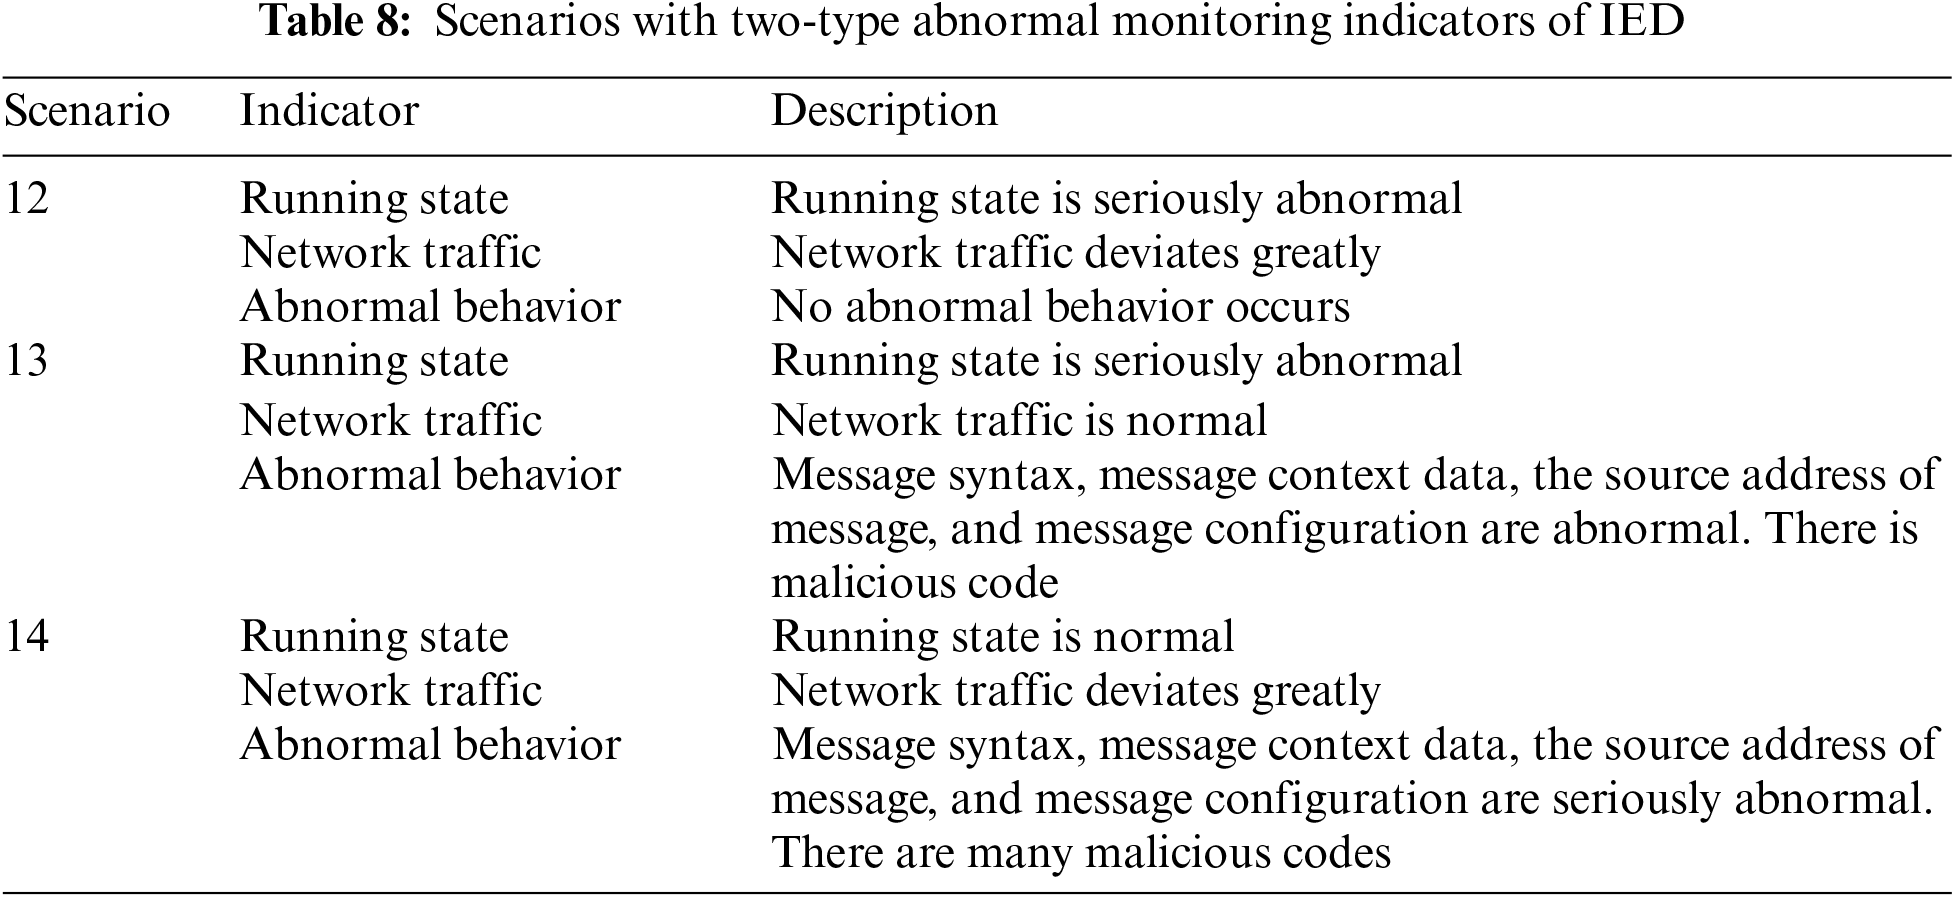
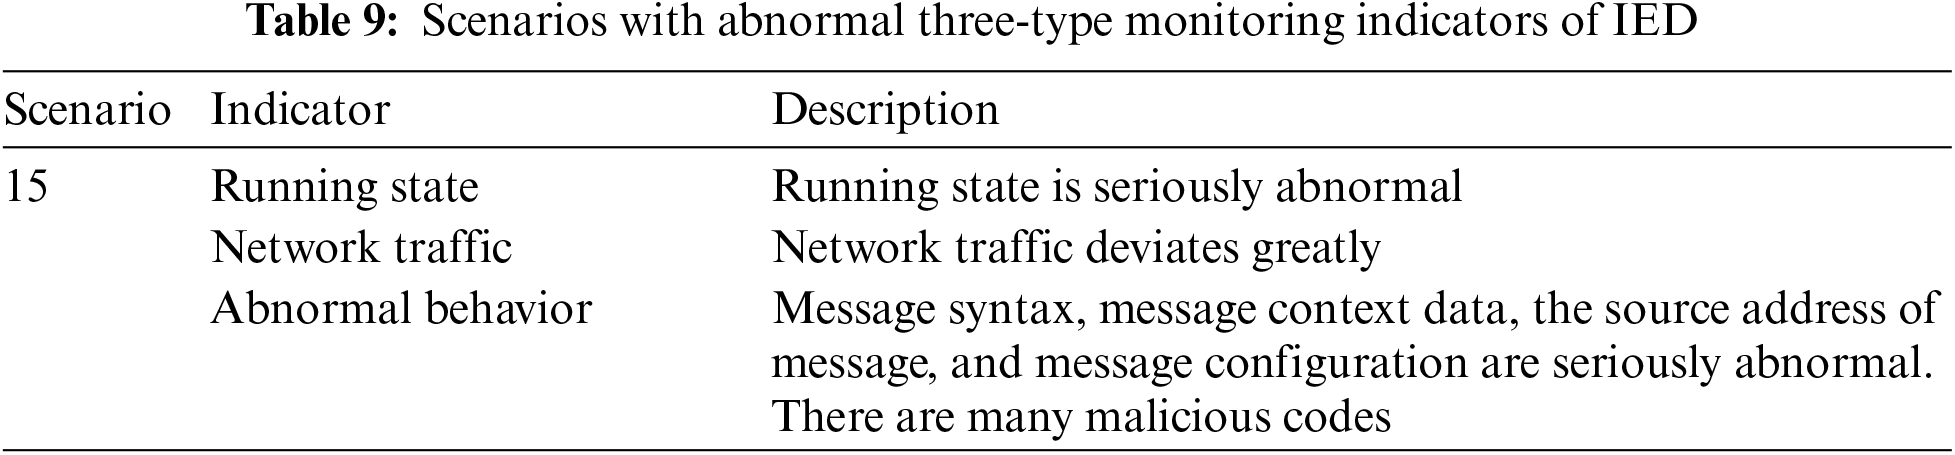
In order to thoroughly validate our proposed method, based on the security monitoring index system and potential monitoring outcomes outlined in Section 2, we consider 15 scenarios across three categories: operational status exhibiting abnormal single-type IED monitoring indicators, operational status exhibiting abnormal two-type IED monitoring indicators, and operational status exhibiting abnormal three-type IED monitoring indicators, as illustrated in Tables 7–9. Additionally, we consider the IED operational status under normal conditions as the reference scenario and designate it as Scenario 0.
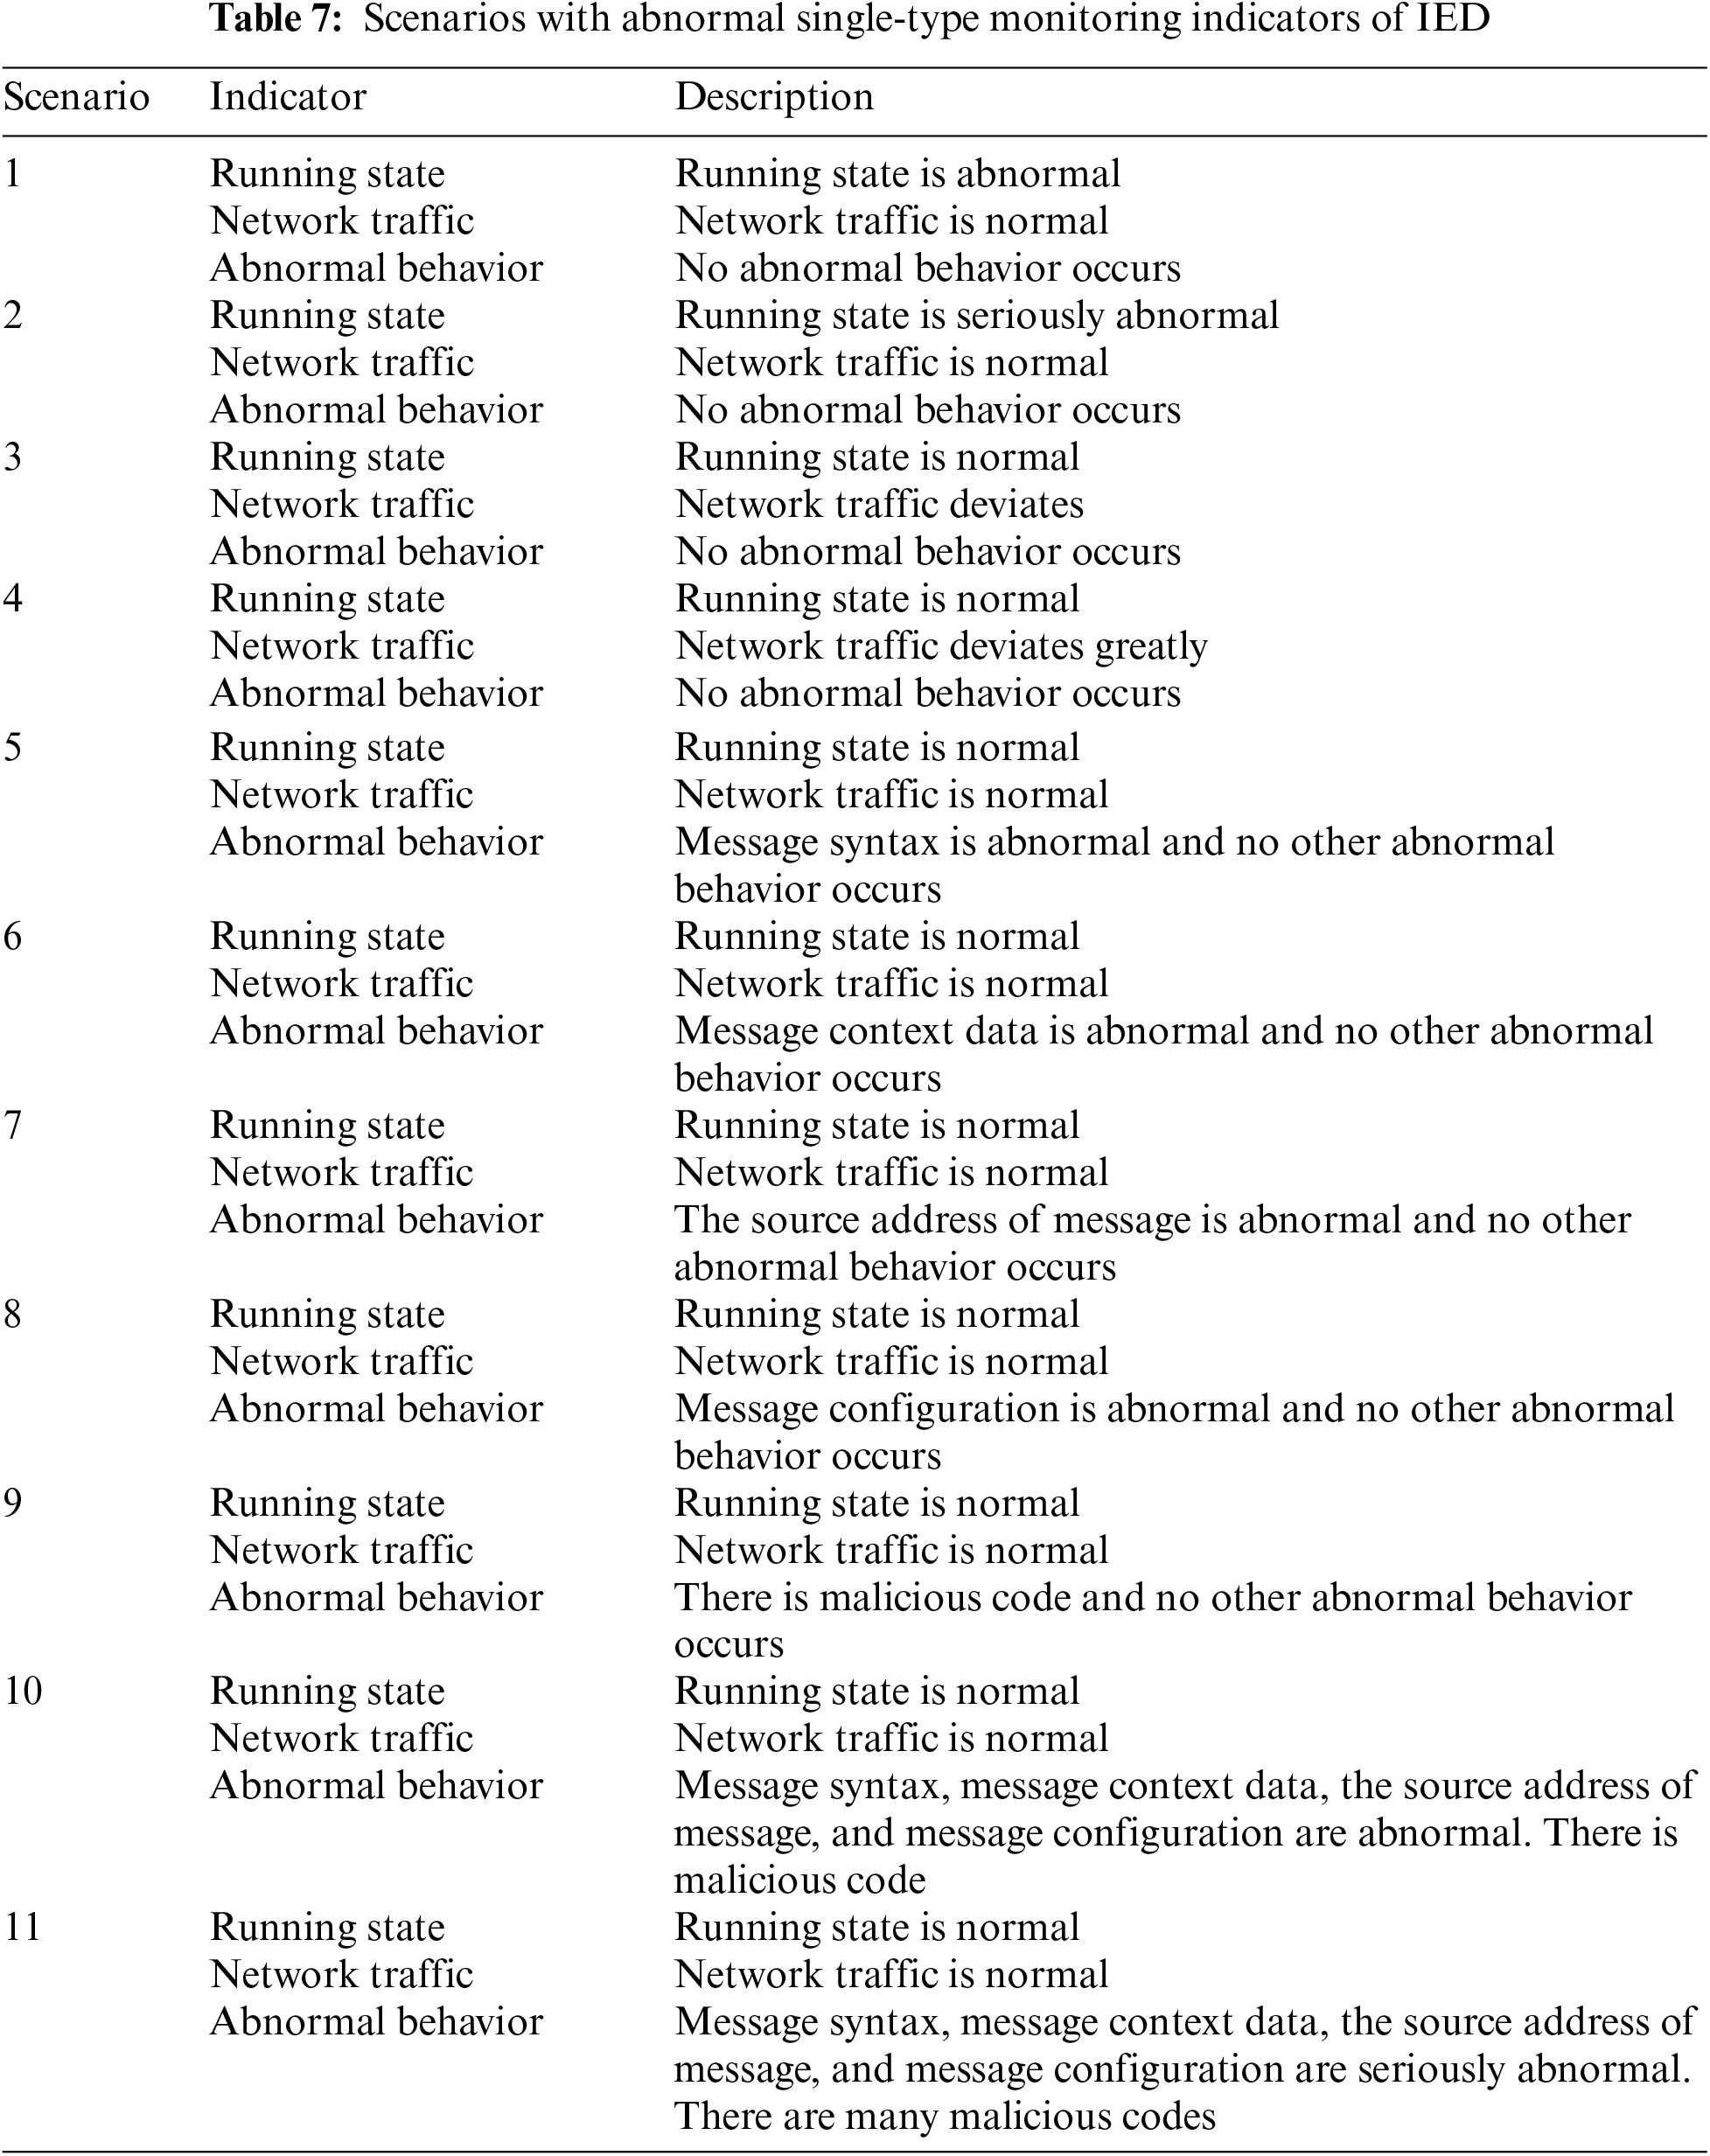
These scenarios are designed based on monitoring indicators and real-world situations that protective IEDs encounter. They consider factors such as resource availability, time constraints, and technical requirements. The scenarios cover the possible impact and consequences of various attacks and vulnerabilities that protective IEDs may face, thus representing actual security risks in the smart grid. Furthermore, these scenarios allow for rigorous validation of the proposed indicators and methods through repeated experimentation and analysis under various conditions. They can be refined and updated over time based on simulation feedback, emerging threats, or technological advancements, ensuring continuous improvement of the assessment index and method.
5.2 Assessment Results and Analysis
Based on the workflow of the IED security assessment proposed in Section 4, various monitoring indicators and their corresponding quantified values are extracted through simulation.
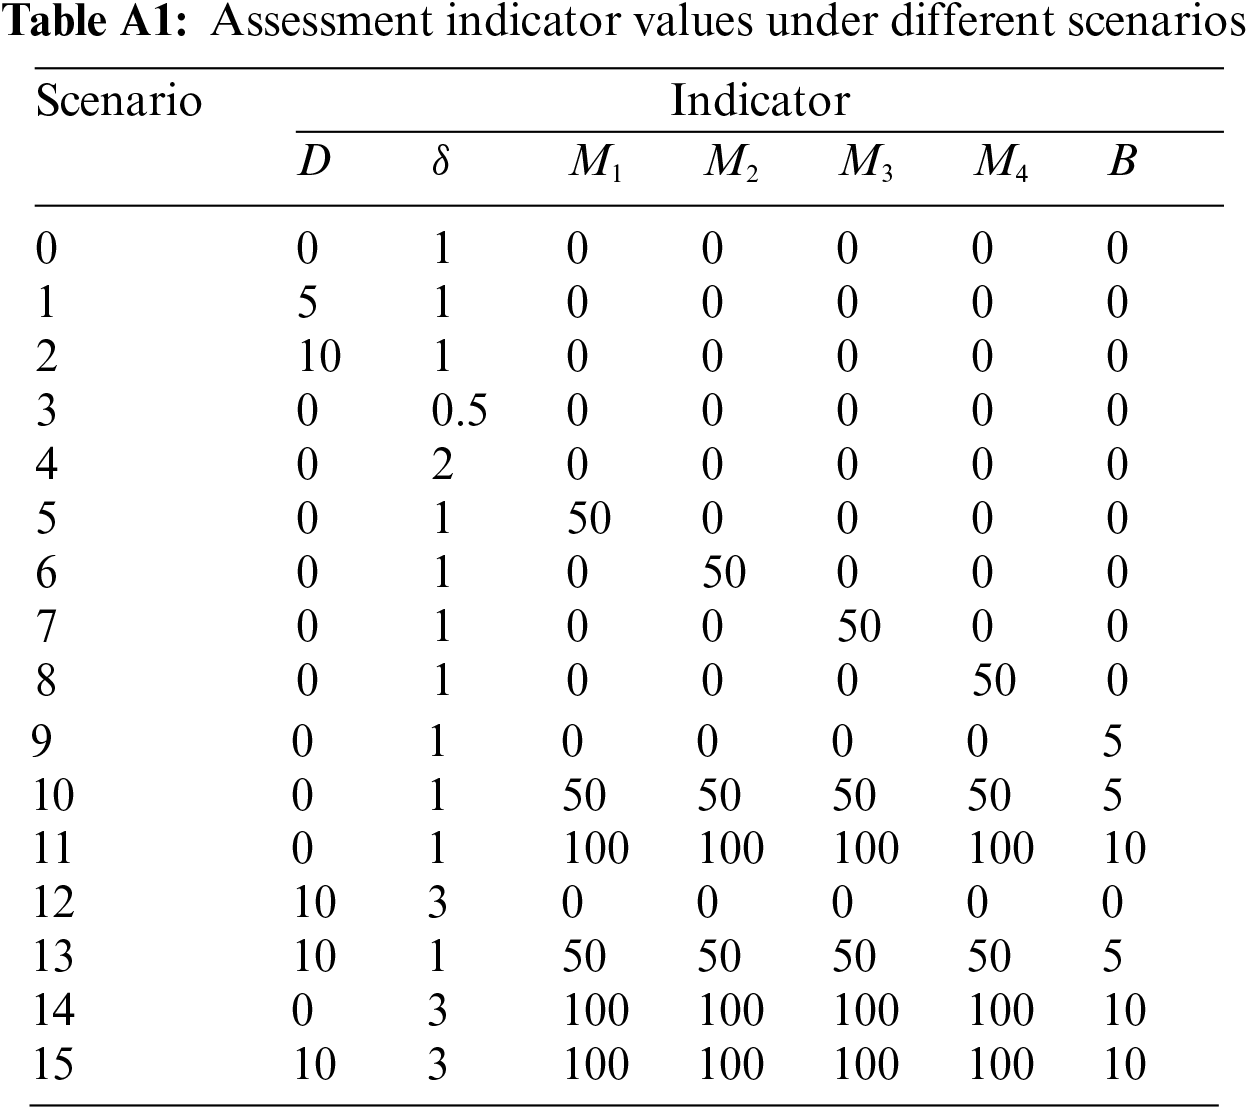
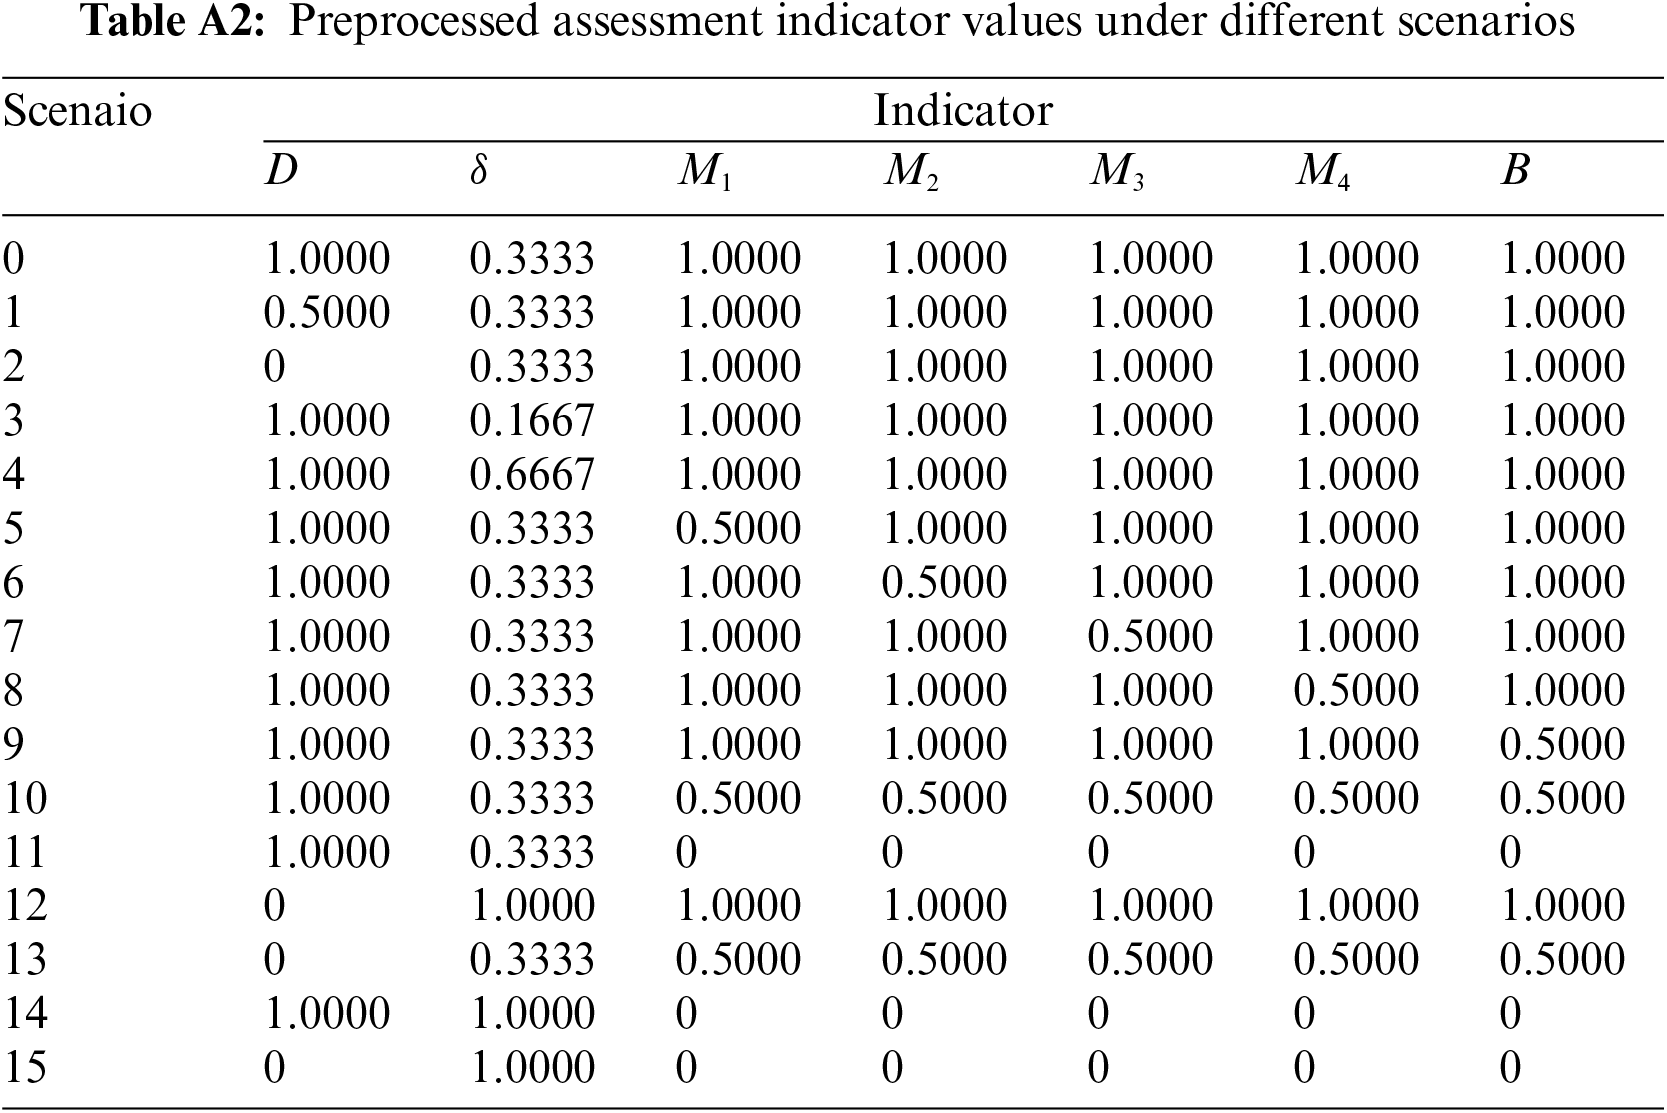
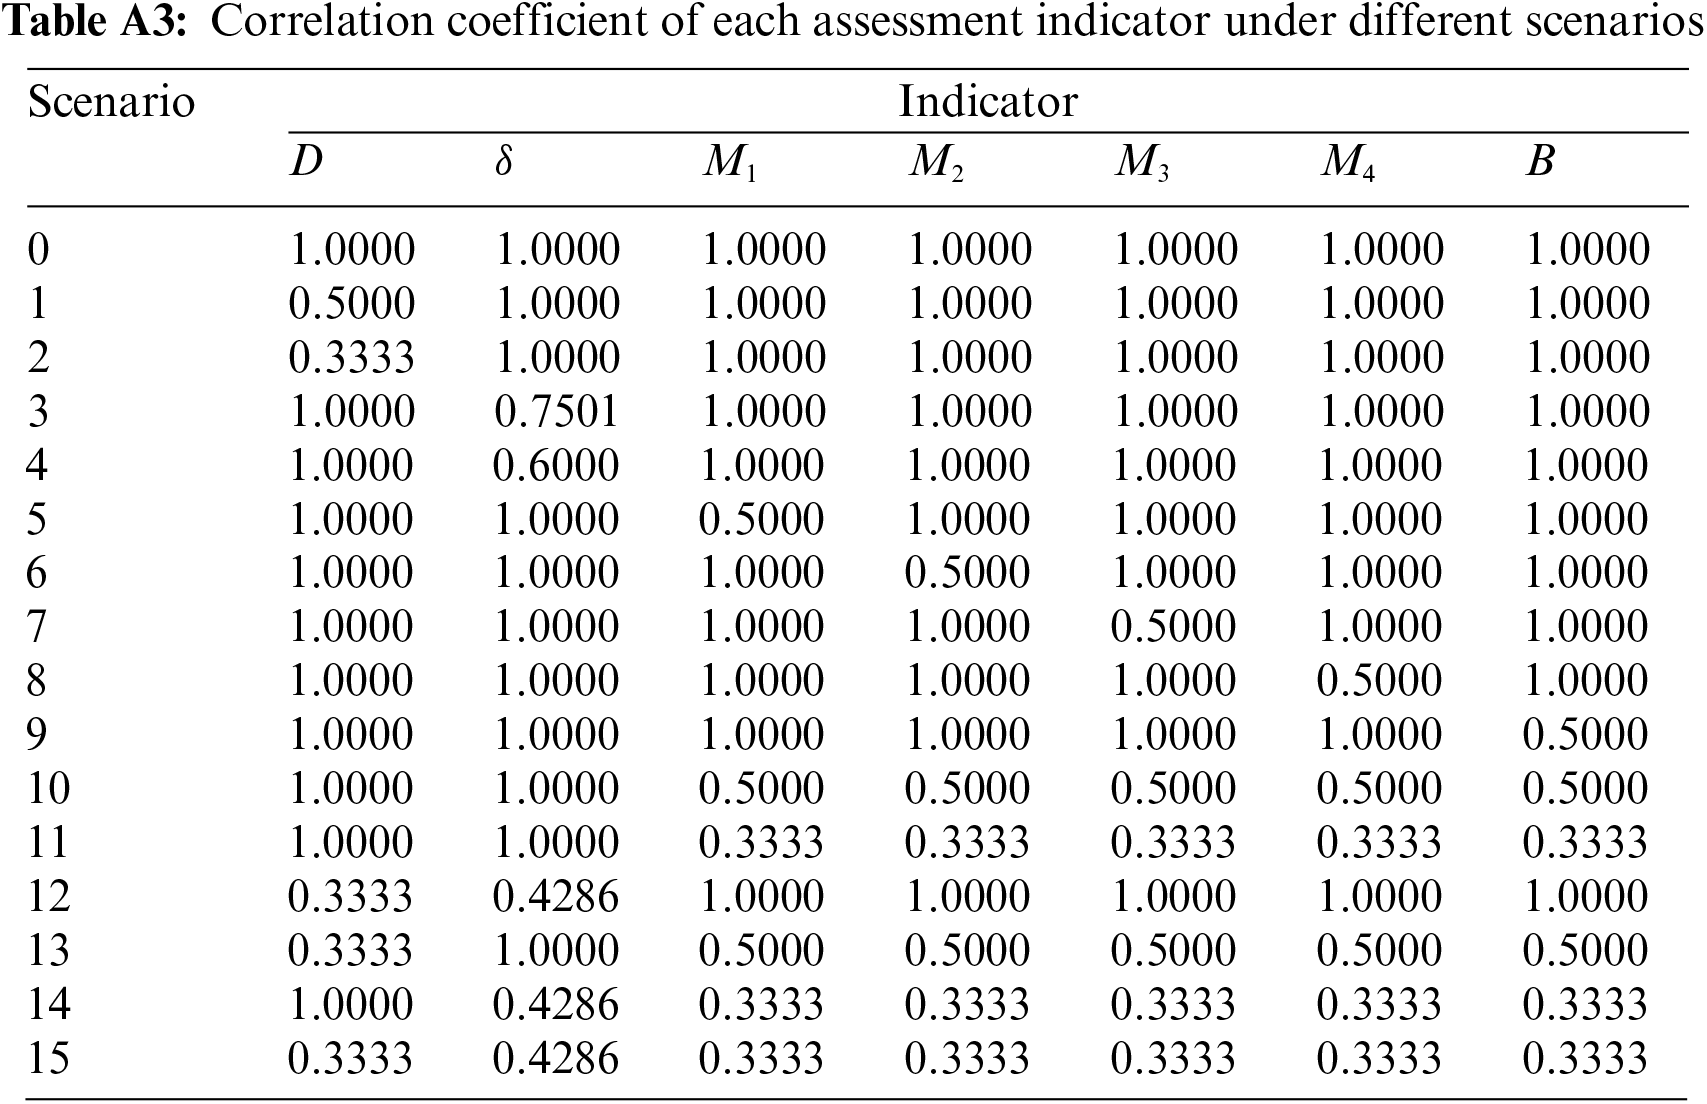
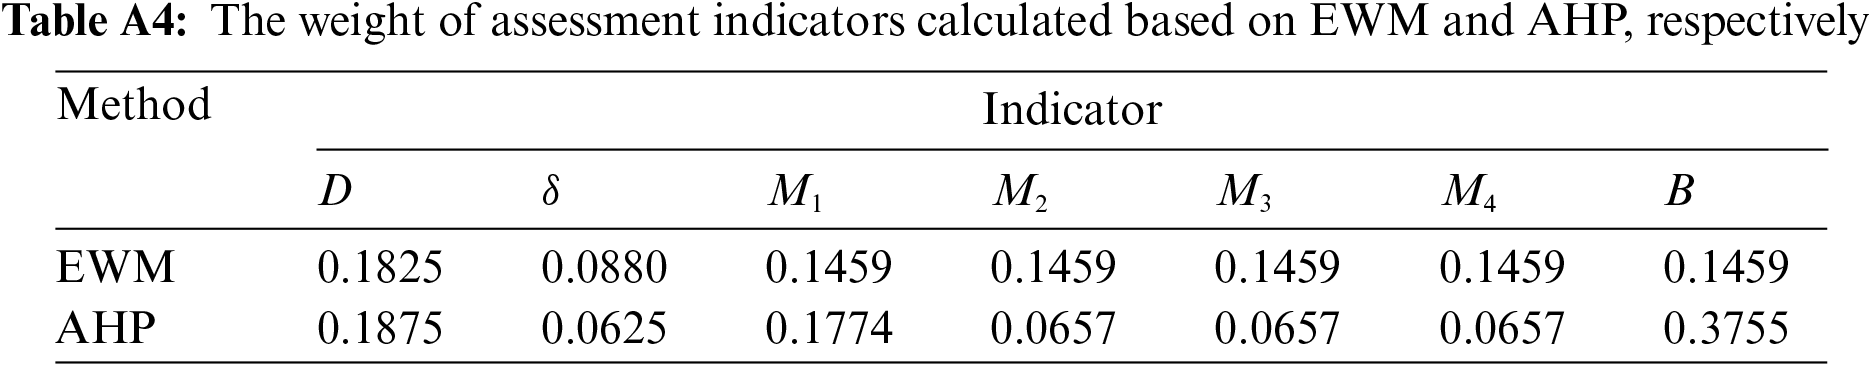
The quantified values of each indicator under different operation status are shown in Table A1. The values of the assessment indicator in Table A1 are preprocessed based on Eq. (3), and the preprocessed assessment indicator values are shown in Table A2. Using Scenario 0 as the reference scenario (i.e., IED operates normally), the correlation coefficients of each indicator to the reference scenario are calculated in different scenarios based on Eqs. (4)–(8). The calculation results are shown in Table A3. The weights of each indicator are calculated based on EWM and AHP methods, respectively [49,50], and the calculation results are shown in Table A4.
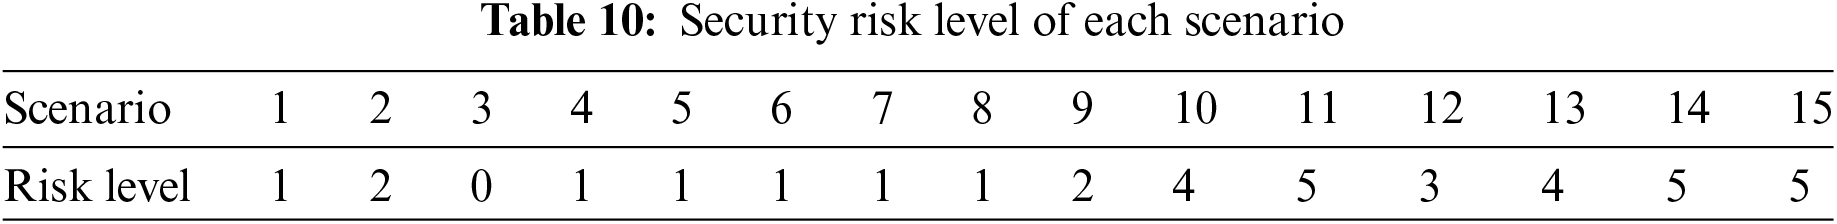
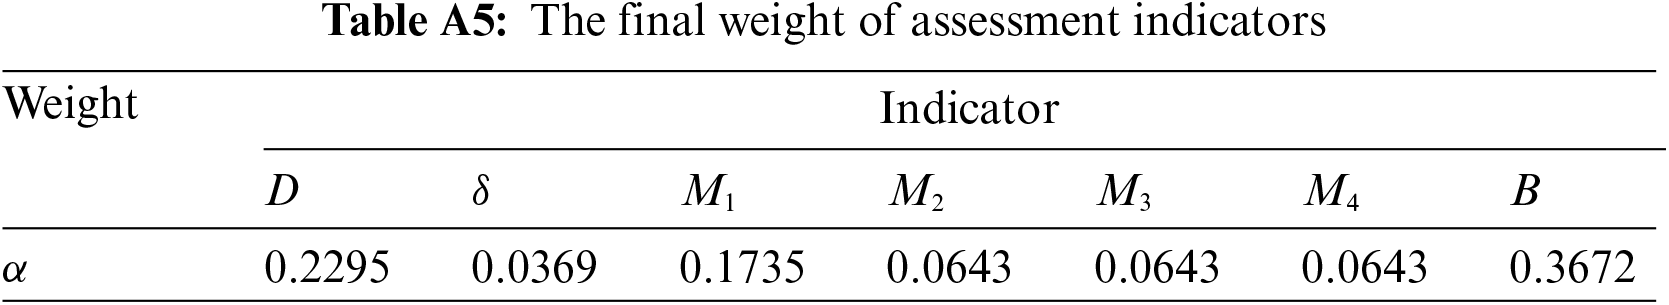
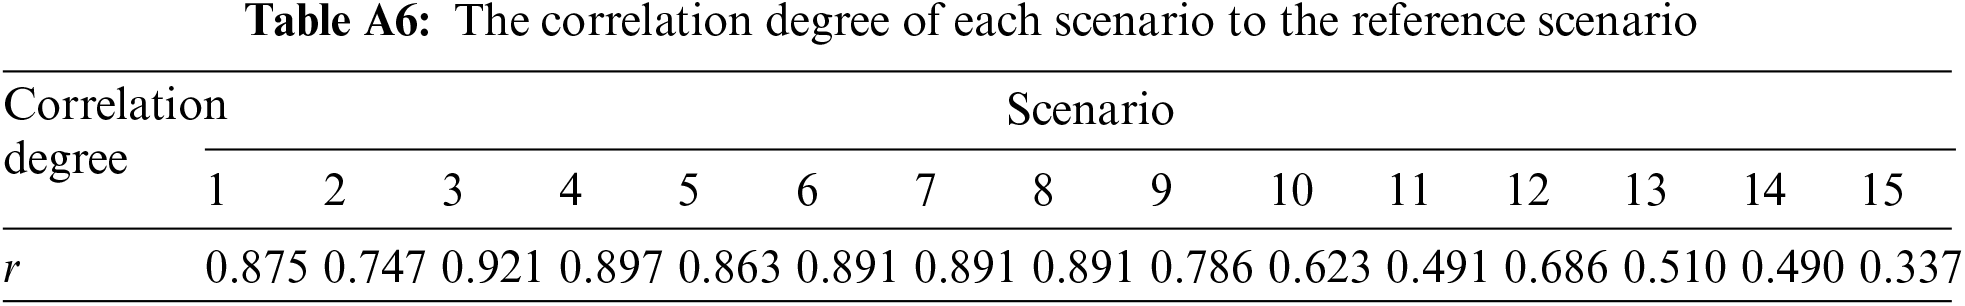
The combined weight of each indicator is calculated by Eq. (9), and the results are shown in Table A5. The correlation degree of each scenario to the reference Scenario 0 is calculated based on Eq. (10), and the results are shown in Table A6. Based on the graded risk levels of IED in Table 3, the interval in which the correlation degree of each scenario belongs is determined, and the security risk levels of IED in different scenarios are finally obtained, as shown in Table 10.
To verify the effectiveness of the GRCW-hybrid method for the security assessment of IEDs, the simulation scenarios in this paper are mainly focused on the local power grid from the provincial dispatching center to the 220 KV substation. Based on the typical structure of a smart substation, the local power grid structure is shown in Fig. 6 and its network simulation model is set up by the OPNET platform.
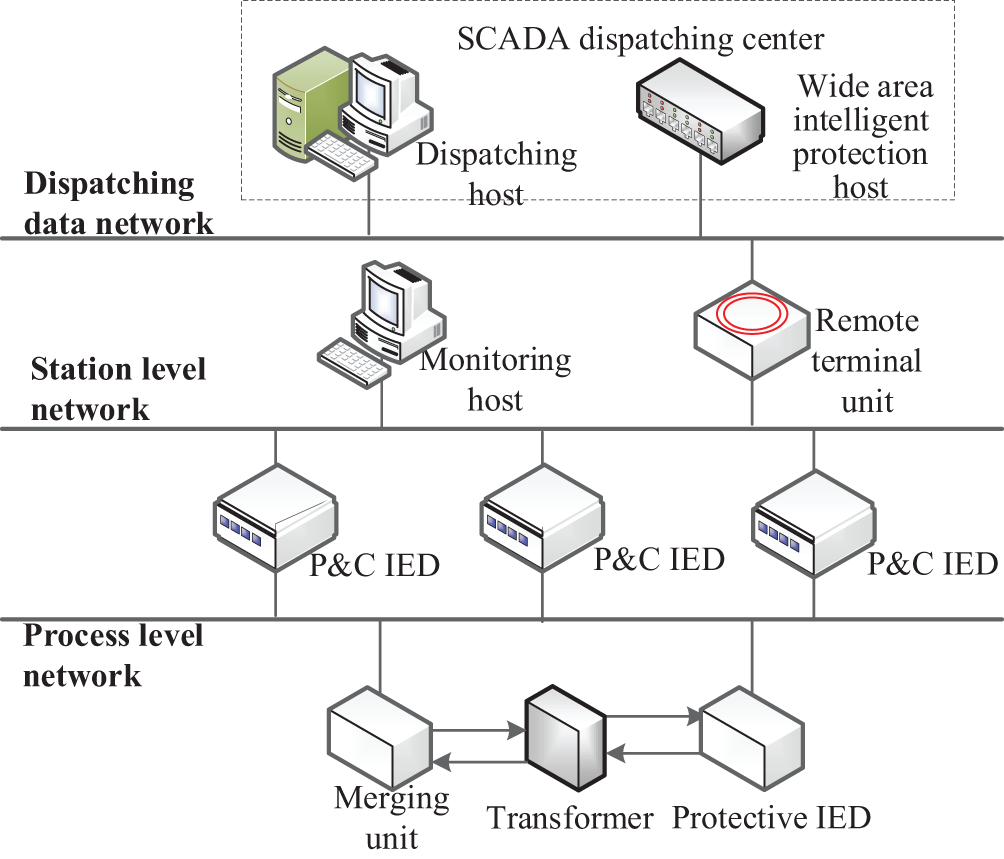
Figure 6: Local power grid structure of provincial dispatching center to substation
All simulations run on a Dell OptiPlex 3050 with a 3.3 GHz CPU and 16 GB ram. The software environment uses python 2.7+scapy for simulating message sending, Wireshark for simulating message receiving, and deploying monitoring agents to capture and process messages through switch mirroring ports. python 2.7+scapy supports the coding and decoding of built-in protocols and custom protocols, and can freely edit field information, which can well simulate the attack behaviors. In this environment, various running states of protective IED, DoS attacks, and the abnormal behaviors mentioned in Section 3.3 are simulated, covering all the scenarios in Tables 7–9. This section compares the actual simulation results of different scenarios with the security assessment results in Table 10 to illustrate the rationality of the proposed security monitoring index system and security assessment method.
(1) Comparing Scenario 1 and Scenario 2: In the actual simulation, the software and hardware operation status and communication environment of the IED in Scenario 2 is worse than that of Scenario 1. Therefore, the security risk of Scenario 2 is higher than that of Scenario 1. In Table 10, the risk level of Scenario 2 is 2, and the risk level of Scenario 1 is 1. The assessment result is consistent with the actual simulation situation.
(2) Comparing Scenario 3 and Scenario 4. In the actual simulation, IED in Scenario 4 suffers from DoS attacks, which caused abnormal traffic volatility. Therefore, the security risk of Scenario 4 is higher than that of Scenario 3. In Table 10, the risk level of Scenario 4 is 1, and the risk level of Scenario 3 is 0. The assessment result is consistent with the actual simulation situation.
(3) Comparing Scenario 2 and Scenario 12. In the actual simulation, the software and hardware operation status and communication environment of IED in both scenarios are abnormal. In addition, there is extremely high-frequency traffic communication in Scenario 12, which puts greater pressure on its normal service functions. Therefore, the security risk of Scenario 12 is higher than that of Scenario 2. In Table 10, the risk level of Scenario 12 is 3, and the risk level of Scenario 2 is 2. The assessment result is consistent with the actual simulation situation.
(4) Comparing Scenario 2 and Scenario 13. In the actual simulation, the software and hardware operation status and communication environment of IED in both scenarios are abnormal. In addition, there are multiple abnormal behaviors in Scenario 13. Therefore, the security risk of Scenario 13 is higher than that of Scenario 2. In Table 10, the risk level of Scenario 13 is 4, and the risk level of Scenario 2 is 2. The assessment result is consistent with the actual simulation situation.
(5) Comparing Scenario 4 and Scenario 14. In the actual simulation, IEDs in both scenarios suffer from DoS attacks, causing abnormal traffic volatility. In addition, there are multiple abnormal behaviors in Scenario 14. Therefore, the security risk of Scenario 14 is higher than that of Scenario 4. In Table 10, the risk level of Scenario 14 is 5, and the risk level of Scenario 4 is 1. The assessment result is consistent with the actual simulation situation.
(6) Comparing Scenarios 5, 6, 7, 8, 9, 10, and Scenario 11. In the actual simulation, the traffic and running state of these seven scenarios are normal, but there are different abnormal behaviors. Theoretically, a greater variety of abnormal behaviors corresponds to an increased security risk for IED.. In practice, malicious code attacks are more threatening than other abnormal behaviors. Therefore, the security risk of Scenario 9 is higher than that of Scenarios 5, 6, 7, and 8, the security risk of Scenario 10 is higher than that of Scenario 9, and the security risk of Scenario 11 is the highest. In Table 10, the risk level of Scenario 11 is 5, the risk level of Scenario 10 is 4, and Scenarios 5, 6, 7, and 8 have a risk level of 2. The assessment result is consistent with the actual situation.
(7) Comparing Scenarios 11, 12, 14, and Scenario 15. In the actual simulation, Scenarios 11, 14, and 15 all have multiple abnormal behaviors compared with Scenario 12, so the security risk of Scenario 12 is the lowest. In Table 10, Scenarios 11, 14, and 15 have a risk level of 5, and the risk level of Scenario 12 is 3. The assessment result is consistent with the actual situation.
The above analysis shows that the assessment result is consistent with the actual simulation situation and theoretical analysis conclusions, fully verifying the rationality and correctness of the proposed IED security monitoring index system and security assessment method in this paper.
IEDs are highly vulnerable to cyber-attacks due to factors such as outdated system versions, long operation cycles, and existing vulnerabilities within the system. The security of IEDs presents a substantial threat to the general stability and safety of smart grids.
To mitigate these risks, this paper provides a comprehensive analysis of the adopted IED security monitoring technologies. Recognizing the diverse types of IEDs in smart grids, a classification framework is proposed to facilitate further security assessment. This leads to the establishment of an IED security monitoring index system that encompasses running states, network traffic, and abnormal behaviors. By collecting and processing the relevant monitoring data, quantification methods are introduced to derive security monitoring indicator values for each type of IED. When quantifying the frequency of specific cyber-attacks, this paper innovatively proposed relevant detection methods based on the syntax features, semantic features, and anomaly alarms of messages.
Furthermore, a security assessment method for IEDs is proposed, which incorporates GRA, AHP, and EWM. The effectiveness of the index system and assessment method is then validated through the evaluation of 15 IED scenarios, covering various indicators and real-world situations.
Future research will focus on creating test cases for more types of IEDs and improving security monitoring indicators for IEDs. These efforts will help ensure the secure operation of IEDs in smart grids, thereby strengthening the system’s resilience against cyber-attacks.
Acknowledgement: The authors would like to express their heartfelt gratitude to the editors and reviewers for their detailed review and insightful advice.
Funding Statement: The financial support from the Program for Science and Technology of Henan Province of China (Grant No. 242102210148), Henan Center for Outstanding Overseas Scientists (Grant No. GZS2022011) and Songshan Laboratory Pre-Research Project (Grant No. YYJC032022022).
Author Contributions: Yangrong Chen: Conception, Design of study, Acquisition of data, Analysis and/or interpretation of data, Writing—original draft, Writing—review & editing. June Li: Conception, Design of study, Writing—review & editing. Yu Xia and Ruiwen Zhang: Analysis and/or interpretation of data. Lingling Li, Xiaoyu Li and Lin Ge: Writing—review & editing. All authors reviewed the results and approved the final version of the manuscript.
Availability of Data and Materials: The data and codes that support the findings of this study are available from the corresponding authors upon reasonable request.
Ethics Approval: This study did not involve human or animal subjects, and thus, no ethical approval was required. The study protocol adhered to the guidelines established by the journal.
Conflicts of Interest: The authors declare that they have no conflicts of interest to report regarding the present study.
References
1. J. H. Hong and C. C. Liu, “Intelligent electronic devices with collaborative intrusion detection systems,” IEEE Trans. Smart Grid, vol. 10, no. 1, pp. 271–281, Jan. 2019. doi: 10.1109/TSG.2017.2737826. [Google Scholar] [CrossRef]
2. G. Clarke, D. Reynders, and E. Wright, “Intelligent electronic devices (IEDs),” in Practical Modern SCADA Protocols, Dec. 2003, pp. 312–315. doi: 10.1016/B978-075065799-0/50027-9. [Google Scholar] [CrossRef]
3. T. Alladi, V. Chamola, and S. Zeadally, “Industrial control systems: Cyberattack trends and countermeasures,” Comput. Commun., vol. 155, no. 1, pp. 1–8, Apr. 2020. doi: 10.1016/j.comcom.2020.03.007. [Google Scholar] [CrossRef]
4. A. Yang, L. M. Sun, X. S. Wang, and Z. Q. Shi, “Intrusion detection techniques for industrial control systems,” J. Comput. Res. Dev., vol. 53, no. 9, pp. 2039–2054, Sep. 2016. doi: 10.7544/issn1000-1239.2016.20150465. [Google Scholar] [CrossRef]
5. J. He et al., “Type and verification of network attacks on embedded terminals of intelligent substation,” Electric. Power, vol. 53, no. 1, pp. 81–91, Jan. 2020. doi: 10.11930/j.issn.1004-9649.201912050. [Google Scholar] [CrossRef]
6. Y. F. Suo, S. J. Wang, Y. Qin, Q. X. Li, D. J. Feng and J. C. Li, “Summary of security technology and application in industrial control system,” Comput. Sci., vol. 45, no. 4, pp. 25–33, Apr. 2018. doi: 10.11896/j.issn.1002-137X.2018.04.004. [Google Scholar] [CrossRef]
7. Y. J. Li, R. W. He, X. Y. Ji, and W. Y. Xu, “Using power side-channel to implement anomaly-based intrusion detection on smart grid terminals,” in 2019 IEEE 3rd Conf. Energy Internet Energy Syst. Integrat. (EI2), Changsha, China, Nov. 2019, pp. 2669–2674. doi: 10.1109/EI247390.2019.9061783. [Google Scholar] [CrossRef]
8. Y. Wang, J. E. Li, X. Chen, H. Lin, F. J. Yu and J. B. Luo, “Remote attestation for intelligent electronic devices in smart grid based on trusted level measurement,” Chin. J. Electron., vol. 29, no. 3, pp. 437–446, May 2020. doi: 10.1049/cje.2020.02.019. [Google Scholar] [CrossRef]
9. H. Qin, J. M. Weng, D. Liu, D. L. Qi, and Y. F. Wang, “Risk assessment and defense resource allocation of cyber-physical distribution system under denial of service attack,” CSEE J. Power Energy Syst., Dec. 2021. doi: 10.17775/CSEEJPES.2020.04550. [Google Scholar] [CrossRef]
10. Y. Wang, J. E. Li, L. Zhou, H. X. Wang, W. H. Wen and X. D. Lu, “A self-healing architecture for power industrial control systems against security threats to embedded terminals,” Power Syst. Technol., vol. 44, no. 9, pp. 3582–3594, Sep. 2020. doi: 10.13335/j.1000-3673.pst.2019.1425. [Google Scholar] [CrossRef]
11. A. Stefanov and C. C. Liu, “Cyber-power system security in a smart grid environment,” in 2012 IEEE PES Innov. Smart Grid Technol. (ISGT), Jan. 2012, Washington, DC, USA, vol. 2, pp. 1–3. doi: 10.1109/ISGT.2012.6175560. [Google Scholar] [CrossRef]
12. P. E. Weerathunga and A. Cioraca, “The importance of testing Smart Grid IEDs against security vulnerabilities,” in 2016 69th Annu. Conf. Protect. Relay Eng. (CPRE), College Station, TX, USA, Apr. 2016, pp. 1–21. doi: 10.1109/CPRE.2016.7914920. [Google Scholar] [CrossRef]
13. H. Wu and Z. H. Wang, “Multi-source fusion-based security detection method for heterogeneous networks,” Comput. Secur., vol. 74, no. 2, pp. 55–70, Feb. 2018. doi: 10.1016/j.cose.2018.01.003. [Google Scholar] [CrossRef]
14. Q. L. Guo, S. J. Xin, J. H. Wang, and H. B. Sun, “Comprehensive security assessment for a cyber physical energy system: A lesson from Ukraine’s blackout,” Autom. Electr. Power Syst., vol. 40, no. 5, pp. 145–147, Mar. 2016. doi: 10.7500/AEPS20160113101. [Google Scholar] [CrossRef]
15. Y. Ding and J. B. Liu, “Real-time false data injection attack detection in energy internet using online robust principal component analysis,” in IEEE Conf. Energy Internet Energy Syst. Integrat. (EI2), Beijing, China, Nov. 2017, pp. 1–6. doi: 10.1109/EI2.2017.8245663. [Google Scholar] [CrossRef]
16. L. F. Fang, L. Huang, Q. Zhao, and A. Q. Pan, “Discussion on megalopolis power grid safety from the perspective of Venezuelan blackout,” Power Energ., vol. 40, no. 6, pp. 674–677, Dec. 2019. doi: 10.11973/dlyny201906009. [Google Scholar] [CrossRef]
17. Y. K. Jiang and B. Q. Wang, “Analysis on network information security protection technology of intelligent terminal power monitoring system of substation under the support of multimodal multimedia information,” Adv Multimedia, vol. 8607305, no. 7, pp. 1–12, Apr. 2023. doi: 10.1155/2023/8607305. [Google Scholar] [CrossRef]
18. W. W. Tao, Y. Cao, M. Y. Li, L. Y. Lu, Z. M. Jiang and W. Z. Zhang, “Research on terminal security protection of zero-trust smart grid based on fog computing,” in 2023 5th Int. Conf. Intell. Control, Measurement Signal Process. (ICMSP), Chengdu, China, May 2023, pp. 1–4. doi: 10.1109/ICMSP58539.2023.10171079. [Google Scholar] [CrossRef]
19. J. Y. Wang and D. Y. Shi, “Cyber-attacks related to intelligent electronic devices and their countermeasures: A review,” in Proc. 53rd Int. Universities Power Eng. Conf. (UPEC), Glasgow, UK, Sep. 2018, pp. 1–6. doi: 10.1109/UPEC.2018.8542059. [Google Scholar] [CrossRef]
20. M. Bahrami, M. Fotuhi-Firuzabad, and H. Farzin, “Reliability evaluation of power grids considering integrity attacks against substation protective IEDs,” IEEE Trans. Ind. Inf., vol. 16, no. 2, pp. 1035–1044, Feb. 2020. doi: 10.1109/TII.2019.2926557. [Google Scholar] [CrossRef]
21. T. S. Ustun, S. M. Farooq, and S. M. S. Hussain, “A novel approach for mitigation of replay and masquerade attacks in smart grids using IEC 61850 standard,” IEEE Access, vol. 7, pp. 156044–156053, Oct. 2019. doi: 10.1109/ACCESS.2019.2948117. [Google Scholar] [CrossRef]
22. C. Wang, C. W. Ten, Y. H. Hou, and A. Ginter, “Cyber inference system for substation anomalies against alter-and-hide attacks,” IEEE Trans. Power Syst., vol. 32, no. 2, pp. 896–909, Mar. 2017. doi: 10.1109/TPWRS.2016.2574769. [Google Scholar] [CrossRef]
23. Z. W. Jiang, D. Wang, Y. H. Wang, Z. M. Yang, and B. X. Liu, “Model for power smart terminal security assessment,” Comput. Eng. Des., vol. 35, no. 1, pp. 6–10, Jan. 2014. doi: 10.16208/j.issn1000-7024.2014.01.008. [Google Scholar] [CrossRef]
24. D. Q. Liu, X. J. Zeng, and Y. N. Wang, “Security situation assessment of intelligent distribution transformer terminal unit based on information entropy,” Southern Power Syst. Technol., vol. 14, no. 1, pp. 18–23, Jan. 2020. [Google Scholar]
25. Z. N. Lv, Z. H. Hu, B. F. Ning, Y. Sun, G. F. Yan and X. S. Shi, “An anomaly detection algorithm for the power industrial terminal security monitoring,” in 2019 Chinese Automation Congress (CAC), Nov. 2019, vol. 2, pp. 3696–3700. doi: 10.1109/CAC48633.2019.8996440. [Google Scholar] [CrossRef]
26. T. Zhang, D. Y. Zhao, F. Xue, B. Zhang, and R. Zhang, “Research framework of cyber-security protection technologies for smart terminals in power system,” Autom. Electr. Power Syst., vol. 43, no. 19, pp. 1–8+67, Oct. 2019. doi: 10.7500/AEPS20180803003. [Google Scholar] [CrossRef]
27. Y. Liu, H. Qin, Z. T. Chen, C. C. Shi, R. Zhang and W. Chen, “Research on cyber security defense technology of power generation acquisition terminal in new energy plant,” in 2019 IEEE Int. Conf. Energy Internet (ICEI), Nanjing, China, May 2019, pp. 25–30. doi: 10.1109/ICEI.2019.00011. [Google Scholar] [CrossRef]
28. X. J. Zhou et al., “Research on impact assessment of attacks on power terminals,” in 2021 6th Int. Conf. Intell. Comput. Signal Proc. (ICSP), Xi’an, China, Apr. 2021, pp. 1401–1404. doi: 10.1109/ICSP51882.2021.9408839. [Google Scholar] [CrossRef]
29. B. Zhang, Z. Z. Wang, W. Wang, Z. Wang, H. L. Liang and D. Q. Liu, “Security assessment of intelligent distribution transformer terminal unit based on RBF-SVM,” in 2020 IEEE 4th Conf. Energy Internet Energy Syst. Integr. (EI2), Wuhan, China, Oct. 2020, pp. 4342–4346. doi: 10.1109/EI250167.2020.9346959. [Google Scholar] [CrossRef]
30. Z. N. Lv, Z. H. Hu, G. F. Yan, B. F. Ning, N. X. Guo and Y. N. Wang, “Research on power terminal security monitoring method based on business logic consistency,” in Proc. 2019 2nd Int. Conf. Algorithms, Comput. Artif. Intell. (ACAI’ 19), Sanya, China, Dec. 2019, pp. 1–8. doi: 10.1145/3377713.3377751. [Google Scholar] [CrossRef]
31. S. Ren, D. F. Chen, Y. D. Tao, S. H. Xu, G. Wang and Z. B. Yang, “Intelligent terminal security technology of power grid sensing layer based upon information entropy data mining,” J. Intell. Syst., vol. 31, no. 1, pp. 817–834, 2022. doi: 10.1515/jisys-2022-0117. [Google Scholar] [CrossRef]
32. Y. M. Xiang, L. F. Wang, and Y. C. Zhang, “Adequacy evaluation of electric power grids considering substation cyber vulnerabilities,” Int. J. Electr. Power Energy Syst., vol. 96, no. 3, pp. 368–379, Mar. 2018. doi: 10.1016/j.ijepes.2017.10.004. [Google Scholar] [CrossRef]
33. Q. L. Liu and X. P. Wang, “Real time monitoring simulation of abnormal state of large data in smart grid,” Comput. Simul., vol. 36, no. 3, pp. 364–367, Mar. 2019. [Google Scholar]
34. X. M. Ye, J. H. Zhao, Y. Zhang, and F. S. Wen, “Quantitative vulnerability assessment of cyber security for distribution automation systems,” Energies, vol. 8, no. 6, pp. 5266–5286, Jun. 2015. doi: 10.3390/en8065266. [Google Scholar] [CrossRef]
35. H. Dong, J. Zhao, X. Yang, and K. Yang, “Combination of D-AHP and grey theory for the assessment of the information security risks of smart grids,” Math. Problems Eng., vol. 9, no. 9, pp. 1–14, Oct. 2020. doi: 10.1155/2020/3517104. [Google Scholar] [CrossRef]
36. P. Jouni, “Assessment of cyber security risks: A smart terminal process,” in Proc. 22nd Euro. Conf. Cyber Warfare Secur., Piraeus, Greece, vol. 22, no. 1, pp. 366–373, Jun. 19, 2023. doi: 10.34190/eccws.22.1.1060. [Google Scholar] [CrossRef]
37. J. N. Wang, Z. Y. Li, and X. W. Li, “Dentification of abnormal behavior in industrial network based on semantic vector and OCSVM,” Comput. Syst. Appl., vol. 27, no. 7, pp. 236–242, Jun. 2018. doi: 10.15888/j.cnki.csa.006443. [Google Scholar] [CrossRef]
38. Y. Yang, H. Q. Xu, L. Gao, Y. B. Yuan, K. McLaughlin and S. Sezer, “Multidimensional intrusion detection system for IEC 61850-based SCADA networks,” IEEE Trans. Power Deliv., vol. 32, no. 2, pp. 1068–1078, Apr. 2017. doi: 10.1109/TPWRD.2016.2603339. [Google Scholar] [CrossRef]
39. H. Yoo and T. Shon, “Novel approach for detecting network anomalies for substation automation based on IEC 61850,” Multimedia Tools Appl., vol. 74, no. 1, pp. 303–318, 2015. doi: 10.1007/s11042-014-1870-0. [Google Scholar] [CrossRef]
40. S. Wang et al., “THREATRACE: Detecting and tracing host-based threats in node level through provenance graph learning,” IEEE Trans. Inf. Forensics Secur., vol. 17, pp. 3972–3987, Dec. 2022. doi: 10.1109/TIFS.2022.3208815. [Google Scholar] [CrossRef]
41. H. Satilmiş, S. Akleylek, and Z. Y. Tok, “A systematic literature review on host-based intrusion detection systems,” IEEE Access, vol. 12, no. 1, pp. 27237–27266, Feb. 2024. doi: 10.1109/ACCESS.2024.3367004. [Google Scholar] [CrossRef]
42. S. Kumar, S. Gupta, and S. Arora, “Research trends in network-based intrusion detection systems: A review,” IEEE Access, vol. 9, pp. 157761–157779, Nov. 2021. doi: 10.1109/ACCESS.2021.3129775. [Google Scholar] [CrossRef]
43. M. Shen et al., “Machine learning-powered encrypted network traffic analysis: A comprehensive survey,” IEEE Commun. Surv. Tutorials, vol. 25, no. 1, pp. 791–824, 2023. doi: 10.1109/COMST.2022.3208196. [Google Scholar] [CrossRef]
44. H. N. Yan et al., “MARS: Automated protocol analysis framework for internet of things,” IEEE Internet Things J, vol. 9, no. 19, pp. 18333–18345, Oct. 2022. doi: 10.1109/JIOT.2022.3160296. [Google Scholar] [CrossRef]
45. Q. Wang, C. Wang, Z. Y. Feng, and J. F. Ye, “Review of K-means clustering algorithm,” Electron. Des. Eng., vol. 20, no. 7, pp. 21–24, Apr. 2012. doi: 10.14022/j.cnki.dzsjgc.2012.07.034. [Google Scholar] [CrossRef]
46. Y. H. Dai and X. D. Yin, “Malicious code detection based on random forest,” Cyberspace Secur., vol. 9, no. 2, pp. 70–75, Feb. 2018. [Google Scholar]
47. J. L. Deng, “Grey control system,” Syst. Control Lett., vol. 1, no. 5, pp. 288–2941, Mar. 1982. doi: 10.1016/S0167-6911(82)80025-X. [Google Scholar] [CrossRef]
48. W. Sun, X. F. Pang, W. Liu, Y. B. Wang, and C. F. Luan, “Short-term power load forecasting based on grey relational analysis and support vector machine,” in 2022 4th Int. Conf. Indus. Artif. Intell (IAI), Shenyang, China, Aug. 2022, pp. 1–5. doi: 10.1109/IAI55780.2022.9976828. [Google Scholar] [CrossRef]
49. J. E. Li, J. Q. Liang, Q. Y. Liu, D. L. Qi, J. L. Zhang and Y. Y. R. Chen, “Research on situation assessment of active distribution networks considering cyberattacks,” Front Energy Res, vol. 10, pp. 1–12, Aug. 2022. doi: 10.3389/fenrg.2022.971725. [Google Scholar] [CrossRef]
50. Y. R. Chen, J. E. Li, A. Xu, K. Yuan, K. P. Liu and M. Ning, “Reliability evaluation method for smart substation based on cyber-physical fusion,” Autom. Electr. Power Syst., vol. 45, no. 3, pp. 102–110, Feb. 2021. doi: 10.7500/AEPS20200316001. [Google Scholar] [CrossRef]
Appendix A
Cite This Article
 Copyright © 2024 The Author(s). Published by Tech Science Press.
This work is licensed under a Creative Commons Attribution 4.0 International License , which permits unrestricted use, distribution, and reproduction in any medium, provided the original work is properly cited.
 Downloads
 Citation Tools