
 Submit a Paper
 Propose a Special lssue
 Open Access
ARTICLE
ConvNeXt-UperNet-Based Deep Learning Model for Road Extraction from High-Resolution Remote Sensing Images
1 Geographic Information and Tourism College, Chuzhou University, Chuzhou, 239000, China
2 Anhui Province Key Laboratory of Physical Geographic Environment, Chuzhou University, Chuzhou, 239000, China
* Corresponding Author: Jing Wang. Email:
Computers, Materials & Continua 2024, 80(2), 1907-1925. https://doi.org/10.32604/cmc.2024.052597
Received 08 April 2024; Accepted 12 June 2024; Issue published 15 August 2024
 View Full Text
 Download PDF
Abstract
When existing deep learning models are used for road extraction tasks from high-resolution images, they are easily affected by noise factors such as tree and building occlusion and complex backgrounds, resulting in incomplete road extraction and low accuracy. We propose the introduction of spatial and channel attention modules to the convolutional neural network ConvNeXt. Then, ConvNeXt is used as the backbone network, which cooperates with the perceptual analysis network UPerNet, retains the detection head of the semantic segmentation, and builds a new model ConvNeXt-UPerNet to suppress noise interference. Training on the open-source DeepGlobe and CHN6-CUG datasets and introducing the DiceLoss on the basis of CrossEntropyLoss solves the problem of positive and negative sample imbalance. Experimental results show that the new network model can achieve the following performance on the DeepGlobe dataset: 79.40% for precision (Pre), 97.93% for accuracy (Acc), 69.28% for intersection over union (IoU), and 83.56% for mean intersection over union (MIoU). On the CHN6-CUG dataset, the model achieves the respective values of 78.17% for Pre, 97.63% for Acc, 65.4% for IoU, and 81.46% for MIoU. Compared with other network models, the fused ConvNeXt-UPerNet model can extract road information better when faced with the influence of noise contained in high-resolution remote sensing images. It also achieves multiscale image feature information with unified perception, ultimately improving the generalization ability of deep learning technology in extracting complex roads from high-resolution remote sensing images.Keywords
Roads are one of the most important infrastructures of human society and a key component of geospatial information. Roads play a very important role in urban planning, disaster management, agricultural development, intelligent transportation, and other fields [1]. Extracting road information from high-resolution remote sensing images is an important means of updating road information.
Traditional road extraction methods can be roughly divided into two types: pixel-based and object-oriented methods [2]. These methods have been instrumental in the initial stages of road extraction from remote sensing imagery. Pixel-based methods often rely on the spectral characteristics of pixels to distinguish roads from other land covers, while object-oriented methods focus on the shape and texture of road objects within the image. However, both methods are suitable only for remote sensing images with single road types and simple backgrounds, which limits their application in complex urban environments with diverse road structures and cluttered backgrounds. With the development and progress of science and technology, deep learning methods are now widely used for road extraction.
Deep learning can automatically learn image features, and use these features to classify and recognize images. It has strong adaptability and robustness, and can automatically extract geospatial information by using neural networks. In the deep learning framework, semantic segmentation tasks are typically accomplished using architectures such as convolutional neural networks (CNNs) [3]. Inspired by CNNs, Shelhamer et al. [4] proposed an end-to-end deep learning framework called a fully convolutional network (FCN). Deep learning technology has made breakthroughs in image processing. The full convolution structure of FCN enables it to effectively capture global and contextual information in images, which is crucial for improving image segmentation performance. To enhance the context-understanding ability of networks, some scholars have proposed semantic segmentation networks based on dilated convolution. They added a multiscale context semantic fusion module, such as the pyramid pool module of the pyramid scene analysis network PSPNet [5], to obtain context information using different pooling scales. DeepLabv2 [6] solved the target multiscale problem by adding a space pyramid pooling module (ASPP). To achieve rich multiscale features, the author proposed DeepLabv3 with a variety of different sampling rates ASPP [7]. Additionally, there is an encoder-decoder based semantic segmentation network [8], which combines the feature maps in the encoder with the feature maps at the corresponding levels in the decoder. This helps to restore image details while retaining high-level feature information, ensuring segmentation accuracy.
Road extraction in remote sensing images is a specific application in semantic segmentation. In recent years, researchers have focused on improving network architectures and feature extraction methods to enhance semantic segmentation. This has led to the proposal of innovative methods and research results. For instance, Wang et al. [9] proposed an enhanced U-Net approach for extracting roads from high-resolution images. This method effectively addresses the overfitting issue during neural network training. However, it performs poorly in densely built-up, shadowed, and tree-occluded areas. Ge et al. [10] proposed an automatic method for extracting roads from high-resolution remote sensing images. The method is based on the DeepLabV3+ network, which combines an encoder with multispace pyramid pooling to achieve road boundary extraction. Hu et al. [11] proposed a remote sensing image road extraction network that improves upon ResUNet by replacing the original encoder structure and using atrous spatial convolution pooling pyramid modules. These modules have anti-occlusion and reasoning capabilities; however, the model still needs to improve its occlusion ability in more complex backgrounds and shorten training time. In response to missed extraction problems caused by the loss of spatial features and detailed object information in deep learning extraction methods, Wu et al. [12] used ResNet as the backbone and introduced coordinate convolution and global information enhancement modules. This reduced the impact of natural scene occlusion to a certain extent; however, some missing extraction phenomena remain. Wang et al. [13] proposed a dual-feature fusion feature extraction method, and on this basis, introduced a network with a densely connected feature skip connection structure, which is termed DFC-UNet. However, the work still needs further optimization of the model speed and a reduction in the loss caused by sampling.
In conclusion, while deep learning techniques have made significant progress in extracting roads from high-resolution remote sensing images, current network models still lack the necessary feature extraction capabilities. Additionally, they are still affected by noise, such as trees, buildings and complex scenery, when dealing with fine road details, such as road edges and intersections. The model may lose key contextual information, making it difficult to fully capture road features. These limitations indicate that future research needs to optimize the model structure to improve the accuracy and robustness of road extraction further in complex scenes.
In response to the above problems, we fully analyze the current research status of deep learning semantic segmentation methods, combine the characteristics of high-resolution remote sensing, and propose a high-resolution remote sensing image road extraction method based on ConvNeXt-UPerNet. The work is as follows:
1. Embed attention modules in the ConvNeXt [14] backbone network, thereby reducing the model’s dependence on irrelevant background features and focusing on the key road feature areas. The segmentation of samples is more accurate in scenes with noise or complex backgrounds.
2. The convolutional neural network ConvNeXt with embedded attention modules is used as the backbone network in conjunction with the feature pyramid module in the unified perceptual analysis network UPerNet [15] to extract image features. A ConvNeXt-UPerNet model architecture is proposed, which can fully utilize the feature information of images at different scales when dealing with complex scenes.
3. We introduce mixed CrossEntropyLoss [16] and DiceLoss [17] as loss functions and solve the imbalance problem between positive and negative samples in remote sensing images via weighted fusion, thereby preventing the loss function from ignoring categories with fewer pixel distributions and better guiding model training.
A specific theoretical presentation of the above research elements is given in Section 2, the methodological improvements are described in Section 3, and the experiments are summarized in Section 4
ConvNeXt is a current convolutional neural network with improved performance based on ResNet50 [18] and drawing on the design concepts of the Swin Transformer [19]. ConvNeXt significantly improves model performance by optimizing it at both the macro and micro levels. The main points of optimization include the following:
1. Macro Design
The original ResNet design is largely empirical. For the Swin Transformer, the ratio of the number of Swin-Tiny stacked blocks is 1:1:3:1, and for the Swin-Large, it is 1:1:9:1, with a greater proportion of stacked blocks in stage 3. Therefore, ConvNeXt adjusts the stacking times in ResNet50 from (3, 4, 6, 3) to (3, 3, 9, 3), which is similar in computational complexity to that of Swin-Tiny but with improved accuracy. In addition, ConvNeXt substitutes the initial max pooling down sampling module with a convolutional layer of kernel size 7 × 7 and stride 2, followed by another layer of kernel size 4 × 4 and stride 4. This modification reduces the floating point operations per second (FLOPs) and improves its accuracy without compromising its performance.
2. Referring to ResNeXt
ResNeXt [20] was developed by combining ResNet with Inception [21]. ConvNeXt adopts the grouped convolution from ResNeXt and replaces it with depthwise convolution, which can mix only spatial dimension information. When combined with 1 × 1 convolution, this method separates spatial and channel information extraction, reducing the number of network failures and slightly lowering accuracy. Finally, following the ResNeXt strategy, the number of channels is adjusted from 64 to 96 to match that of the Swin Transformer, increasing the number of FLOPs and resulting in a slight improvement in accuracy.
3. Inverted Bottleneck Layer
The design of the inverted bottleneck layer using a multilayer perceptron (MLP) [22], with a structure that is narrow at both ends and wide in the middle, improves both small and large models.
4. Large Convolutional Kernels
ConvNeXt enhances the size of the 3 × 3 convolutional kernel by making adjustments. The accuracy of the model reaches saturation at 7 × 7; therefore, it continues to use 7 × 7 depthwise convolution.
5. Micro Design
In the ConvNeXt module, the use of activation functions is reduced, and the gaussian error linear unit (GELU) [23] is selected as a new activation function to replace Batch Normalization (BN) [24] with Layer Normalization (LN) [25].
UPerNet is a multitask learning framework designed with different detection heads for each task. It heterogeneously processes annotations at different perception levels and can identify as many visual concepts as possible from images. UPerNet is based on the Feature Pyramid Network (FPN) [26] that combines top-down and bottom-up pathways. The top-down pathway helps capture contextual information of the image, while the bottom-up pathway aids in precise localization and object recognition. This structure enables the FPN to effectively identify and extract image features at different scales, thereby enhancing the recognition and localization capabilities of objects in complex scenes. This ensures that each layer’s feature map contains strong semantic information. This study is a semantic segmentation task; hence, the UPerNet branches have been simplified, retaining only the detection heads directly related to semantic segmentation.
The Convolutional Block Attention Module (CBAM) [27] in deep learning assists the model in learning local regions within an image and integrates the contextual information of these local features. It dynamically adjusts its attention to spatial and channel dimensions based on the input data. Moreover, CBAM can be easily integrated with existing deep learning frameworks, such as CNNs, allowing the model to learn useful feature representations from raw data directly without the need for additional post processing steps. CBAM typically consists of two parts: Spatial Attention Module (SAM) and Channel Attention Module (CAM).
The CAM assists the model in identifying the significance of multiple feature maps for the task, thereby enhancing the network’s feature-capturing ability. Max pooling and average pooling are conducted on the input feature map F in the spatial dimension to compress the spatial size. The pooled results are then sent to a shared multilayer perceptron (MLP) network to learn the channel weights. Finally, the weights are normalized using a nonlinear activation function to obtain attention weights for each channel. These learned weights are then used to weight the original input features through elementwise multiplication, resulting in the final channel attention weights Mc. The structure of the CAM is shown in Fig. 1.
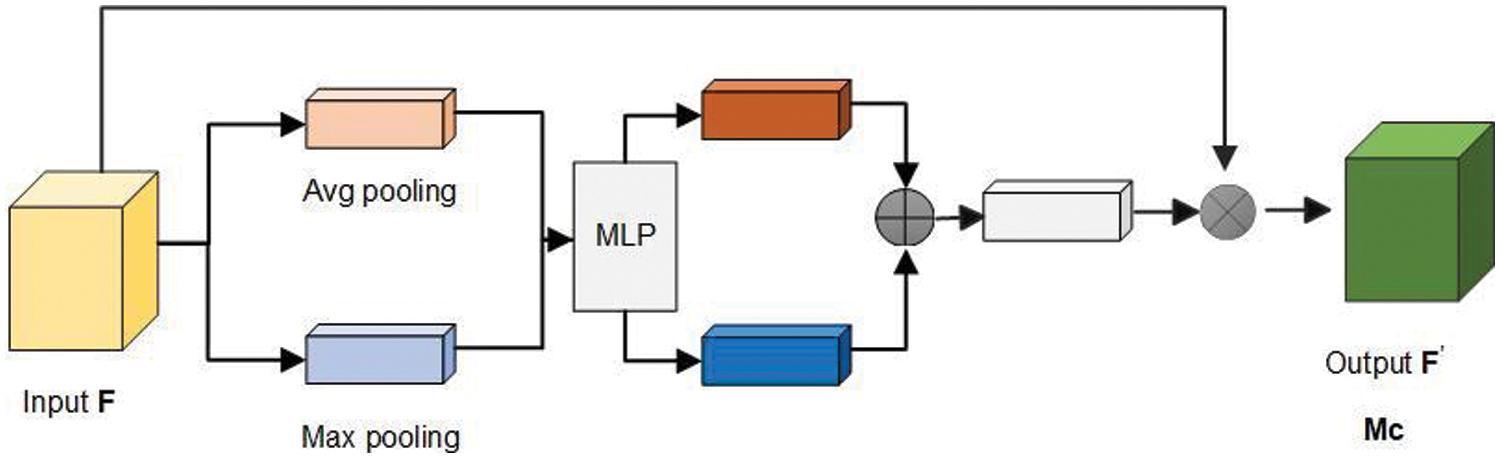
Figure 1: Channel attention structure
Spatial attention identifies key regions within an image, allowing the network to focus on these areas. The output feature map from the CAM is taken as the input feature map for this module. First, the input feature map F is compressed by performing global max pooling and average pooling along the channel dimension to obtain statistical information for each spatial location. These results are then concatenated along the channel dimension, followed by a convolutional operation to reduce the dimensions to a single channel. Finally, a nonlinear activation function is applied to obtain the final spatial attention weights Ms. The structure of spatial attention is shown in Fig. 2 below.

Figure 2: Spatial attention structure
3.1 ConvNeXt with Embedded Attention Modules
Since the ConvNeXt network does not explicitly designate attention to input image features, attention modules, a form of reweighting technique, can be used to weight image features, allowing the network to focus on nonredundant local contextual information better.
Here, we reference CBAM to build both channel attention and spatial attention, and integrate the attention modules into different stages of the ConvNeXt backbone network. Spatial attention is embedded before the network stage modules to enhance the model’s ability to recognize local spatial features in images and reduce reliance on irrelevant spatial features, especially when dealing with situations involving complex backgrounds or occlusions. Channel attention is placed after the modules to help the model identify which feature channels are more important for the current task based on the rich channel information from the deeper layers of the model; the weights of these channels are adjusted accordingly. Integrating both types of attention enhances the model’s ability to distinguish between redundant and key features in the image, allowing the model to utilize information in the feature maps better.
Four versions are proposed for the ConvNeXt network: Tiny (T)/ Small (S)/Base (B)/ Large (L). In this experiment, we choose ConvNeXt-S from the ConvNeXt series as the backbone network for feature extraction. In this version, the numbers of input channels C for each stage are (96, 192, 384, 768), and the numbers of time blocks stacked in each stage are (3, 3, 27, 3). The model diagram embedding the attention modules is shown in Fig. 3.
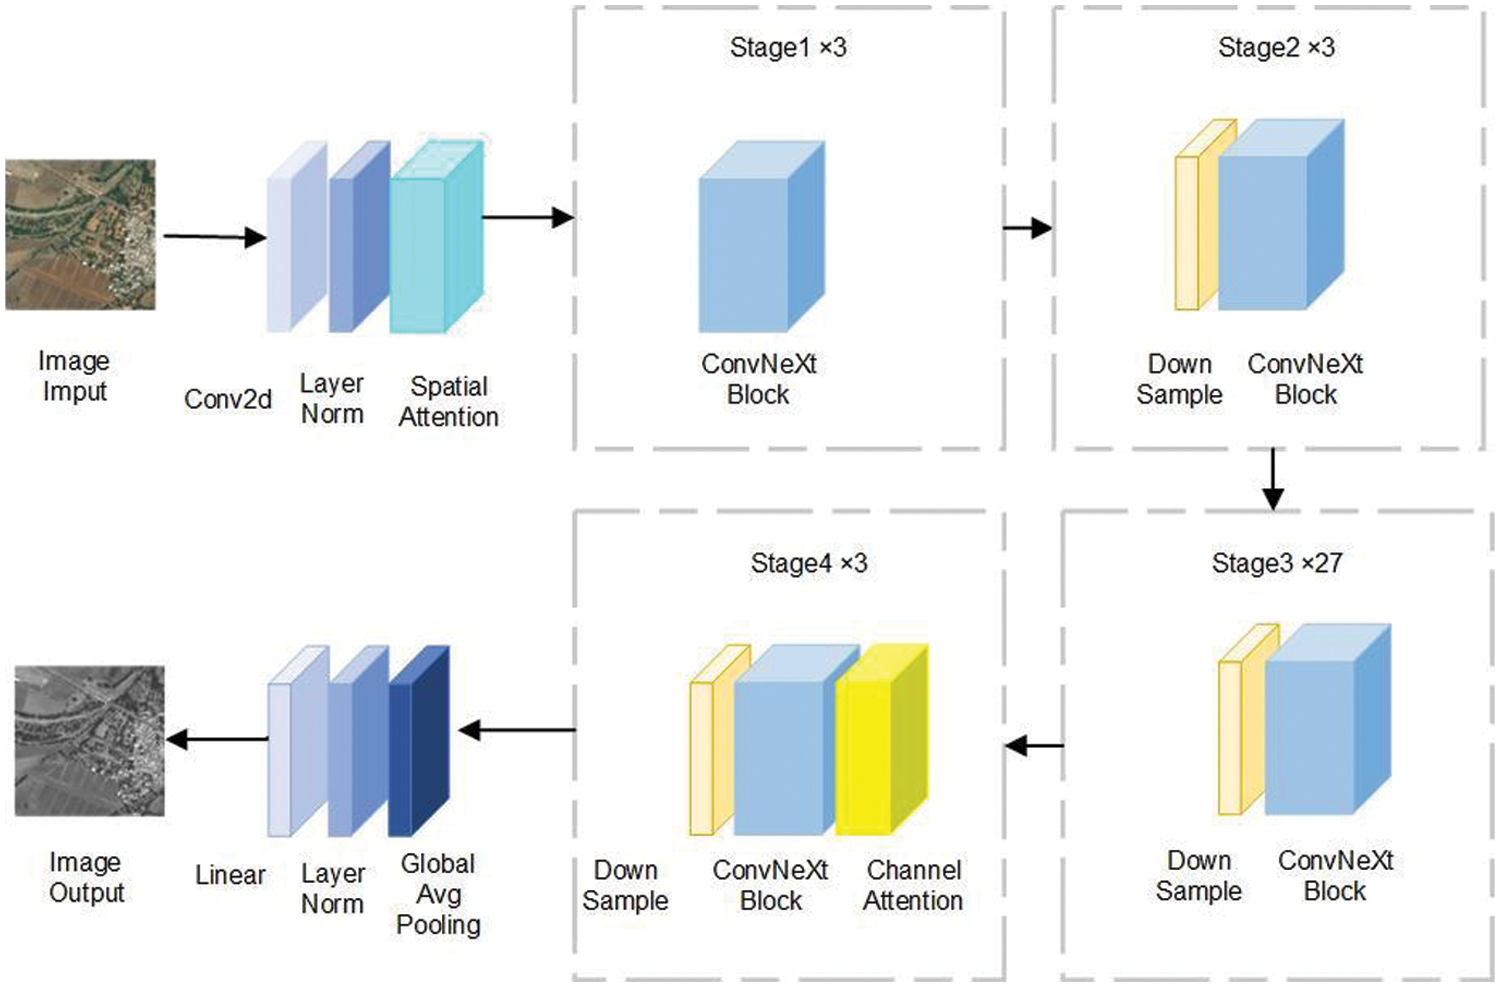
Figure 3: Structure of the ConvNeXt model with embedded attention
3.2 ConvNeXt-UPerNet Network Structure
After a series of innovative design improvements, the original structure of ConvNeXt surpassed that of the Swin Transformer [19] in terms of accuracy on the ImageNet dataset [28], tapping into its potential for visual tasks. It retains the simplicity and efficiency of traditional CNNs, indicating its potential in image feature extraction. Therefore, theoretically, if a ConvNeXt network with integrated hybrid attention modules is used as the backbone network to replace the default backbone network, ResNet, which has insufficient feature extraction capabilities in UPerNet, to extract features from remote sensing images, multiscale image features can be obtained. This results in high-resolution remote sensing image feature maps at all output scales simultaneously possessing strong contextual semantic information, thereby achieving more precise segmentation results in experiments. The overall model structure is shown in Fig. 4.
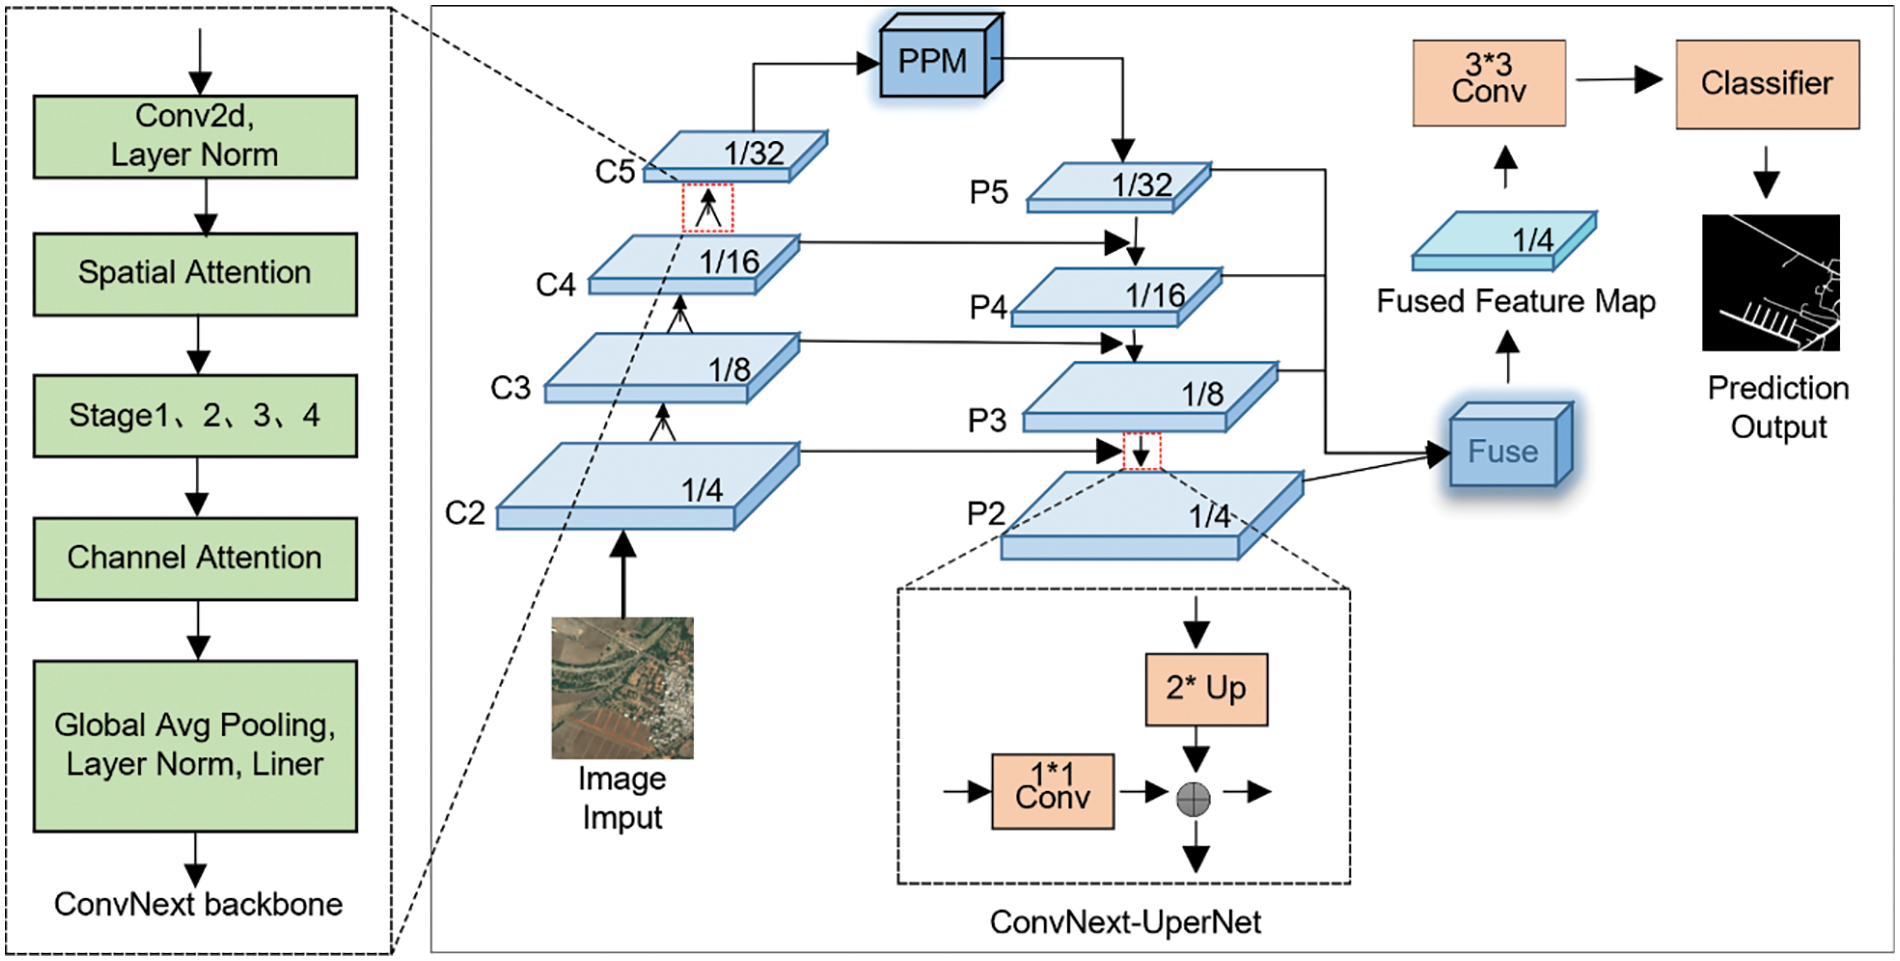
Figure 4: ConvNeXt-UPerNet network structure
After the remote sensing image is input into the ConvNeXt-UPerNet network, the model first undergoes upsampling. During this process, the input image passes through convolutional layer 2 (conv2), convolutional layer 3 (conv3), convolutional layer 4 (conv4), convolutional layer 5 (conv5), and the ConvNeXt backbone network to simultaneously extract image information. This process results in four feature maps of different sizes, C2, C3, C4, C5, which correspond to 1/4, 1/8, 1/16, and 1/32 the size of the input feature, respectively. The size of the feature maps remains unchanged after passing through the Pyramid Pooling Module (PPM) [5]. The PPM module aggregates different scales to obtain a composite feature map P5 from C5. P4 is obtained by upsampling P5 by a factor of two and adding it elementwise to the feature map of C4 through a 1 × 1 convolutional layer. This process is repeated twice to obtain P3 and P2. UPerNet fuses features at each layer after the FPN and then fuses all the feature maps. Finally, image segmentation is completed by enlarging the image to the same size as the input feature map through 3 × 3 convolution and upsampling. The upsampling method used is nearest neighbor interpolation, which preserves the semantic information of the input feature map during the process.
For classification experiments, particularly in multiclass tasks, CrossEntropyLoss (CE) is a commonly used loss function. Our experiment essentially involves a binary classification problem. When there is an imbalance in the distribution of positive and negative samples, to enhance the overall model performance, the DiceLoss (Dice) function, which is often used in semantic segmentation, can be introduced in addition to the original loss function. DiceLoss focuses specifically on the overlap between the predicted segmentation area and the true area. Combining the two loss functions can effectively address the imbalanced positive and negative samples, increasing the robustness of the model.
CrossEntropyLoss measures the difference between the predicted probability distribution of the model and the true label probability distribution. A binary classification task can be represented by Eq. (1) :
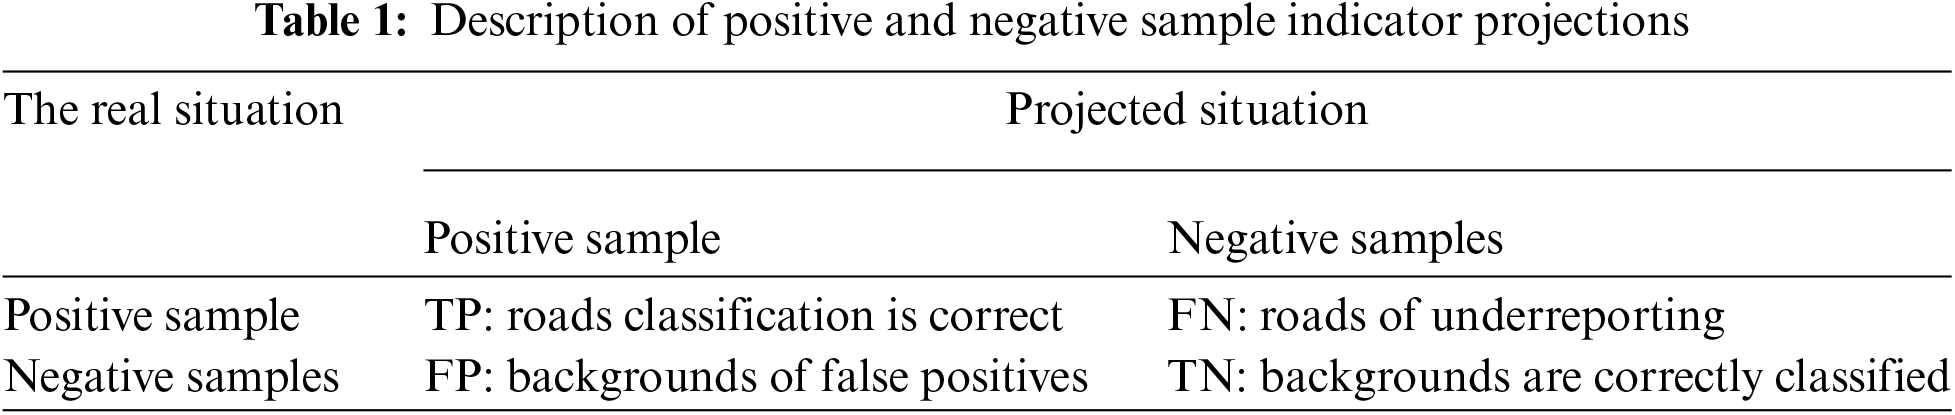
y represents the label of the sample, generally denoted by 0 for positive samples and 1 for negative samples, in which the positive samples represent roads and the negative samples represent the background. And p represents the probability that the sample is predicted to be in the positive category. Table 1 below describes TP, FN, FP, and TN.
DiceLoss measures the degree of overlap between the segmentation region predicted by the model and the true segmentation region and can be expressed for binary classification. Dice’s formula is shown in Eq. (2):
If a and b are used to represent the CrossEntropyLoss and DiceLoss weights, respectively, the designed combined loss function can be expressed as Eq (3):
The default weight ratio is 1:1. Because road extraction in this experiment is a segmentation task, it is necessary for the model to accurately identify and locate an object and region. Therefore, in the experiment, we should focus on the Dice coefficient, fix a to 1, and constantly give greater weight to b in the experiment, that is, 1:1, 1:2, 1:3,1:4, and 1:5 [29].
4.1 Experimental Environment and Parameter Setting
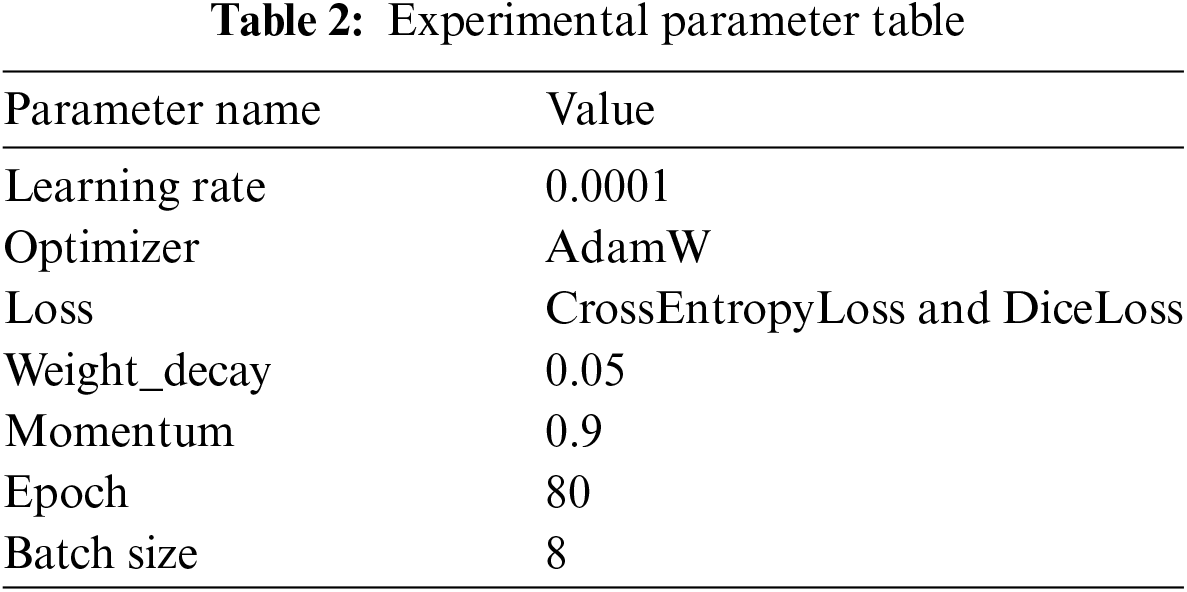
To verify the feasibility of the model for remote sensing image road segmentation, we select a certain number of samples for a series of comparative experiments and ablation experiments. The operating system of the experiment is 64-bit Windows 10, the processor is an Intel(R) Xeon(R) Gold 6342 CPU @ 2.80 GHz (24 cores, 2 sockets), the running memory is 512 G, the GPU model is an NVIDIA A40 with 48 GB memory, CUDA version is 11.6, and the PyTorch deep learning framework and parallel computing platform are selected to construct the deep learning framework to construct the network structure so that the definition of the new network layer is relatively simple. The specific experimental parameters are shown in Table 2:
4.2 Datasets and Preprocessing
The task of extracting roads from high-resolution remote sensing images is essentially a binary classification task. Each image consists of background elements and road elements. First, we used the road dataset from the DeepGlobe Road Extraction Challenge [30], which includes 8570 satellite images with a size of 1024 × 1024. The image resolution is 0.5 m. The dataset includes scenes of rural, urban, wasteland, suburbs and other areas. It is a popular dataset for road extraction. During training, the DeepGlobe road dataset is divided into a training set, test set, and verification set at a 6:1:1 ratio. The 1024-pixel image is scaled down to 512 pixels for network training purposes. The second dataset is the Chinese road dataset CHN6-CUG [31], which primarily covers urban areas in China. The imagery size is 512 × 512 pixels, with a resolution of 0.5 m. The dataset consists of a total of 4511 labeled images, of which 3608 are used for training and 903 are reserved for testing. All images are processed by converting true color images to grayscale and performing threshold conversion. Image enhancement techniques, such as random cropping and splicing, are applied during training.
This experiment concerns the binary classification task of extracting roads from remote sensing images. To comprehensively and carefully analyze the results, we selected common binary classification evaluation indicators, including precision (Pre), accuracy (Acc), intersection over union (IoU), and mean intersection over union (MIoU).
Precision refers to the proportion of correctly predicted positive samples. Only the samples identified as roads are considered, and the positive examples that are truly samples are counted. The equation for Pre is shown in Eq. (4):
Accuracy is the proportion of correct image elements predicted in all predictions, that is, the proportion of correct samples to the total sample. The equation for Acc is shown in Eq. (5):
The IoU refers to the ratio of the intersection and union of the predicted border and the real border. The equation for IoU is shown in Eq. (6):
The MIoU is averaged over all categories of the IoU. The equation for the MIoU is shown in Eq. (7):
After conducting previous experiments and obtaining results, we compare the performance of the classic CNNs PSPNet [5], DeepLabv3+ [7], U-Net [32], and D-LinkNet [33] on the DeepGlobe road dataset. Additionally, the attention model Swin Transformer [19], SegFormer [34], SegNext [35], and the visual self-supervised model MAE [36] were selected for comparison. The experimental results are analyzed to compare the advantages and disadvantages of each model. The quantitative statistical results are presented in Table 3. The results indicate that the ConvNeXt-UPerNet model achieves the highest values for each index in the DeepGlobe road dataset, reaching 79.40%, 97.93%, 69.28% and 83.56%, respectively. Compared to SegNext, which has better performance, the evaluation indices Pre, Acc, IoU, and MIoU increase by 1.5%, 0.28%, 3.27%, and 1.88%, respectively.
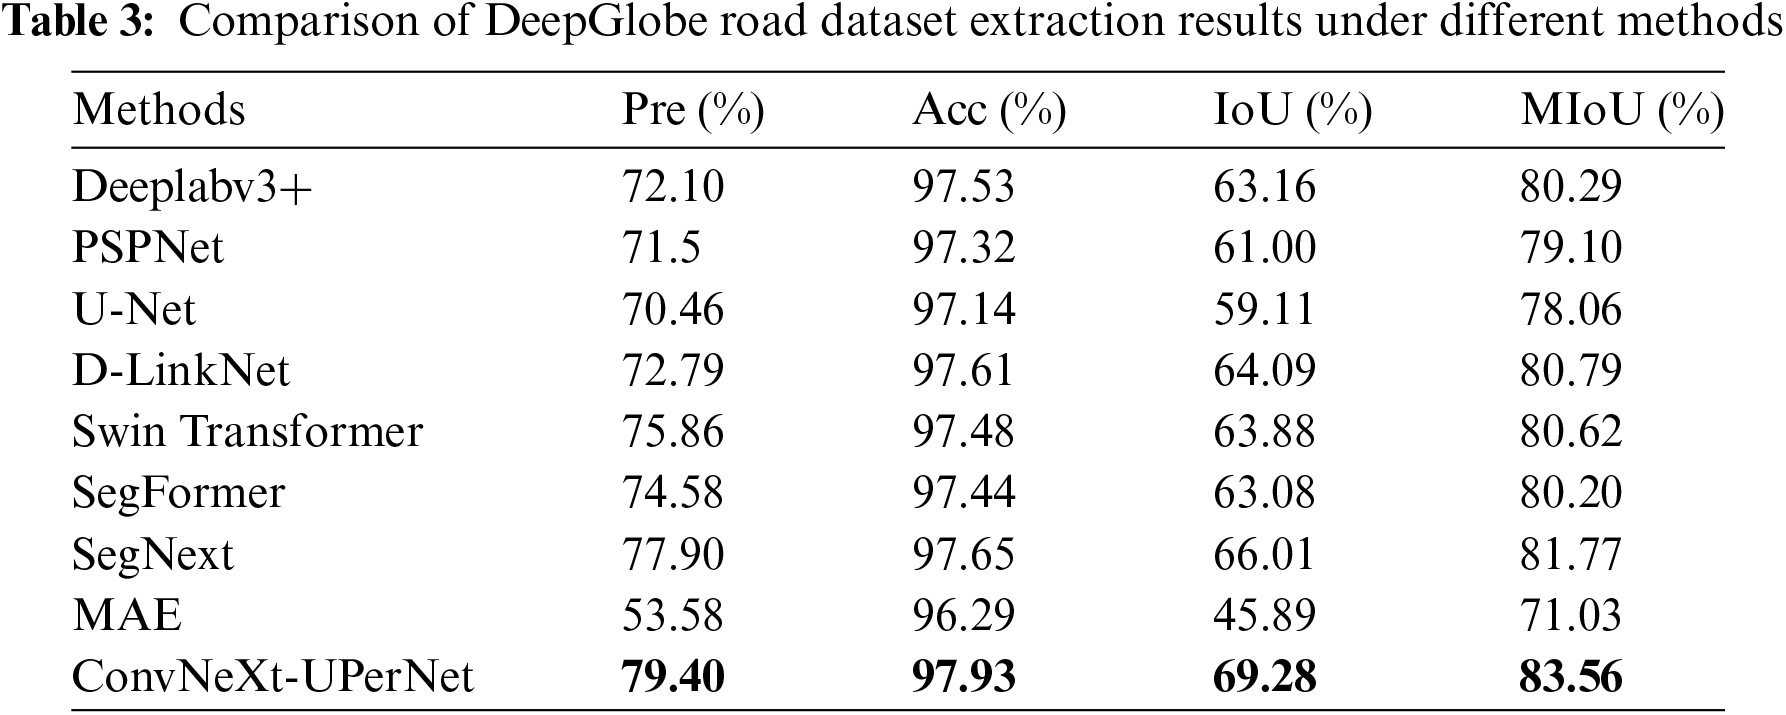
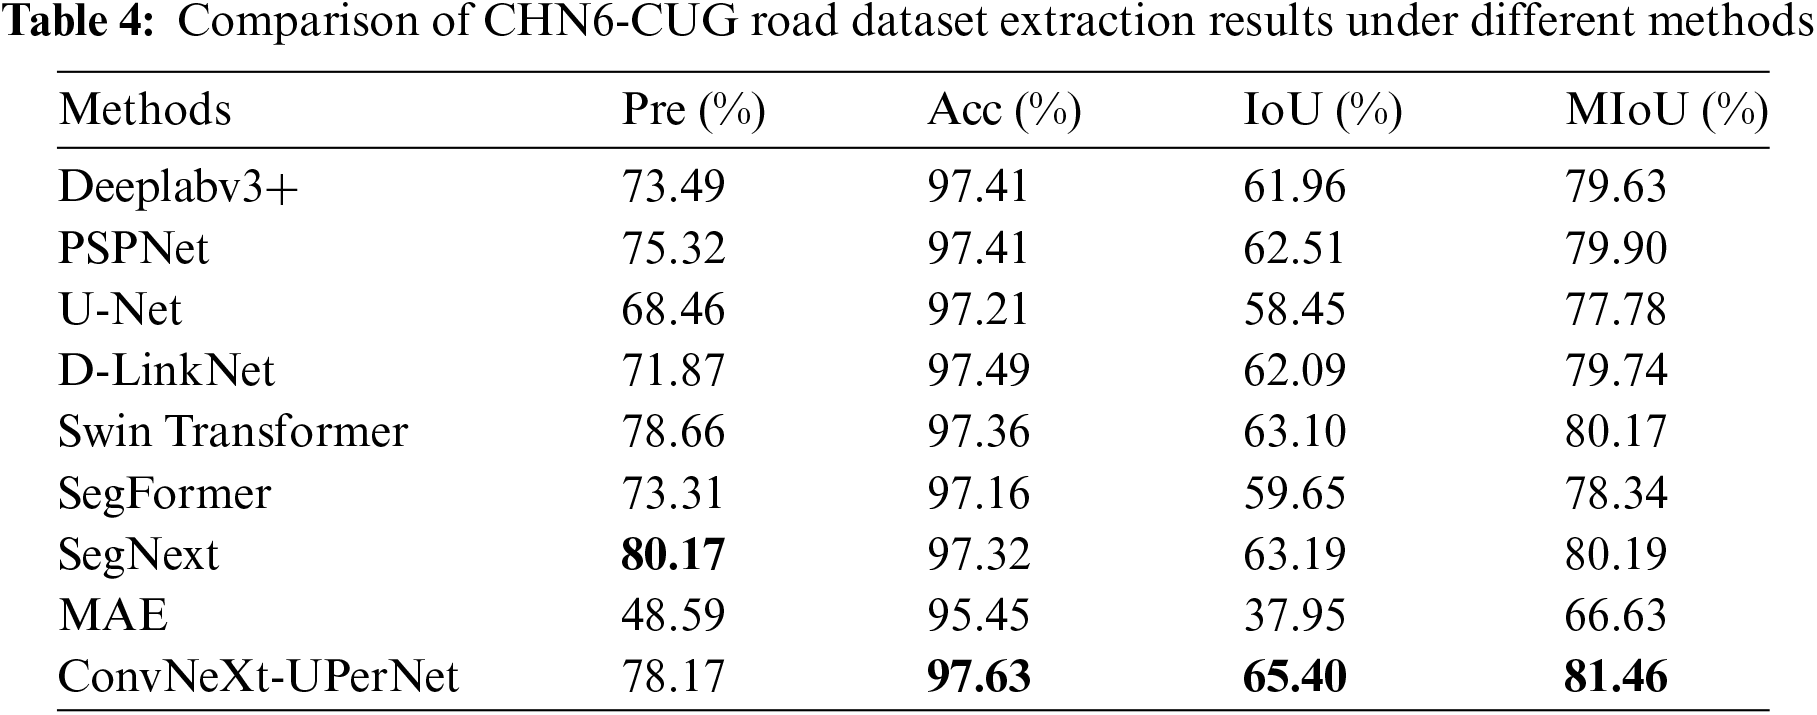
Table 4 presents the results of various models on the CHN6-CUG road extraction dataset. According to the data in the table, the ConvNeXt-UPerNet model achieves the highest scores for Acc, IoU, and MIoU, reaching 97.63%, 65.40%, and 81.46%, respectively. Compared with the relatively better model SegNext, although the model’s Pre decreased by a certain percentage, the Acc, IoU, and MIoU were each improved by 0.31%, 2.21%, and 1.27%.
To more intuitively show the different results of different model road extraction effects, we select some representative samples of DeepGlobe and CHN6-CUG road datasets for visualization.
As shown in Fig. 5, models such as DeepLabv3+, PSPNet, U-Net, Swin Transformer, SegFormer, SegNext, and MAE have all extracted relatively complete roads, but they lack processing of road details. In the part of the rural road sample enclosed by the red box, ConvNeXt-UPerNet can segment a more complete road. Sample b’s selected rural areas are shaded by a large area of trees, making it difficult to extract complete road information at road junctions and tree shelters. In the urban area selected in sample d and e, other models exhibit varying degrees of fracture in road extraction. In contrast, the ConvNeXt-UPerNet model, which combines spatial and channel attention, shows more complete and clear road extraction results in the examples in Fig. 5a–e. It not only retains the overall road structure but also performs well in extracting detailed information. Experimental results indicate that the ConvNeXt-UPerNet model can effectively resolve the fragmentation issues present in traditional road extraction methods.
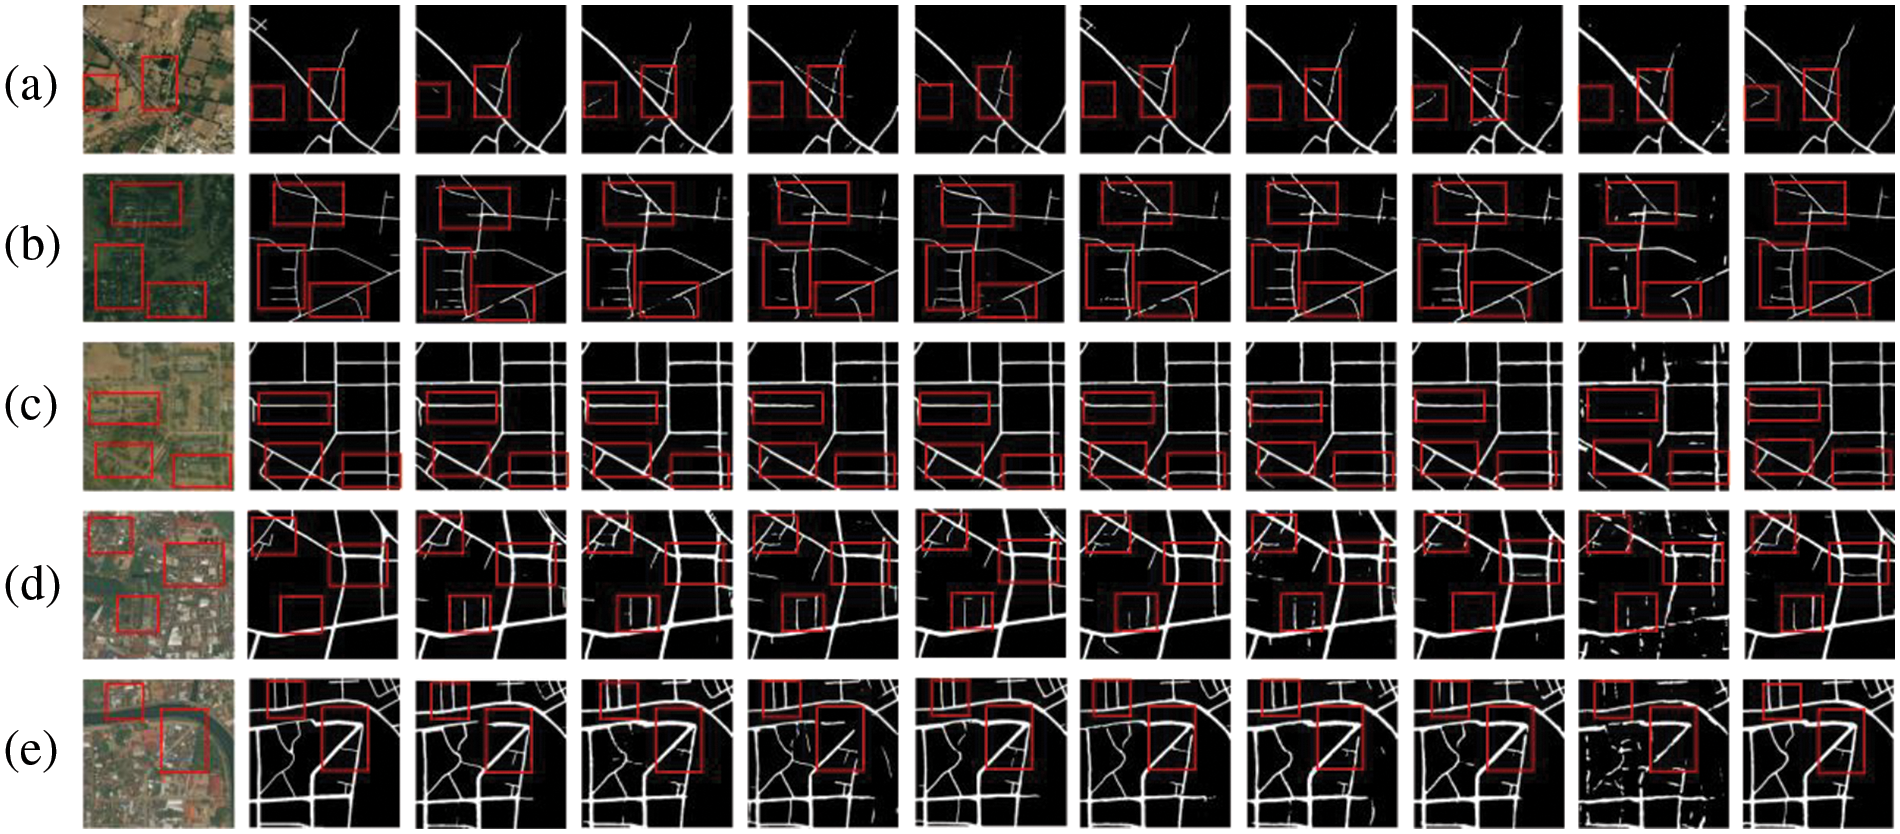
Figure 5: Plot of the results of multiple model visualizations in DeepGlobe. From left to right: 1-original figure, 2-label, 3-DeepLabv3+, 4-PSPNet, 5-U-Net, 6-D-LinkNet, 7-Swin Transformer, 8-SegFormer, 9-SegNext, 10-MAE, and 11-ConvNeXt-UPerNet
Fig. 6 displays the road extraction results of multiple models on the CHN6-CUG road dataset, where all models except for the self-supervised model MAE have managed to extract relatively complete road outcomes for urban roads. However, there are still some challenges, such as the shadows of trees and buildings that may obscure the roads, resulting in incomplete extraction results. This indicates that although those models can accurately identify and extract roads in most situations, they still have certain limitations when dealing with complex scenes, such as shadows and obstructions. It is worth noting that the ConvNeXt-UPerNet model achieves the best extraction results due to its ability to reduce the model’s reliance on irrelevant background features and focus on the key areas of road features. In images with noise or complex backgrounds, it can identify local information that ignored by other models and has a more accurate segmentation effect.
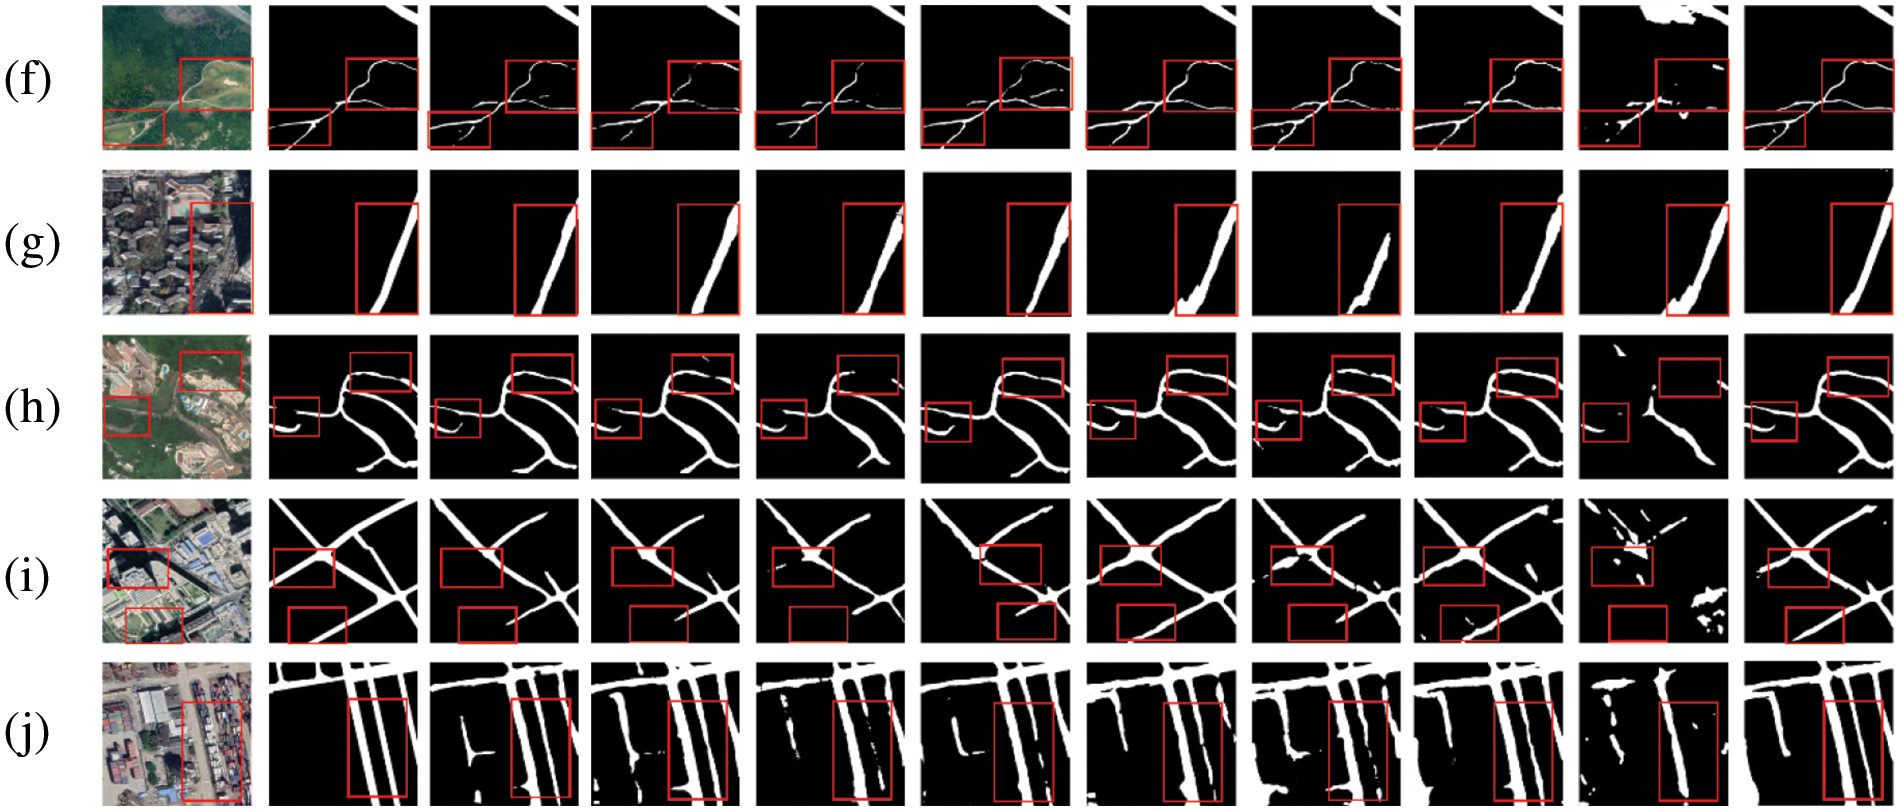
Figure 6: Plot of the results of multiple model visualizations in CHN6-CUG. From left to right: 1-original figure, 2-label, 3-DeepLabv3+, 4-PSPNet, 5-U-Net, 6-D-LinkNet 7-Swin Transformer, 8-SegFormer, 9-SegNext, 10-MAE, and 11-ConvNeXt-UPerNet
1. ConvNeXt-UPerNet and Attention Module Ablation Experimental Results Analysis
To verify the effectiveness of adding spatial and channel attention to the ConvNeXt block and combining the two models, a series of ablation experiments were carried out without changing the training strategy of the original loss function, using the cross-entropy loss function, not introducing mixed attention modules into the model and in the same experimental environment. If there is no special instruction, the ResNet model and the ConvNeXt model utilize ResNet50 and ConvNeXt-S as their respective backbones. The experimental results of ConvNeXt-UperNet are shown in Tables 5 and 6.
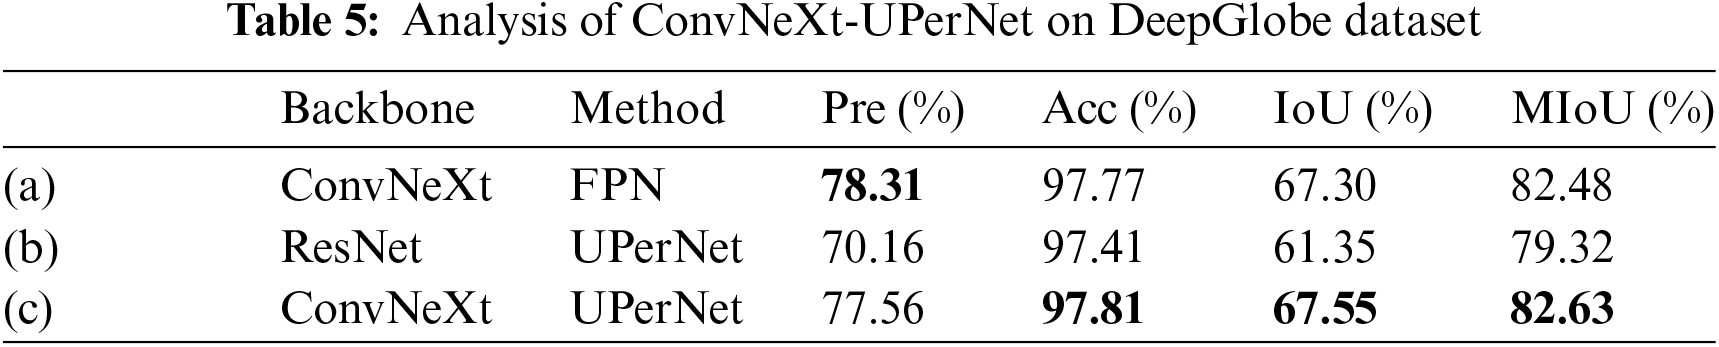

In an overall comparison of Tables 5 and 6, models using ConvNeXt as the backbone outperformed those using ResNet, particularly on the key index of IoU. On the DeepGlobe dataset, the ConvNeXt-UPerNet model demonstrated superior performance across all indexs when compared to the ConvNeXt with FPN. Similarly, on the CHN6-CUG dataset, the ConvNeXt-UPerNet also demonstrated the highest values for Acc, IoU and MIoU, suggesting that the UPerNet architecture is well-suited for road extraction tasks. Overall, the performance of the ConvNeXt-UPerNet model was consistently strong across both datasets, indicating that it possesses good generalization capabilities across different datasets.
Tables 7 and 8 illustrate the respective enhancements in Pre, Acc, IoU and MIoU for the ConvNeXt-UperNet model integrating with the SAM and CAM. Based on the data from the tables, it can be seen that on both the DeepGlobe and CHN6-CUG datasets, the introduction of attention module especially with the combination of the SAM and the CAM, enhances the performance of the ConvNeXt-UPerNet model. Integrating SAM or CAM individually can enhance the model’s Pre, Acc, IoU and MIoU. When SAM and CAM are used together, the model achieves the highest scores for all indexs on the DeepGlobe dataset, and for all indexs except Pre on the CHN6-CUG dataset.
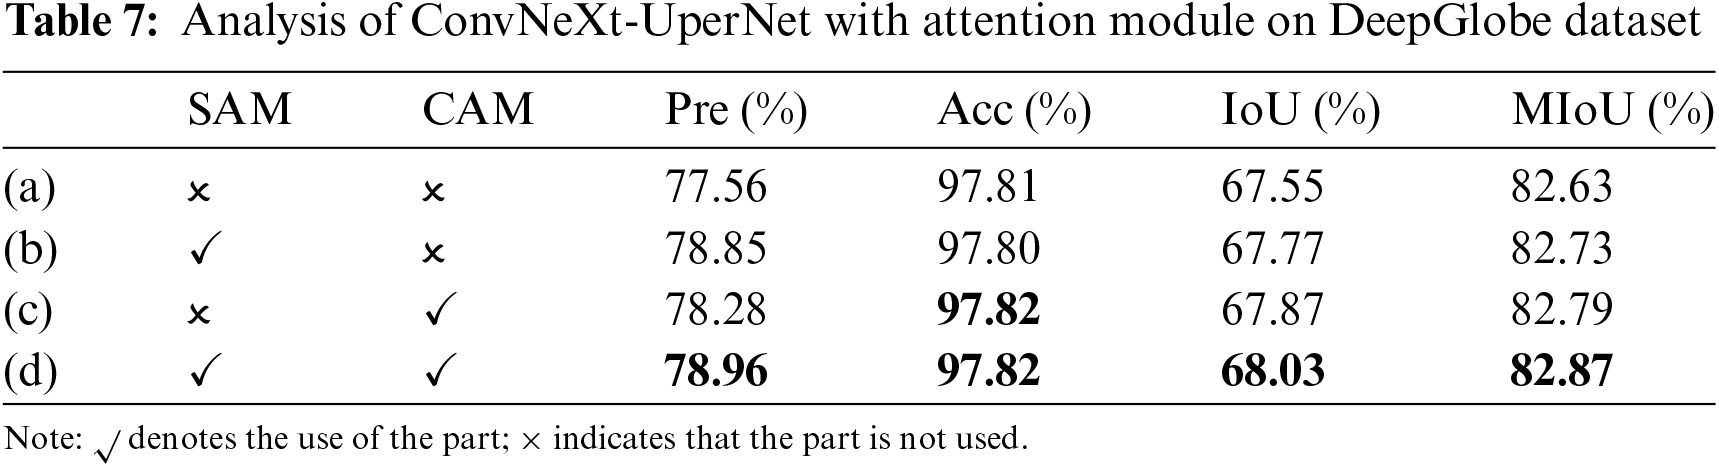

The results show that the model extraction with attention has higher accuracy. This fusion can more accurately capture the information that is crucial to the task, thereby improving the overall model performance and allowing the model to extract more accurate road information.
2. Analysis of loss function ablation experimental results
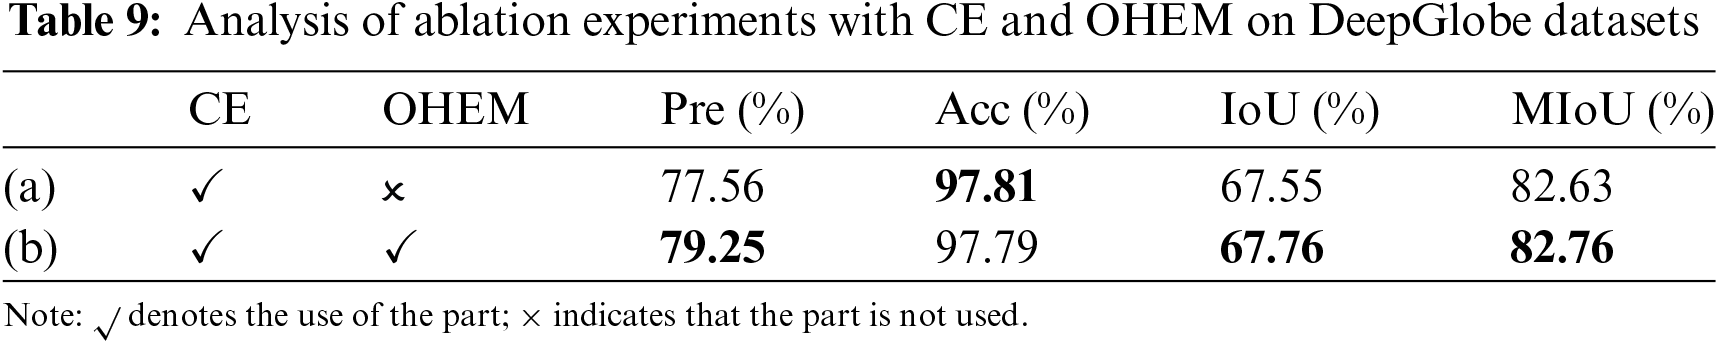
In this section, we explored the integration of CrossEntropyLoss with both Online Hard Example Mining (OHEM) and Dice Loss. The core of the OHEM algorithm is to select a set of hard examples for training, thereby improving the effectiveness of the network’s parameters. Hard examples are defined as samples that exhibit diversity and high loss. The confidence threshold for OHEM is set to 0.7, with pixels above this threshold on each image being included in the loss calculation. It is ensured that a minimum of 100,000 pixels participate in the loss calculation for each image.
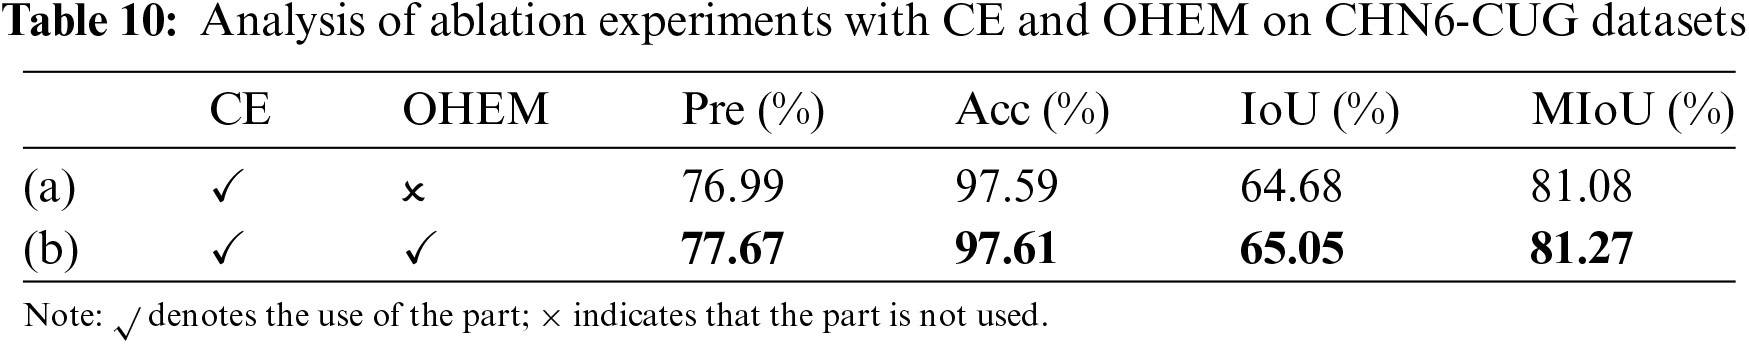
The experimental results of OHEM in two datasets are shown in Tables 9 and 10. On both the DeepGlobe and CHN6-CUG datasets, the introduction of OHEM can enhance the model’s Pre, IoU, and MIoU to a certain extent, thereby improving the overall performance of the model. Although there is a slight decrease in accuracy on the DeepGlobe dataset, the increase in MIoU indicates that the model has become more accurate in the overall recognition of roads. On the CHN6-CUG dataset, all indexs have seen improvements, demonstrating the positive effect of OHEM on enhancing model performance.
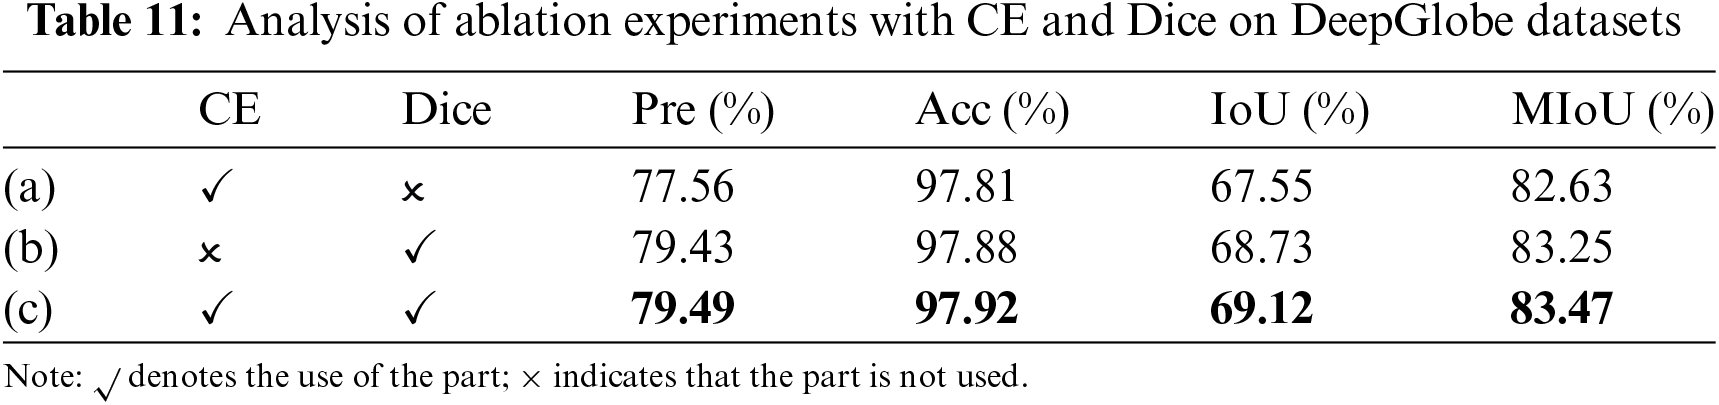
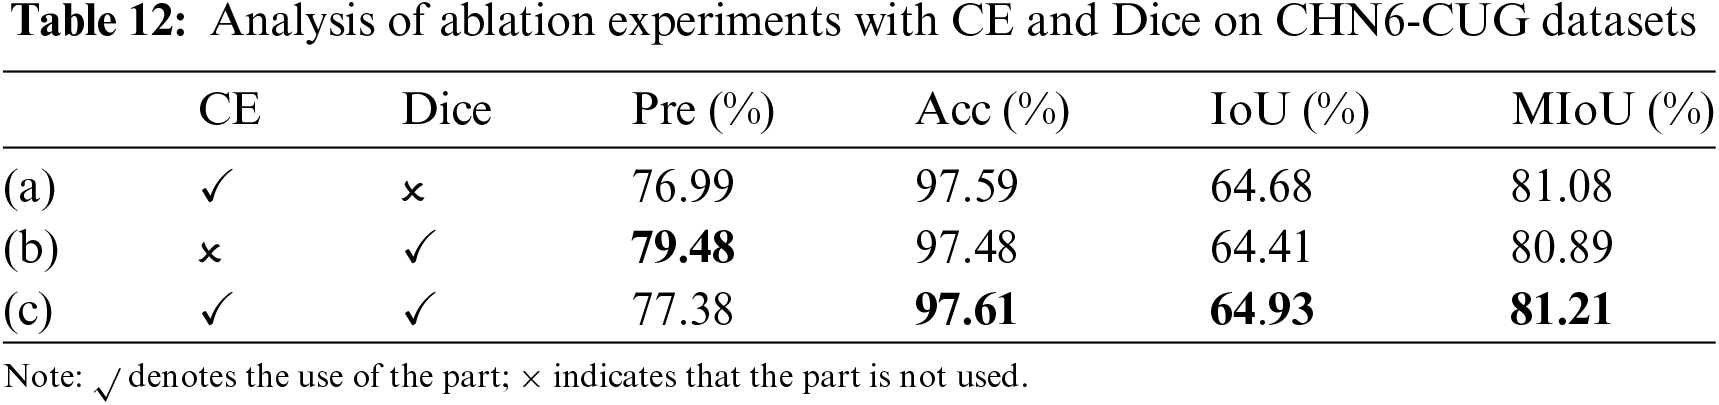
Next, the discussion focuses on CE in comparison with the traditional loss function Dice. On the DeepGlobe dataset, using Dice alone or in combination with CE loss, as compared to using only CE, can improve both Pre and MIoU. Specifically, as shown in Table 11, when CE and Dice are used together with the weight value of 1:1 on the DeepGlobe dataset the highest values for Pre, Acc, IoU and MioU are achieved at 79.49%, 97.92%, 69.12%, and 83.47%, respectively. This indicates that the combination of the two loss functions is beneficial for enhancing model performance. According to the results from Table 12, on the CHN6-CUG dataset, using only Dice loss significantly improves Pre compared to using only CE, but there is a slight decrease in Acc, IoU and MIoU. When CE and Dice are combined, Pre decreases slightly, yet MIoU increases. Integrating the results from both datasets suggests that Dice loss is more effective in addressing class imbalance issues, and the combination of CE and Dice has a positive effect on improving Acc, IoU, and MIoU.
The ablation experiments mentioned above indicates that the combined use of CE and Dice can lead to better model performance. However, it only discussed the case where the weight ratio between CE and Dice is 1:1. In subsequent experiments, the experimental scheme adjusted the weight ratio between the two loss functions to compare the model’s performance. Since the Dice loss focuses on the consistency between the predicted and actual segmentation areas, it is necessary to pay close attention to the Dice coefficient and continuously increase its weight during the experiments.
On the DeepGlobe dataset from Table 13, as the weight of the Dice loss increased, the Acc, IoU, and MIoU values initially increased, peaking at 97.93%, 69.28%, and 83.56% when the weight was 1:3, and then decreased with further increases in the weight of the Dice. This indicates that on this dataset, appropriately increasing the weight of the Dice loss helps to improve model performance, but performance will decline after a certain proportion. On the CHN6-CUG dataset from Table 14, when the weight of the Dice loss was increased to a ratio of 1:3, the Acc, IoU, and MIoU values increased, suggesting that on this dataset, increasing the weight of the Dice loss also has a positive effect on enhancing model performances.


However, when the weight ratio is further increased to 1:5, the model’s performance declines. A possible reason is that this paper employed the AdamW [37], a gradient-based optimization algorithm. An excessively large weight may lead to gradient explosion, making it difficult for the model to converge. Taking into account the results from both datasets, we can conclude that appropriately adjusting the weight ratio between CE and Dice losses, especially by increasing the weight of the Dice loss, can effectively enhance the model’s performance in road extraction tasks.
This paper presents the adjustment and optimization of the original network model for road extraction from high-resolution remote sensing images by combining ConvNeXt with CBAM and the UPerNet network model. A series of ablation experiments were conducted to prove the effectiveness of the model in terms of architecture and training. Moreover, a comparison experiment was conducted using the classical semantic segmentation models on the DeepGlobe and CHN6-CUG road datasets. As a result, the Pre, Acc, IoU, and MIoU indicators showed varying degrees of improvement, and the visual results are evident. The model effectively addresses issues such as the impact of complex backgrounds, including tree occlusion and road junction fractures. When faced with noise or complex backgrounds, the network model can focus on key areas, obtain multiscale context information to achieve global understanding, and ultimately improve its performance.
Acknowledgement: We express our gratitude to the Anhui Province Key Laboratory of Physical Geographic Environment for providing the excellent equipment and environment for our experiments.
Funding Statement: This work was supported in part by the Key Project of Natural Science Research of Anhui Provincial Department of Education under Grant KJ2017A416, and in part by the Fund of National Sensor Network Engineering Technology Research Center (No. NSNC202103).
Author Contributions: The authors confirm contribution to the paper as follows: Jing Wang: Study Design, Drafting the Manuscript, Supervision and Funding Acquisition. Chen Zhang: Data Analysis and Interpretation, Manuscript Revision and Methodology. Tianwen Lin: Technical Support. All authors reviewed the results and approved the final version of the manuscript.
Availability of Data and Materials: A publicly available DeepGlobe and CHN6-CUG datasets were used for analyzing our model. These datasets can be found at https://deepglobe.org (accessed on 10/05/2024) and https://grzy.cug.edu.cn/zhuqiqi (accessed on 10/05/2024).
Conflicts of Interest: The authors declare that they have no conflicts of interest to report regarding the present study.
References
1. J. Dai et al., “Development and prospect of road extraction method for optical remote sensing image,” (in ChineseNatl. Remote Sens. Bull., vol. 24, no. 7, pp. 804–823, 2020. doi: 10.11834/jrs.20208360. [Google Scholar] [CrossRef]
2. Y. Zhang, J. He, X. Kan, G. Xia, L. Zhu and T. Ge, “Summary of road extraction methods for remote sensing images,” (in ChineseComput. Eng. Appl., vol. 54, no. 13, pp. 1–10+51, 2018. [Google Scholar]
3. Y. Kim, “Convolutional neural networks for sentence classification,” in Proc. 2014 Conf. Empir. Methods Nat. Lang. Process. (EMNLP), Doha, Qatar, Association for Computational Linguistics, 2014, pp. 1746–1751. [Google Scholar]
4. E. Shelhamer, J. Long, and T. Darrell, “Fully convolutional networks for semantic segmentation,” IEEE Trans. Pattern Anal. Mach. Intell., vol. 39, no. 4, pp. 640–651, Apr. 2017. doi: 10.1109/TPAMI.2016.2572683. [Google Scholar] [PubMed] [CrossRef]
5. H. Zhao, J. Shi, X. Qi, X. Wang, and J. Jia, “Pyramid scene parsing network,” in 2017 IEEE Conf. Comput. Vis. Pattern Recognit. (CVPR), Honolulu, HI, IEEE, Jul. 2017, pp. 6230–6239. [Google Scholar]
6. L. C. Chen, G. Papandreou, I. Kokkinos, K. Murphy, and A. L. Yuille, “Semantic image segmentation with deep convolutional nets and fully connected CRFs,” Accessed: Jun. 07, 2016. [Online]. Available: http://arxiv.org/abs/1412.7062 [Google Scholar]
7. L. C. Chen, Y. Zhu, G. Papandreou, F. Schroff, and H. Adam, “Encoder-decoder with atrous separable convolution for semantic image segmentation,” Accessed: Aug. 22, 2018. [Online]. Available: http://arxiv.org/abs/1802.02611 [Google Scholar]
8. X. He, Y. Zhou, J. Zhao, D. Zhang, R. Yao and Y. Xue, “Swin transformer embedding UNet for remote sensing image semantic segmentation,” IEEE Trans. Geosci. Remote Sens., vol. 60, pp. 1–15, 2022. doi: 10.1109/TGRS.2022.3230846. [Google Scholar] [CrossRef]
9. Z. Wang, H. Yan, X. Lu, T. Feng, and Y. Li, “High-resolution remote sensing image road extraction method for improving U-net,” (in ChineseRemote Sens. Technol. Appl., vol. 35, no. 4, pp. 741–748, 2020. [Google Scholar]
10. X. Ge and W. Cao, “A road extraction method for high resolution remote sensing imagery based on improved DeepLabV3+ model,” (in ChineseRemote Sens. Inf., vol. 37, no. 1, pp. 40–46, 2022. [Google Scholar]
11. X. Hu, X. Cheng, B. Zhu, and J. Fu, “An improved method based on ResUnet for road extraction from high-resolution remote-sensing imagery,” (in ChineseRemote Sens. Inf., vol. 37, no. 4, pp. 87–93, 2022. [Google Scholar]
12. Q. Wu, S. Wang, B. Wang, and Y. Wu, “Road extraction method of high-resolution remote sensing image on the basis of the spatial information perception semantic segmentation model,” (in ChineseNatl. Remote Sens. Bull., vol. 26, no. 9, pp. 1872–1885, 2022. doi: 10.11834/jrs.20210021. [Google Scholar] [CrossRef]
13. G. Wang, W. Yang, K. Ning, and J. Peng, “DFC-UNet: A U-net based method for road extraction from remote sensing images using densely connected features,” IEEE Geosci. Remote Sens. Lett., vol. 21, pp. 1–5, 2024. doi: 10.1109/LGRS.2023.3329803. [Google Scholar] [CrossRef]
14. Z. Liu, H. Mao, C. Y. Wu, C. Feichtenhofer, T. Darrell and S. Xie, “A ConvNet for the 2020s,” Accessed: Mar. 02, 2022. [Online]. Available: http://arxiv.org/abs/2201.03545 [Google Scholar]
15. T. Xiao, Y. Liu, B. Zhou, Y. Jiang, and J. Sun, “Unified perceptual parsing for scene understanding,” Accessed: Jul. 26, 2018. [Online]. Available: http://arxiv.org/abs/1807.10221 [Google Scholar]
16. Z. Zhang and M. R. Sabuncu, “Generalized cross entropy loss for training deep neural networks with noisy labels,” Accessed: Nov. 29, 2018. [Online]. Available: http://arxiv.org/abs/1805.07836 [Google Scholar]
17. X. Li, X. Sun, Y. Meng, J. Liang, F. Wu and J. Li, “Dice loss for data-imbalanced NLP tasks,” Accessed: Aug. 29, 2020. [Online]. Available: http://arxiv.org/abs/1911.02855 [Google Scholar]
18. K. He, X. Zhang, S. Ren, and J. Sun, “Deep Residual Learning for Image Recognition,” in 2016 IEEE Conf. Comput. Vis. Pattern Recognit. (CVPR), Las Vegas, NV, USA, IEEE, Jun. 2016, pp. 770–778. [Google Scholar]
19. Z. Liu et al., “Swin transformer: Hierarchical vision transformer using shifted windows,” Accessed: Aug. 17, 2021. [Online]. Available: http://arxiv.org/abs/2103.14030 [Google Scholar]
20. S. Xie, R. Girshick, P. Dollár, Z. Tu, and K. He, “Aggregated residual transformations for deep neural networks,” Accessed: Apr. 10, 2017. [Online]. Available: http://arxiv.org/abs/1611.05431 [Google Scholar]
21. C. Szegedy et al., “Going deeper with convolutions,” in 2015 IEEE Conf. Comput. Vis. Pattern Recognit. (CVPR), Boston, MA, USA, IEEE, Jun. 2015, pp. 1–9. [Google Scholar]
22. I. Tolstikhin et al., “MLP-mixer: An all-MLP architecture for vision,” Accessed: Jun. 11, 2021. [Online]. Available: http://arxiv.org/abs/2105.01601 [Google Scholar]
23. D. Hendrycks and K. Gimpel, “Gaussian error linear units (GELUs),” Accessed: Jun. 27, 2016. [Online]. Available: http://arxiv.org/abs/1606.08415 [Google Scholar]
24. S. Ioffe and C. Szegedy, “Batch normalization: Accelerating deep network training by reducing internal covariate shift,” Accessed: Mar. 02, 2015. [Online]. Available: http://arxiv.org/abs/1502.03167 [Google Scholar]
25. J. L. Ba, J. R. Kiros, and G. E. Hinton, “Layer normalization,” Accessed: Jul. 21, 2016. [Online]. Available: http://arxiv.org/abs/1607.06450 [Google Scholar]
26. T. Y. Lin, P. Dollar, R. Girshick, K. He, B. Hariharan and S. Belongie, “Feature pyramid networks for object detection,” in 2017 IEEE Conf. Comput. Vis. Pattern Recognit. (CVPR), Honolulu, HI, IEEE, Jul. 2017, pp. 936–944. [Google Scholar]
27. V. Ferrari et al., “CBAM: Convolutional block attention module,” in Computer Vision—ECCV 2018, in Lecture Notes in Computer Science, Cham: Springer International Publishing, 2018, vol. 11211, pp. 3–19. [Google Scholar]
28. J. Deng, W. Dong, R. Socher, L. J. Li, K. Li and F. F. Li, “ImageNet: A large-scale hierarchical image database,” in 2009 IEEE Conf. Comput. Vis. Pattern Recognit., Miami, FL, IEEE, Jun. 2009, pp. 248–255. [Google Scholar]
29. L. Zhang, H. Wang, B. Xue, L. He, and Y. Lv, “Research of road extraction from high-resolution remote sensing images based on improved D-LinkNet model,” (in ChineseComput. Eng., vol. 47, no. 9, pp. 288–296, 2021. [Google Scholar]
30. I. Demir et al., “DeepGlobe 2018: A challenge to parse the earth through satellite images,” in 2018 IEEE/CVF Conf. Comput. Vis. Pattern Recognit. Workshops (CVPRW), Salt Lake City, UT, USA, IEEE, Jun. 2018, pp. 172–17209. [Google Scholar]
31. Q. Zhu et al., “A global context-aware and batch-independent network for road extraction from VHR satellite imagery,” ISPRS J. Photogramm. Remote Sens., vol. 175, no. 12, pp. 353–365, May 2021. doi: 10.1016/j.isprsjprs.2021.03.016. [Google Scholar] [CrossRef]
32. O. Ronneberger, P. Fischer, and T. Brox, “U-Net: Convolutional networks for biomedical image segmentation,” Accessed: May 18, 2015. [Online]. Available: http://arxiv.org/abs/1505.04597 [Google Scholar]
33. L. Zhou, C. Zhang, and M. Wu, “D-LinkNet: LinkNet with pretrained encoder and dilated convolution for high resolution satellite imagery road extraction,” in 2018 IEEE/CVF Conf. Comput. Vis. Pattern Recognit. Workshops (CVPRW), Salt Lake City, UT, USA, IEEE, Jun. 2018, pp. 192–1924. [Google Scholar]
34. E. Xie, W. Wang, Z. Yu, A. Anandkumar, J. M. Alvarez and P. Luo, “SegFormer: Simple and efficient design for semantic segmentation with transformers,” Accessed: Oct. 28, 2021. [Online]. Available: http://arxiv.org/abs/2105.15203 [Google Scholar]
35. M. H. Guo, C. Z. Lu, Q. Hou, Z. Liu, M. M. Cheng and S. M. Hu, “SegNeXt: Rethinking convolutional attention design for semantic segmentation,” Accessed: Sep. 18, 2022. [Online]. Available: http://arxiv.org/abs/2209.08575 [Google Scholar]
36. K. He, X. Chen, S. Xie, Y. Li, P. Dollár and R. Girshick, “Masked autoencoders are scalable vision learners,” Accessed: Dec. 19, 2021. [Online]. Available: http://arxiv.org/abs/2111.06377 [Google Scholar]
37. I. Loshchilov and F. Hutter, “Decoupled weight decay regularization,” Accessed: Jan. 04, 2019. [Online]. Available: http://arxiv.org/abs/1711.05101 [Google Scholar]
Cite This Article
 Copyright © 2024 The Author(s). Published by Tech Science Press.
This work is licensed under a Creative Commons Attribution 4.0 International License , which permits unrestricted use, distribution, and reproduction in any medium, provided the original work is properly cited.
 Downloads
 Citation Tools