
 Submit a Paper
 Propose a Special lssue
 Open Access
ARTICLE
Colorectal Cancer Segmentation Algorithm Based on Deep Features from Enhanced CT Images
1 School of Biomedical Engineering, Fourth Military Medical University, Xi’an, 710119, China
2 Department of Radiology, Xijing Hospital, Fourth Military Medical University, Xi’an, 710032, China
3 Department of Radiology, The First Affiliated Hospital of Xi’an Jiaotong University, Xi’an, 710061, China
4 School of Computer Science and Engineering, North Minzu University, Yinchuan, 750030, China
* Corresponding Author: Hongbing Lu. Email:
(This article belongs to the Special Issue: Deep Learning in Computer-Aided Diagnosis Based on Medical Image)
Computers, Materials & Continua 2024, 80(2), 2495-2510. https://doi.org/10.32604/cmc.2024.052476
Received 02 April 2024; Accepted 03 July 2024; Issue published 15 August 2024
 View Full Text
 Download PDF
Abstract
Colorectal cancer, a malignant lesion of the intestines, significantly affects human health and life, emphasizing the necessity of early detection and treatment. Accurate segmentation of colorectal cancer regions directly impacts subsequent staging, treatment methods, and prognostic outcomes. While colonoscopy is an effective method for detecting colorectal cancer, its data collection approach can cause patient discomfort. To address this, current research utilizes Computed Tomography (CT) imaging; however, conventional CT images only capture transient states, lacking sufficient representational capability to precisely locate colorectal cancer. This study utilizes enhanced CT images, constructing a deep feature network from the arterial, portal venous, and delay phases to simulate the physician’s diagnostic process and achieve accurate cancer segmentation. The innovations include: 1) Utilizing portal venous phase CT images to introduce a context-aware multi-scale aggregation module for preliminary shape extraction of colorectal cancer. 2) Building an image sequence based on arterial and delay phases, transforming the cancer segmentation issue into an anomaly detection problem, establishing a pixel-pairing strategy, and proposing a colorectal cancer segmentation algorithm using a Siamese network. Experiments with 84 clinical cases of colorectal cancer enhanced CT data demonstrated an Area Overlap Measure of 0.90, significantly better than Fully Convolutional Networks (FCNs) at 0.20. Future research will explore the relationship between conventional and enhanced CT to further reduce segmentation time and improve accuracy.Keywords
Colorectal cancer (CRC) is a significant intestinal malignancy and one of the most prevalent cancers, ranking fifth in both incidence and mortality. It poses a considerable threat to human health and life. Early detection and treatment are crucial [1]. Currently, there are two main methods for detecting CRC: 1) Gastrointestinal endoscopy: This involves inserting optical equipment into the body to observe abnormal areas and identify cancerous regions. While this method is the gold standard for assessing intestinal conditions, it can cause discomfort, leading to lower patient acceptance [2]. 2) CT imaging: This non-invasive approach is used to obtain intestinal data for detecting and localizing CRC. It is generally more acceptable to patients, though it is costlier. However, the 2D CT images acquired do not intuitively display the 3D structure of the intestines, necessitating the use of artificial intelligence to construct virtual endoscopies for in-depth analysis and detection of CRC [3]. The non-invasive advantage of CT imaging is further highlighted by enhanced CT methods, which can delineate cancer characteristics by injecting contrast agents to observe the intestines at different phases: the arterial phase, portal venous phase, and delayed phase. These phases offer varying organ visualization, aiding physicians in making accurate diagnoses [4].
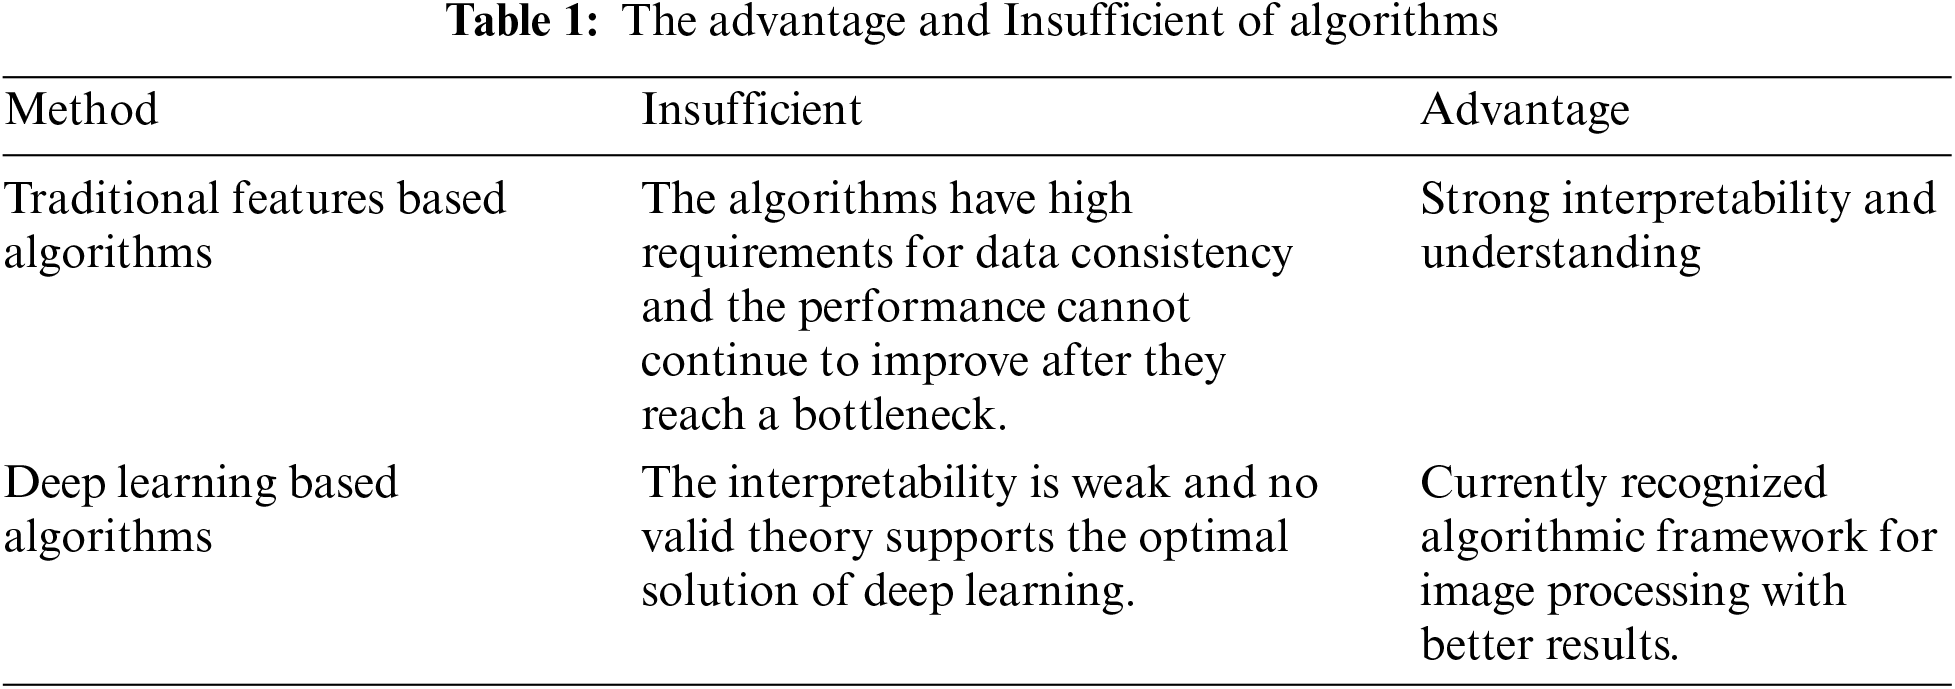
With the advancement of computer technology, computer-assisted physician detection is becoming more feasible. In artificial intelligence-assisted CRC detection, research primarily focuses on standard CT images and endoscopy. Notable algorithms include: Safarov et al. developed a densely connected UNet using endoscopic images for cancer segmentation [5]. Pei et al. created an attention-based Convolutional Neural Network (CNN) for tumor segmentation by analyzing CT imaging characteristics [6]. Abdelsamea et al. developed a cascaded model for this purpose [7]. Vorontsov et al. utilized deep learning to extract cancer features for segmentation [8]. Akilandeswari et al. focused on feature extraction using a Resnet CNN network [9]. Xu et al. developed a deep-learning network for CRC segmentation [10]. Zheng et al. introduced the Multiscale Double-Channel Convolution (MDCC)-Net for CRC segmentation [11]. Jian et al. employed a Visual Geometry Group (VGG)-16 network for cancer segmentation [12]. Jha et al. used deep learning for real-time imaging, localization, and segmentation of CRC [13]. Fang et al. introduced the Adaptive Bezier-Curve Network (Abc-net) for feature extraction [14]. Wei et al. used a Shallow attention network for polyp segmentation [15]. Zhang et al. employed contextual information to focus on polyp regions [16]. Another study by Zhang et al. developed the Self-Calibrated-net for analyzing pathological images of colon cancer [17]. Shaban et al. created a context-aware CNN for cancer staging [18]. Sánchez-González et al., who used a contour model for polyp analysis [19]. Fan et al. developed a Parallel reverse attention network for polyp segmentation [20]. Zhou et al. introduced a 3D UNet network for CRC segmentation [21]. Ribeiro et al. applied multi-image feature fusion for cancer analysis [22]. Alqudah et al. established a 3D Grey-Level Co-occurrence Matrix network for rectal cancer identification [23]. Patel et al. developed an Enhanced U-Net for polyp segmentation [24]. Overall, research can be broadly divided into traditional feature-based algorithms and deep learning-based algorithms, with corresponding advantages and disadvantages summarized in Table 1.
In summary, with advancements in deep learning algorithms, CRC detection is progressing towards automation. However, existing challenges include:
• The representation of CRC information is insufficient when acquired from a single dimension.
• A single scale cannot effectively segment lesion points at various scales.
• The limited number of positive samples leads to poor generalization capabilities.
To address these challenges, we propose a CRC segmentation algorithm based on deep features from enhanced CT images:
• Construct a database of enhanced CT images for CRC, delineating cancerous regions during the arterial, portal venous, and delayed phases.
• On the basis of portal venous phase images, develop a context-aware multi-scale aggregation module to extract information at different scales, focusing on regions with CRC.
• Establish a siamese network mechanism to integrate data from the arterial, portal venous, and delayed phases, transforming the segmentation task into an anomaly detection problem for accurate CRC segmentation.
The structure of this study is outlined as follows: Section 2 presents the algorithm framework. Subsection 2.1 introduces the multi-scale context-aware attention model. Subsection 2.2 discusses the multi-channel segmentation algorithm based on a siamese network. Section 3 describes the data used in the experiments and the conducted experiments to validate the effectiveness of the algorithm. Section 4 summarizes the innovative aspects and future work.
In CT imaging, the grayscale values and distribution of CRC differ from those of normal regions, forming the foundation for computer-aided segmentation of CRC. The algorithm flow is shown in Fig. 1. The steps are as follows: 1) Creating an enhanced CT database: This database includes data from the arterial, portal venous, and delayed phases of CRC. 2) Developing a multi-scale aggregation module (MAM): Utilizing portal venous phase data commonly used by physicians, a context-aware multi-scale aggregation module is developed to extract CRC information at various scales. 3) Establishing a siamese network: Using data from the arterial and delayed phases, an imaging sequence and a pixel pairing strategy are established to construct a siamese network, increasing the number of positive samples while achieving precise CRC segmentation.
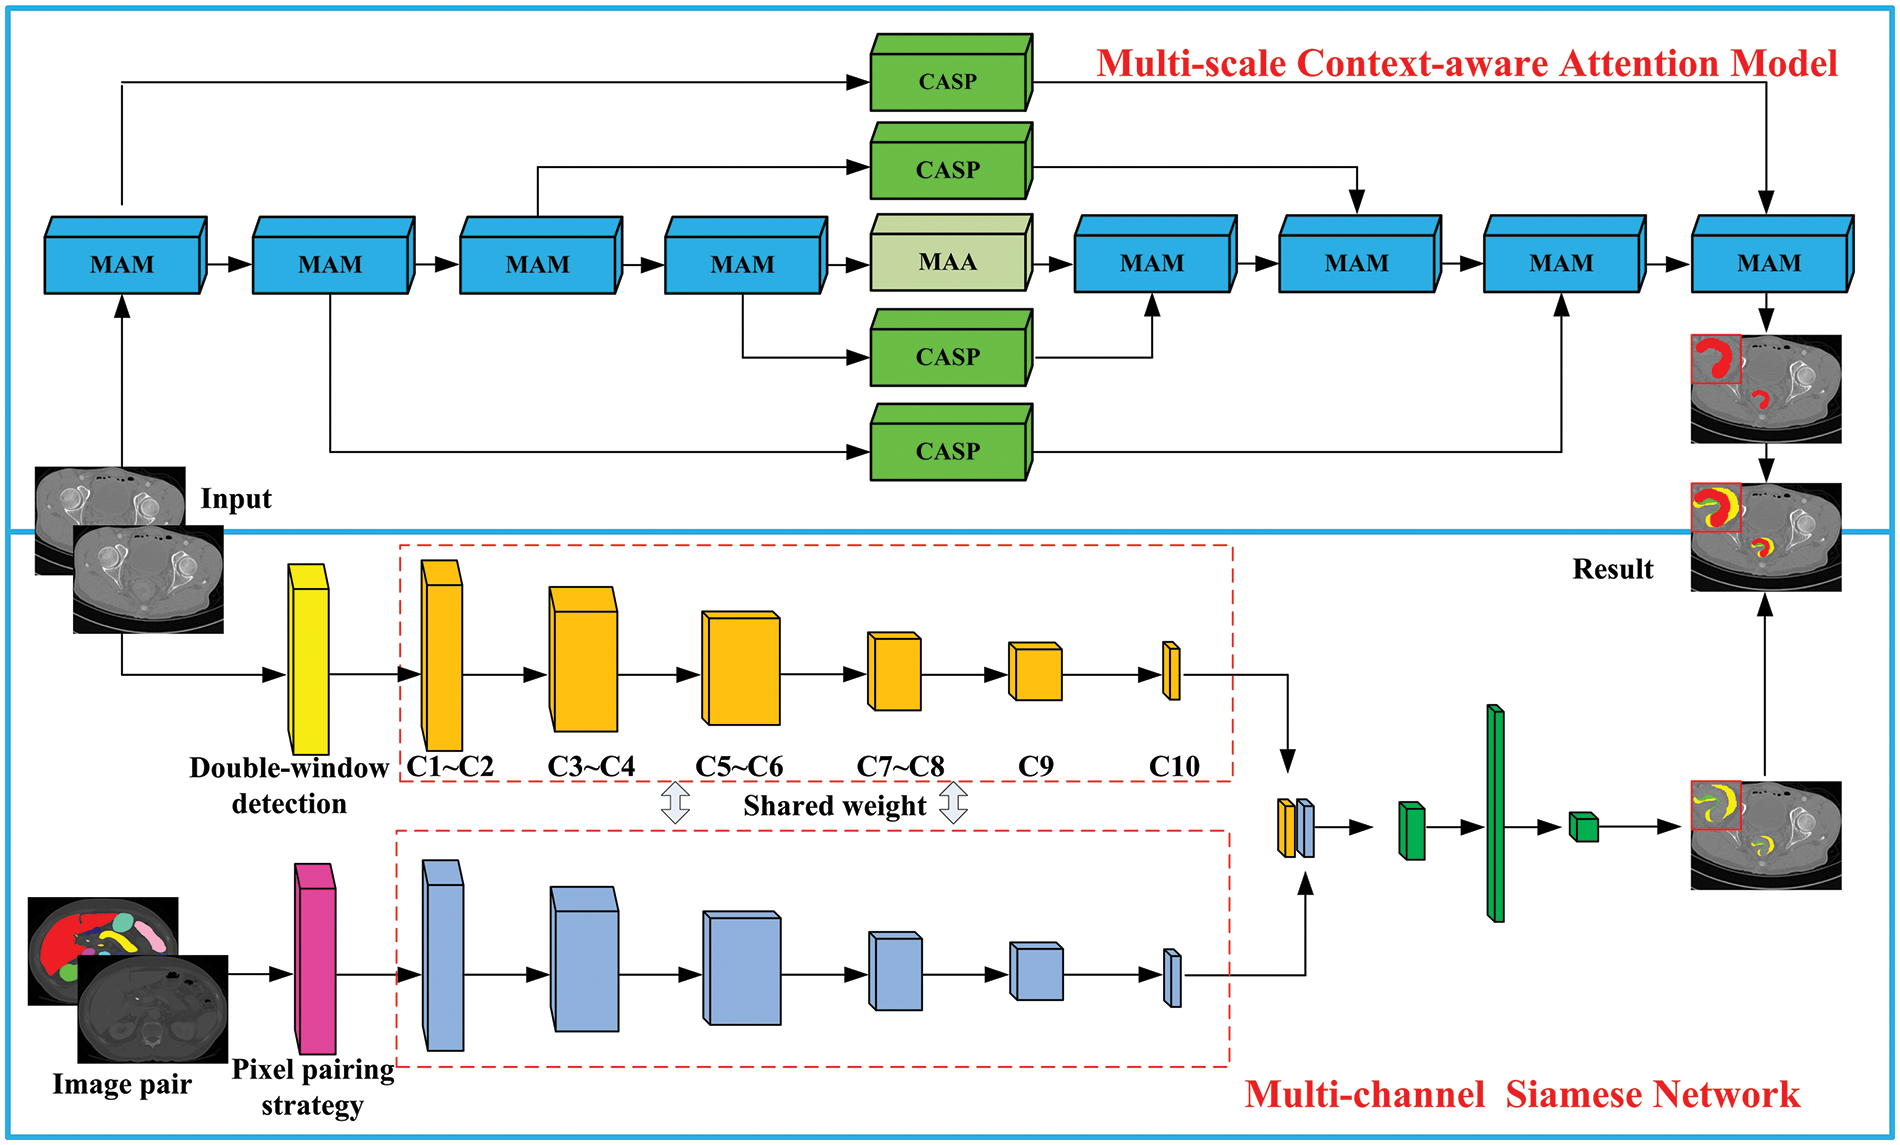
Figure 1: Algorithm flowchart
2.1 Multi-Scale Context-Aware Attention Model
The size of CRC is variable. To accurately capture information about CRC and improve the network’s ability to capture more details, a multi-scale aggregation model is constructed, as shown in Fig. 2. This model comprises three pathways: A1: A 1 × 1 convolution is performed on the input feature map, doubling the number of channels, improving detail capture, and mitigating the vanishing gradient issue. A2: Spatially separable convolutions are employed to decompose the spatial dimension into two convolutions, refining image feature extraction while reducing computational load. A3: A max pooling layer is used to preserve image texture information. Features extracted by paths A2 and A3 are integrated, followed by a 1 × 1 convolution for dimensionality increase, and summed with the output from path A1 to feed into the next layer. The calculation formula for the multi-scale aggregation module is:
where M represents max pooling, b represents bias, F represents the input feature map, and wk×k (.) denotes a convolution kernel of size k × k,
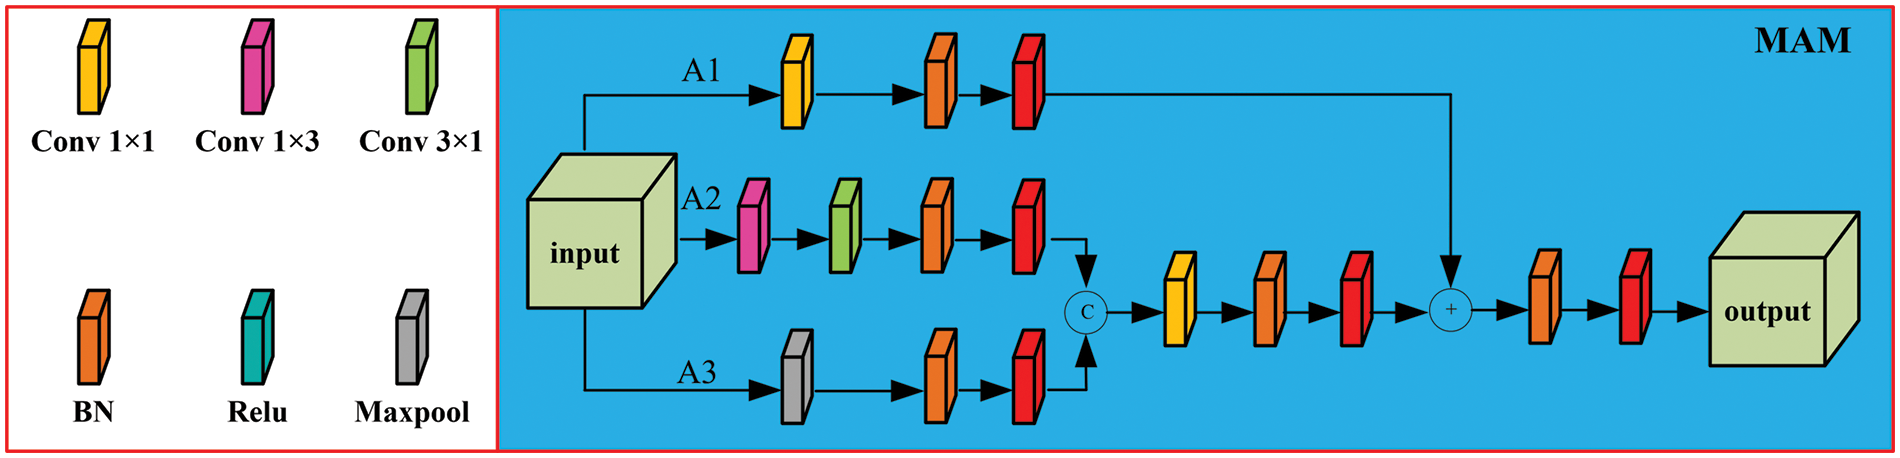
Figure 2: Multi-scale aggregation module
To further increase the network’s capability to acquire information, a context-aware Atreus pyramid module is introduced. The structure is illustrated in Fig. 3. In alignment with the characteristics of CRC, a set of Atreus rates r = {1, 2, 3, 5} is selected to improve the capability of extracting lesion points at various scales. This approach ensures a continuous receptive field, avoiding the loss of local features in image information. The receptive field can be expressed as:
where k denotes the receptive field size of the kth layer, lk-1 is the convolution kernel size of the k−1 layer, and r is the Atreus rate.
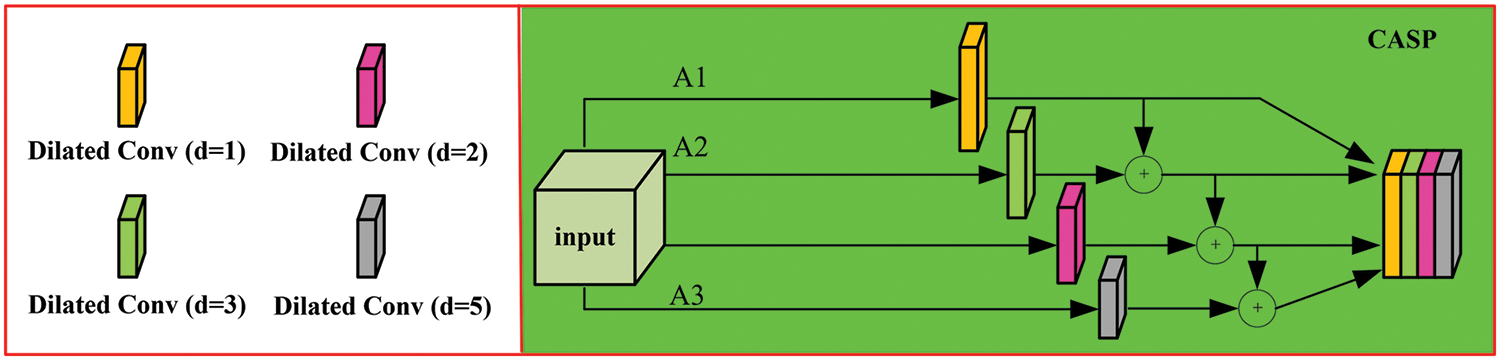
Figure 3: Context-aware atrous spatial pyramid module (CASP)
After processing the input image with convolutions at different atrous rates to capture diverse feature information. Subsequent cascading of the output feature maps captures global information, maintaining a certain correlation in image texture information. Multiple Atreus convolutions compute image features, extracting contextual information. Each layer of the encoder path retains more contextual information, and connections of features are generated at each layer of the decoder path.
An attention mechanism is then introduced based on the spatial structure of CRC, as shown in Fig. 4. This mechanism comprises two parts: 1) The input feature map is processed through a 3 × 3 convolution to obtain f1, which is then fed into the channel and spatial attention mechanisms to extract detailed information, yielding fc1 (channel attention map) and fs (spatial attention map). These are concatenated to produce F1. 2) The input is also processed through a 5 × 5 convolution to obtain fh, which is then input into the channel attention mechanism to extract detailed information. The result is multiplied by f1 to obtain F2, with the final computation formula summarized thereafter.
where fc1(.) and fc2(.) denote the channel attention modules, and fs(.) represents the spatial attention module, with Fout being the final output result.
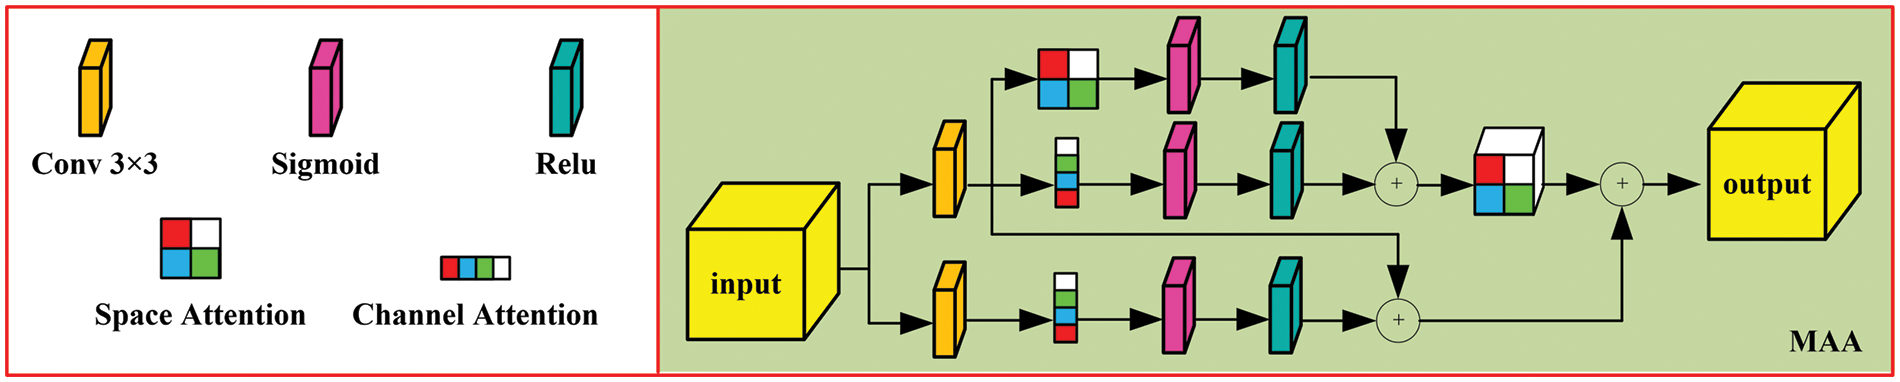
Figure 4: Multi-level aggregation attention module (MAA)
2.2 Multi-Channel Segmentation Algorithm Based on Siamese Networks
Data from the arterial phase, portal venous phase, and delayed phase offer different perspectives on CRC, showing structural similarities and complementary imaging characteristics. To fully utilize the benefits of multi-phase data, the information is combined to construct a multi-channel model. Since CRC regions vary from normal tissue, these differences are reflected in imaging as anomalies. This allows the problem of CRC segmentation to be addressed as an anomaly detection issue.
Due to the relative scarcity of CRC data, we establish relationships between input data and labeled data, forming a pixel pairing strategy to expand the dataset. Let the input dataset be X = {x1, x2,..., xn}, where xi represents the sample collection under the ith class label, with the corresponding label li. Two pixels, Aa and Ab, are randomly selected from X to form the pixel pair Aab, defined as 1 if they belong to the same class, and 0 otherwise. The pixel pairs from the new dataset are fed into the Siamese Neural Network (SNN), allowing the network to learn the differential features of the input samples. The trained classifier model then identifies the feature differences in the input samples, which is subsequently applied to anomaly detection.
The SNN functions to assess the similarity between input data, processing two samples through paired neural networks to map them into two feature vectors in a low-dimensional space. The degree of match between the input data is determined by evaluating the similarity of these feature vectors. The original SNN typically uses a contrastive loss function based on the Euclidean distance between the extracted feature vectors to optimize the network. However, the decision layer of the low-dimensional feature vectors has been improved; instead of using a contrastive loss function for network parameter learning, the two features are integrated, and the network learns the differences between the input pairs, thereby more effectively assessing the similarity of pixel pairs.
Building upon this model based on the SNN architecture, retaining its original structure that includes two shared networks for feature extraction and processing. The branch networks of the feature extraction module adopt a CNN structure with shared weights, while the feature processing module utilizes convolutional layers and fully connected layers for classification tasks.
In the CNN structure, the C1−9 layers use 1 × 3 convolutional kernels, along with Batch Normalization (BN) and Rectified Linear Unit (ReLU) layers, to improve the convergence of the stochastic gradient descent algorithm and to prevent overfitting. C1 and C2 use padding to obtain feature maps, while C3, C5, and C7 employ convolutional layers with a stride of 2 for down-sampling. As the network depth increases, nonlinear features of pixels are captured, resulting in a feature vector after C9.
Pixel pairs are input into the feature extraction module of the Siamese network, yielding two feature vectors. When the input label for a pixel pair is 0, it indicates that the pixels belong to the same category. Pairs labeled with a 1 show distinct feature pairs. The feature processing module, following the feature extraction module, uses convolutional layers to learn the differences between the features and maps the feature pairs to a single value that indicates the disparity between the pixel pairs, enabling the convolutional layer to extract features with discriminative properties.
The module within the SNN concatenates input features and processes them through four convolutional kernels of size 1 × 3 × 2, with a stride of 2, to extract differential features between pixels. The fully connected layer has two layers, facilitating binary classification. Following this, a Sigmoid layer constrains values to the range [0,1], normalizing the data nonlinearly and providing a differential score for the pixel pairs. Pixel pairs of the same category yield an anomaly probability close to 0, while disparate categories yield values close to 1. This trained binary classification network is then applied to anomaly detection, differentiating between background and anomalous pixels in the detection set.
A sliding dual-window detection model is used, where pixels in the inner window are excluded from detection. The central pixel T represents the pixel under test, while the pixels in the outer window serve as background pixels paired with the central pixel. The difference scores between these pixels and the pixel under test are calculated, where a score closer to 1 indicates a lower degree of similarity. By averaging these scores, the anomaly prediction value D (T) for the central pixel is obtained. A threshold TM is then set to assess the level of disparity.
The data were primarily sourced from the Department of Radiology at Xijing Hospital and the First Affiliated Hospital of Xi’an Jiaotong University. The dataset includes 84 cases of CRC, with each case covering the arterial phase, portal venous phase, and delayed phase. Professional radiologists performed pixel-level annotations of CRC regions across all three phases, and these annotations formed the final dataset. All programs were run on a server with Ubuntu 18.04.6, an Intel Xeon Platinum 8260 CPU, NVIDIA GeForce RTX 3090 GPU, and 512 GB of memory. The data were split into training and test sets in a 1:1 ratio.
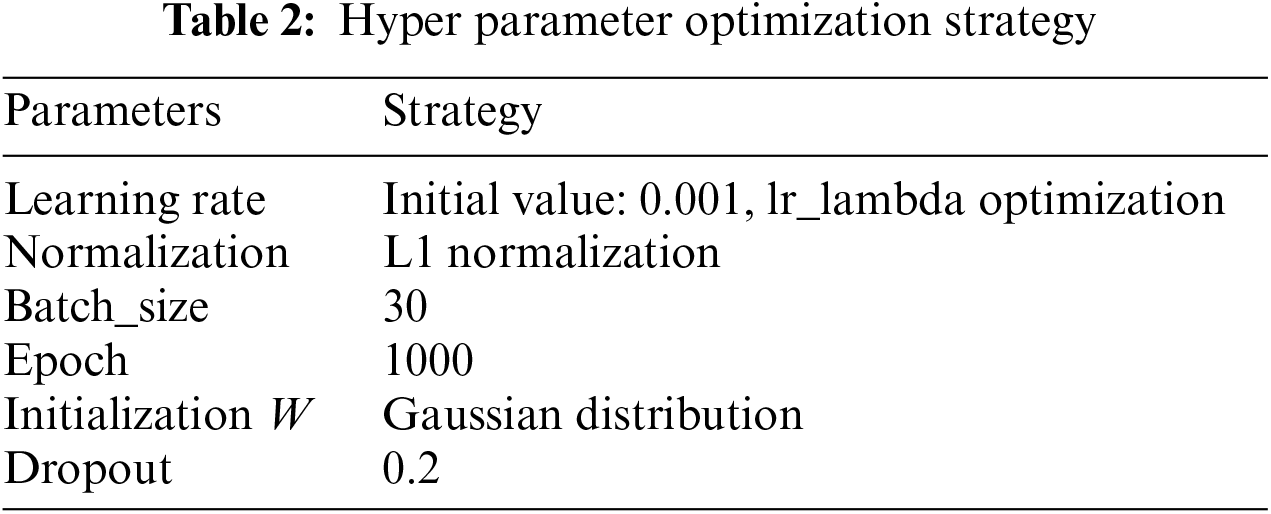
Hyperparameter tuning is a critical aspect of deep learning, with methods including manual parameter tuning, grid search, random search, and Bayesian optimization. 1) Given the offline learning nature of the algorithm and the manageable data size, training time was acceptable. 2) The algorithm aims to assist physicians in accurate segmentation, and a suboptimal solution meeting the required convergence range suffices. Thus, manual parameter tuning based on past experience yielded satisfactory results, as shown in Table 2.
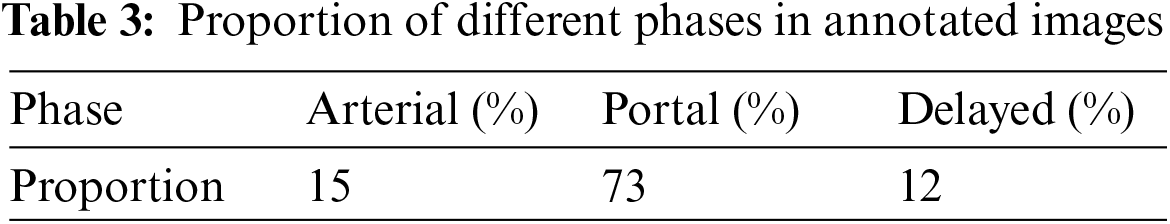
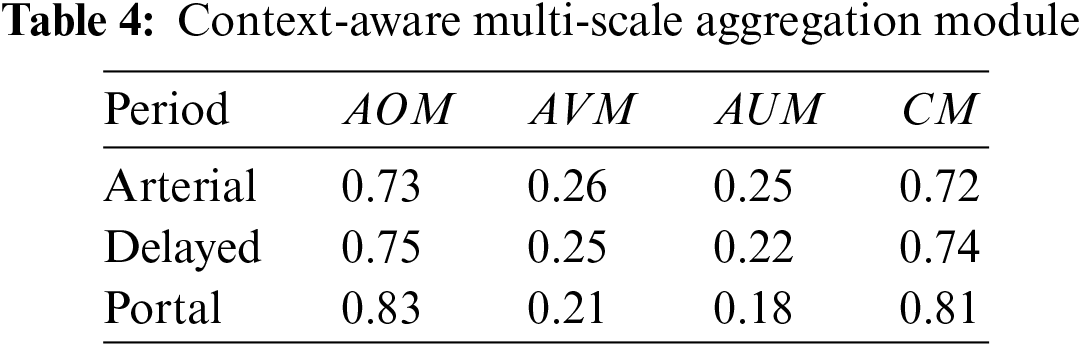
Using the radiologists’ annotations as the gold standard, the percentage of pixels for each phase was calculated (Table 3), showing that each phase reveals distinct characteristics of CRC. The analysis of the diagnostic process showed that while portal venous phase data are primarily used, arterial and delayed phases are also considered to achieve accurate segmentation of CRC.
The visual representation of CRC data shows three sets of data that include images from the arterial phase, portal venous phase, and delayed phase, with each phase featuring three consecutive frames. In Fig. 5, a green box highlights the location of CRC. Coronal and sagittal plane images are used to show the cancer from various angles. From a grayscale value perspective, CRC can be distinguished from surrounding tissues, though the difference is minimal, making accurate segmentation challenging for untrained individuals. Given the brief time intervals between imaging phases, slight shifts in the patient’s position can occur. Thus, minor adjustments such as translation, rotation, and scaling were applied to the bone area for image registration. The image sequences show that CRC appears as erosive or compact structures, with noticeable differences across the phases. As a result, physicians need to analyze images from various phases to accurately delineate the affected region.
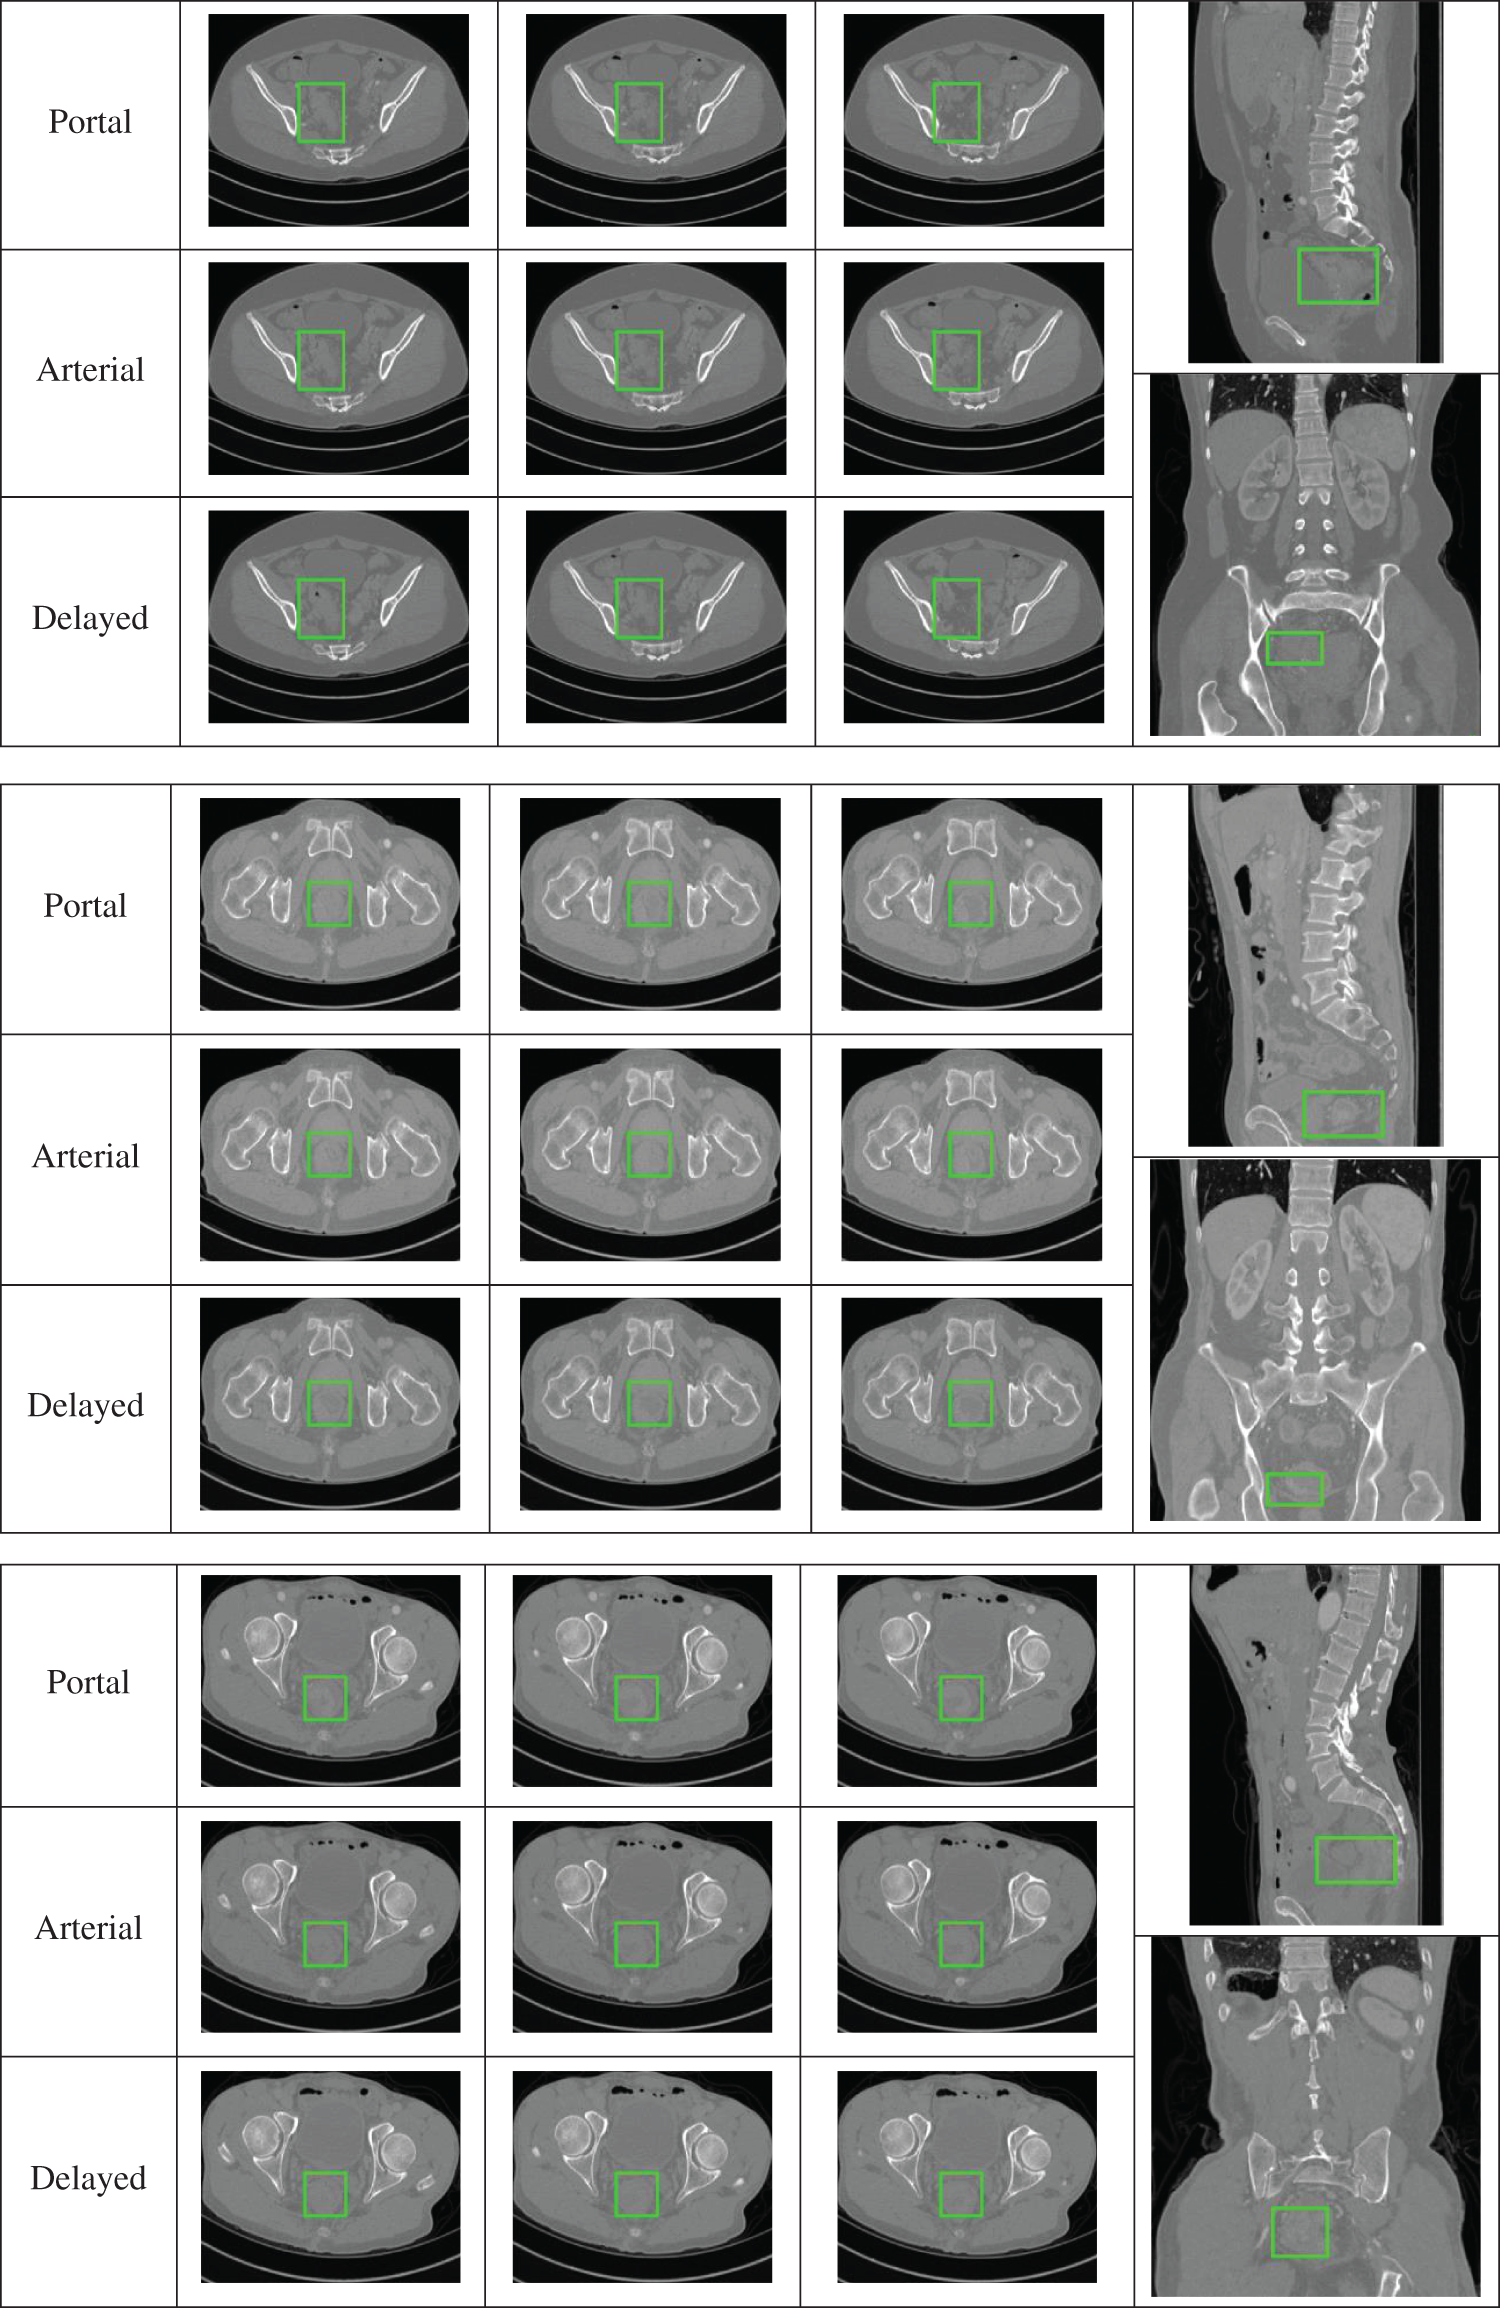
Figure 5: Representative data display
The algorithm uses data from the arterial phase, portal venous phase, and delayed phase, incorporating Area Overlap Measure (AOM), Area Over-segmentation Measure (AVM), Area Under-segmentation Measure (AUM), and Combination Measure (CM), along with Receiver Operating Characteristic (ROC) analysis to assess performance.
where A represents the gold standard, and B denotes the algorithm’s segmentation results. AOM and CM are directly proportional to the algorithm’s performance, whereas AVM and AUM are inversely proportional.
To validate the performance of the multi-scale context-aware attention model, the final annotated results of CRC were used as a target, with data from all three phases being inputted and their performance quantified. Table 3 shows that all three phases provide some information on CRC, with the portal venous phase imagery having the strongest representation capability, followed by the arterial and delayed phases, which are comparatively weaker. This validates the effectiveness of the context-aware multi-scale aggregation algorithm.
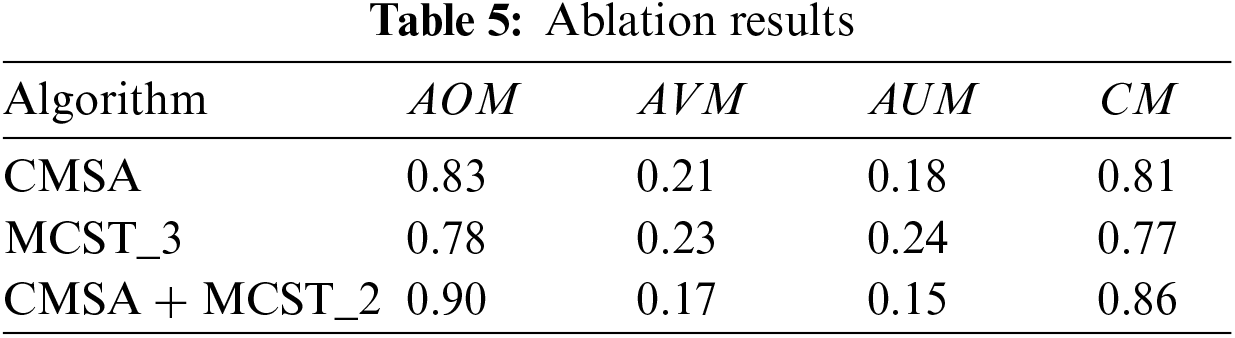
Although the portal venous phase alone does not fully characterize CRC, a multi-channel algorithm was developed based on a Siamese network, transforming target segmentation into an anomaly detection problem, using data from different phases. Table 4 illustrates the ablation study results, showing three algorithms: CMSA inputs portal venous phase data. MCST_3 inputs data from the arterial phase, portal venous phase, and delayed phase into MCST. CMSA+MCST_2 inputs portal venous phase data into CMSA, and arterial and delayed phase data into MCST, with their integrated results forming the final outcome. Table 5 reveals that all three algorithms can segment CRC. The CMSA algorithm, using only portal venous phase imagery, has limited representation capability. MCST_3, integrating features from all three phases, improves performance but dilutes primary image information by analyzing the three-phase images in a single dimension. In contrast, the CMSA+MCST_2 algorithm, inputting portal venous phase data into CMSA for primary feature extraction and arterial and delayed phase data into MCST_2 for auxiliary information, aligns with physicians’ diagnostic processes, effectively utilizing the data characteristics for better results.
The iteration curves for different algorithms used for CRC segmentation, as shown in Fig. 6. The CMSA algorithm, with input from a single image phase, converges after approximately 400 iterations, achieving a loss value of 0.02 due to fewer network parameters. The MCST_3 algorithm, using data from three time-phase images, has a more complex structure and converges around 600 iterations, reaching a loss value of about 0.17. The CMSA+MCST_2 algorithm, processing first through CMSA and then through MCST_2, further increases network parameters, converging after 700 iterations with a loss value of 0.14, demonstrating the best performance.
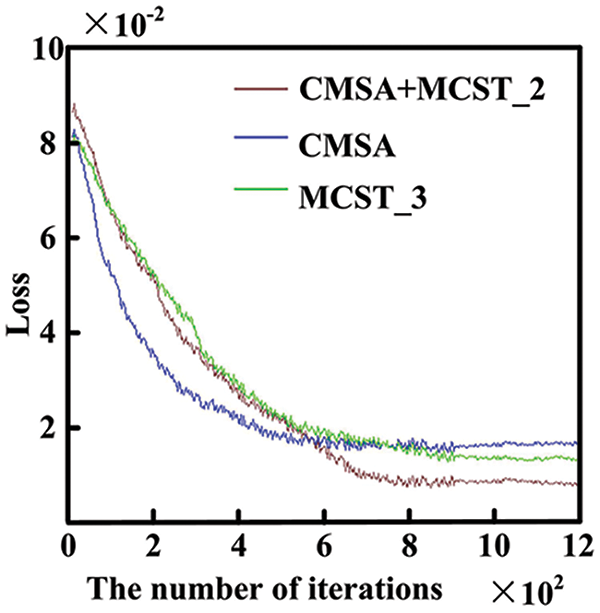
Figure 6: Algorithm iteration curve
3.2 Comparison of Algorithm Results
Deep learning-based algorithms are a primary research direction for CRC segmentation, as shown in Table 6. Several representative algorithms are analyzed, as summarized in Table 7: FCNs [12] based on the VGG-16 framework model and extract intestinal features, achieving a CM of 0.71. The 3D UNet [21] algorithm incorporates 3D information into the network, facilitating representation and enabling CRC segmentation. However, it requires a significant amount of data for training, with limited data leading to convergence issues. The MDCC-Net [11] algorithm utilizes the U-Net architecture to develop a multiscale double-channel model, achieving favorable outcomes from a multiscale perspective. Attention-based (ATT)-CNN [6] introduces an attention mechanism to CNNs, increasing specificity by focusing on potential suspect areas. Res-CNN [9] adapts the CNN framework to incorporate the Residual Neural Network (ResNet), capturing deeper and broader scale information, which strengthens its representational capacity. These algorithms primarily extract features using arterial phase imaging, limiting their representational capability. In contrast, the proposed algorithm conducts CRC segmentation in two steps: first, using arterial phase imaging to establish a context-aware multiscale aggregation module for preliminary extraction, and then compiling portal venous and delayed phase data into an image sequence, which is input into a Siamese network-based multichannel algorithm, transforming the segmentation task into an anomaly detection problem. This method thoroughly explores the characteristics of images from different phases, achieving effective CRC segmentation with a CM of 0.86. Fig. 7 shows ROC curves for different algorithms.
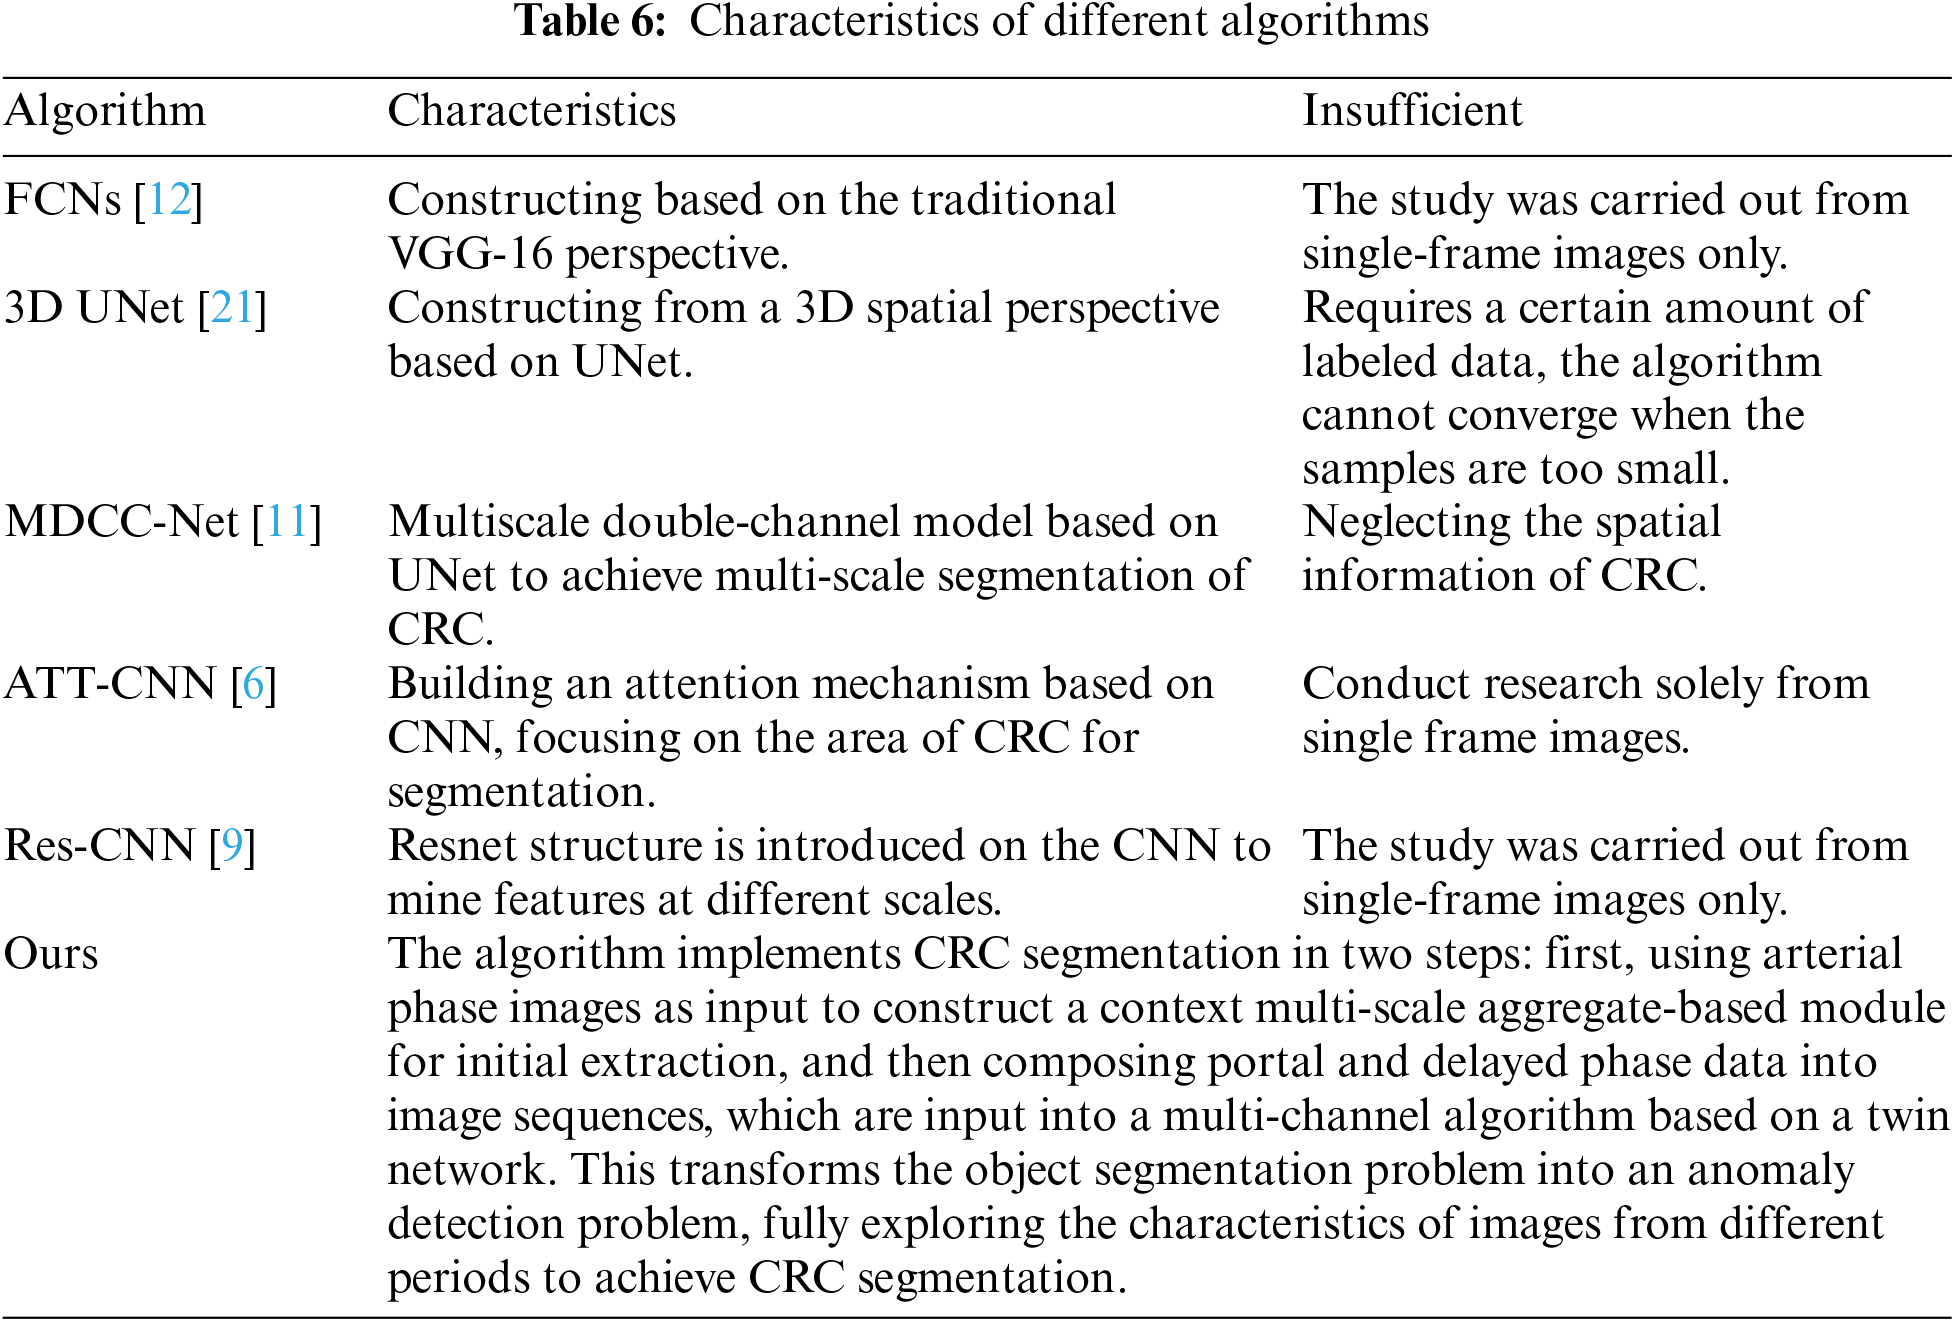
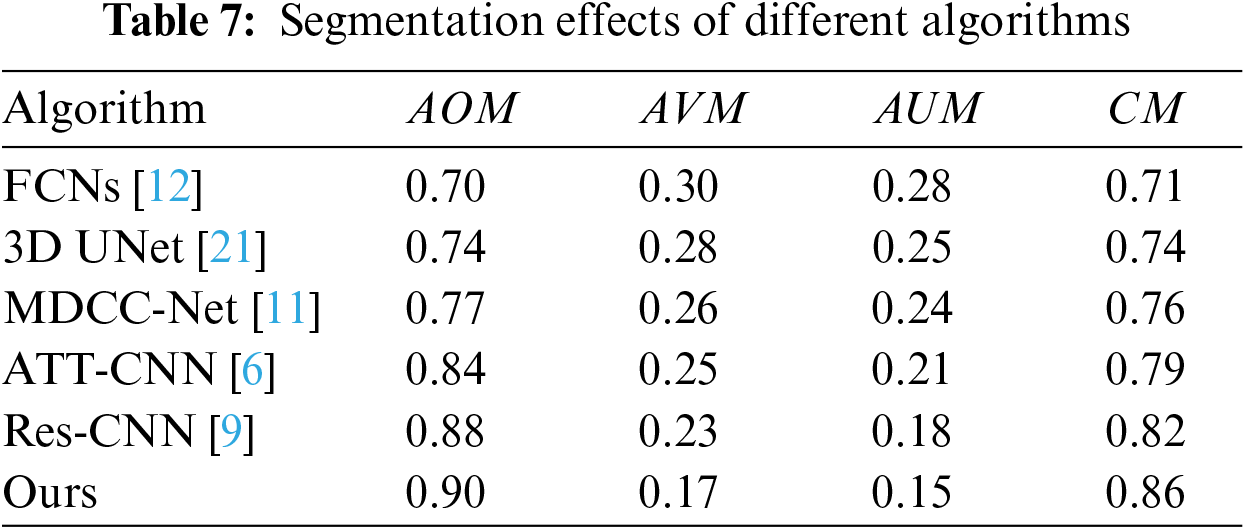
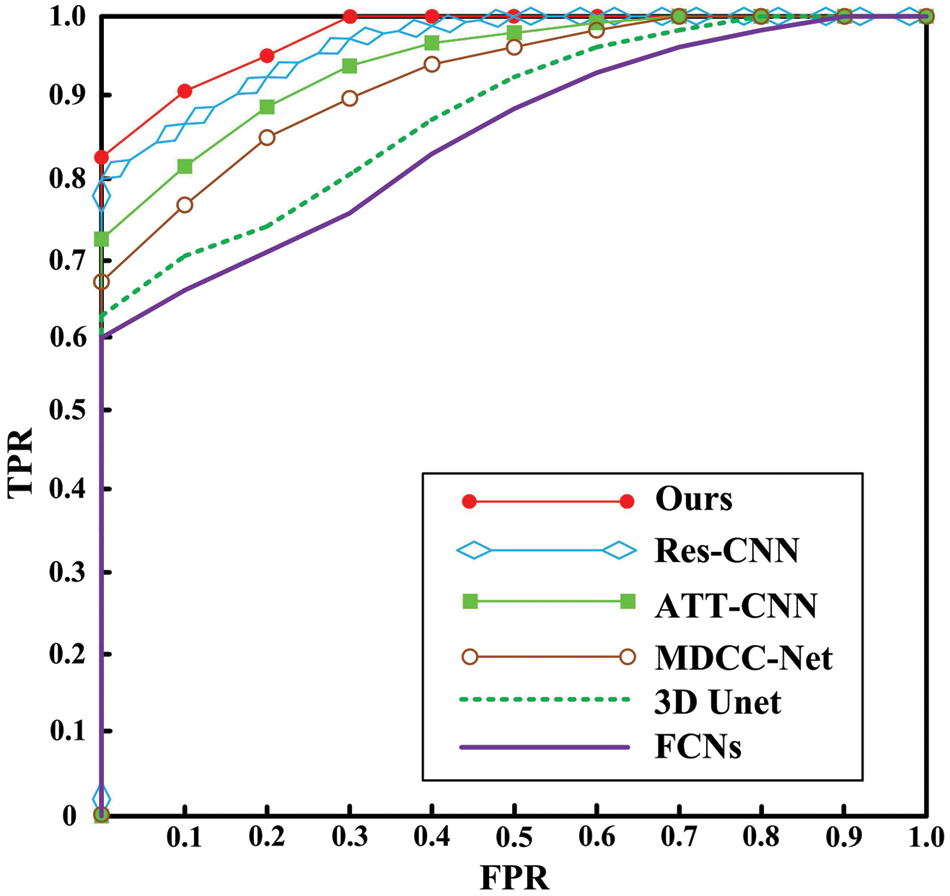
Figure 7: ROC curve
3.3 Algorithm Performance Demonstration
The deep learning framework employed here includes operations such as convolutional layers, RELU, and pooling layers. 1) During the training process, the networks are divided into two parts for training: the first based on a multi-scale contextual attention model, and the second on a multi-channel segmentation model based on a twin network. 2) Deep learning algorithms lack a complete theory for determining whether they have reached an optimal solution, so specific thresholds are often set, and parameters meeting these thresholds become the final parameters. The initial parameter value is crucial; when it is closer to the solution that meets the conditions, training requires less iteration, reducing time complexity. However, the number of feedback adjustment parameters cannot be accurately calculated, making it difficult to measure time complexity during the training phase. In the testing phase, we calculated the computation time ratio of the two models, which is approximately 1:2. Each frame costs about 3 s.
The segmentation results obtained by the algorithm presented in this article are depicted in Fig. 8, demonstrating its ability to accurately segment CRC. Data from the portal venous phase are marked in red, data from the delayed phase in green, and data from the arterial phase in yellow. The three-dimensional images provide a clear visual representation of the cancer’s morphology, showing a relatively complete structure, and validating the algorithm’s effectiveness. The final segmentation proportions for portal, arterial, and delayed phase data are 70%:17%:13%, respectively, aligning closely with the physicians’ annotations and indirectly confirming the algorithm’s efficacy. Fig. 8a shows the segmentation results from all three phases intertwined. Fig. 8b demonstrates that arterial and delayed phase data are distributed at the ends of the CRC region, with portal venous phase data predominantly concentrated in the middle, indicating that images from different phases represent distinct regions, facilitating a comprehensive segmentation. Fig. 8c shows that the main body is derived from portal venous phase data, with arterial and delayed phase data supplementing boundary details, increasing the completeness of the CRC segmentation. In summary, the algorithm proposed here can achieve accurate segmentation of CRC.
We conduct an analysis of the time complexity of the algorithm proposed in this paper: The time complexity corresponding to the convolutional layer is: O(N2C_in × C_out × K2), where N represents the length of the input feature map, C_in and C_out denote the number of input and output channels, respectively, and K is the length of the convolutional kernel.
The time complexity corresponding to ReLU is: O(1). The time complexity corresponding to Sigmoid is: O(n). Since the time complexity of the convolutional layer is dependent on the size of the input feature map, the number of channels, and the size of the convolutional kernel, and since the input and output of each convolutional layer differ, accurately calculating the time complexity poses certain difficulties. Therefore, we preliminarily estimate the time complexity as follows: O = A × O(N2C_in × C_out × K2)+B × O(1) + C × O(n). A, B, C indicates the number of modules. It can be observed that the proposed algorithm primarily involves multiplication and addition operations, with fewer division operations. Moreover, with the enhancement of computer computational capabilities, the requirements during the testing phase can be met.
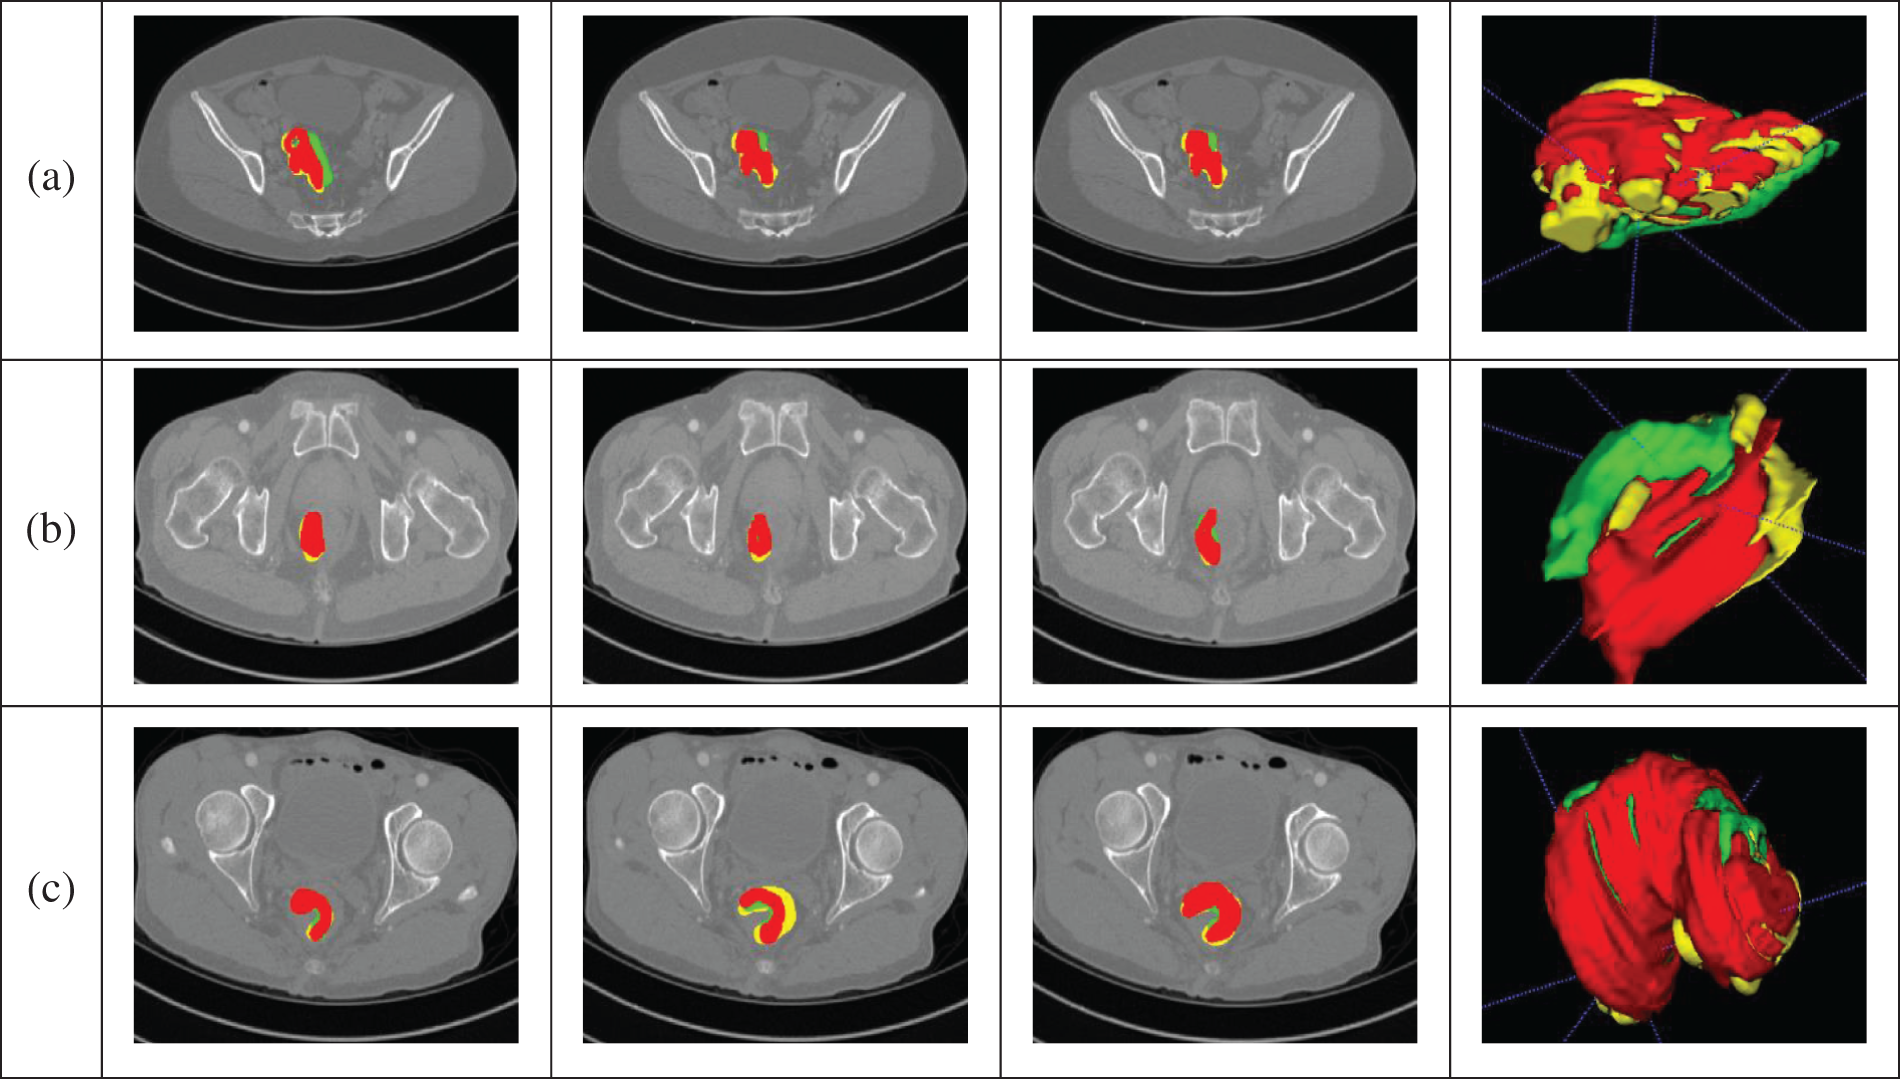
Figure 8: Segmentation results. (a) The segmentation results from all three phases intertwined. (b) The arterial and delayed phase data are distributed at the ends of the CRC region, with portal venous phase data predominantly concentrated in the middle, indicating that images from different phases represent distinct regions, facilitating a comprehensive segmentation. (c) The main body is derived from portal venous phase data, with arterial and delayed phase data supplementing boundary details, increasing the completeness of the CRC segmentation
However, during the training process, a significant amount of computational resources are consumed to adjust parameters using gradient-based methods, requiring substantial computational effort and time. Nevertheless, the training process is offline, often taking 1–2 weeks or longer, which is a common phenomenon in all deep learning algorithms and requires further in-depth research.
4 Conclusion and Future Directions
Addressing the challenge of accurately segmenting CRC in standard CT images, this paper presents a segmentation algorithm based on deep features from enhanced CT images. The innovations are as follows:
1) The algorithm thoroughly analyzes imaging characteristics across the arterial, portal venous and delayed phases of enhanced CT images to improve performance.
2) A multi-scale context-aware attention model is introduced, using portal venous phase imaging as input to focus on the CRC region.
3) A multi-channel algorithm based on a Siamese network is proposed, transforming the segmentation task into an anomaly detection problem. This method compiles portal venous and delayed phase data into an image sequence, extracting information and achieving accurate CRC segmentation.
However, there are still challenges to address in future research:
1) The data originate from a single center, and the algorithm’s applicability to multi-center data needs further validation.
2) While there is some correlation among arterial, portal venous and delayed phases in imaging, acquiring these images is more costly and challenging than traditional CT imaging. How to establish a relationship between standard CT and enhanced images for accurate CRC segmentation requires further investigation.
3) Research on hyper parameter optimization is needed to promote efficient network training.
Acknowledgement: The authors also gratefully acknowledge the helpful comments and suggestions of the reviewers, which have improved the presentation.
Funding Statement: This work is supported by the Natural Science Foundation of China (No. 82372035). National Transportation Preparedness Projects (No. ZYZZYJ). Light of West China (No. XAB2022YN10). The China Postdoctoral Science Foundation (No. 2023M740760).
Author Contributions: Shi Qiu and Hongbing Lu performed the experiments. Jun Shu, Tao Zhou and Ting Liang analyzed the data. All authors conceived and designed research, and contributed to the interpretation of the data and drafting the work. All authors reviewed the results and approved the final version of the manuscript.
Availability of Data and Materials: The data used to support the findings of this study are available from the corresponding author upon request.
Conflicts of Interest: The authors declare that they have no conflicts of interest to report regarding the present study.
References
1. L. Beevi, P. Prathap, P. Reddy, and G. Priya, “Small intestine cancer prediction using deep learning: A comparative study of CNNs and RNNs,” in 2024 Third Int. Conf. Distrib. Comput. High Perform. Comput. (DCHPC), Tehran, Islamic Republic of Iran, IEEE, 2024, pp. 1–5. [Google Scholar]
2. H. Ali et al., “Artificial intelligence in gastrointestinal endoscopy: A comprehensive review,” Ann. Gastroenterol., vol. 37, no. 2, pp. 133, 2024. doi: 10.20524/aog.2024.0861. [Google Scholar] [PubMed] [CrossRef]
3. A. Gangi-Burton et al., “Paris classification of colonic polyps using CT colonography: Prospective cohort study of interobserver variation,” Eur. Radiol., vol. 22, no. 6, pp. 1–8, 2024. doi: 10.1007/s00330-024-10631-9. [Google Scholar] [PubMed] [CrossRef]
4. C. Yang and K. Lin, “Improving the detection of hypo-vascular liver metastases in multiphase contrast-enhanced CT with slice thickness less than 5 mm using DenseNet,” Radiography, vol. 30, no. 3, pp. 759–769, 2024. doi: 10.1016/j.radi.2024.02.022. [Google Scholar] [PubMed] [CrossRef]
5. S. Safarov and T. Whangbo, “A-DenseUNet: Adaptive densely connected UNet for polyp segmentation in colonoscopy images with atrous convolution,” Sensors, vol. 21, no. 4, pp. 1441, 2021. doi: 10.3390/s21041441. [Google Scholar] [PubMed] [CrossRef]
6. Y. Pei et al., “Colorectal tumor segmentation of CT scans based on a convolutional neural network with an attention mechanism,” IEEE Access, vol. 8, pp. 64131–64138, 2020. doi: 10.1109/ACCESS.2020.2982543. [Google Scholar] [CrossRef]
7. M. Abdelsamea, A. Pitiot, R. Grineviciute, J. Besusparis, A. Laurinavicius and M. Ilyas, “A cascade-learning approach for automated segmentation of tumour epithelium in colorectal cancer,” Expert. Syst. Appl., vol. 118, no. 4, pp. 539–552, 2019. doi: 10.1016/j.eswa.2018.10.030. [Google Scholar] [CrossRef]
8. E. Vorontsov et al., “Deep learning for automated segmentation of liver lesions at CT in patients with colorectal cancer liver metastases,” Radiol.: Artif. Intell., vol. 1, no. 2, pp. 180014, 2019. [Google Scholar] [PubMed]
9. A. Akilandeswari et al., “Automatic detection and segmentation of colorectal cancer with deep residual convolutional neural network,” Evid. Based Complement. Alternat. Med., vol. 2022, no. 1, pp. 1–8, 2022. doi: 10.1155/2022/3415603. [Google Scholar] [PubMed] [CrossRef]
10. L. Xu et al., “Colorectal cancer detection based on deep learning,” J. Pathol. Inf., vol. 11, no. 1, pp. 28, 2020. doi: 10.4103/jpi.jpi_68_19. [Google Scholar] [PubMed] [CrossRef]
11. S. Zheng et al., “MDCC-Net: Multiscale double-channel convolution U-Net framework for colorectal tumor segmentation,” Comput. Biol. Med., vol. 130, no. 6, pp. 104183, 2021. doi: 10.1016/j.compbiomed.2020.104183. [Google Scholar] [PubMed] [CrossRef]
12. J. Jian et al., “Fully convolutional networks (FCNs)-based segmentation method for colorectal tumors on T2-weighted magnetic resonance images,” Australas. Phys. Eng. Sci. Med., vol. 41, no. 2, pp. 393–401, 2018. doi: 10.1007/s13246-018-0636-9. [Google Scholar] [PubMed] [CrossRef]
13. D. Jha et al., “Real-time polyp detection, localization and segmentation in colonoscopy using deep learning,” IEEE Access, vol. 9, pp. 40496–40510, 2021. doi: 10.1109/ACCESS.2021.3063716. [Google Scholar] [PubMed] [CrossRef]
14. Y. Fang, D. Zhu, J. Yao, Y. Yuan, and K. Tong, “ABC-Net: Area-boundary constraint network with dynamical feature selection for colorectal polyp segmentation,” IEEE Sens. J., vol. 21, no. 10, pp. 11799–11809, 2020. doi: 10.1109/JSEN.2020.3015831. [Google Scholar] [CrossRef]
15. J. Wei, Y. Hu, R. Zhang, Z. Li, S. Kevin Zhou and S. Cui, “Shallow attention network for polyp segmentation,” in Med. Image Comput. Comput. Assist. Interv.–MICCAI 2021: 24th Int. Conf., Strasbourg, France, 2021, pp. 699–708. [Google Scholar]
16. R. Zhang, G. Li, Z. Li, S. Cui, D. Qian and Y. Yu, “Adaptive context selection for polyp segmentation,” in Med. Image Comput. Comput. Assist. Interv.–MICCAI 2020: 23rd Int. Conf., Lima, Peru, 2020, pp. 253–262. [Google Scholar]
17. G. Zhang, Z. He, Y. Zhang, Z. Li, and L. Wu, “SC-Net: Symmetrical conical network for colorectal pathology image segmentation,” Comput. Meth. Prog. Biomed., vol. 248, no. 1, pp. 108119, 2024. doi: 10.1016/j.cmpb.2024.108119. [Google Scholar] [PubMed] [CrossRef]
18. M. Shaban et al., “Context-aware convolutional neural network for grading of colorectal cancer histology images,” IEEE Trans. Med. Imaging, vol. 39, no. 7, pp. 2395–2405, 2020. doi: 10.1109/TMI.2020.2971006. [Google Scholar] [PubMed] [CrossRef]
19. A. Sánchez-González, B. García-Zapirain, D. Sierra-Sosa, and A. Elmaghraby, “Automatized colon polyp segmentation via contour region analysis,” Comput. Biol. Med., vol. 100, no. 4, pp. 152–164, 2018. doi: 10.1016/j.compbiomed.2018.07.002. [Google Scholar] [PubMed] [CrossRef]
20. D. Fan et al., “Pranet: Parallel reverse attention network for polyp segmentation,” in Int. Conf. Med. Image Comput. Comput.—Assist. Interv., Lima, Peru, Springer, 2020, pp. 263–273. [Google Scholar]
21. W. Zhou, K. Mai, H. Peng, and R. Wang, “Colorectal tumour segmentation based on 3D-UNet,” in 2021 Int. Conf. Comput. Inf. Sci. Artif. Intell. (CISAI), Kunming, China, 2021, pp. 430–435. [Google Scholar]
22. M. Ribeiro, L. Neves, M. Nascimento, G. Roberto, A. Martins and T. Tosta, “Classification of colorectal cancer based on the association of multidimensional and multiresolution features,” Expert. Syst. Appl., vol. 120, no. 2, pp. 262–278, 2019. doi: 10.1016/j.eswa.2018.11.034. [Google Scholar] [CrossRef]
23. A. Alqudah and A. Alqudah, “Improving machine learning recognition of colorectal cancer using 3D GLCM applied to different color spaces,” Multimed. Tools Appl., vol. 81, no. 8, pp. 10839–10860, 2022. doi: 10.1007/s11042-022-11946-9. [Google Scholar] [CrossRef]
24. K. Patel, A. Bur, and G. Wang, “Enhanced U-Net: A feature enhancement network for polyp segmentation,” in 2021 18th Conf. Robots Vis. (CRV), Burnaby, BC, Canada, 2021, pp. 181–188. [Google Scholar]
Cite This Article
 Copyright © 2024 The Author(s). Published by Tech Science Press.
This work is licensed under a Creative Commons Attribution 4.0 International License , which permits unrestricted use, distribution, and reproduction in any medium, provided the original work is properly cited.
 Downloads
 Citation Tools