
 Submit a Paper
 Propose a Special lssue
 Open Access
ARTICLE
SNR and RSSI Based an Optimized Machine Learning Based Indoor Localization Approach: Multistory Round Building Scenario over LoRa Network
1 Malaysian Institute of Information Technology (MIIT), Universiti Kuala Lumpur, Kuala Lumpur, 50250, Malaysia
2 Faculty of Computing and Informatics, Multimedia University, Cyberjaya, 63100, Malaysia
3 Depertment of Computer Science, DHA Suffa University, Karachi, Sindh, 75500, Pakistan
4 Riphah Institute of System Engineering (RISE), Faculty of Computing, Riphah International University, Islamabad, 46000, Pakistan
5 Malaysian France Institute (MFI), Universiti Kuala Lumpur, Kuala Lumpur, 50250, Malaysia
6 Faculty of Engineering and Information Technology, School of Computer Science, University of Technology Sydney, Ultimo, NSW 2007, Australia
* Corresponding Author: Mazliham Mohd Su’ud. Email:
Computers, Materials & Continua 2024, 80(2), 1927-1945. https://doi.org/10.32604/cmc.2024.052169
Received 25 March 2024; Accepted 23 May 2024; Issue published 15 August 2024
 View Full Text
 Download PDF
Abstract
In situations when the precise position of a machine is unknown, localization becomes crucial. This research focuses on improving the position prediction accuracy over long-range (LoRa) network using an optimized machine learning-based technique. In order to increase the prediction accuracy of the reference point position on the data collected using the fingerprinting method over LoRa technology, this study proposed an optimized machine learning (ML) based algorithm. Received signal strength indicator (RSSI) data from the sensors at different positions was first gathered via an experiment through the LoRa network in a multistory round layout building. The noise factor is also taken into account, and the signal-to-noise ratio (SNR) value is recorded for every RSSI measurement. This study concludes the examination of reference point accuracy with the modified KNN method (MKNN). MKNN was created to more precisely anticipate the position of the reference point. The findings showed that MKNN outperformed other algorithms in terms of accuracy and complexity.Keywords
Localization is the process of determining an object’s position or location [1]. Positioning and geo-referencing explain how to locate the location. Improving the localization accuracy offered by different IoT devices is one of the most significant research issue nowadays, especially at hazardous and difficult-to-reach worksites with varying surroundings [2]. Localization is crucial for developing Internet of Things (IoT) solutions for smart cities that allow devices to be tracked or seen both inside and outside of buildings [3]. Global Positioning System (GPS) is commonly used for outdoor location applications [4]. However, GPS is not appropriate for inside localization services because of the significant and dense obstacles that come with structures as well as the increased power consumption [5]. The availability of location data is becoming a more and more necessary component for current communication infrastructure in order to provide location-based services. However, the GPS and mobile phone networks encounter their most serious problems in indoor environments and in scenarios with strong shadowing effects, when there is a disruption in satellite or mobile signal [6].
Therefore, in order to accurately estimate the location of the un-located node, further localization techniques need to be used [7]. Depending on how the required access points (APs) are deployed and covered, it is possible to distinguish between LOS (line of sight) and NLOS (non-line of sight) indoor deployment [8,9]. In such varied scenarios, the attenuation problem is determined by the amount, width, and type of barriers (such as walls). Because of this, while gathering data on distance indications, different fading spectrum circumstances should be considered [10]. In a theoretical range-based location model, in particular, RSSI may be used to correctly determine the distance among the anchor points and the present location, making it the most crucial indicator data for interior placement [11].
In order to lower the localization error rate, the obtained RSSI or comparable measure data should be processed more thoroughly and categorized rather than using the raw data influenced by numerous path effects, multiple nonlinear interference, and noises [12]. A signal’s amplitude or quality in relation to background noise is gauged by its SNR. It shows the relationship between the signal’s power and noise power and is commonly expressed in decibels (dB). In comparison to the noise, a greater SNR suggests a more powerful and distinct signal; a lower SNR indicates a weaker signal that is harder to identify from the noise.
SNR is a crucial component of communication, SNR values are gathered with RSSI values for every reference point. frequently, localization techniques take advantage of wireless network devices that were initially established for communication (LPWANs, for example) [13]. RSS-driven indoor localization is one of the easiest and most popular techniques available [14]. The RSS is a measurement of the real signal strength at the receiver and is commonly given in milliwatts (mW) or decibel-milliwatts (dBm) [15].
The path-loss propagation model and the RSSI are used to determine the distance between Tx and Rx using Eq. (2) [16].
When measuring the average RSSI at a distance of one meter between the sending and receiving nodes, A is the value that is linked to the radio circuits of the nodes. Gathering RSSI data at different ranges and using the least squares method to fit the parameters will allow us to develop a model of the RSSI distance [17].
The RSSI of wireless transmissions is used in RSSI-based fingerprinting, a localization technique, to determine a device’s whereabouts [18]. Using a set of reference locations, or “fingerprints,” inside the area, measurements are made to construct a database of RSSI collections for a specific place in RSSI-based fingerprinting [19]. The RSSI readings are obtained from a variety of wireless gadgets and access points, and these reference sites are usually selected to offer enough coverage of the area [20]. Using RSSI-based fingerprinting, a device detects the RSSI of the radio signals, it receives and compares it to the database’s reference fingerprints to determine its location [19].
The contributions that this research study made is to find the factors that lower prediction accuracy and highlight the limitations of indoor localization systems, establish a LoRa-based network using LoRa transmitters and receivers to gather RSSI data in a multi-story circular structure. In order to get around the multipath effect problem, SNR data is additionally evaluated against each RSSI value and MKNN has been used for localization in order to increase reference point prediction accuracy.
The rest of the paper is organized in this manner. A thorough analysis of the literature is provided in Section 2. The suggested approach is demonstrated in Section 3. A thorough explanation of the carried out examines is provided in Section 4. Ultimately, the conclusion is given in Section 5.
One essential component of the communication system is the use of wireless technologies for localization [21]. Many considerations, such as connectivity, technical specifications, power consumption, and energy needs, may affect the final design when choosing a wireless system for indoor localization [22]. The technology may evolve depending on how it is used. The study on wireless indoor localization techniques covered in this part.
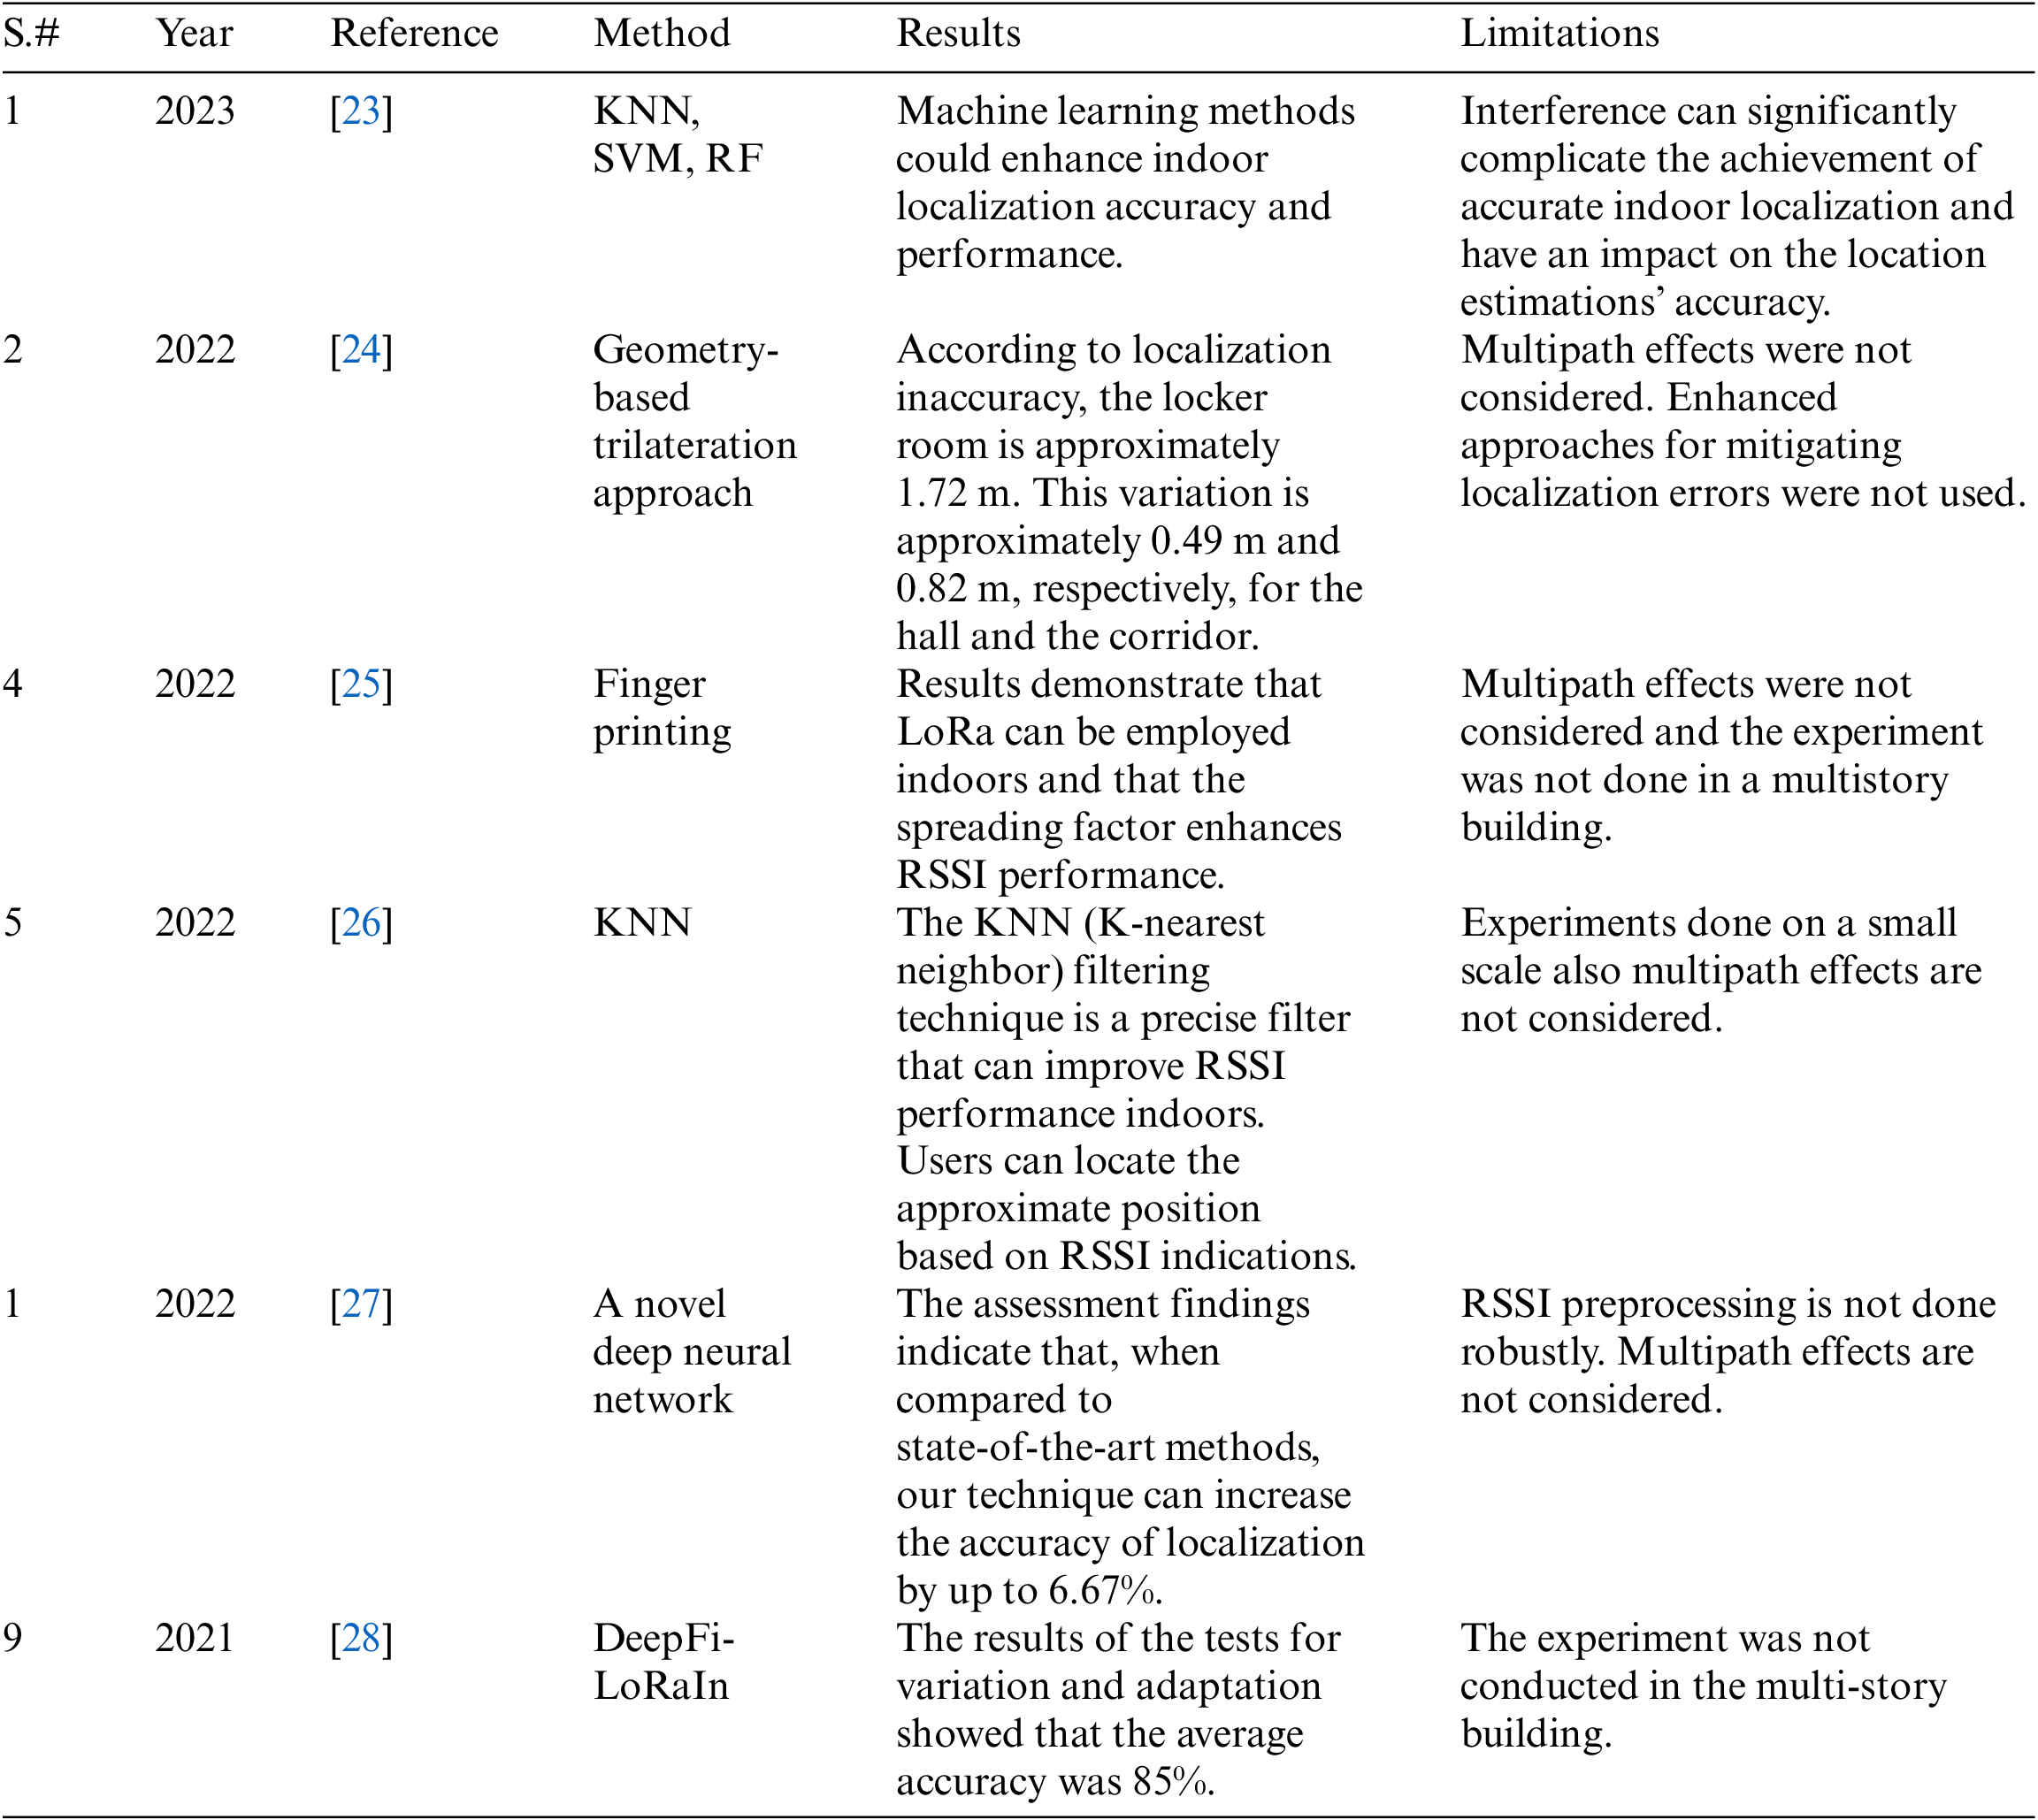
To improve accuracy and decrease variability, this study should concentrate on improving RSSI-based techniques [23]. Concurrently, there should be an attempt to create machine learning algorithms that are more optimized and efficient and particularly designed for indoor localization. Furthermore, research into the combination of several technologies and the creation of hybrid strategies may produce better outcomes. Through further exploration of these domains, scholars may propel the field of interior localization forward, facilitating the creation of more dependable, precise, and economical smart city solutions.
The focus of the author’s work in [24] is on LoRa technology and its application to license-free 2.4 GHz band RSSI-based inside localization. A simple measuring setup is proposed to measure and aggregate RSSI results. The trilateration concept states that the RSSI data are used to determine the location of an object. On-site experiments in relevant real-world scenarios demonstrate the great utility of the LPWA technology for disaster communication and localization, even beyond the particular context of mountain rescue and search. In multi-slope situations, RSS-based localization via body-UAV linkages remains problematic.
The RSSI measure in an indoor environment has been considered in this study [25]. The authors used 125 KHz of bandwidth, the 868 MHz frequency range, and the spreading factors SF7, SF9, and SF12. Then, we tried to measure RSSI in an indoor environment across a short distance in both LOS and NLOS scenarios using three spreading variables. The results of the experiment show that LoRa can be used indoors, and as a result, the spread factor improves the RSSI performance of this technology.
The development of an indoor navigation system based on LoRa is the main objective of this study [26]. While there are several methods for indoor localization, RSSI fingerprinting has several benefits when used to inside scenarios. Several LoRa nodes’ RSSI indicators are combined to create a fingerprint database. An Arduino Uno, a LoRa receiver, and LoRa modules were used to create a LoRa network in order to design a localization system for indoor location. Nevertheless, internal noise limits RSSI’s performance. The K-nearest neighbor (KNN) filtering method is an accurate filtering technique that can enhance RSSI performance indoors. KNN is the algorithm that is most frequently utilized in indoor positioning systems. Based on the RSSI indicators, users may determine the approximate position.
The authors of [27] have published a novel deep neural network-based localization strategy for LoRa-powered internet of things networks. The evaluation’s conclusions highlight the connection between the spread factor allocation and the localization system’s efficacy and show how, in comparison to state-of-the-art technologies, proposed method may boost localization accuracy by as much as 6.67%.
Differences in adjustments to the RSS measurement value at each location are caused by changes in environmental conditions that could correctly reflect the real environmental conditions. Features that alter the RSS readings in each position improve the training process. Extensive experiments have shown that the deep learning method can precisely anticipate changes in indoor environmental conditions. There is limited possibility of a significant change in the RSS values during the training and prediction phases since the RSS LoRa fingerprint characteristic in an interior situation is often more robust to environmental changes [28].
For this study, a review of the literature was conducted with an emphasis on localization across different LPWAN technologies. This significant amount of research has taught us many things about indoor localization errors and their causes. Most importantly, it has been determined which factors lead to localization inaccuracy. Because every article in the literature is intimately related to this research study.
The study design, experimental setting, data collecting process, and data analysis procedures have all been thoroughly presented. Including and explaining the structures of data analysis methodologies.
The goal of this study is to finding and locating a machine is a very important problem. This work focuses on using an optimized machine learning-based technique to increase the position prediction accuracy over the LoRa network.
An experiment on the LoRa network was conducted for this study. For the experiment, one LoRa transmitter and four LoRa receivers are used. The Institute of Business Management’s College of Computer Science & Information Systems Building served as the site for data collection. The data collection building is shaped like a circle. However, initially a comprehensive review of the existing literature on localization from various LPWAN technologies was conducted. Fig. 1 presents the research framework.
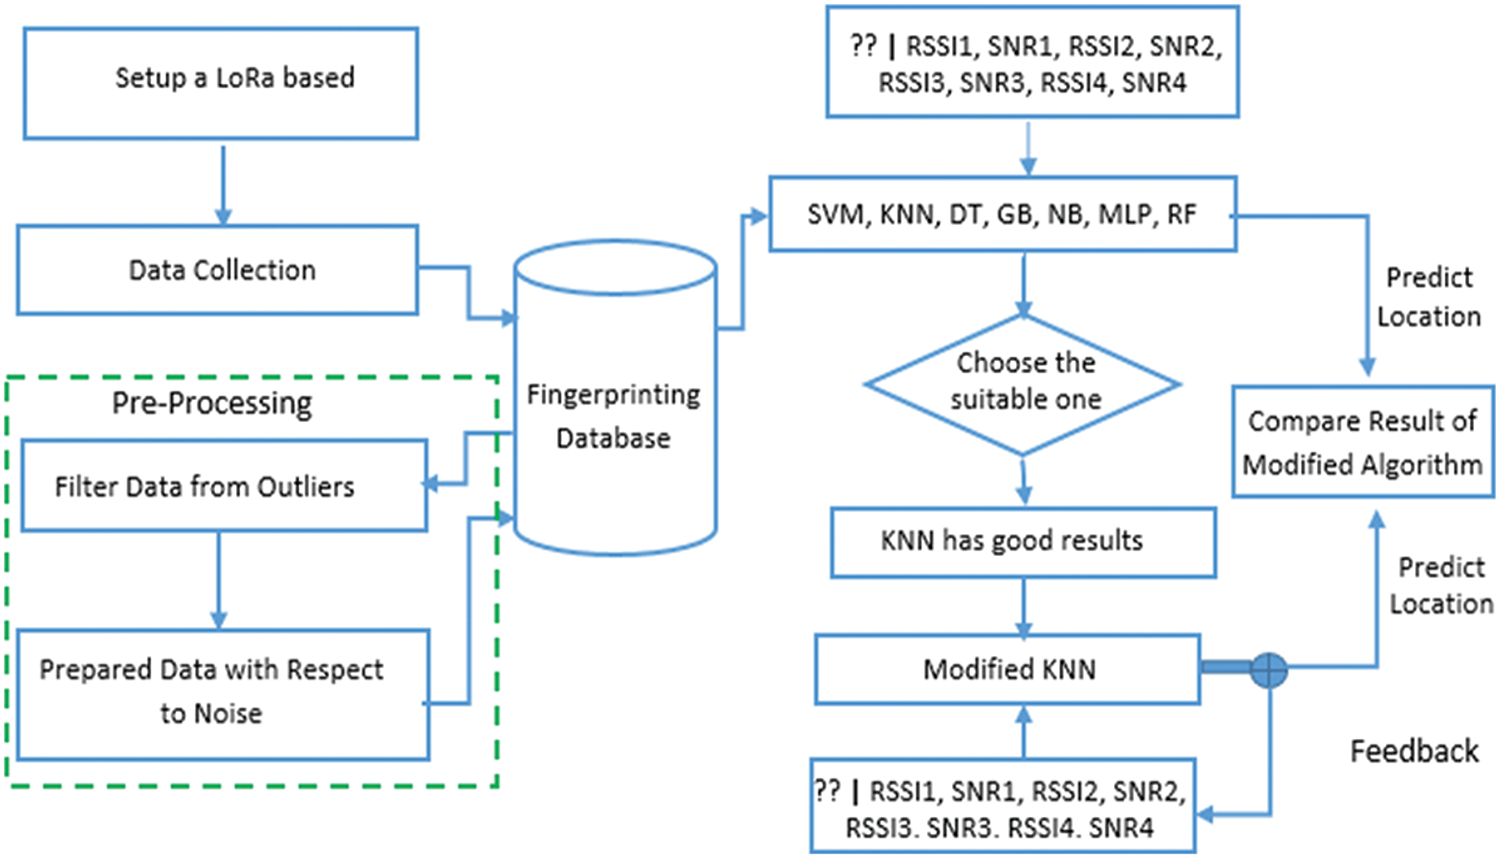
Figure 1: Research framework
Fig. 1 initially established a LoRa-based network for the experiment, after that, data was collected from 35 different reference points and through preprocessing outlier were removed from the data. After that, data was prepared according to noise value and approaches of machine learning were used on data and one approach which has a good result were selected for optimization. Finally, the results of optimized approach were compared with other approaches.
3.2 Experimental Setup and Data Collection
A LoRa-based network was established for the experiment, as seen in Fig. 2. LoRa technology facilitates the formation of transmitter and receiver networks and the collection of data. Two floors (2nd & 3rd) and four distinct labs (labs 6, 7, 8, & 10) were selected for data collecting. Four LoRA receivers (Rx1, Rx2, Rx3, and Rx4), which are located in labs 7, 10, 6, and 8, respectively, and one LoRA transmitter, which is positioned on 35 distinct reference points (xy), one by one between lobbies and staircases, are used to gather data. One meter separates the two reference locations from one another.
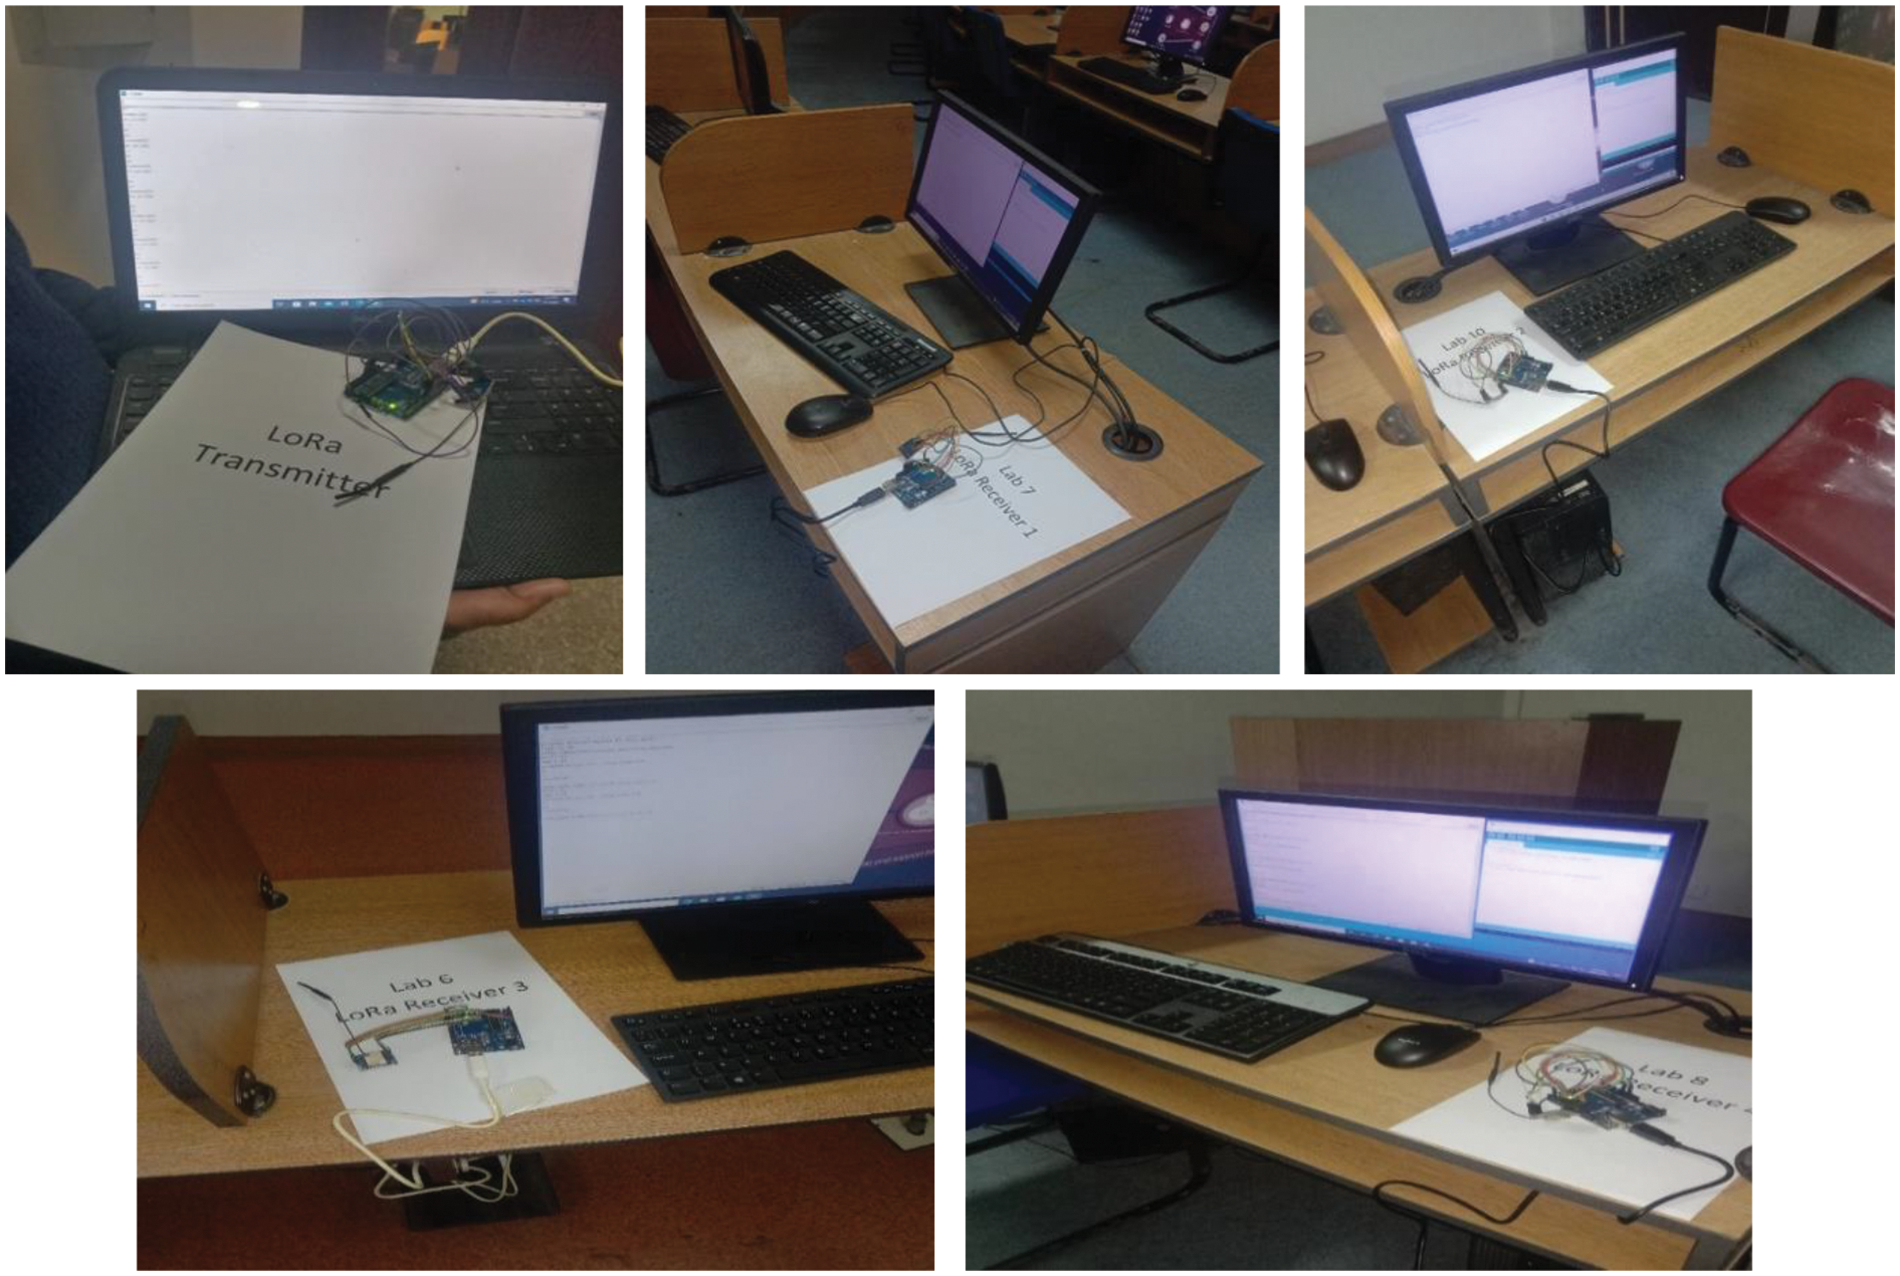
Figure 2: LoRa network (LoRa transmitter and LoRa receivers)
Thirty-five reference locations provide data, and from each reference point, fifteen RSSI values are obtained. 5 attributes (Rx1, Rx2, Rx3, Rx4, & xy) are included in the 525 instance dataset. The reference point is represented by xy, while the LoRA receiver is denoted by Rx. xy represents each reference point, such as x1y1, x2y2, x3y3, and so forth. While the transmitter was going up and down stairs and between reference points in the hallways, data was being captured. Ra-02 SX1278 the LoRa module has a 12 spread factor and operates at 433 MHz as a transmitter and receiver. The Arduino UNO Module utilized the LoRa module. Following the configuration of a LoRa-based network, LoRa receivers were used to gather data. As was previously indicated, a LoRa transmitter was moved one meter at a time between reference points in a multi-story, circular structure, as well as up and down stairs.
3.3 Remove Outliers from Collected Data
Data points that are very dispersed from the bulk of the other data points in a dataset are called outliers. In this study the threshold for outliers are the values less than −50 and the values more than −120 are considered as outliers. They have a big impact on how well machine learning models perform. Researchers manually eliminate anomalies from the fingerprinting database. As was already said, a fingerprinting database contains all of the acquired data. Only fifteen RSSI values out of all the values gathered from a single reference point (xy) are taken into consideration by the researcher during the preprocessing step. The foundation for evaluating RSSI results is comparable and nearly similar values; values that are not similar and closely similar are regarded as outliers. Data was gathered from 35 distinct reference points (xy), and only 15 comparable and closely comparable values were taken into account for the fingerprinting database after eliminating outliers.
3.4 Collection of Noise Values
Since SNR is a crucial component of communication, SNR values are gathered with RSSI values for every reference point. SNR levels are evaluated using comparable and nearly comparable values; those that are not comparable or closely comparable are not taken into account. For the fingerprinting database, only fifteen comparable or very comparable values are taken into account for each reference location. Increasing the SNR values is done to increase prediction accuracy.
One of our study goals is accomplished after the dataset has been prepared with regard to the noise component. Several ML-based methods for localization prediction and classification were used in this study. SVM, RF, KNN, DT, NB, GB, and MLP were among the classifiers utilized to complete the localization classification and prediction.
3.5 Approaches for Data Analysis
In this research, various ML-based approaches to localization classification and localization prediction were employed. Several classifiers (SVM, RF, KNN, DT, NB, GB, and MLP) were used to accomplish localization classification and prediction. All classifiers have been used to train data in 80/20 and 70/30 training ratios and gather results. Accuracy, Recall, Precision, and F1-score could all be measured. Finally as per the research frame work, the algorithm which have good results was chosen for optimization.
The aforementioned classification models were thoroughly assessed on the RSSI-SNR dataset, looking at many factors like accuracy, precision, recall, F1-score, 5 fold cross-validation, and training and testing timeframes. The results show that, out of all the machine learning techniques included in this study, KNN is the most advantageous algorithm.
The KNN approach is not very accurate and has a position prediction inaccuracy. This research intends to solve the localization problem by attaining excellent accuracy with minimal mistakes in position prediction. It is vital to adjust the algorithm parameters in order to increase the algorithm’s accuracy and reduce position prediction mistakes while employing KNN. This work modified the existing KNN algorithm and adjusted its parameters.
The block diagram of the modified KNN classifier is shown in Fig. 3. The classifier’s many parameters are set to achieve high accuracy and minimal position prediction error. The KNN method’s k parameter, as seen in the block diagram, indicates how many neighbors will be looked at in order to classify a certain query point. If the instance is the closest neighbor, it will be assigned to a related class. When determining k, it is necessary to take into account a range of values to prevent either overfitting or underfitting. The K-D tree, also known as the k-dimensional tree, is a data structure that is used to organize multidimensional data. It is particularly useful for efficient closest neighbor searches in multidimensional areas. Because it can split the data space into more manageable pieces along each dimension, the “K-D Tree” got its name. In order to do a closest neighbor search or other queries in a k-d tree, the technique begins at the root and recursively traverses the tree, selecting the appropriate subtree based on the split dimension and split value.
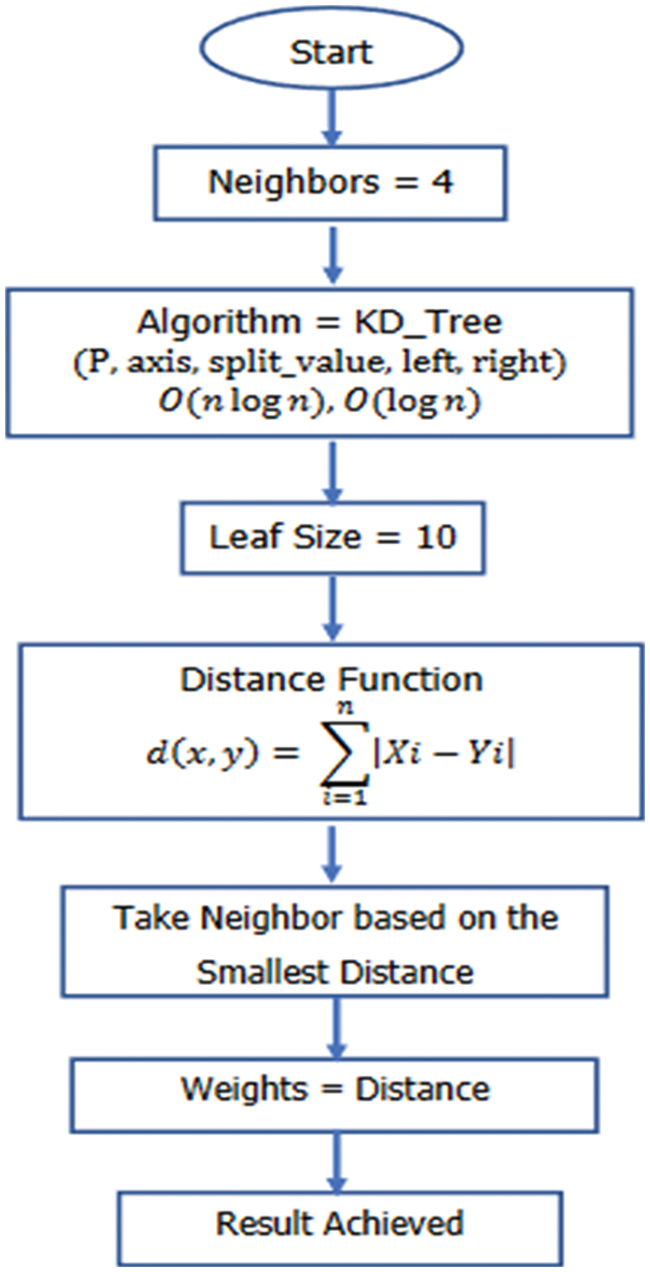
Figure 3: Block diagram of modified KNN
The Manhattan distance function is the distance function utilized in the modified KNN to determine the distance between neighbors. The distance between two locations on a grid-like path, such as a city grid, is determined using the Manhattan distance. The term “Manhattan distance” refers to the approximate distance a taxi would travel in Manhattan, New York City, given its grid-like street arrangement. The Manhattan distance between two points (x1, y1) and (x2, y2) in a two-dimensional space is calculated as follows:
To find the absolute differences between the two sites, the related dimensions across each axis (x and y) are first determined. The horizontal and vertical distances are then given to you. The following step then involves adding the absolute variances from step 1. This figure indicates the total “distance” in grid units, much how a taxi would travel a grid of city streets. Taking into account your K-nearest neighbour, computed using Manhattan’s distance.
The improved KNN algorithm uses the distance weights approach. Use distance-weighted weights when you believe that nearby neighbors should have a bigger impact on the anticipated result because they are most likely closer to the query location. This might be helpful if you expect data discrepancies to make near neighbors less significant. The “weights” option determines the weighting of neighboring distances when predicting values for a query location.
This section presents the data evaluation that was conducted on data collected from LoRa technology testing. This section contains graphical representations of the confusion matrix and bar chart plot in addition to prediction results using RF, KNN, DT, NB, GB, MLP, and SVM. This article also explains the modified KNN results, the core methodology of this study.
Results have been obtained by training data in 80/20 and 70/30 training ratios using all classifiers. The reference point categorization using the 80/20 and 5 fold cross-validation is displayed in Table 1. This table shows each model’s accuracy, F1-score, precision, recall, training, and testing timeframes.
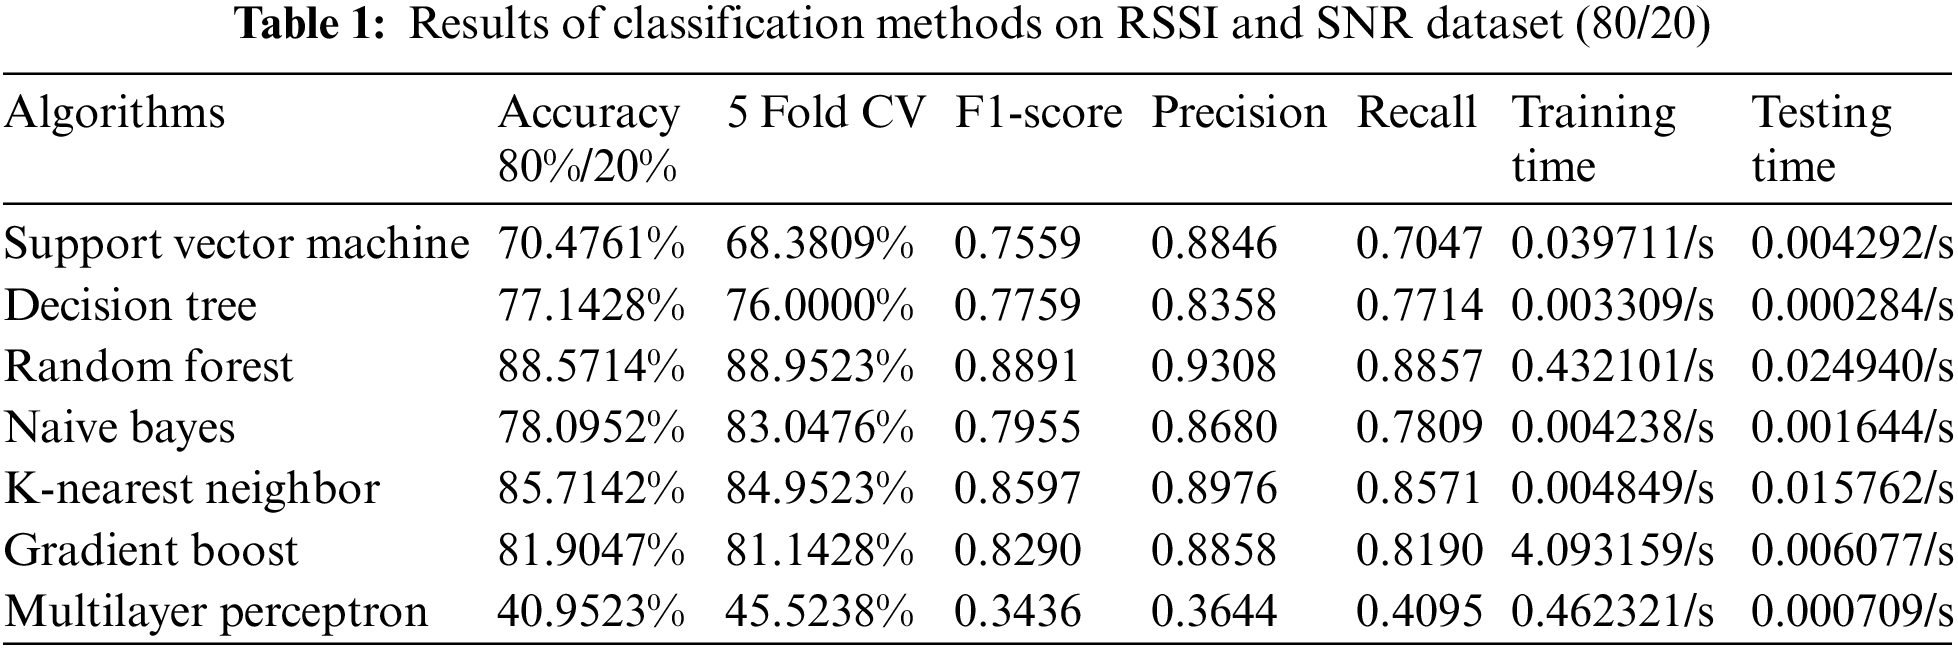
The classification findings for the RSSI and the SNR data with an 80/20 ratio are shown in Fig. 4. With 88.5714% accuracy, the random forest model is the most accurate, followed by KNN (85.7142%).
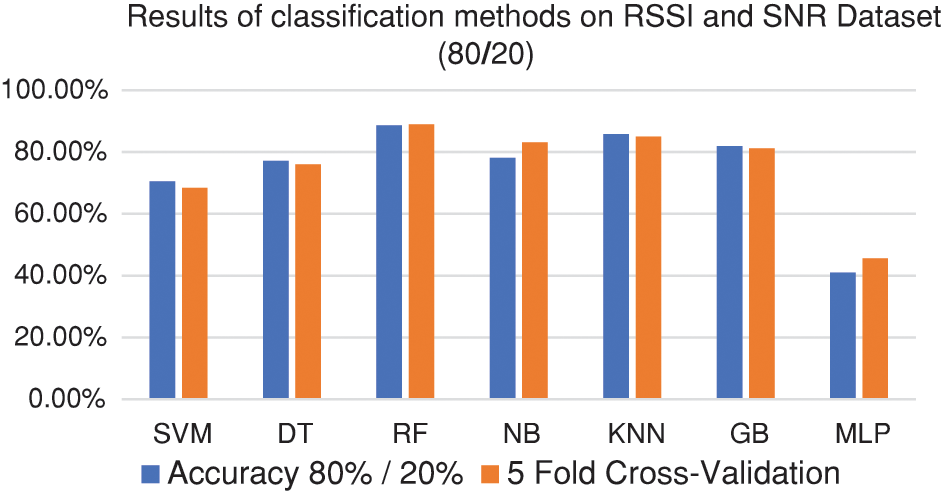
Figure 4: Accuracy comparison of training and cross validation result
The random forest model, with an accuracy of 88.9523%, outperforms the other classifiers using five-fold cross-validation, KNN (84.9523%), and NB 83.0476%. The random forest model takes longer to train and test because to its complexity, even if it has the best accuracy.
Fig. 5 shows that the RF classifier has the highest F1-score of 0.8891. The KNN, GB, and NB classifiers have F1 ratings of 0.8597, 0.8209, and 0.7955, respectively, after the RF classifier. The RF classifier has the highest precision, 0.9308, followed by 0.8976, 0.8858, 0.8846, 0.8680, and 0.8358 for KNN, GB, SVM, NB, and DT, in that order. The maximum RF recall of 0.8857 is shown in Fig. 5. The RF classifier was followed by KNN, GB, NB, DT, and SVM, with recall scores of 0.8571, 0.8190, 0.7809, 0.7714, and 0.7047, in that order.
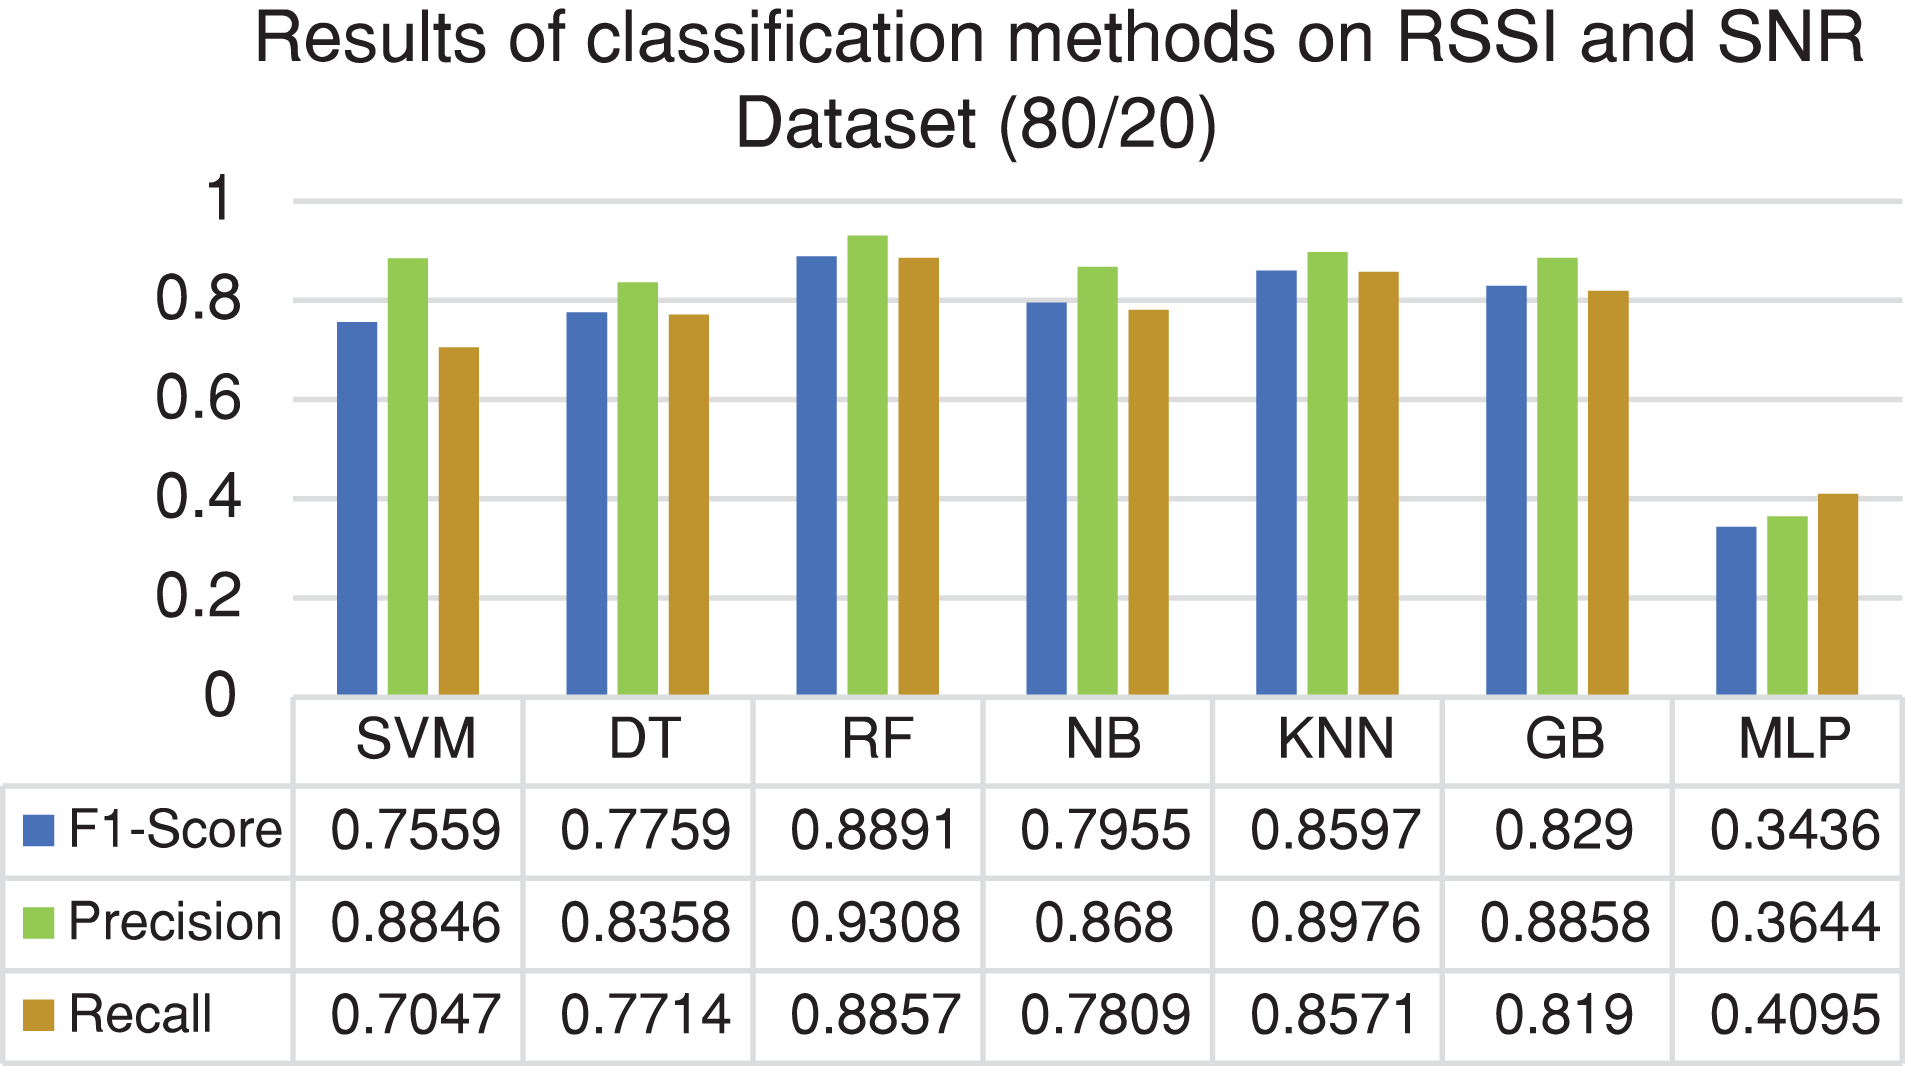
Figure 5: Comparison of F1-score, precision and recall of different classifiers
As Fig. 6 illustrates, the Random Forest model takes longer to train than the KNN classifier. The Random Forest technique is less suitable overall for the current needs because to the significant training time gap between the two models.
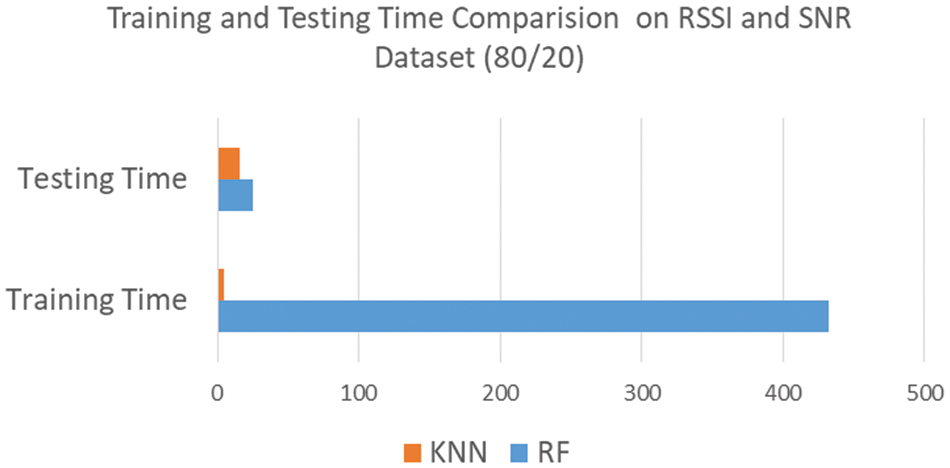
Figure 6: Training and testing time comparison of classifiers
The outcomes of reference point classification using a 5 fold cross-validation and a 70/30 split on the RSSI and SNR dataset are shown in Table 2.
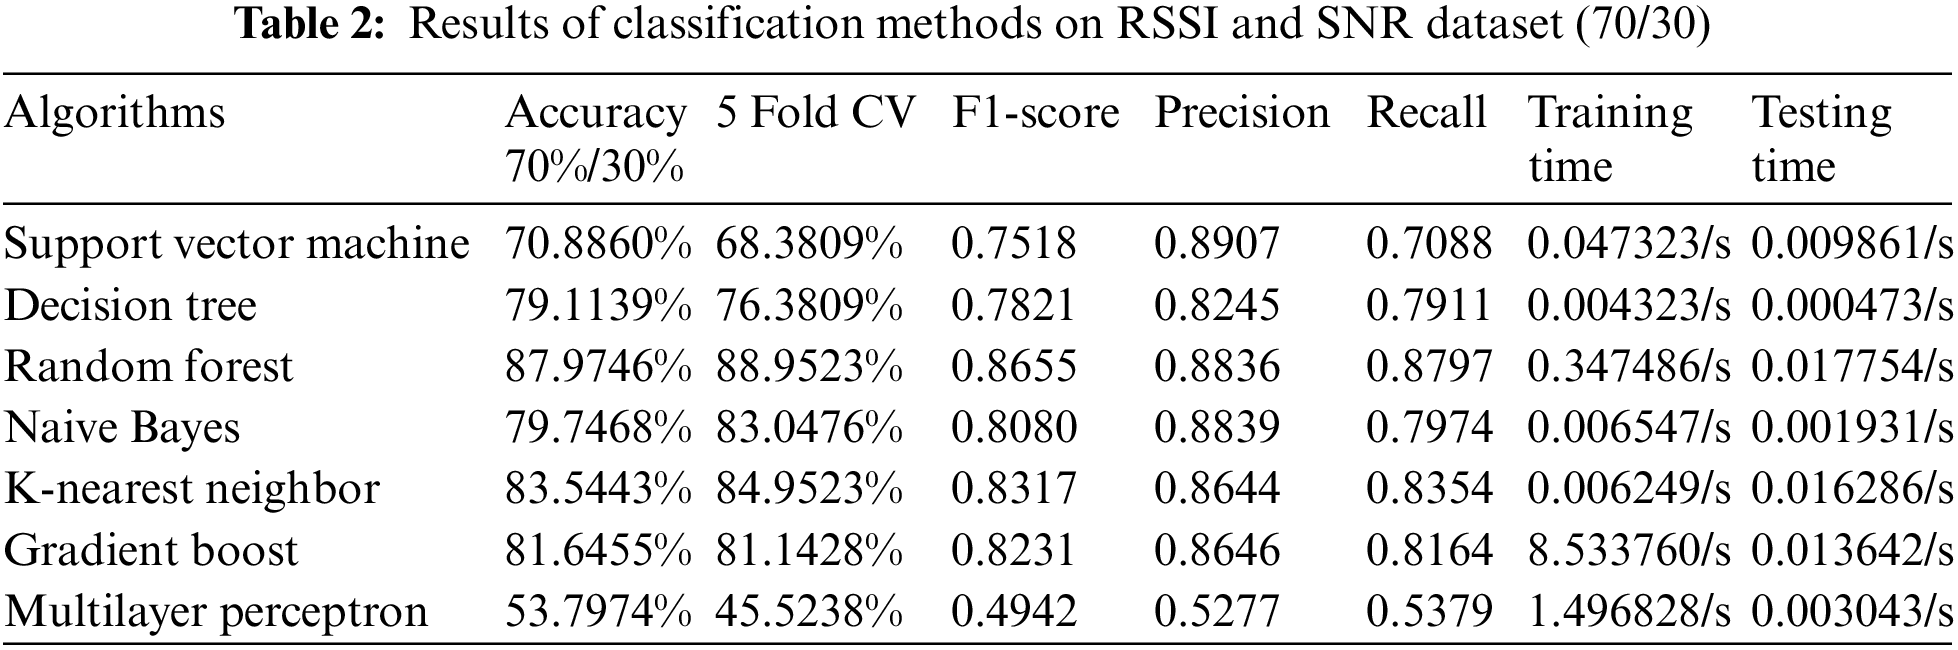
With a score of 87.9746%, the Random Forest (RF) model has the highest accuracy. Fig. 7 displays the outcomes of models applied to the RSSI and SNR data using a 70/30 data split. In terms of accuracy, the KNN, GB, NB, and DT models achieve accuracy rates of 83.5443%, 81.6455%, 79.7468%, and 79.1139%, respectively, behind RF.
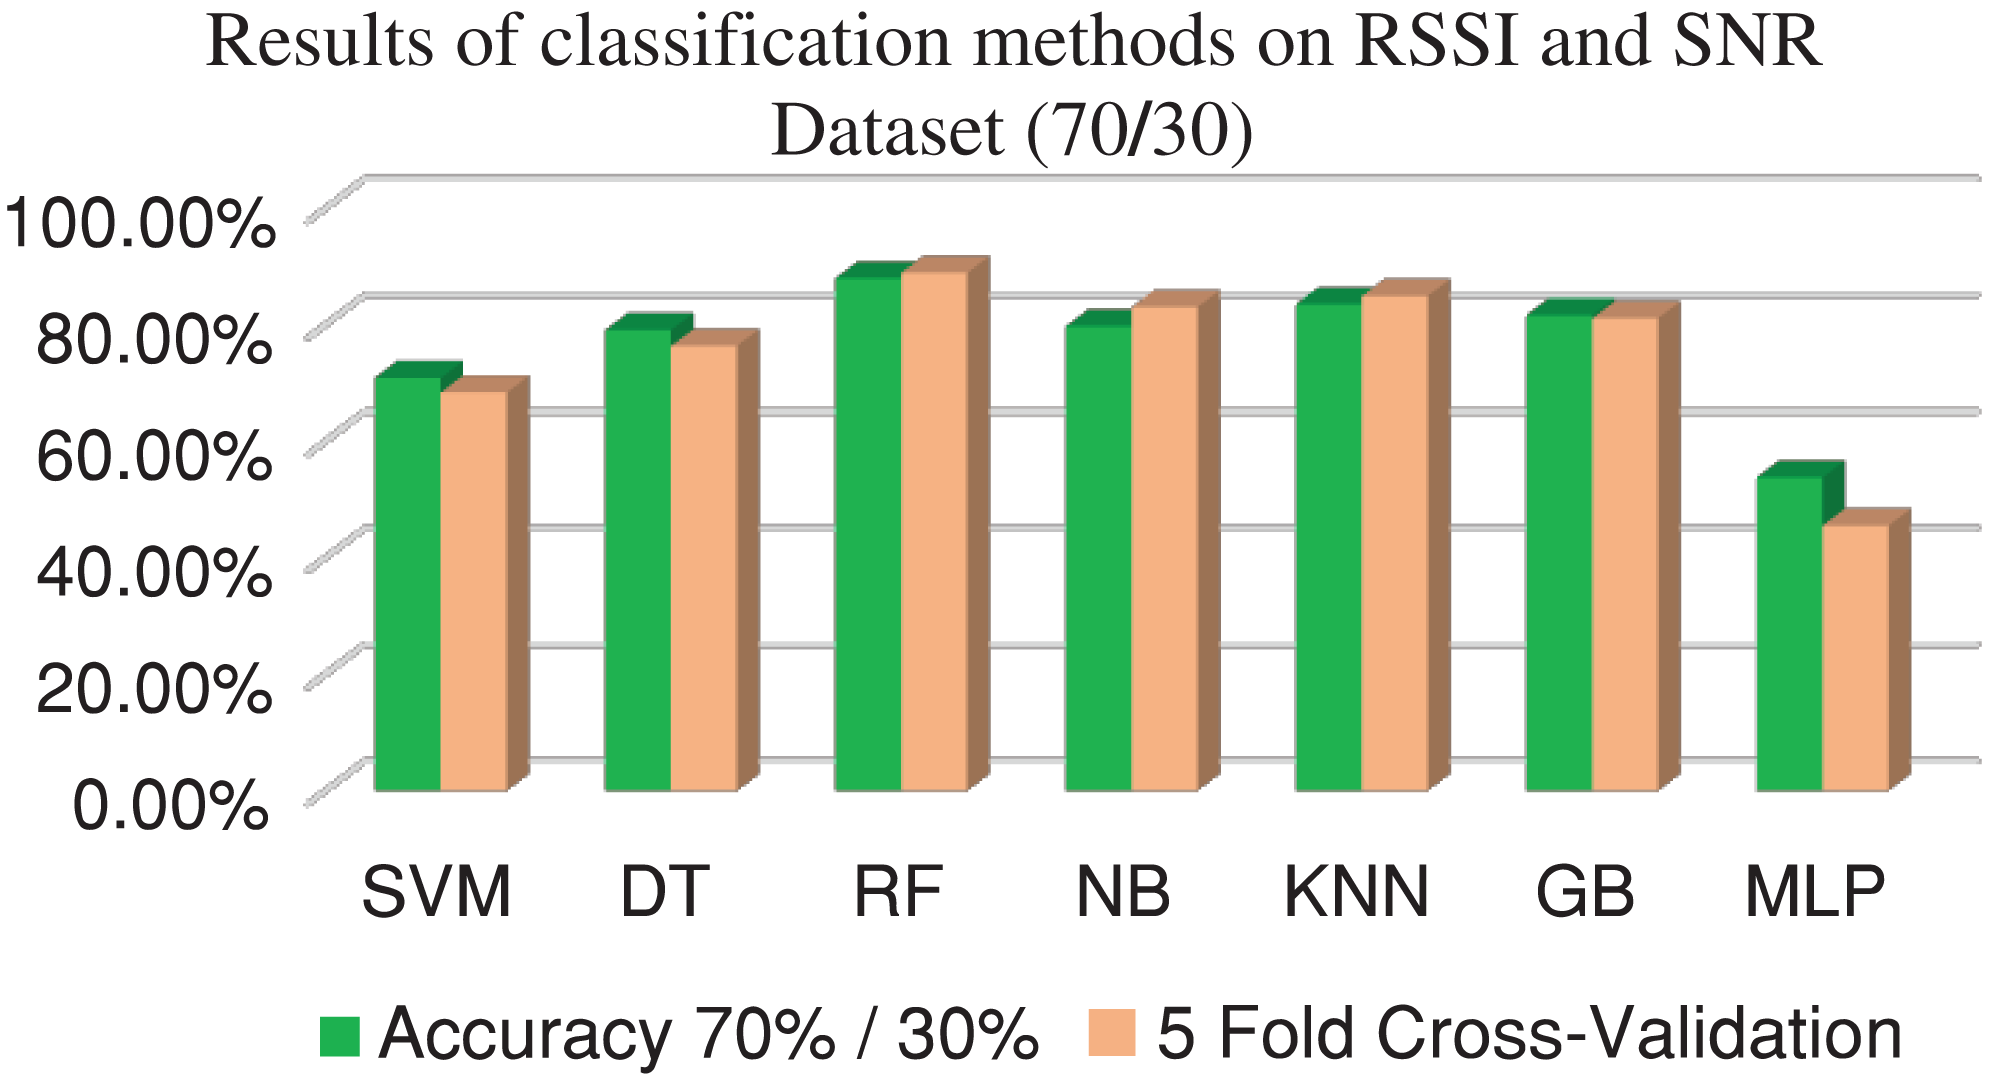
Figure 7: Training and testing time comparison of classifiers
The Random Forest method is the most accurate model in terms of classification accuracy, with a rate of 88.9523%. The accuracy ratings of the KNN and NB models are 84.9523% and 83.0476%, respectively, placing them in second and third place. Within the context of cross-validation, a number of accuracy measures shed insight on how different classifiers perform in comparison to one another.
As can be seen in Fig. 8, the RF classifier has the highest F1-score (0.8655). Closely trailing with F1-scores of 0.8317, 0.8231, and 0.8080, respectively, are the KNN, GB, and NB classifiers. Within the context of the precision metric, the SVM classifier gets the greatest precision outcome of 0.8907. Following closely behind with accuracy ratings of 0.8839, 0.8836, 0.8646, 0.8644, and 0.8245, respectively, are the NB, RF, GB, KNN, and DT classifiers. With a recall score of 0.8797, the RF classification method has the highest recall, as seen in Fig. 8. Recall values for KNN, GB, NB, DT, and SVM are decreasing and are respectively 0.8354, 0.8164, 0.7974, 0.7911, and 0.7088.
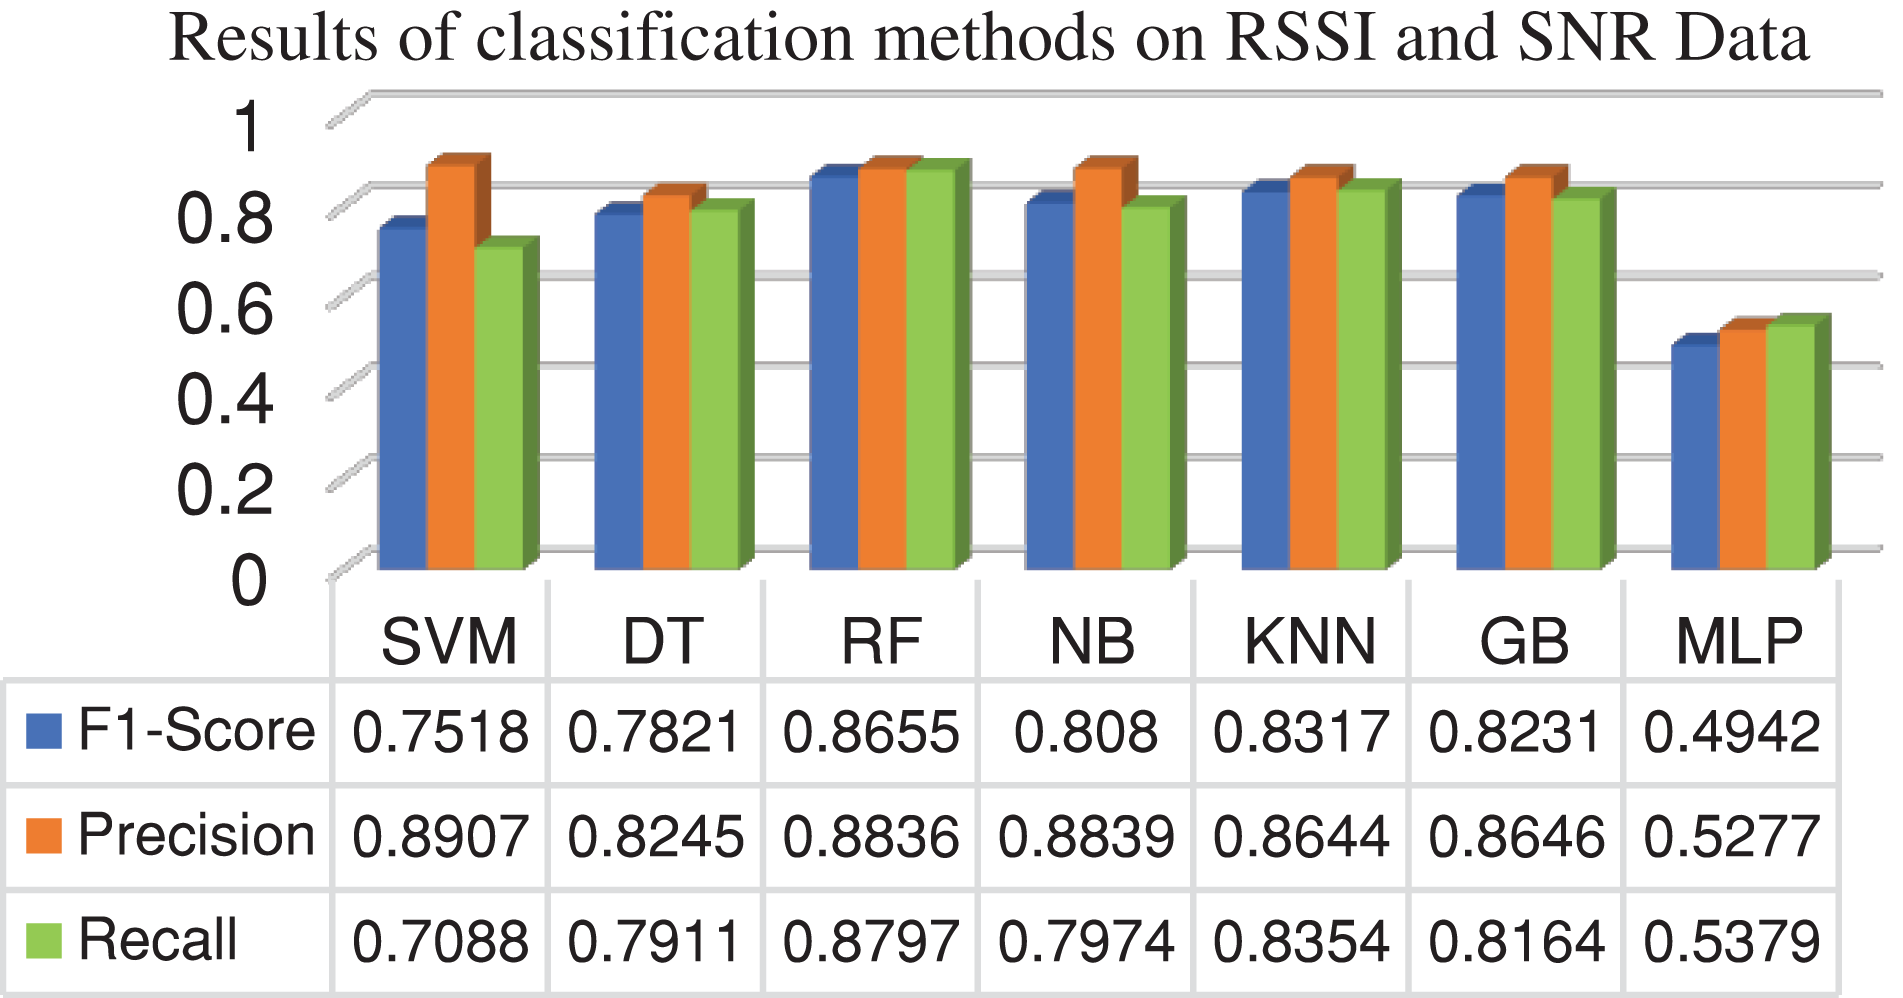
Figure 8: Comparison of F1-score, precision and recall of different classifiers
The amount of extra training time required for the RF model compared to the KNN classifier is seen in Fig. 9, the time is in millisecond. Currently, the RF classifier is less appropriate for the goal overall because of the significant training time discrepancies between the two models.
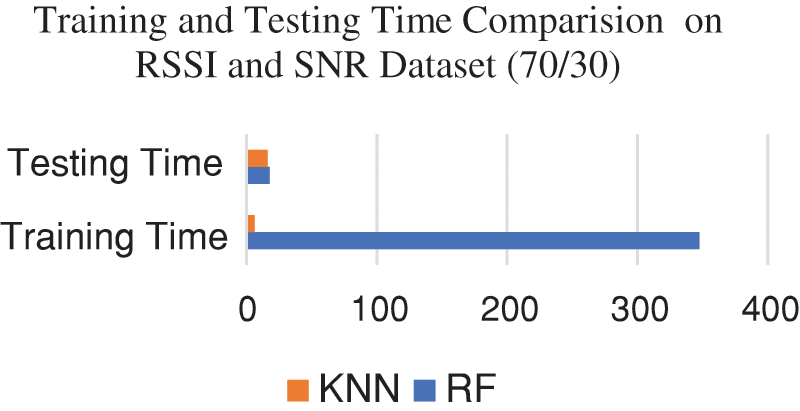
Figure 9: Training and testing time comparison of classifiers
The multi-floor circular building dataset that has been acquired has been used to conduct a thorough study of the training, testing, and validation outcomes, as seen in Fig. 10. The training, testing, and validation accuracy of the KNN, DT, RF, NB, SVM, GB, and MLP algorithms are compared shown in Fig. 10. The KNN and RF algorithms exhibit remarkable accuracy throughout the training, validation, and testing phases.
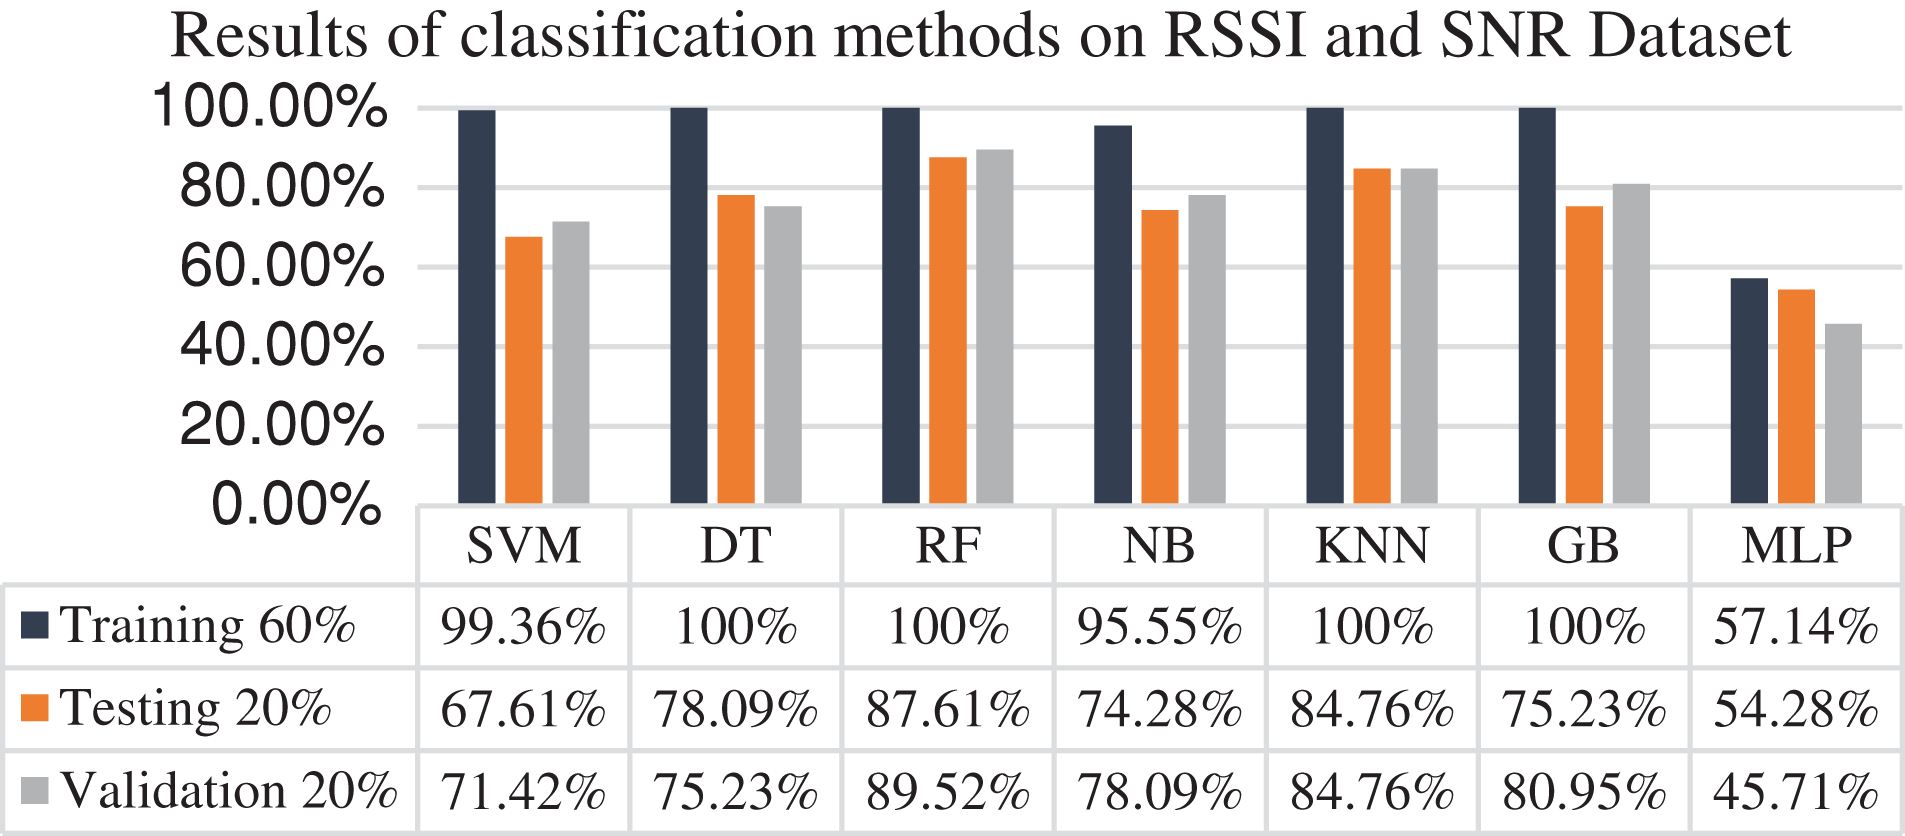
Figure 10: Comparison of classifier’s training, testing and validation accuracy
Based on the findings from our multi-floor circular building dataset, the KNN classifier seems to be the best choice overall, particularly considering its better performance in terms of training and testing time.
4.1 Comparative Analysis of Used Classification Models
The usefulness of various classification techniques was carefully examined by the authors, who also looked at the models’ F1-score, precision, recall, training, and testing times, and the correctness of the models’ five-fold cross-validation and testing outcomes. The results, which are shown in Fig. 11, clearly identify RF as the most accurate algorithm; nevertheless, KNN, which comes in second to RF in terms of accuracy, is more advantageous since it requires less time for testing and training.
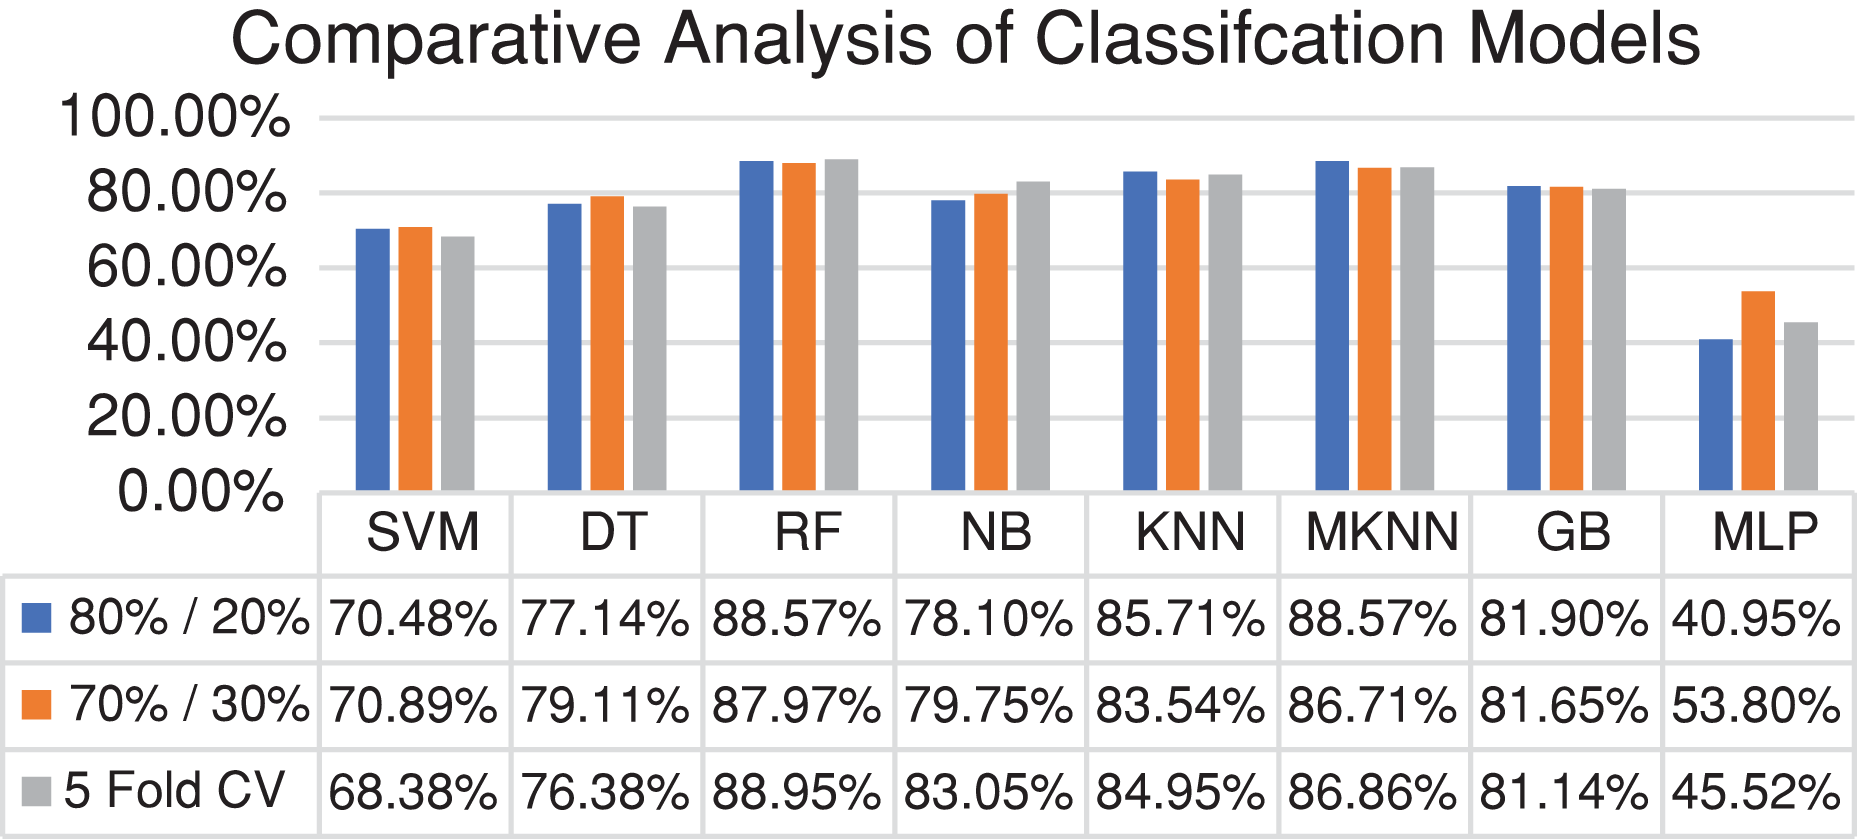
Figure 11: Comparative analysis of models with respect to accuracy
However, the findings also indicate that KNN exhibits better training performance in contrast to the RF model. Fig. 12 illustrates the considerable difference in training time between RF and KNN, which accounts for KNN’s superior performance over RF on the RSSI-SNR dataset.
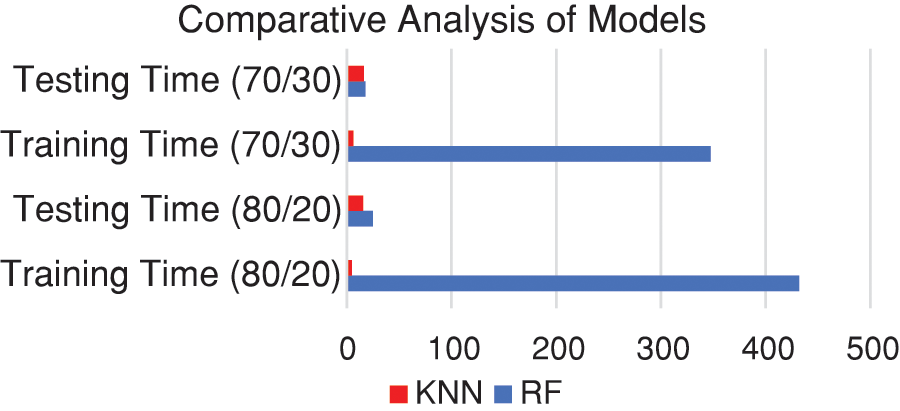
Figure 12: Comparative analysis with respect to training and testing time
The aforementioned classification models were thoroughly assessed on the RSSI-SNR dataset, looking at many factors like accuracy, precision, recall, F1-score, 5 fold cross-validation, and training and testing timeframes. The results show that, out of all the machine learning techniques included in this study, KNN is the most advantageous algorithm.
4.2 Results Analysis of Modified KNN
On the RSSI-SNR dataset, reference point prediction is carried out using a modified KNN technique. The models reviewed above, the modified KNN model earned the best accuracy of 88.57% in an 80/20 split with regard to training and testing time; Table 3 shows that 86.85% accuracy was obtained by 5 fold cross-validation.
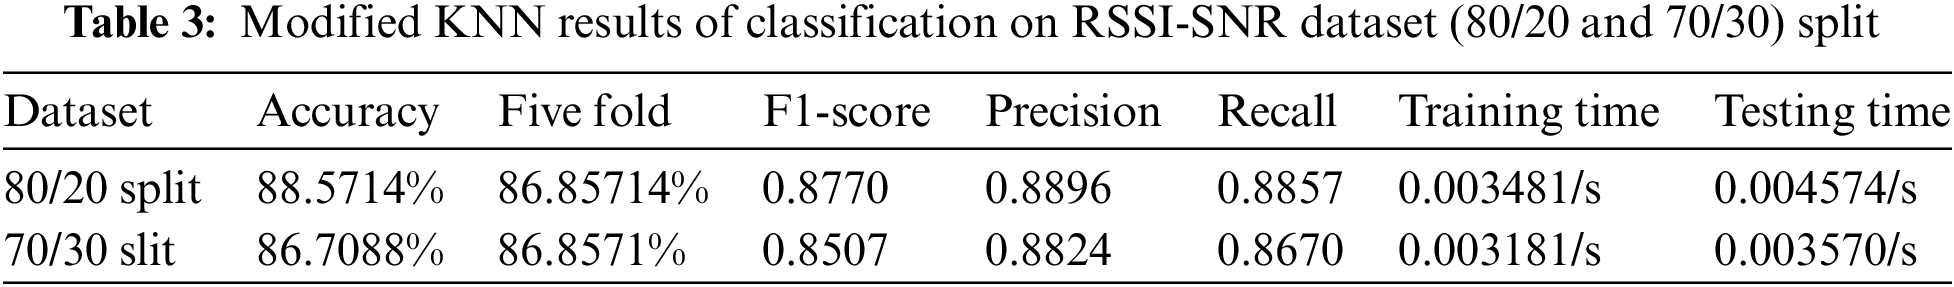
Fig. 13 shows the confusion matrix for the updated KNN 80/20 split. Fig. 14 displays the accuracy of 86.7080% on a 70/30 split confusion matrix. Table 3 also displays the F1-score, precision, recall training, and testing duration. The best algorithm that offers high accuracy with less training time is found to be modified KNN.
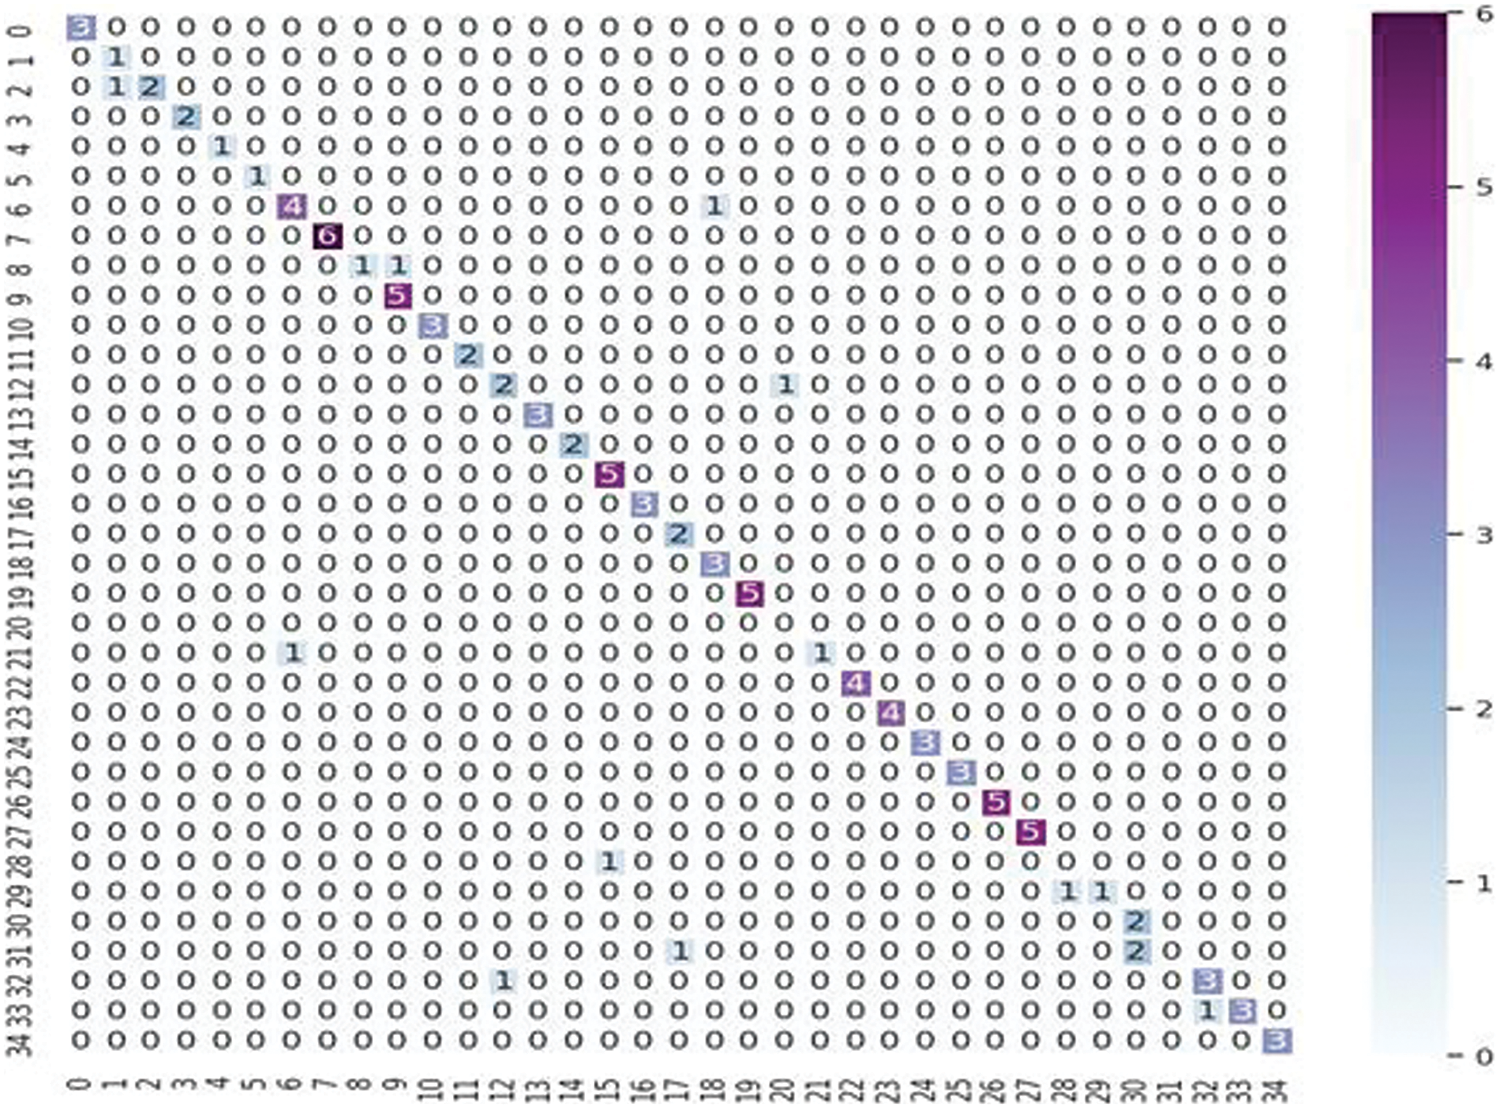
Figure 13: Confusion matrix of MKNN showing accuracy in reference point prediction on 80/20
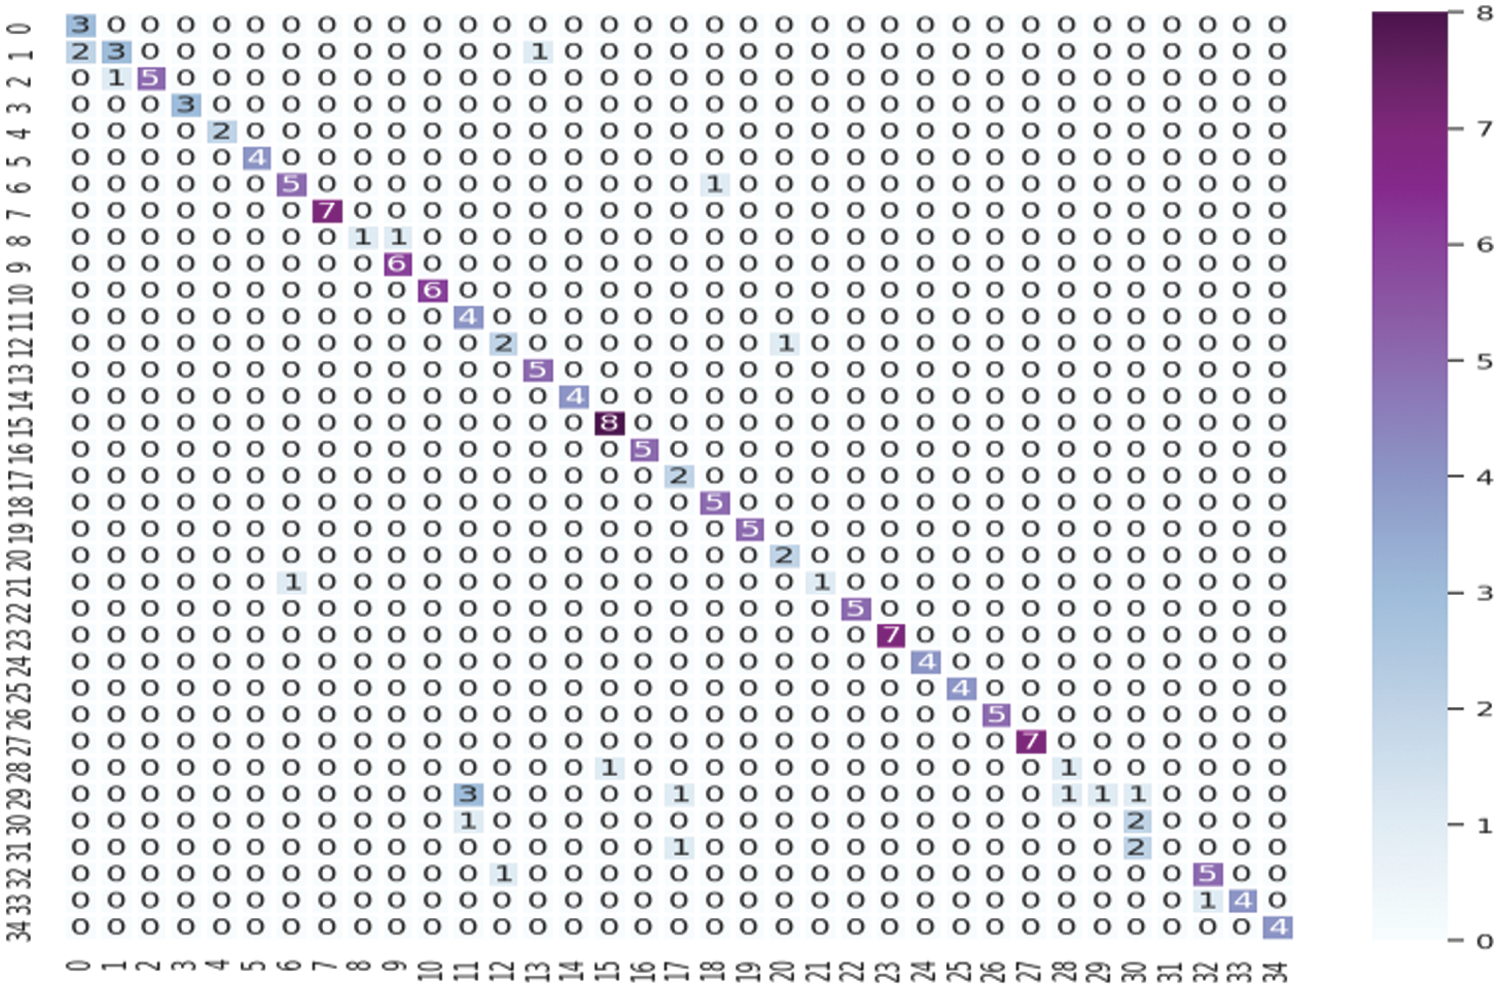
Figure 14: Confusion matrix of MKNN showing accuracy in reference point prediction on 70/30
4.3 Comparative Analysis of Modified KNN Model
Both an 80/20 and a 70/30 data split produced comprehensive findings when these techniques were applied to the RSSI-SNR dataset; these are provided in Tables 1 and 2. The findings demonstrate that KNN is superior to every other machine learning strategy used in this investigation. Consequently, the KNN method is improved in this study to increase the accuracy of reference point prediction. In comparison to the previously stated models, the modified KNN model showed high accuracy, scoring 88.57% in the 80/20 split and 86.7088% in the 70/30 split. Table 3 shows that the modified KNN model also earned 86.85% accuracy during 5 fold cross-validation.
Fig. 15 illustrates how our suggested methodology increases reference point prediction accuracy and achieves good accuracy. As demonstrated, the suggested method outperforms KNN in terms of accuracy in 80/20, 70/30 split, and 5 fold.
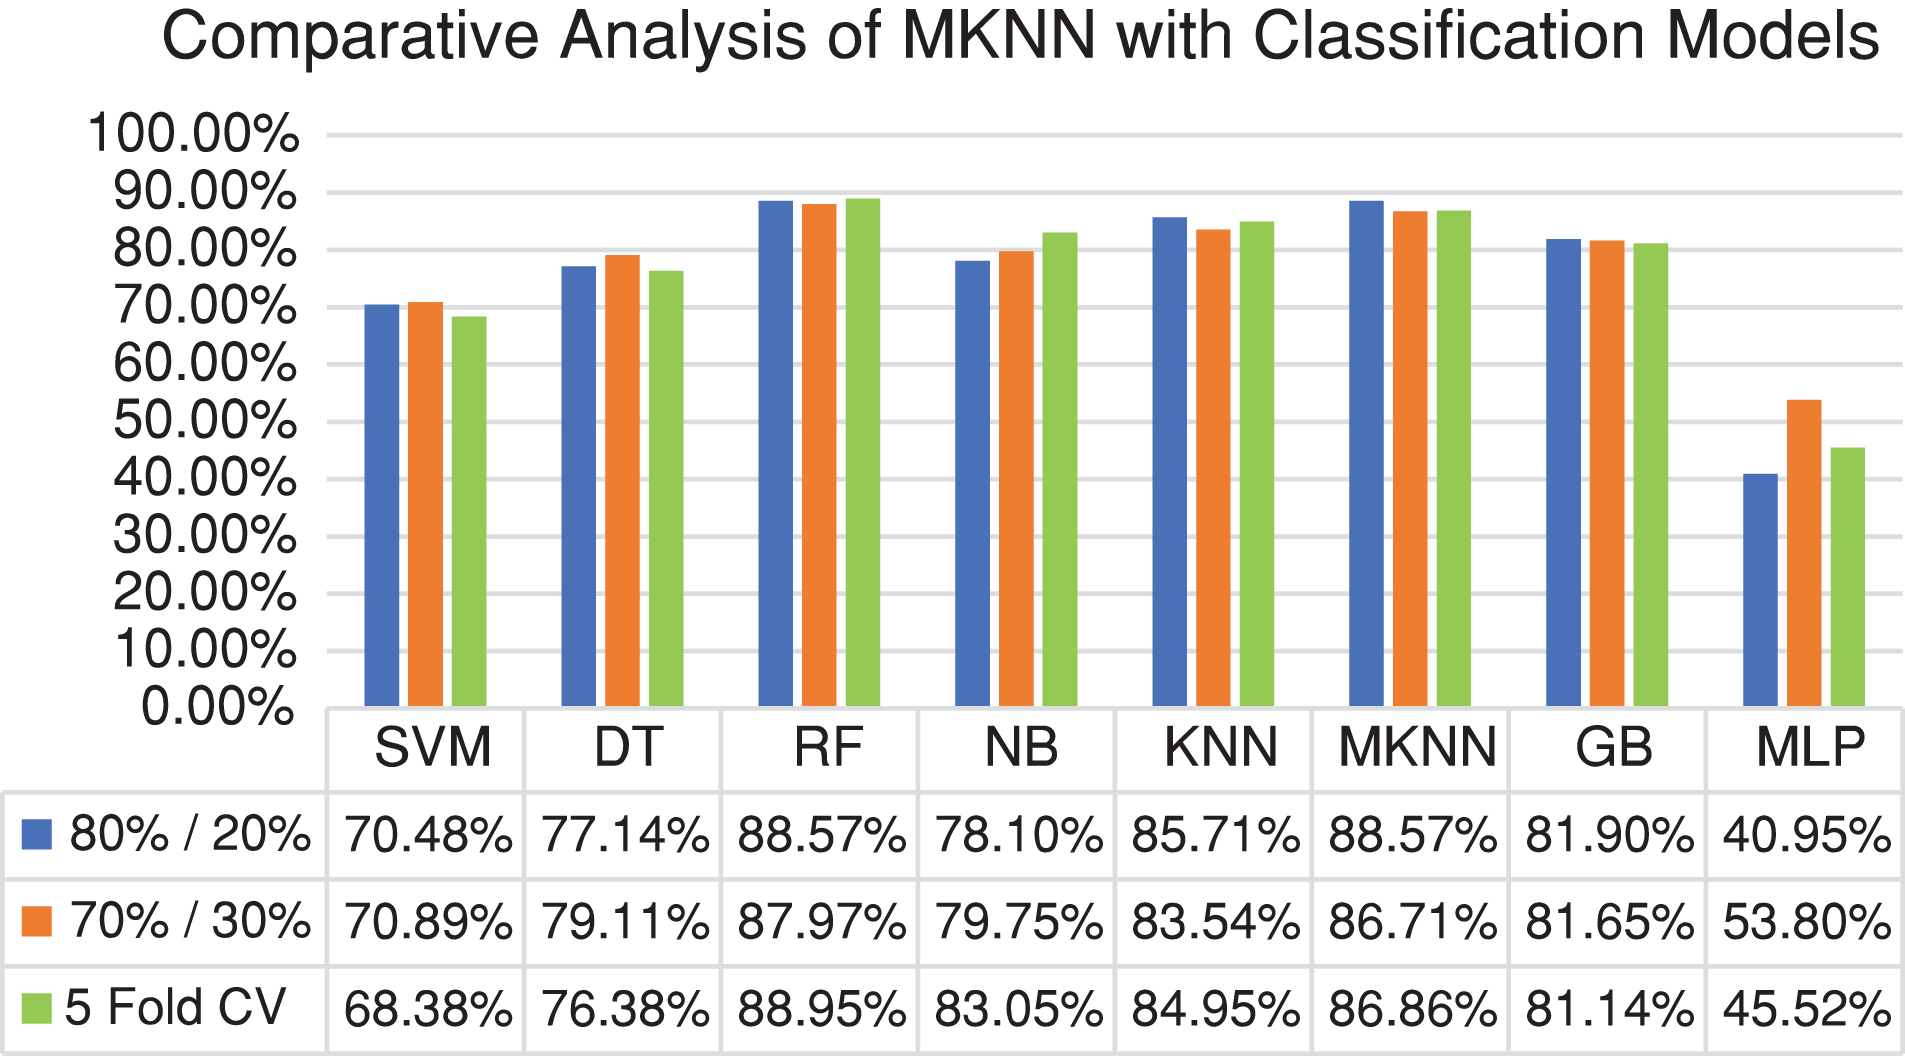
Figure 15: Comparative analysis of modified KNN with respect to accuracy
In terms of training and testing time (millisecond) modified KNN outperformed KNN in both 80/20 and 70/30 split, as Fig. 16 illustrates. It demonstrates that the modified KNN algorithm complexity is also good. As a result, the study demonstrates that the modified KNN performs better in terms of accuracy and model complexity than the other classifiers examined.
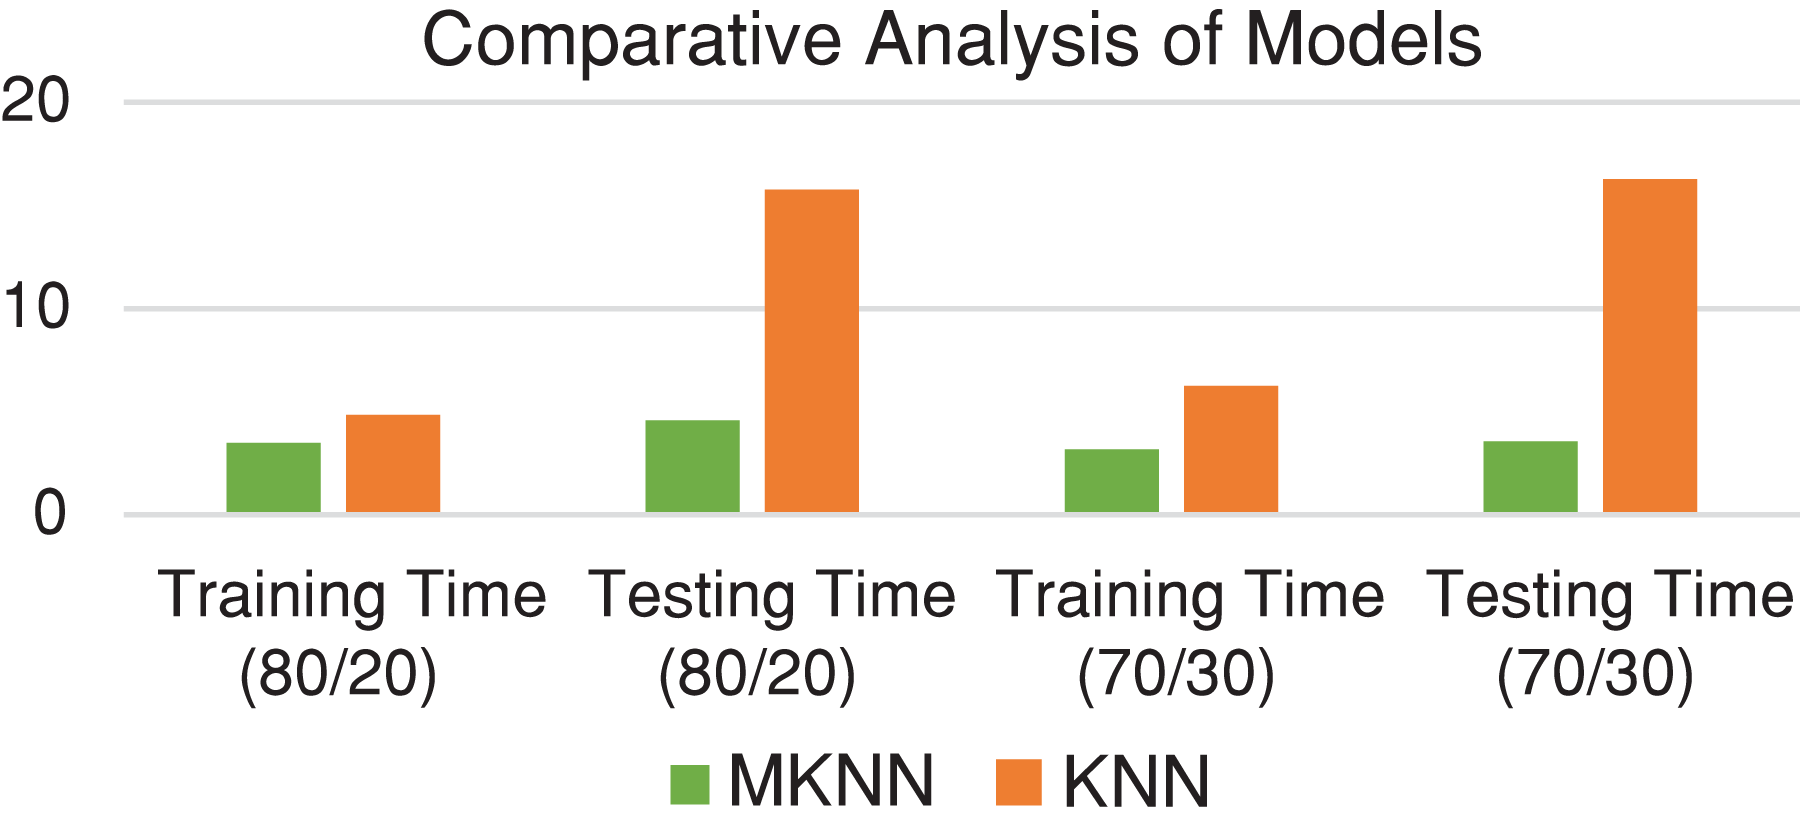
Figure 16: Comparative analysis with respect to training and testing time
The data was classified using a variety of machine learning classifiers, such as the SVM, DT, RF, NB, KNN, GB, and MLP algorithms. The outcomes demonstrated that RF outperformed KNN in terms of reference point localization. However, it’s important to keep in mind that, as was mentioned in the results section, RF increased complexity by requiring lengthy testing and training periods. KNN maintained shorter training and testing timeframes while achieving superior results compared to RF. The outcomes show the benefit of KNN for testing, validation, and training for both the 80/20 and 70/30 data splits. Select the KNN algorithm to fine-tune and enhance the outcomes following the completion of the comparative analysis research. In order to increase localization accuracy, an ML-based modified KNN architecture was created in this work using RSSI and SNR data. The MKNN technique was used to complete the study assignment of locating reference points inside an indoor localization network. MKNN was thoroughly evaluated in comparison to all other classifiers. The results demonstrated that MKNN performs better than all other classifiers in terms of training time, accuracy, and testing time.
The following lists the main contributions that this research study made:
• To find the factors that lower prediction accuracy and highlight the limitations of indoor localization systems, a thorough evaluation of the pertinent research literature was conducted. We especially looked for research publications using the phrases “machine learning-based localization,” “indoor localization with LoRa,” “fingerprinting-based localization,” and “indoor localization” in their titles.
• Establish a LoRa-based network using LoRa transmitters and receivers to gather RSSI data in a multi-story circular structure. In order to get around the multipath effect problem, SNR data is additionally evaluated against each RSSI value.
• MKNN has been used for localization in order to increase reference point precision. In this research, MKNN beats all other compared algorithms in terms of accuracy and complexity after changing the parameters with the value of neighbors, search strategy, and distance function.
Thirty-five reference locations encompassing a small portion of a multi-story circular building have provided the data. This might be gathered from a large region of more than 35 reference locations.
Reducing the reference point’s distance from one meter might potentially increase accuracy.
Deep learning has not been employed because of the small amount of data; however, as the data grows, deep learning techniques may be applied.
In order to cover a big region with a variety of circumstances, more reference points can be placed in an extensive interior environment.
Other LPWAN technologies can provide data, and the suggested method may be applied. An investigation was conducted to compare LoRa with alternative LPWAN technologies.
Deep learning methods may be utilized when reference points and data sizes rise. It is possible to compare machine learning with deep learning algorithms.
In an outdoor setting, data may be gathered using LoRA and other LPWAN technologies, and the proposed algorithm may be applied.
Acknowledgement: The authors would like to acknowledge supervisors and mentors.
Funding Statement: The research will be funded by the Multimedia University, Department of Information Technology, Persiaran Multimedia, 63100, Cyberjaya, Selangor, Malaysia.
Author Contributions: The authors confirm contribution to the paper as follows: study conception and design: Muhammad Ayoub Kamal, Muhammad Mansoor Alam, Aznida Abu Bakar Sajak. Data collection: Muhammad Ayoub Kamal. Analysis and interpretation of results: Muhammad Ayoub Kamal Draft manuscript preparation: Muhammad Ayoub Kamal. Supervision: Muhammad Mansoor Alam, Aznida Abu Bakar Sajak, Mazliham Mohd Su’ud. All authors reviewed the results and approved the final version of the manuscript.
Availability of Data and Materials: Data available on request from the authors.
Conflicts of Interest: The authors declare that they have no conflicts of interest to report regarding the present study.
References
1. T. K. Geok et al., “Review of indoor positioning: Radio wave technology,” Appl. Sci., vol. 11, no. 1, pp. 1–44, 2021. doi: 10.3390/app11010279. [Google Scholar] [CrossRef]
2. C. M. Lind, F. Abtahi, and M. Forsman, “Wearable motion capture devices for the prevention of future opportunities,” Sensors, vol. 23, no. 9, p. 4259, 2023. doi: 10.3390/s23094259. [Google Scholar] [PubMed] [CrossRef]
3. S. H. Alsamhi, O. U. Ma, and M. S. Ansari, “Survey on collaborative smart drones and internet of things for improving smartness of smart cities,” IEEE Access, vol. 7, pp. 128125–128152, 2019. doi: 10.1109/ACCESS.2019.2934998. [Google Scholar] [CrossRef]
4. R. Ivanov, “Real-time GPS track simplification algorithm for outdoor navigation of visually impaired,” J. Netw. Comput. Appl., vol. 35, no. 5, pp. 1559–1567, 2012. doi: 10.1016/j.jnca.2012.02.002. [Google Scholar] [CrossRef]
5. J. Teizer et al., “Automation in construction construction resource efficiency improvement by long range wide area network tracking and monitoring,” Autom. Constr., vol. 116, no. 2, pp. 103245, Apr. 2020. doi: 10.1016/j.autcon.2020.103245. [Google Scholar] [CrossRef]
6. M. Mallik, A. K. Panja, and C. Chowdhury, “Paving the way with machine learning for seamless indoor-outdoor positioning: A survey,” Inf. Fusion, vol. 94, no. 4, pp. 126–151, 2023. doi: 10.1016/j.inffus.2023.01.023. [Google Scholar] [CrossRef]
7. S. Halder and A. Ghosal, “A survey on mobility-assisted localization techniques in wireless sensor networks,” J. Netw. Comput. Appl., vol. 60, no. 12, pp. 82–94, 2016. doi: 10.1016/j.jnca.2015.11.019. [Google Scholar] [CrossRef]
8. D. Chizhik, J. Du, R. Feick, M. Rodriguez, G. Castro and R. A. Valenzuela, “Path loss and directional gain measurements at 28 GHz for non-line-of-sight coverage of indoors with corridors,” IEEE Trans. Antennas Propagat., vol. 68, no. 6, pp. 4820–4830, 2020. doi: 10.1109/TAP.2020.2972609. [Google Scholar] [CrossRef]
9. Y. Zheng, J. Liu, M. Sheng, S. Han, Y. Shi and S. Valaee, “Toward practical access point deployment for angle-of-arrival based localization,” IEEE Trans. Commun., vol. 69, no. 3, pp. 2002–2014, 2020. doi: 10.1109/TCOMM.2020.3042267. [Google Scholar] [CrossRef]
10. M. K. Elmezughi, “Path loss measurements and model analysis in an indoor corridor environment at 28 GHz and 38 GHz,” Sensors, vol. 22, no. 19, pp. 7642, 2022. doi: 10.3390/s22197642. [Google Scholar] [PubMed] [CrossRef]
11. T. Yang, A. Cabani, and H. Chafouk, “A survey of recent indoor localization scenarios and methodologies,” Sens., vol. 21, no. 23, pp. 8086, 2021. doi: 10.3390/s21238086. [Google Scholar] [PubMed] [CrossRef]
12. W. Ruan, Q. Z. Sheng, L. Yao, X. Li, N. J. G. Falkner and L. Yang, “Device-free human localization and tracking with UHF passive RFID tags: A data-driven approach,” J. Netw. Comput. Appl., vol. 104, no. 3, pp. 78–96, 2018. doi: 10.1016/j.jnca.2017.12.010. [Google Scholar] [CrossRef]
13. M. Aernouts, “Localization with low power wide area networks,” Thesis, Univ. of Antwerp, Antwerpen, Belgium, 2022. [Google Scholar]
14. K. Wang et al., “Learning to improve WLAN indoor positioning accuracy based on DBSCAN-KRF algorithm from RSS fingerprint data,” IEEE Access, vol. 7, pp. 72308–72315, 2019. doi: 10.1109/ACCESS.2019.2919329. [Google Scholar] [CrossRef]
15. V. Mutiawani, C. T. Nazila, K. Saputra, and A. Mabrina, “Design of an indoor localization system based on WLAN for assisting victim’s evacuation process,” Proc. ICAITI 2019–2nd Int. Conf. Appl. Inf. Technol. Innov. Explor. Futur. Technol. Appl. Inf. Technol. Innov., vol. 37, pp. 6–10, 2019. doi: 10.1109/ICAITI48442.2019.8982147. [Google Scholar] [CrossRef]
16. G. Li, E. Geng, Z. Ye, Y. Xu, J. Lin and Y. Pang, “Indoor positioning algorithm based on the improved,” Sens., vol. 18, no. 9, pp. 1–15, 2018. doi: 10.3390/s18092820. [Google Scholar] [PubMed] [CrossRef]
17. S. G. Pease, P. P. Conway, and A. A. West, “Hybrid ToF and RSSI real-time semantic tracking with an adaptive industrial internet of things architecture,” J. Netw. Comput. Appl., vol. 99, no. 3, pp. 98–109, 2017. doi: 10.1016/j.jnca.2017.10.010. [Google Scholar] [CrossRef]
18. C. Jain, G. V. S. Sashank, and S. Markkandan, “Low-cost BLE based indoor localization using RSSI fingerprinting and machine learning,” in 2021 Sixth Int. Conf. Wirel. Commun., Signal Process. Netw. (WiSPNET), 2021, pp. 363–367. [Google Scholar]
19. S. Cortesi, M. Dreher, and M. Magno, “Design and implementation of an RSSI-based bluetooth low energy indoor localization system,” in 2021 17th Int. Conf. Wirel. Mobile Comput., Netw. Commun. (WiMob), 2021, pp. 163–168. [Google Scholar]
20. J. Golenbiewski and G. Tewolde, “Wi-Fi based indoor positioning and navigation system (IPS/INS),” in 2020 IEEE Int. IOT, Electr. Mechatr. Conf. (IEMTRONICS), 2020, pp. 1–7. [Google Scholar]
21. B. Li, Y. Xu, Y. Liu, and Z. Shi, “LoRaWAPS: A wide-area positioning system based on LoRa Mesh,” Appl. Sci., vol. 13, no. 17, pp. 9501, 2023. doi: 10.3390/app13179501. [Google Scholar] [CrossRef]
22. S. Sadowski and P. Spachos, “RSSI-based indoor localization with the internet of things,” IEEE Access, vol. 6, pp. 30149–30161, 2018. doi: 10.1109/ACCESS.2018.2843325. [Google Scholar] [CrossRef]
23. R. Rathnayake, M. W. P. Maduranga, V. Tilwari, and M. B. Dissanayake, “RSSI and machine learning-based indoor localization systems for smart cities,” Eng., vol. 4, no. 2, pp. 1468–1494, 2023. doi: 10.3390/eng4020085. [Google Scholar] [CrossRef]
24. M. Simka and L. Polak, “On the RSSI-based indoor localization employing LoRa in the 2.4 GHz ISM band,” Radioengineering, vol. 31, no. 1, pp. 135–143, 2022. doi: 10.13164/re.2022.0135. [Google Scholar] [CrossRef]
25. L. Aarif, M. Tabaa, and H. Hachimi, “Experimental test and performance of RSSI-based indoor localization in LoRa networks,” Procedia Comput. Sci., vol. 203, no. 1, pp. 420–425, 2022. doi: 10.1016/j.procs.2022.07.055. [Google Scholar] [CrossRef]
26. D. Chandana, C. Savitha, and M. Z. Kurian, “Design and implementation for indoor navigation system using LoRa,” Int. J. Modern Dev. Eng. Sci., vol. 1, no. 7, pp. 60–64, 2022. [Google Scholar]
27. Etiabi, Yaya, Mohammed Jouhari, Andreas Burg, and EI Mehdi Amhoud, “Spreading factor assisted LoRa localization with deep reinforcement learning,” in 2023 IEEE 97th Vehicular Technology Conference (VTC2023-Spring), IEEE, 2023, pp. 1–5. [Google Scholar]
28. I. T. Ali, A. Muis, and R. F. Sari, “A deep learning model implementation based on rssi fingerprinting for LoRa-based indoor localization,” EUREKA, Phys. Eng., vol. 2021, no. 1, pp. 40–59, 2021. doi: 10.21303/2461-4262.2021.001620. [Google Scholar] [CrossRef]
Cite This Article
 Copyright © 2024 The Author(s). Published by Tech Science Press.
This work is licensed under a Creative Commons Attribution 4.0 International License , which permits unrestricted use, distribution, and reproduction in any medium, provided the original work is properly cited.
 Downloads
 Citation Tools