
 Submit a Paper
 Propose a Special lssue
 Open Access
ARTICLE
Research on Site Planning of Mobile Communication Network
1 Department of Computer Information and Cyber Security, Jiangsu Police Institute, Nanjing, 210000, China
2 Engineering Research Center of Electronic Data Forensics Analysis, Nanjing, 210000, China
3 Key Laboratory of Digital Forensics, Department of Public Security of Jiangsu Province, Nanjing, 210000, China
4 Basic Course Teaching and Research Department, Jiangsu Police Institute, Nanjing, 210000, China
5 Communication and Signal College, Nanjing Railway Vocational and Technical, Nanjing, 210000, China
* Corresponding Author: Guangjun Liang. Email:
Computers, Materials & Continua 2024, 80(2), 3243-3261. https://doi.org/10.32604/cmc.2024.051710
Received 13 March 2024; Accepted 18 July 2024; Issue published 15 August 2024
 View Full Text
 Download PDF
Abstract
In this paper, considering the cost of base station, coverage, call quality, and other practical factors, a multi-objective optimal site planning scheme is proposed. Firstly, based on practical needs, mathematical modeling methods were used to establish mathematical expressions for the three sub-objectives of cost objectives, coverage objectives, and quality objectives. Then, a multi-objective optimization model was established by combining threshold and traffic volume constraints. In order to reduce the time complexity of optimization, a non-dominated sorting genetic algorithm (NSGA) is used to solve the multi-objective optimization problem of site planning. Finally, a strategy for clustering and optimizing weak coverage areas was proposed. In order to avoid redundant neighborhood retrieval during cluster expansion, the Fast Density-Based Spatial Clustering of Applications with Noise (FDBSCAN) clustering method was adopted. With different sub-objectives as the main objectives, this paper obtained the distribution map of weak coverage areas before and after the establishment of new base stations, as well as relevant site planning maps, and provided three planning schemes for different main objectives. The simulation results show that the traffic coverage of the three station planning schemes is above 90%. The change in the main optimization objective will result in a significant difference between the cost of the three solutions and the coverage of weak coverage points.Keywords
With the rapid development of information technology and the increasing demand of users for communication networks, 5G technology has been widely put into practical application, opening a new chapter in the field of communication. However, with the advent of this new era, we also face a new set of challenges. The significant expansion of wireless communication bandwidth and the relative reduction of base station coverage has led to the dilemma of “weak coverage” in many existing antenna layout areas, which not only affects the strength of the signal and the clarity of the call but also causes serious interference to the daily life of local residents. Given this, there is an urgent need for rapid deployment of base stations in “weak coverage” areas to eliminate these adverse effects [1–4].
Base station location, as a key link of base station network planning, its importance is self-evident. Reasonable base station layout can not only improve the coverage of communication network, but also effectively save construction costs, reduce the difficulty of construction, and provide convenience for subsequent maintenance and management. Therefore, when determining the location of base stations, we must consider many factors such as coverage, cost-effectiveness, and base station utilization. How to find the best balance point among various considerations and achieve global optimization is the main problem that we need to further study and solve in the process of base station location [5,6].
Early mobile communication network site planning is relatively simple, mainly the unified design of regional systems. In 2010, Khalek et al. [7] explored the problem of minimizing the transmission power of base station (BS) under the constraint of downlink signal-to-noise ratio (SIR), so as to obtain the optimal BS deployment scheme for a given user distribution area. By defining a continuous component, the problem is reduced to a continuous modeling-constrained optimization problem. A BS deployment algorithm based on continuous elimination is designed, and the effectiveness of the algorithm is verified by experiments in different scenarios.
With the popularization of 4G and 5G mobile communication systems, the implementation of small cells with lower power consumption has complicated the site planning of mobile communication networks. Un et al. [8] adapted the 3D ray tracing method to evaluate the received power levels on a university campus. They achieved a good coverage range using fewer base stations (BSs) and optimized the relevant parameters of their transmitting antennas. Simulation results verified the effectiveness of the design, with the coverage rate exceeding 83.2%. However, the coverage remained unsatisfactory. Unlike mobile communication systems in urban areas [8], Akhter et al. [9] studied the planning of new small base station networks, considering geographical terrain changes and urban geographical characteristics. They proposed a deployment scheme to ensure coverage while meeting the transmission characteristics of BS transmitting antennas. Jia et al. [10] focused on the minimum power base station planning scheme under the constraint of cell load balancing, taking into account the non-uniform LTE (Long Term Evolution) service distribution in the entire coverage area. They first estimated the optimal number of sites and then determined the position of each base station within this range by iteratively solving the convex problem, thereby minimizing the power consumption of users and base stations. Simulation results demonstrated the effectiveness and convergence of the algorithm. Yang et al. [11] further considered the limitations of radio power, baseband power, and cooling system loss, proposing a mathematical model for the evaluation index of BS planning. They adopted a base station number search algorithm and a cell site planning scheme with a fixed cell number. Simulation results showed that the suboptimal solution of the algorithm could effectively address the optimization problem. Zhang et al. [12] studied a 4G site planning scheme considering interference factors and proposed a site reuse scheme that balanced site attributes and coverage efficiency. The simulation results verified the rationality of the scheme, further improving the accuracy of 4G network planning.
The authors in [13,14] further studied the site planning schemes for 4G LTE. Considering multipath noise and non-line-of-sight (NLOS) environments, Zhang et al. [13] proposed a single-station positioning method based on the joint estimation of time of arrival (TOA) and angle of arrival (DOA). Simulation results indicated that the proposed method outperforms traditional multipath site planning schemes. Rahmatia et al. [14] investigated site optimization based on 1800 MHz frequency division duplex (FDD) modulation technology. Using Atoll network simulation software to perform multiple measurements, including link budget calculations and final signal quality comparisons of existing and new site data, they achieved cell coverage of more than 93.9%. However, the classic methods based on TOA and DOA mentioned above are affected by factors such as propagation interference, resulting in limited positioning accuracy and suboptimal base station planning effectiveness.
The advent of the 5G era has introduced several challenges, such as the expansion of wireless communication bandwidth and the reduced coverage of base stations. Kang [15] proposed a site planning strategy within a co-construction and sharing scenario. By evaluating data from 4G operations and 5G network simulations, they selected candidate sites using entropy weight scoring. These candidates were then assessed based on overall planning layout, property information, and other special needs to determine the optimal construction site. Considering the characteristics of mobile communication nodes and complex terrain affecting communication signals, Yan et al. [16] proposed a site selection planning method for mobile communication systems in wireless broadband mode under irregular terrain conditions. Simulation results indicated that this method could reduce the risk of effective coverage loss and communication interruption. The improved algorithm ensures diversity in the optimization process and enhances the optimization effect, while scene parameters and user preferences impact the final planning results. Ding et al. [17] aggregated the base station coverage area, traffic volume, and construction cost into single objectives, using a particle swarm optimization algorithm to solve the 5G base station planning problem. However, the aforementioned base station positioning and planning schemes, based on modern intelligent computing algorithms, are difficult to apply in engineering practice due to their high computational complexity.
In recent years, heuristic algorithms have made great progress in solving optimization problems [18,19]. Among many algorithms, the Seagull optimization algorithm (STOA) has shown remarkable optimization effect by its unique idea, that is, by simulating terns’ foraging behavior. In order to further promote the construction of 5G network, Luo et al. [20] studied the location problem of base stations under various constraints in-depth, successfully constructed a multi-objective programming model, and efficiently solved the model by using an accelerated genetic algorithm based on real number coding. In order to display the results intuitively, they also cleverly used Python and ArcGIS software to visualize the results.
In the field of Internet of Things (IoT), Maia et al. [21] focused on the effective utilization of edge computing resources. They comprehensively consider the load distribution and layout problems and strive to improve the overall service level while minimizing the limit of edge computing resources and other conflicting goals. Aiming at the computational complexity of the optimization problem, they proposed a multi-objective genetic algorithm based on an initial artificial intelligence (AI) solution and experimentally verified that this scheme performs well in both running cost and service availability, outperforming other benchmark algorithms.
Yu et al. [22] have also made remarkable achievements in the field of wireless sensor network planning. They propose an improved STOA algorithm based on a multi-strategy approach, which significantly reduces positioning errors by optimizing anchor node positions and hops, thereby improving the efficiency of network planning.
Process knowledge-oriented autonomous evolutionary Optimization (PKAEO) is a cutting-edge optimization method that is based on evolutionary computation and utilizes process knowledge to guide the autonomous evolutionary optimization process. Zou et al. [23] believed that simplifying various engineering problems into constrained multi-objective optimization problems is an effective way to solve the problems. They proposed a constrained multi-objective autonomous evolutionary optimization method guided by process knowledge, and successfully applied it to the coal mine integrated energy system scheduling optimization problem, and achieved remarkable results.
This paper presents an optimal site planning scheme under multiple objectives. First, the cost target, coverage target and quality target are determined and the relevant mathematical expressions are given. Then, combining the constraint conditions of the threshold and traffic volume, the multi-objective optimization model is established. Considering that the original data set is too large, the solution space is too large, and the traditional optimization method has the problems of occupying too much memory and requiring too much computing power, which is difficult to overcome in practical operation. Finally, the multi-objective optimization strategy based on the Non-dominated Sorting Genetic algorithm (NSGA) is selected to solve the problem. Finally, the distribution map of the weak coverage area before and after the new base station is established, and the relevant site planning map (“main cost”, “main coverage area”, “cost + coverage area”) is obtained by taking different sub-targets as the main targets. The simulation verifies the specific values of cost, traffic coverage, and weak coverage point coverage for three types of planning.
To further improve the time complexity of the algorithm, a strategy of clustering first and then optimizing for areas with weak coverage points has been proposed. Firstly, through the analysis of DBSCAN (Density-Based Spatial Clustering of Applications with Noise) clustering, it is found that its time complexity is as high as
The main contributions of our work can be summarized as follows:
• Three sub objectives that have a significant impact on base station planning have been identified, and a site planning scheme based on multi-objective planning has been proposed.
• A non-dominated sorting genetic algorithm is innovatively adopted in solving multi-objective optimization problems for site planning.
• A DBSCAN clustering method based on DBSCAN has been proposed to significantly reduce algorithm complexity.
2 Mobile Communication Network Site Planning Model
2.1 Problem Analysis and Model Hypothesis
There are many interference factors in base station planning. This paper mainly takes distance as the main evaluation indicator. For the convenience of considering this issue, we make the following assumptions without affecting the accuracy of the model:
• Assuming that the area to be covered is flat without extreme terrain.
• Not considering the impact of human intervention on base station construction.
• Not considering the impact of natural factors on base station signals.
The planning of the mobile communication network BS needs to consider many factors, and this paper selects three representative target indicators: cost, coverage, and communication quality.
• Cost Objective
The planned investment of the base station accounts for about two-thirds of the total investment of the whole network. Therefore, the low cost can effectively reduce the total investment of the network and enhance the competitiveness of communication enterprises. The cost considered in the base station planning is mainly due to the link of base station construction. Without considering external factors such as terrain differences, the cost of each base station construction is fixed, and the type selection and quantity of base station construction become the two most important factors in establishing the best scheme. That is, on the premise of ensuring the total traffic volume, coverage rate, and network quality, the minimum number of base stations should be sought, and on this basis, the micro-base stations should be used preferentially.
• Coverage Objective
The coverage goal is to require the base station to cover all users in the micro-coverage area as far as possible to ensure the communication quality of all users. The base station has a fixed coverage area
• Quality Objective
The quality objective is to reduce signal interference between different base stations. Because spectrum is a scarce natural resource, 5G networks reuse some of it. This leads to the inevitable interference of the same frequency link when the spectrum is shared between systems. Therefore, when the demand point communicates with one base station, it is bound to be interfered with by other base stations.
Faced with a large number of new base stations, the cost of network optimization and construction is very large, so it is an important goal of base station site planning to reduce the construction cost as far as possible under the condition of satisfying the coverage. The principle of base station selection is to meet the threshold requirements and give priority to hotspots with high traffic volume.
The optimization objective function is expressed as follows:
In the above equation,
A. Cost objective function
B. Coverage objective function
C. Quality objective function
In order to measure the degree of signal interference, the variable
The formula for the signal intensity released by the base station
The “5” appearing in formulas (4) and (5) is the coverage coefficient, which is usually a constant [24]. The variable
The effect of building
where
The constraint conditions are considered from two aspects: distance threshold requirements between base stations and traffic demand. For distance threshold requirements as follows:
where
where
Finally, the target function, namely the fitness function, can be obtained:
3 Solution of Site Planning Model
This section focuses on solving the optimization problem of formula (10). This problem is a non-deterministic polynomial (NP)-hard problem, and it is not easy to get good results with conventional methods. Therefore, we try to use a genetic algorithm to solve it. In order to further reduce the computational complexity, a simplified optimization method based on clustering is proposed.
3.1 Multi-Objective Optimization Based on Genetic Algorithm
In order to reduce the time complexity of optimization as much as possible, regional clustering is carried out according to distance considering the weak coverage points. On the basis of the DBSCAN algorithm, we innovatively propose the FDBSCAN clustering algorithm, which can accelerate the clustering speed and reduce the time complexity by avoiding the redundant retrieval of the neighborhood in the process of cluster expansion. According to the clustering steps of FDBSCAN, Python was used to determine the reasonable algorithm and cluster analysis was conducted.
Fig. 1 is a flow chart of NSGA. The core technology of NSGA is racial stratification and shared niche technology. Racial stratification refers to the non-domination stratification of the population by using non-domination ranking algorithm, assigning virtual fitness value, and then carrying out the following genetic operation, aiming at the characteristics of fitness difficult to be directly determined in multi-objective problems. The second type of shared niche technology redesigns virtual fitness on the same non-explicit layer while maintaining a uniform distribution of Pareto optimal solution sets. The NSGA algorithm adopts the principle of non-explicit sorting and shared niche technology to determine the adaptation of individuals. The genetic operation follows the steps of the basic genetic algorithm, and the replication, crossover, and mutation operators are the same as the basic genetic algorithm.
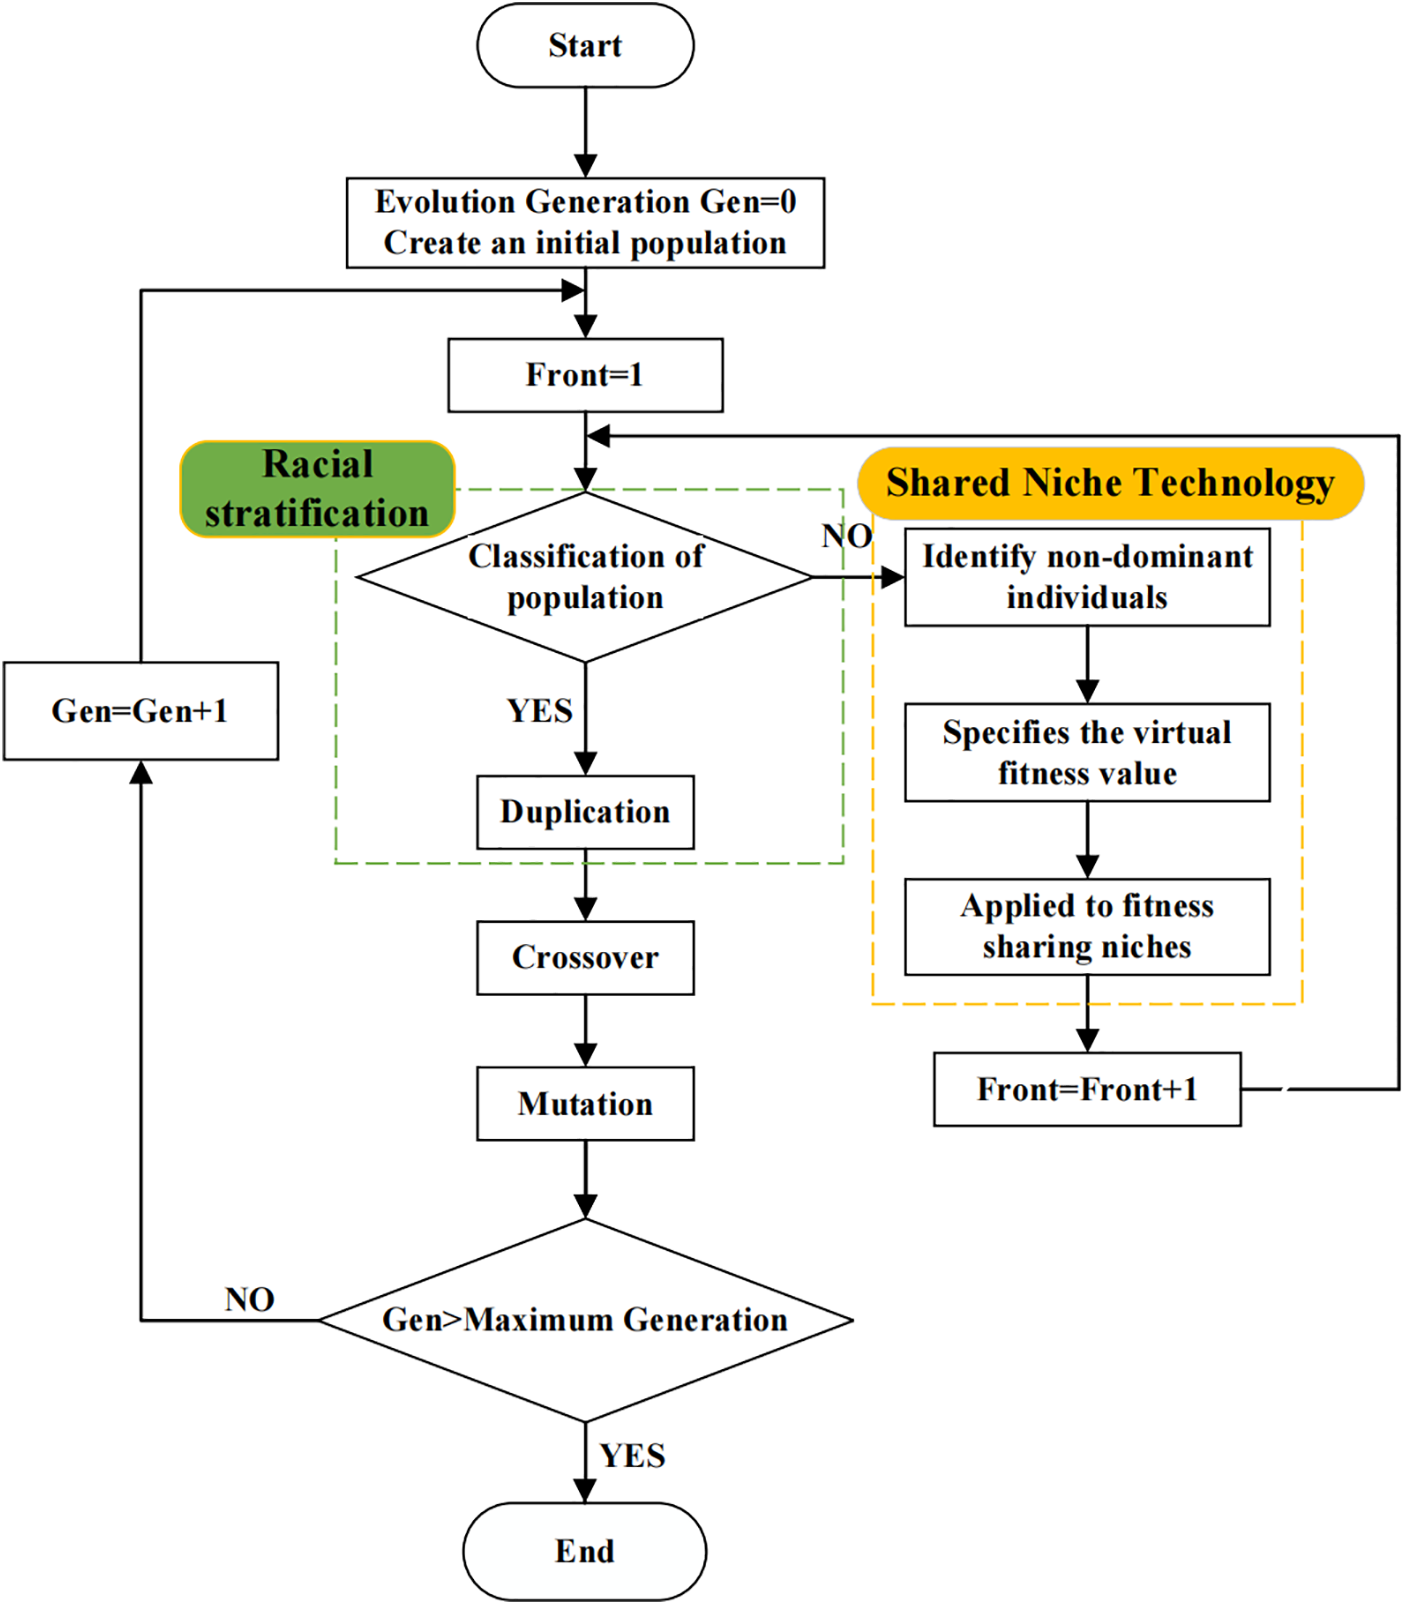
Figure 1: The flow chart of NSGA
1) Racial stratification
The purpose of racial stratification is to assign virtual fitness values to all individuals in the population. For finding the minimum objective function
Set
while
If no individual
Set
The set of non-dominant individuals obtained through the above steps is the first non-dominant level of the population. Then, ignoring these labeled non-dominant individuals (i.e., these individuals will not be compared in the next round) and following steps (1)–(4) again, the second level of the non-dominant layer will be obtained. And so on until the entire population is stratified.
2) Adopt shared niche technology
In order to maintain the diversity of the population during the evolution process, NSGA introduced the shared niche technology. Suppose that there are
Calculate the Euclidean distance between individual
where
The sharing function is a function that represents the closeness of the relationship between two individuals. The sharing function
where the value of
Then we calculate the cumulative similarity between the node
Calculate the shared fitness value of the individual
Similarly, we can calculate the fitness of all individuals under the condition of niche, thus improving the diversity of the population during evolution, because the fitness of a population with high similarity will be appropriately reduced.
In the actual solution, the large amount of data brings a series of problems such as the number of iterations, high memory requirements, and long running time. After trying, it is found that it is difficult to solve the problem successfully in a short time by using the traditional mathematical model, so some intelligent algorithms are selected to search for optimization. From the perspective of reducing the object of action, this paper considers the formation of a “weak coverage group” through regional clustering. On the one hand, it greatly reduces the object of action established by the base station, which is convenient for site planning, and also increases the possibility of using a mathematical model to solve. On the other hand, regionalization of weak coverage points can facilitate management.
DBSCAN is one of the most classical density-based clustering algorithms. It can cluster sample points according to the spatial distribution density of data sets, and it can find class clusters of arbitrary shapes in noisy data. DBSCAN algorithm has excellent performance in processing complex data. However, when processing a large number of data, the brute force method is adopted to calculate the domain density for each sample point. The time complexity is very high due to some repeated operations in which the time complexity is
On the basis of the DBSCAN algorithm, this paper innovatively adopts the fast DBSCAN algorithm (FDBSCAN algorithm) which is improved on the basis of the DBSCAN algorithm. This algorithm uses the core points of the overlapping parts between sub-clusters as the basis for cluster combination and completes clustering based on this expansion. FDBSCAN avoids redundant retrieval of neighborhoods during the cluster expansion process, thereby speeding up clustering. Its time complexity is
Specific steps of FDBSCAN are as follows:
Step 1 Input the data set
Among them, the radius parameter of 20 means that for a “weak cover point group” after the completion of a cluster, any weak cover point will inevitably find at least one point in the group with a distance of less than 20, and such existence cannot be found outside the group. The neighborhood density threshold represents the minimum number of weak coverage points required by clustering to form a particle swarm.
Step 2 According to the given hyperparameters
The core point is the point that is at least
Step 3 Select the current first point
Step 4 Cluster the remaining points in dataset
The method of FDBSCAN is similar to Fig. 1. Firstly, FDBSCAN is used for regional clustering of weak coverage points to obtain weak coverage groups. Then the weak cover group is taken as the population unit and solved by NSGA, which can greatly reduce the difficulty of operation under certain conditions. The detailed method of clustering first and then planning is shown in Fig. 2.

Figure 2: The flow chart of clustering first and then the planning method
4 Simulation Results and Performance Analysis
4.1 Simulation Environment and Parameters Setting
For the above model, the concrete data are brought in to verify its feasibility. The simulation environment is Python 3.8.3.
Assuming the size of a given area is 2500 * 2500 grids (marked as 2500 * 2500 points), with horizontal coordinates ranging from 0 to 2499 and vertical coordinates ranging from 0 to 2499. There are a total of 182,807 weak coverage points in the area, including their coordinates and communication status. The coordinates of BS planning can only be selected from 2500 * 2500 points in a given area. In the assumed coverage area, we provide two types of BSs. One type is a macro BS, with a cost defined as 30 and a coverage range of 10 unit grids. Another type is micro BS, which have a cost definition of 30 and a coverage range of 1 unit grid. The simulation data set comes from a competition platform. For data set acquisition and experiments, please contact us.
Also, give the coordinates of the network base station. The threshold of the coordinate point of the existing network base station, the new site, and the distance between the new site and the existing site is 10. According to the given information and the data in the attachment, the site planning is carried out so that 90% of the total service volume of the weak coverage point is covered by the planned base station.
4.2 Simulation Results of Multi-Objective Optimization
Using the above model, we solve the model with Python.
Figs. 3 and 4 clearly show the thermal maps of the flow distribution of weak coverage points before and after the base station is built. In these two graphs, the significance of the red factor directly reflects the traffic flow at the corresponding point. Observing these two figures, it is not difficult to find that after the establishment of the base station, most of the original weak coverage points have been significantly included in the coverage range, and only a few points have not been covered by the base station signal. Moreover, the traffic carried by these weak coverage points that have not yet been covered is not significant.
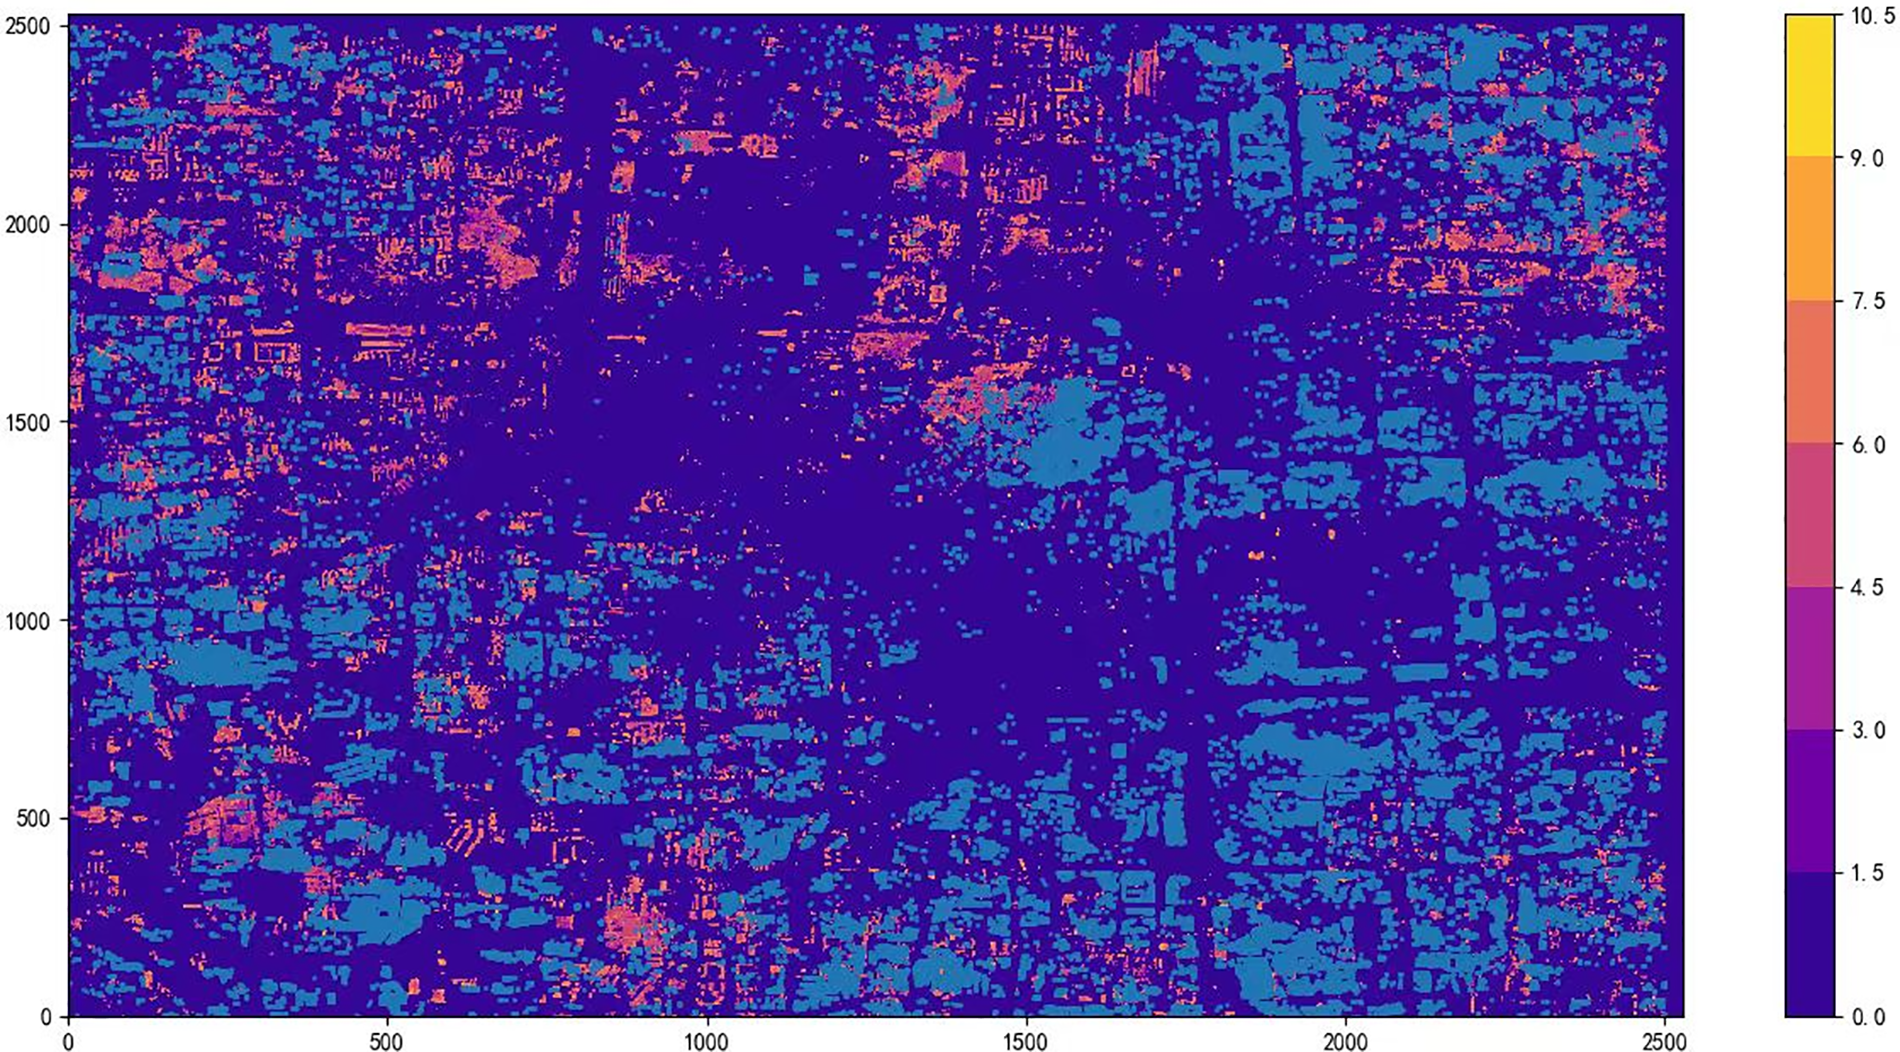
Figure 3: Heat map of traffic distribution at weak coverage points
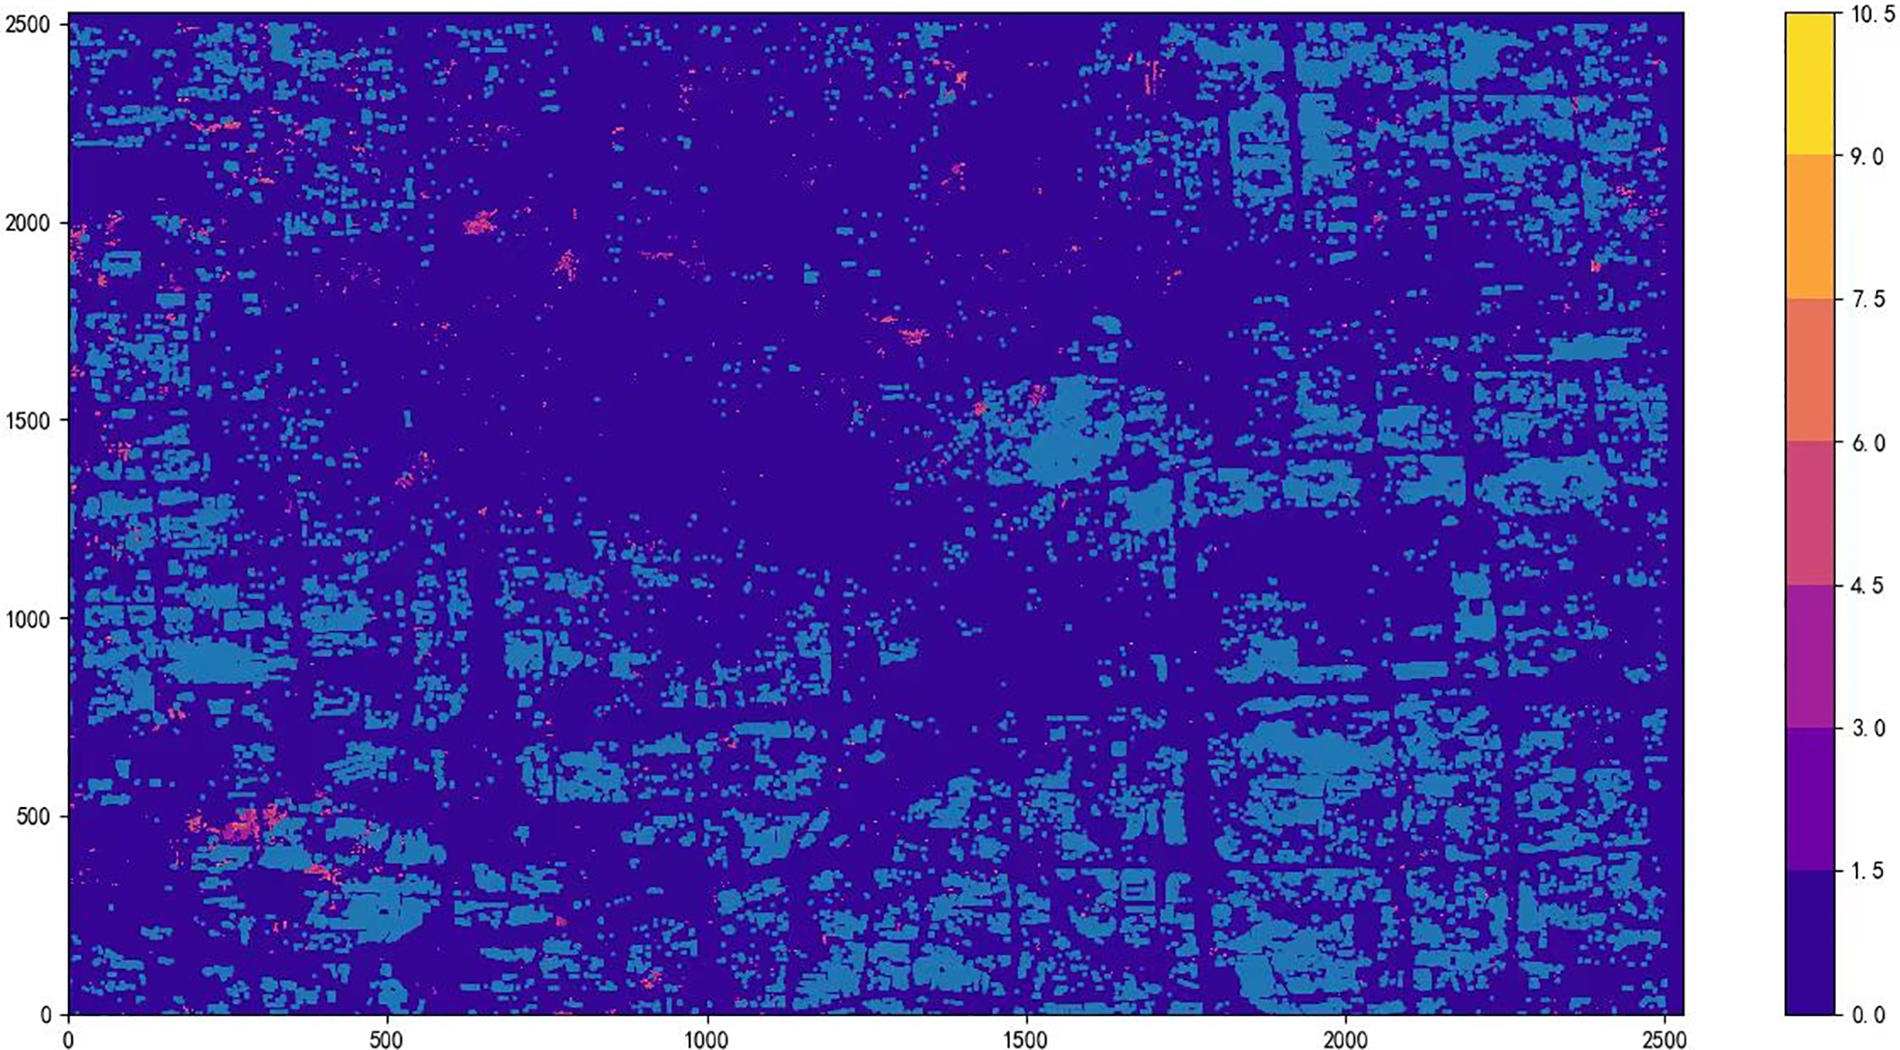
Figure 4: The thermal map of the traffic distribution of the remaining weak coverage points after the establishment of the base station
In this paper, we explore a complex multi-objective optimization problem in depth. For the search for the global optimal solution, the weight change of each objective may lead to a significant change in the result. In order to solve this problem, we start from two main dimensions and carry on a detailed analysis and discussion. In the end, we came up with an optimization plan that took cost as the main consideration, while also taking into account improved coverage. In the balance of these two objectives, we propose a site planning scheme under three different conditions to achieve optimal resource allocation and efficiency improvement.
Figs. 5 and 6 are the BS planning schemes under different main objectives, while Fig. 7 is the BS planning under equilibrium consideration. The red is the location of the micro-base station and the yellow is the location of the macro station. According to the feature analysis in the data set, the coverage ratio of macro base stations and micro base stations is 9:1, while the price ratio is 1:10. In the case of the cost consideration, covering the same size range, the establishment of the micro base station is more cost-effective. However, the coverage area of the base station is a circular area, which does not belong to the regular polygon that can be perfectly spliced. Therefore, although the area covered by one macro station and nine micro base stations is the same, the shape of the coverage area is different. If we choose to replace one macro station with nine micro base stations due to cost consideration, it is likely to cause the weak coverage points that have been covered to recover to a state that is not covered.
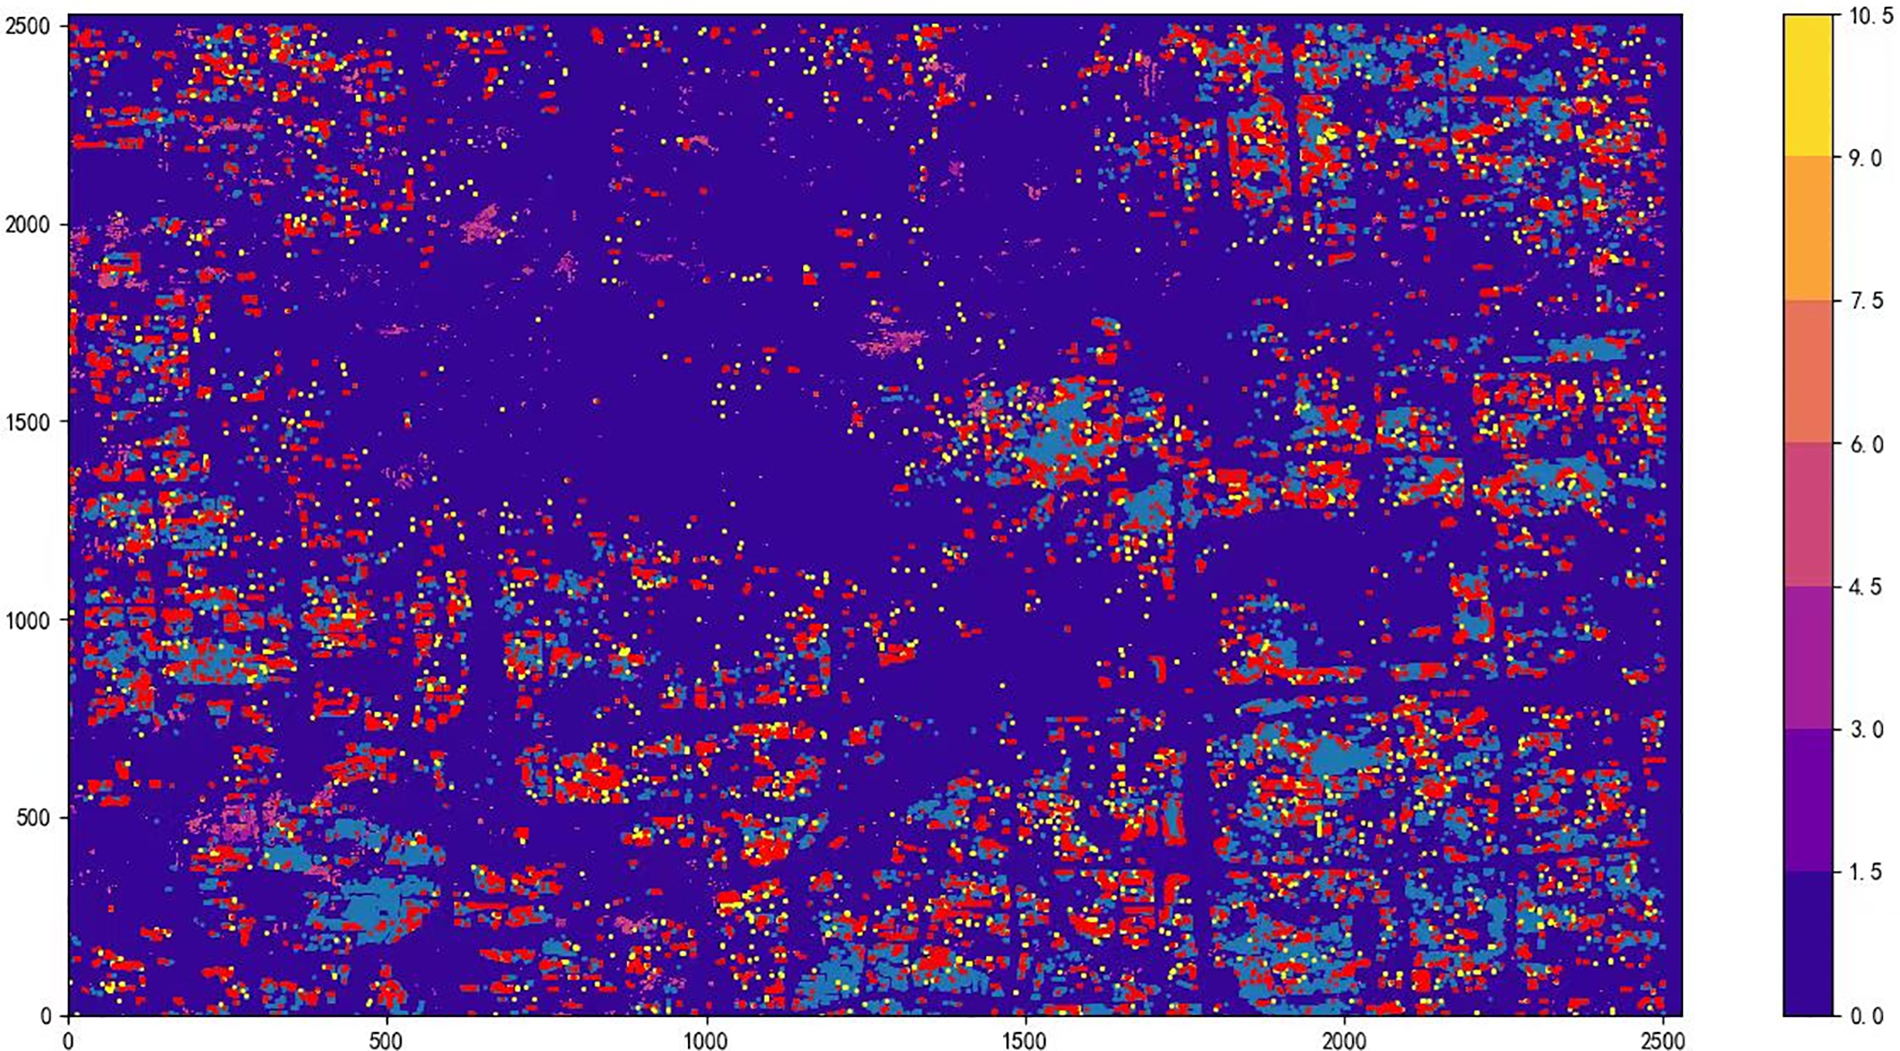
Figure 5: The planning distribution map of the base station with the cost objective as the main objective
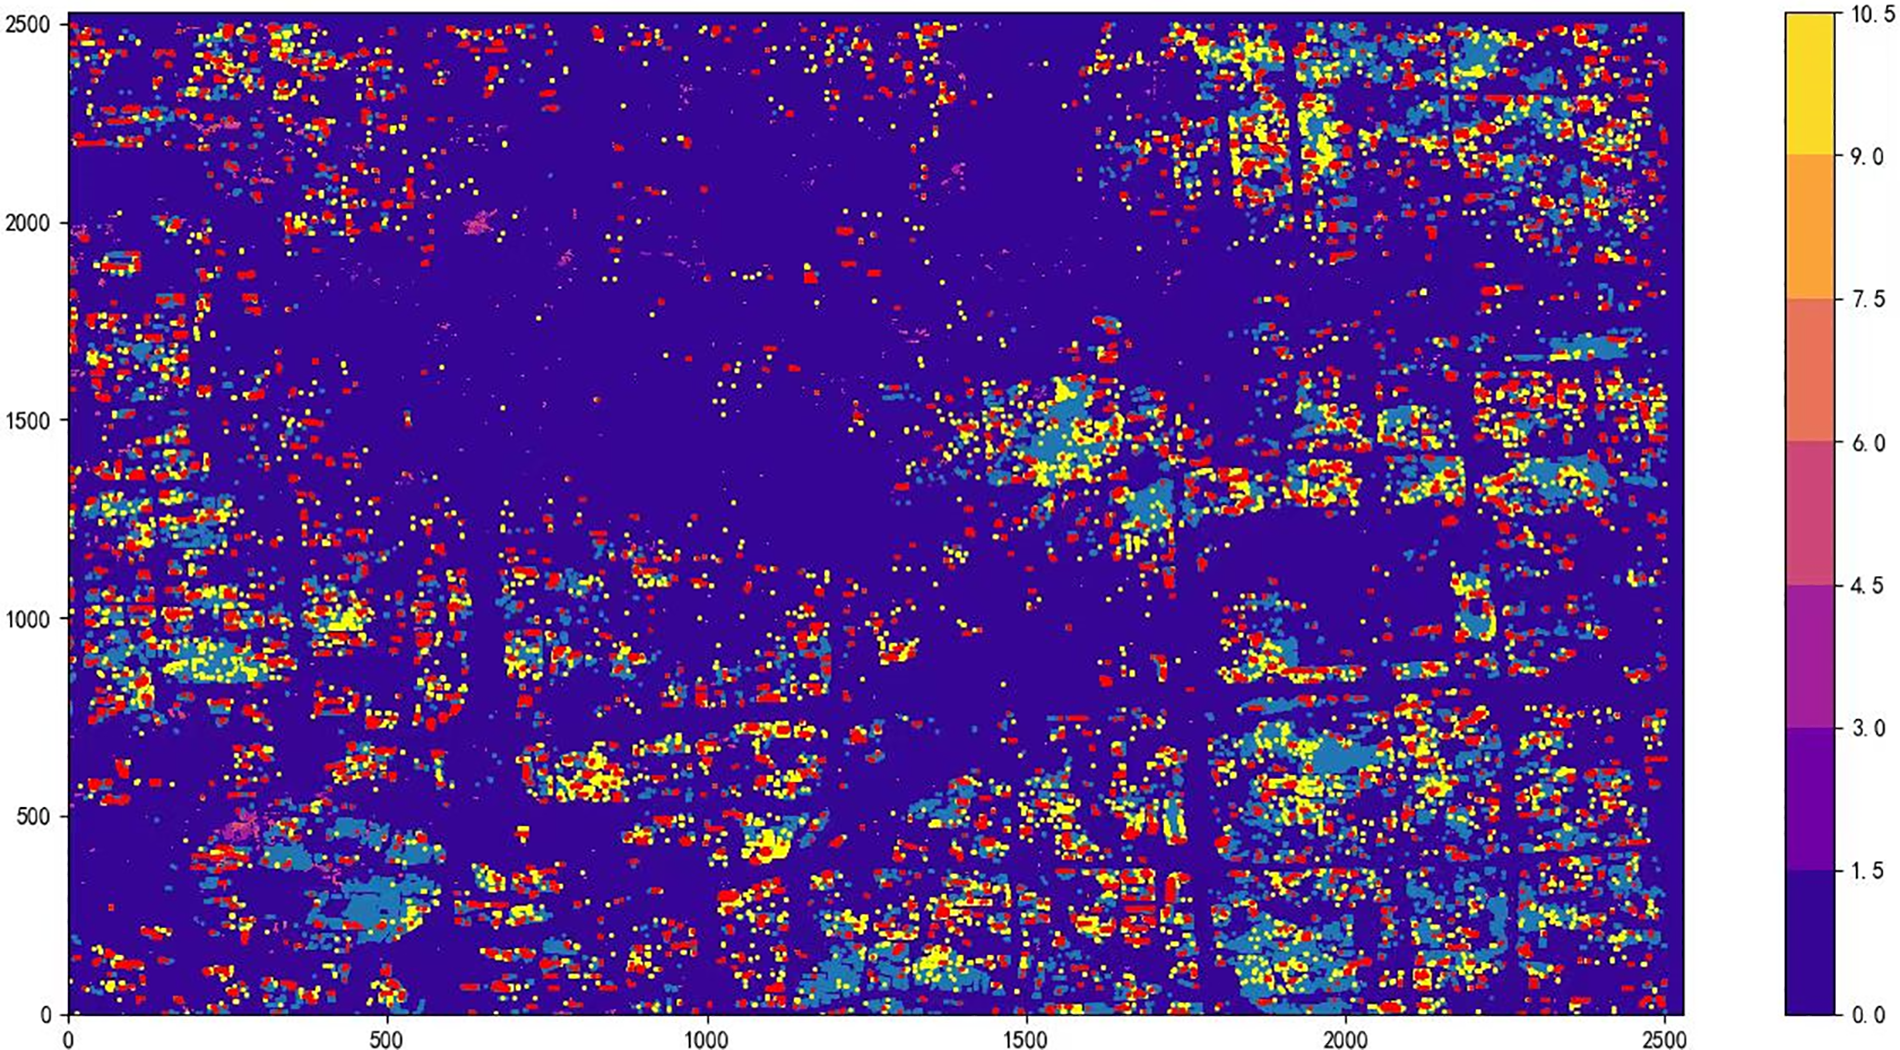
Figure 6: The planning distribution map for the base station with the main objective of coverage
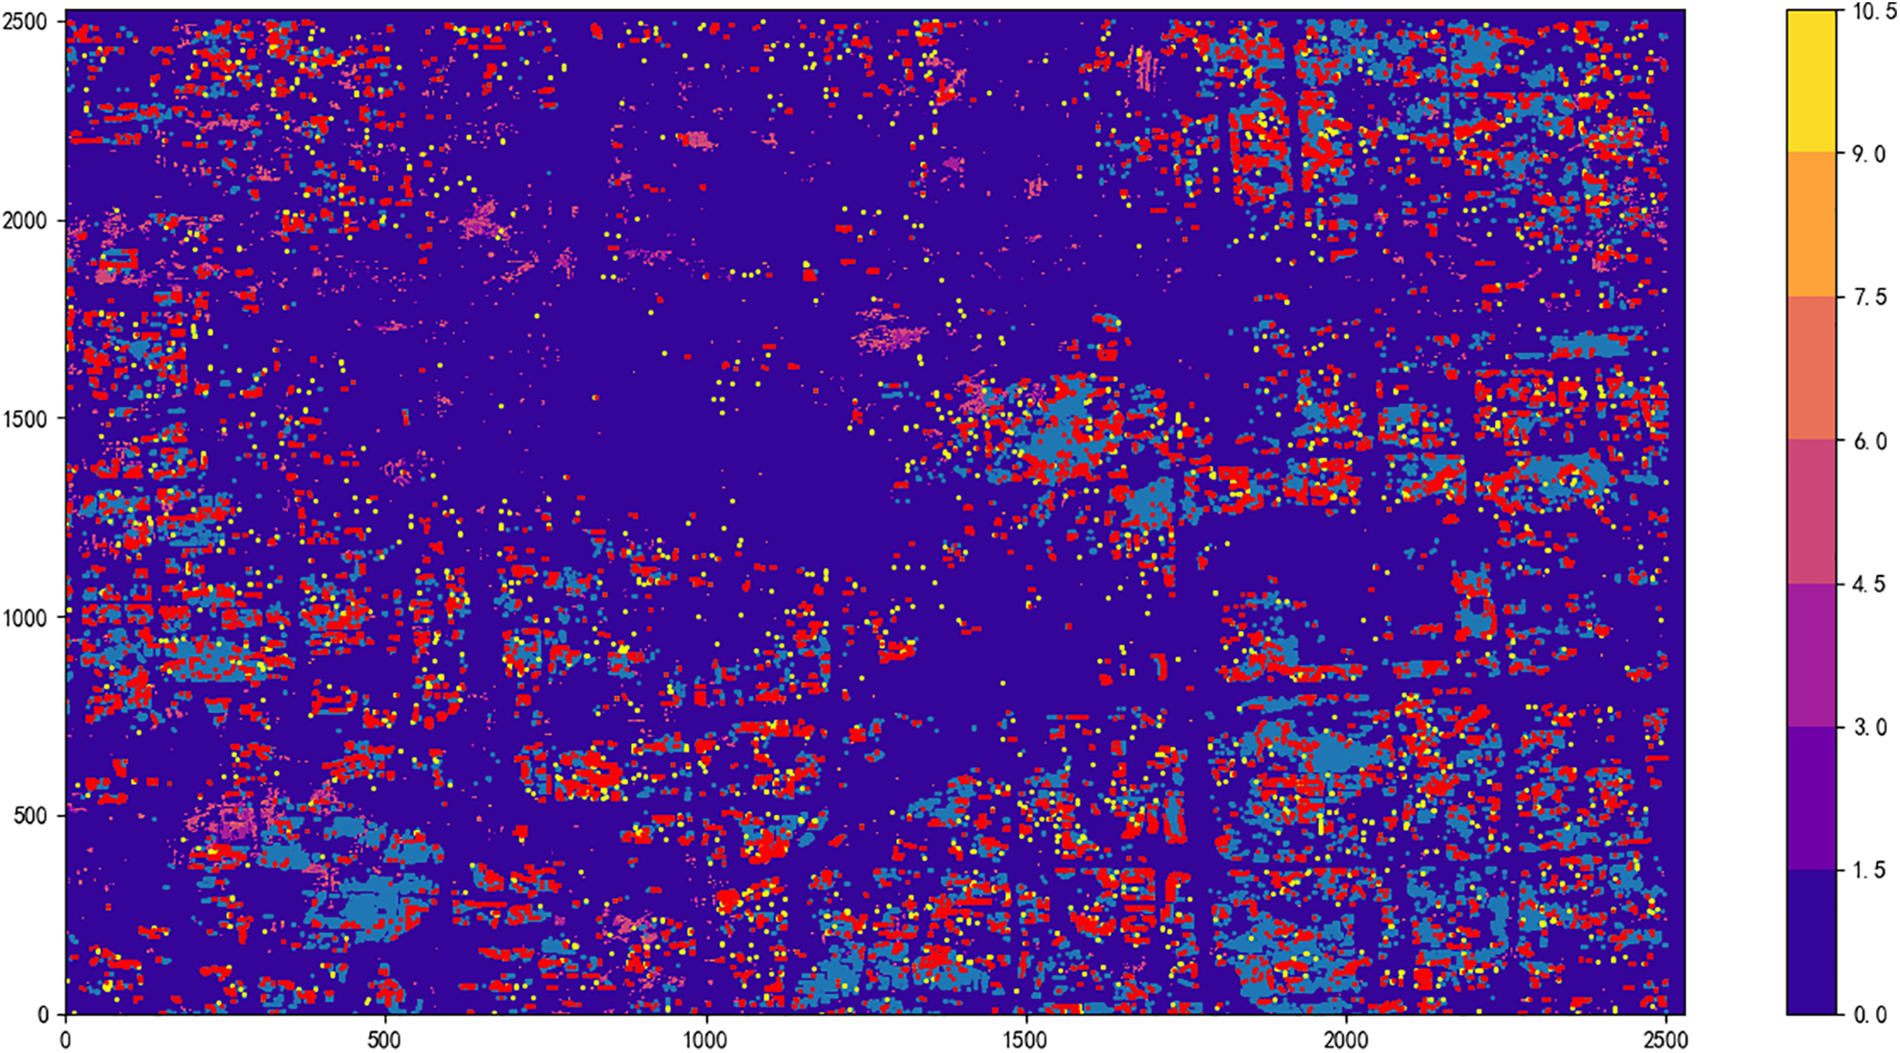
Figure 7: Balanced consideration of base station establishment planning distribution map
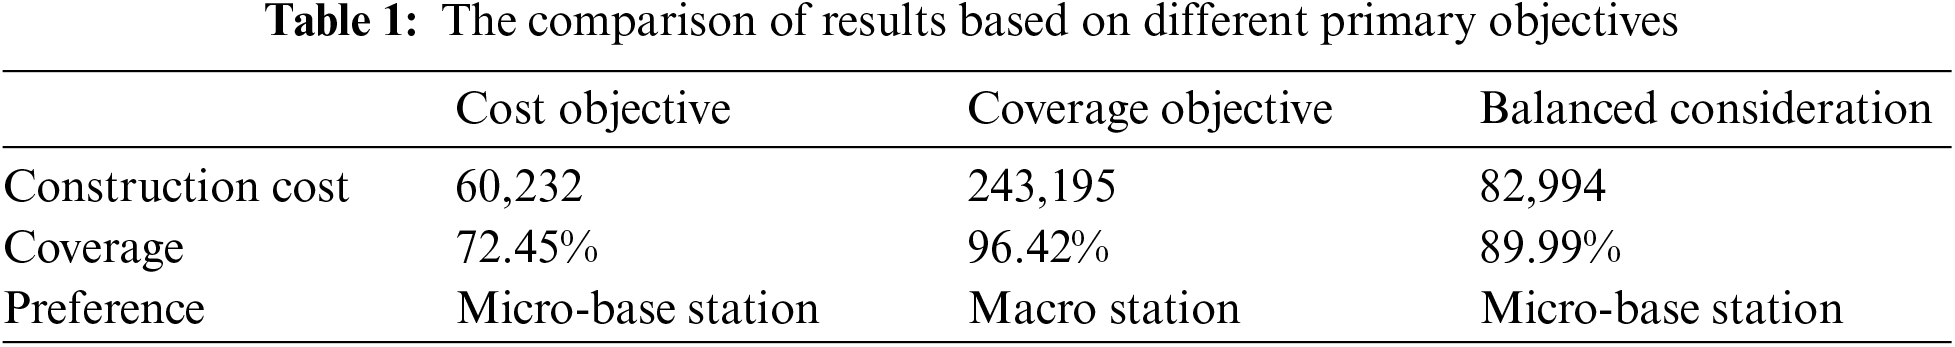
In the three cases, the total traffic reaches 90%. When the cost objective is taken as the main optimization objective, the construction cost is 60,232, which can cover 72.45% weak coverage points, and the proportion of micro-base stations is relatively large. With the coverage objective as the main target, the construction cost is 243,195, which can cover 96.42% of the weak coverage points, and the macro station accounts for more. When the two targets are balanced, the construction cost is 82,994, which can cover 89.99% of the weak coverage points. The comparison results in the three cases are shown in Table 1.
4.3 Simulation Results of Cluster Preprocessing
According to the above steps, we use Python to carry out regional clustering for weak coverage points. The clustering situation is shown in the figure. Through clustering, we get 716 “weak coverage groups”.
In Fig. 8, using the FDBSCAN clustering algorithm, the time complexity consists of two parts. One is to calculate the core point. Neighborhood retrieval is only performed within the scope of adjacent networks, so the time complexity is
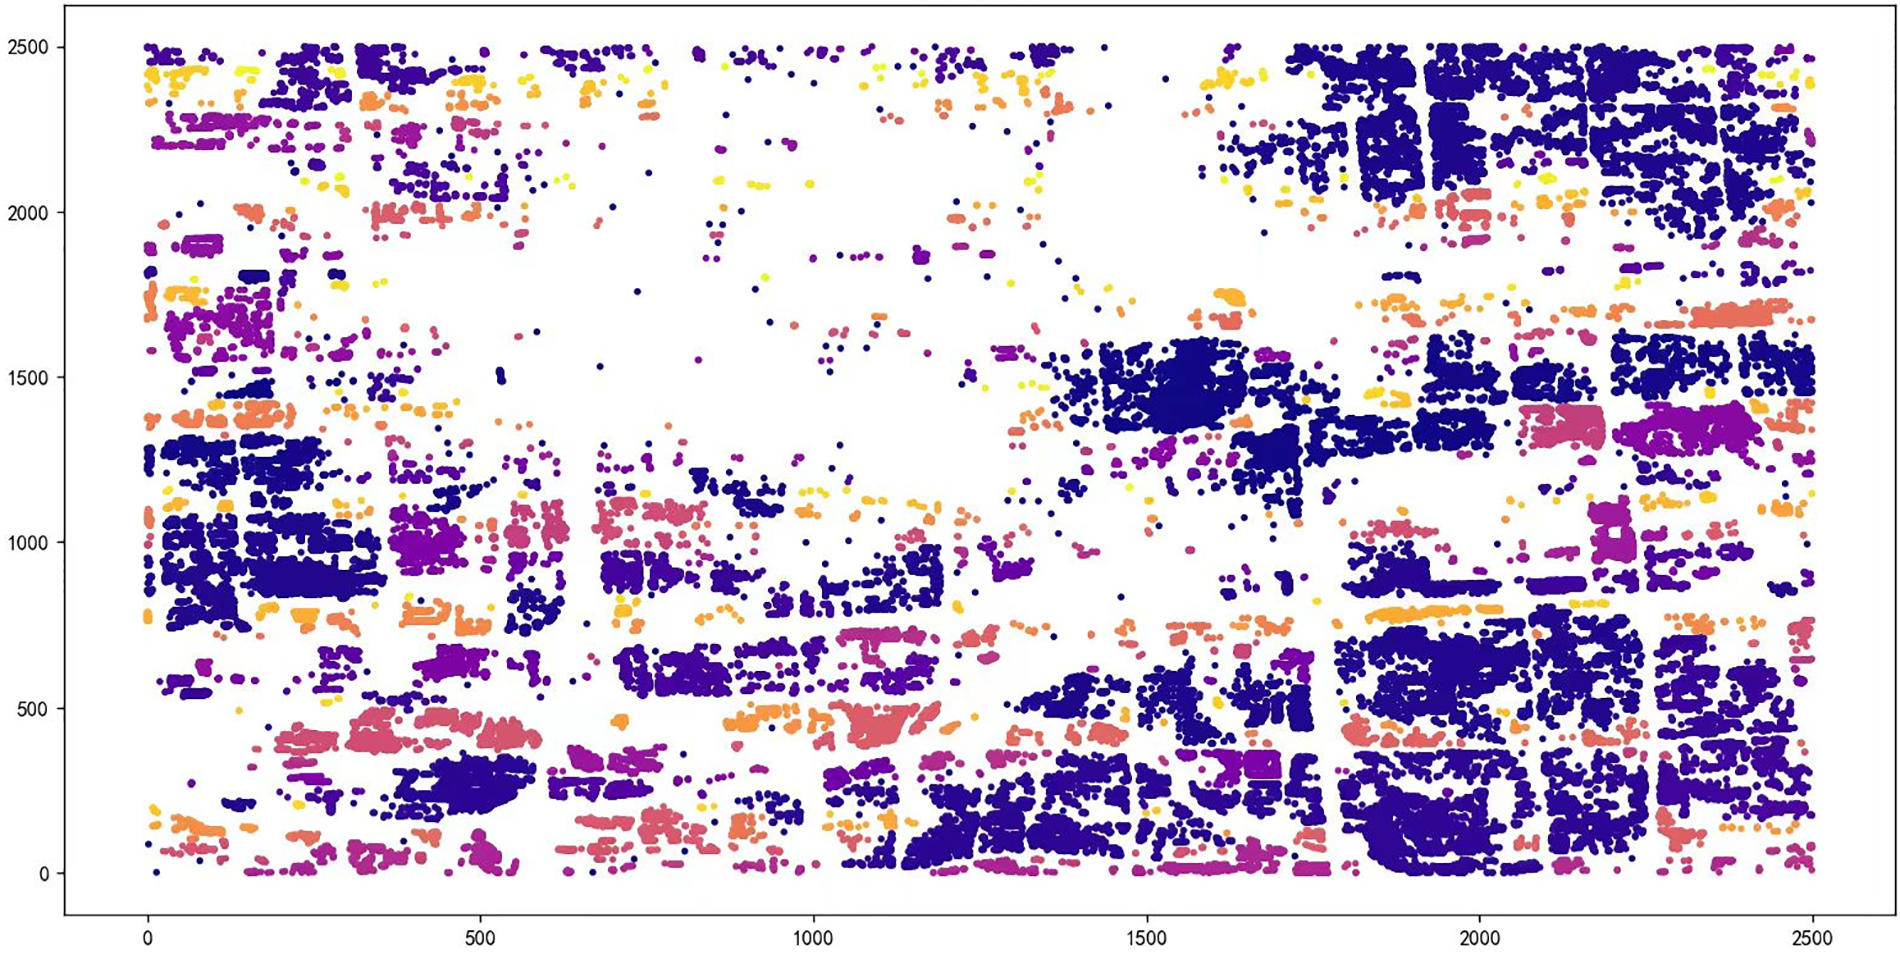
Figure 8: FDBSCAN clustering results
The 716 weakly covered groups obtained by clustering were used as population units to use NSGA for base station planning, and Figs. 9 and 10 were compared with base stations that were directly planned and clustered under the premise of cost objectives. It is observed that the distribution of site planning has not changed greatly, which shows that it is feasible to reduce the time complexity of the operation by clustering for preprocessing.

Figure 9: Results before clustering
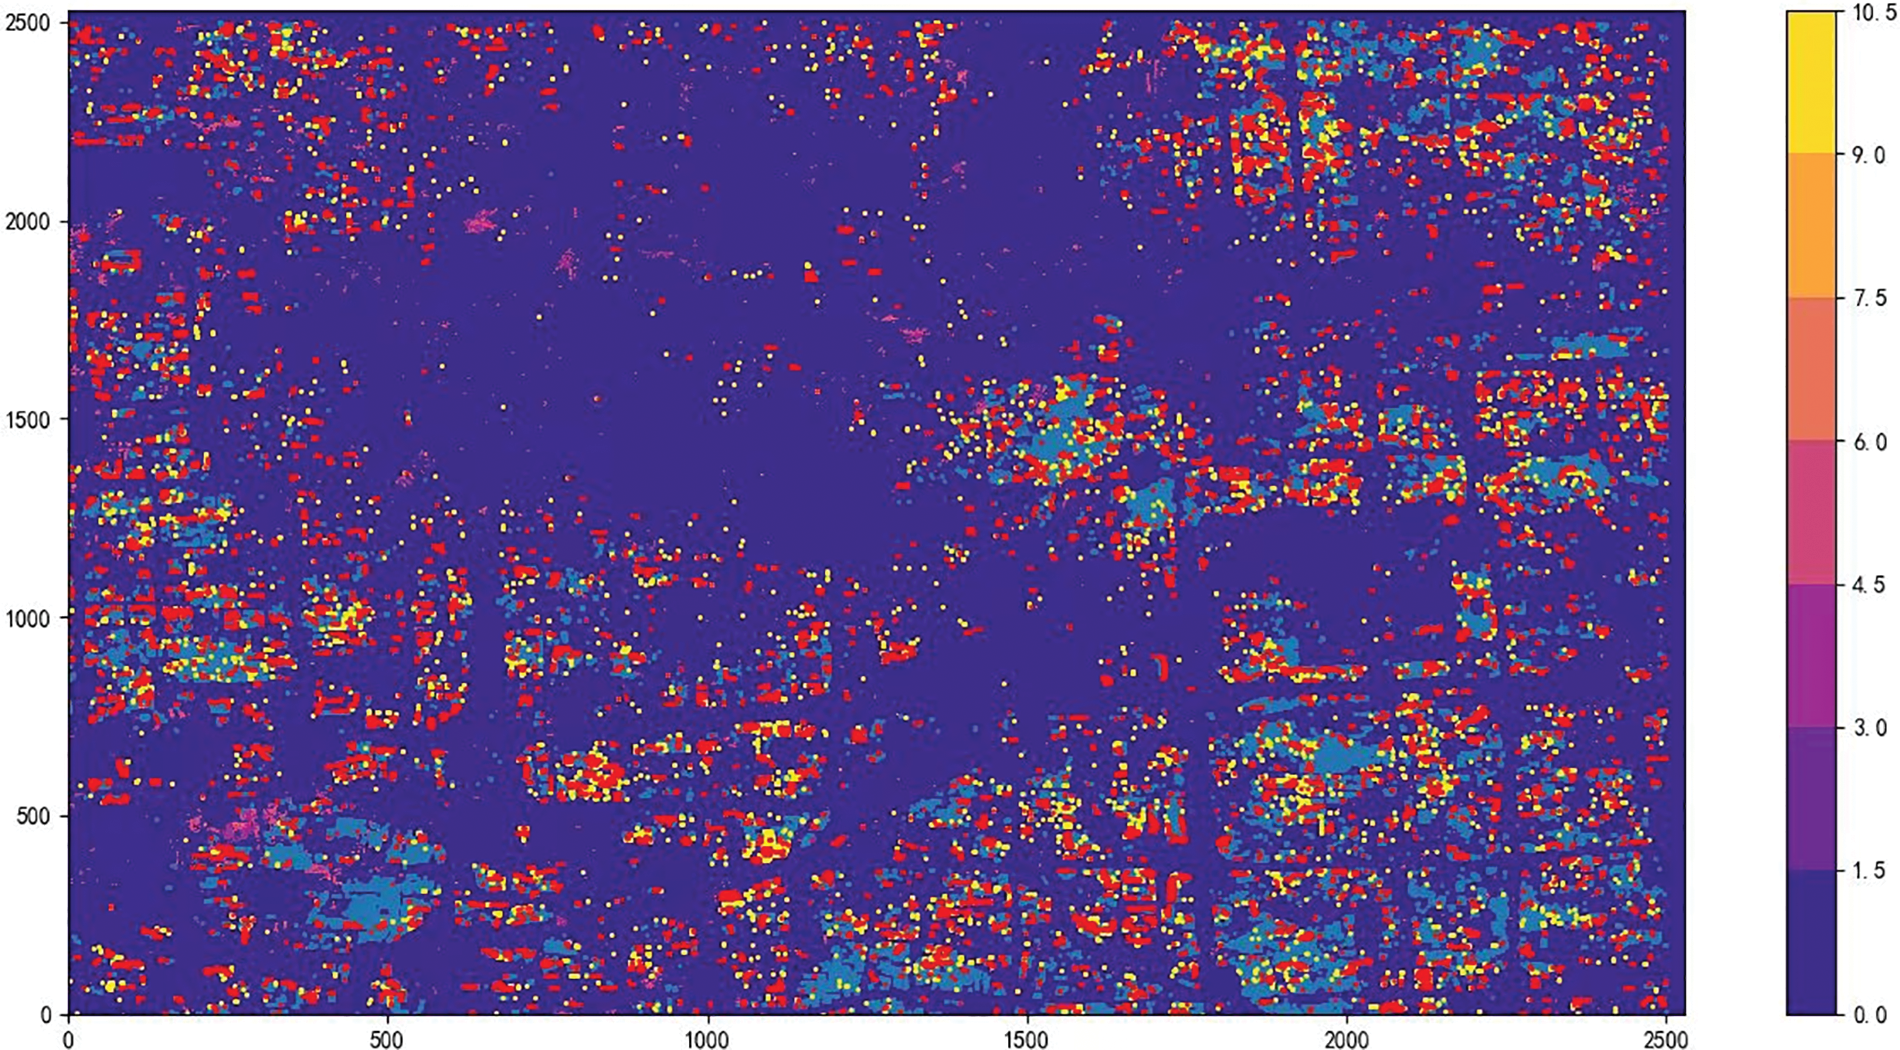
Figure 10: Results before clustering
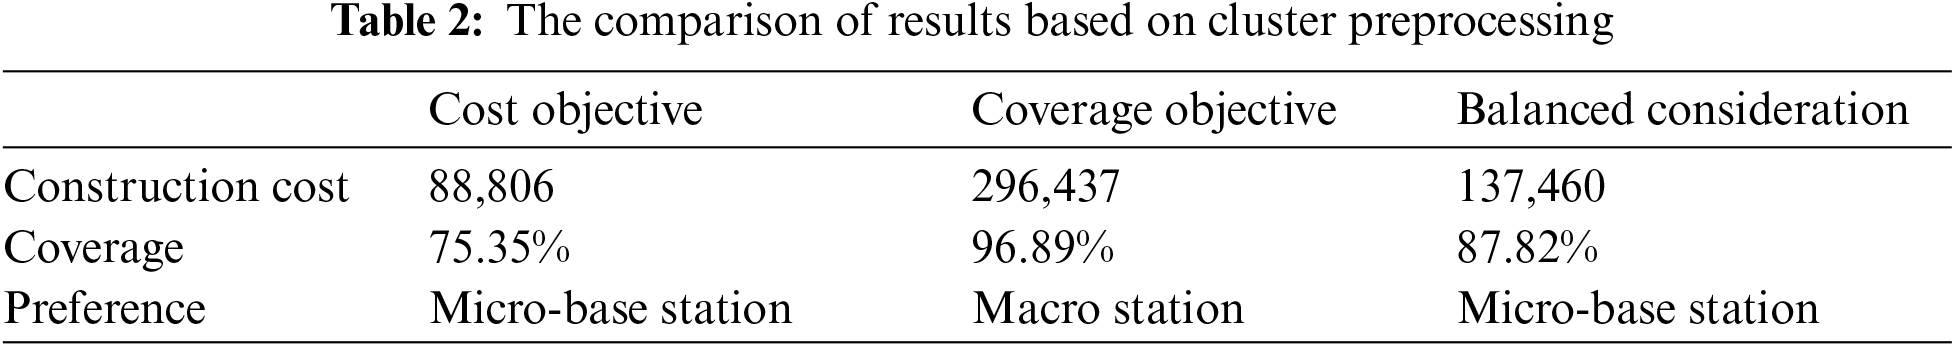
As shown in Figs. 8 and 9, red indicates the establishment location of the micro base station, and yellow indicates the establishment location of the macro base station. Through calculation (see Table 2 for specific results), we found that when selecting different main targets, the selection trend of base station types is similar to the method in Section 4.2. When the cost target is the main optimization target, the construction cost is 88,806, which can cover 75.35% of weak coverage points, and micro base stations account for a relatively large proportion. When the coverage target is the main goal, the construction cost is 296,437, which can cover 96.89% of weak coverage points, with macro base stations accounting for the majority. When the two objectives are balanced, the construction cost is 137,460, which can cover 87.82% of weak coverage points.
Next, consider a more general cellular communications scenario. Assume that each base station has 3 sectors. We try again to solve the problem of base station site planning. Fig. 10 reflects the sector angle situation. Create the first sector with 0 degrees as the positive direction and a sector angle of 120 degrees. And so on for the other 2 sectors. Fig. 11a shows the first sector determined by each base station when using the greedy algorithm to solve the problem. Fig. 11b,c shows the second and third sectors in sequence.
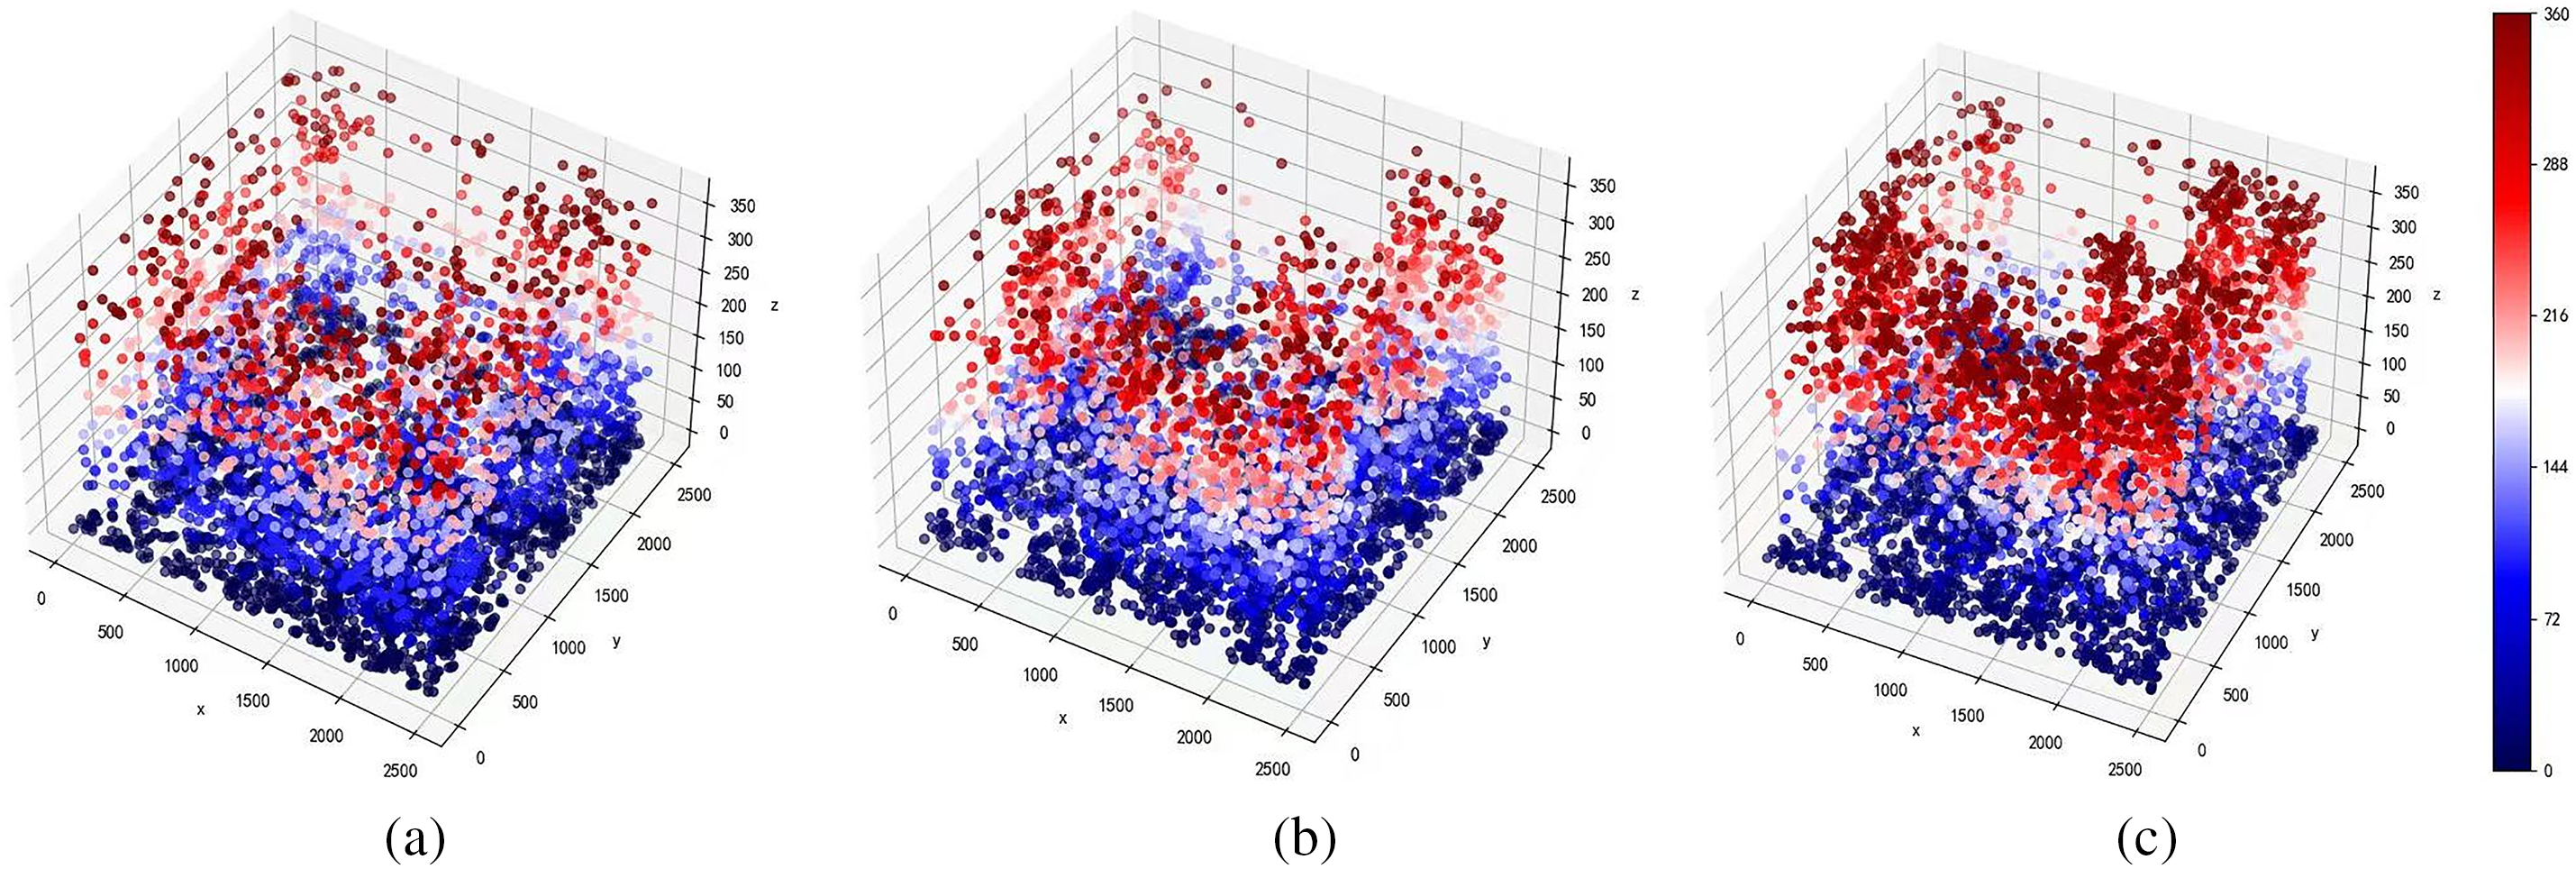
Figure 11: Sector angle distribution diagram
This paper studies the BS site planning problem. In particular, a BS planning method based on genetic algorithm and clustering strategy is proposed. While significantly reducing the computational complexity, it provides an idea for solving practical engineering problems. In the model of this paper, it is assumed that different users in the same vertical space receive the same intensity of communication signals. However, in real life, the personalization of life and work needs leads to different communication needs for different users in the same area, so the planning of BS should be more personalized. In the future, BS site planning issues will be more detailed, and more AI methods such as evolutionary-constrained [26] may be used.
Acknowledgement: Thank you to all those who have contributed to this manuscript.
Funding Statement: The work is supported by Jiangsu Higher Education “Qinglan Project”, an Open Project of Criminal Inspection Laboratory in Key Laboratories of Sichuan Provincial Universities (2023YB03), Major Project of Basic Science (Natural Science) Research in Higher Education Institutions in Jiangsu Province (23KJA520004), Jiangsu Higher Education Philosophy and Social Sciences Research General Project (2023SJYB0467), Action Plan of the National Engineering Research Center for Cybersecurity Level Protection and Security Technology (KJ-24-004), Jiangsu Province Degree and Postgraduate Education and Teaching Reform Project (JGKT24_B036), Digital Forensics Engineering Research Center of the Ministry of Education Open Project (DF20-010), and the Youth Fund of Nanjing Railway Vocational and Technical College (Yq220012).
Author Contributions: Jiahan He and Guangjun Liang conceived and designed the experiments; Meng Li and Kefan Yao performed the experiments; Jiahan He and Bixia Wang analyzed the data; Guangjun Liang and Lu Li wrote the paper. All authors reviewed the results and approved the final version of the manuscript.
Availability of Data and Materials: Data available on request from the corresponding author.
Ethics Approval: Not applicable.
Conflicts of Interest: The authors declare that they have no conflicts of interest to report regarding the present study.
References
1. S. Chen, S. Sun, and S. Kang, “System integration of terrestrial mobile communication and satellite communication—The trends, challenges and key technologies in B5G and 6G,” China Commun., vol. 17, no. 12, pp. 156–171, 2020. doi: 10.23919/JCC.2020.12.011. [Google Scholar] [CrossRef]
2. A. Al-Kinani, C. X. Wang, L. Zhou, and W. Zhang, “Optical wireless communication channel measurements and models,” IEEE Commun. Surv. Tut, vol. 20, no. 3, pp. 1939–1962, 2018. doi: 10.1109/COMST.2018.2838096. [Google Scholar] [CrossRef]
3. Y. Li, J. Dai, Z. Si, and K. Niu, “Unsourced multiple access for 6G massive machine type communications,” China Commun., vol. 19, no. 3, pp. 70–87, 2022. doi: 10.23919/JCC.2022.03.005. [Google Scholar] [CrossRef]
4. I. F. Akyildiz, A. Kak, and S. Nie, “6G and beyond: The future of wireless communications systems,” IEEE Access, vol. 8, pp. 133995–134030, 2020. doi: 10.1109/ACCESS.2020.3010896. [Google Scholar] [CrossRef]
5. H. Huang et al., “Deep learning for physical-layer 5G wireless techniques: Opportunities, challenges and solutions,” IEEE Wirel. Commun., vol. 27, no. 1, pp. 214–222, 2020. doi: 10.1109/MWC.2019.1900027. [Google Scholar] [CrossRef]
6. X. Zhong, C. Fan, and S. Zhou, “Eavesdropping area for evaluating the security of wireless communications,” China Commun., vol. 19, no. 3, pp. 145–157, 2022. doi: 10.23919/JCC.2022.03.010. [Google Scholar] [CrossRef]
7. A. A. Khalek, L. Al-Kanj, Z. Dawy, and G. Turkiyyah, “Site placement and site selection algorithms for UMTS radio planning with quality constraints,” in 2010 17th Int. Conf. Telecommun., Doha, Qatar, Apr. 04–07, 2010, pp. 375–381. [Google Scholar]
8. L. K. Un, C. H. Chio, and S. W. Ting, “Mobile communication site planning in campus using ray tracing,” in 2014 IEEE Antenn. Propag. Soc. Int. Symp. (APSURSI), Memphis, TN, USA, Jul. 06–11, 2014, pp. 959–960. [Google Scholar]
9. I. Akhter, C. Ranaweera, C. Lim, A. Nirmalathas, and E. Wong, “Small-cell network site planning: A framework based on terrain effects and urban geography characteristics,” in 2014 OptoElectr. Commun. Conf. Aust. Conf. Optical Fibre Technol., Melbourne, VIC, Australia, Jul. 06–10, 2014, pp. 422–424. [Google Scholar]
10. L. Jia, W. Zhang, Z. Yang, C. Ma, and M. Chen, “Cell sites planning with minimized power consumption under cell load balancing constraint in LTE networks,” in 2013 Int. Conf. Wireless Commun. Signal Process., Hangzhou, China, Oct. 24–26, 2013, pp. 1–6. [Google Scholar]
11. Z. H. Yang, M. Chen, Y. P. Wen, L. Q. Jia, and Y. Zhang, “Cell planning based on minimized power consumption for LTE networks,” in 2016 IEEE Wireless Commun. Netw. Conf., Doha, Qatar, Apr. 03–06, 2016, pp. 1–6. [Google Scholar]
12. L. Zhang, H. Zhang, P. Ren, X. Cheng, and W. Chen, “A practical 4G sites planning scheme based on 3G multi-dimensional data analysis,” in 2016 16th Int. Symp. Commun. Inf. Technol. (ISCIT), Qingdao, China, Sep. 26–28, 2016, pp. 252–257. [Google Scholar]
13. R. Zhang, W. Xia, F. Yan, and L. Shen, “A single-site positioning method based on TOA and DOA estimation using virtual stations in NLOS environment,” China Commun., vol. 16, no. 2, pp. 146–159, 2019. [Google Scholar]
14. S. Rahmatia, D. Martin, M. Ismail, O. Samijayani, and R. Safitri, “Automatic cell planning of LTE FDD, 1800 MHz network in Klaten, Central Java,” in 2020 Int. Conf. Electr., Commun., Comput. Eng. (ICECCE), Istanbul, Turkey, Jun. 12–13, 2020, pp. 1–6. [Google Scholar]
15. L. B. Kang, “Research on 5G base station site planning strategy,” Electr. World, vol. 622, no. 16, pp. 9–10, 2021. [Google Scholar]
16. L. H. Yan, W. P. Guo, and D. H. Xu, “Site planning method based on NSGA-algorithm,” App. Res. Comput., vol. 39, no. 1, pp. 226–235, 2022. [Google Scholar]
17. Y. Ding and S. F. Chai, “5G base station site deployment based on particle swarm optimization algorithm,” Commun. Technol., vol. 52, no. 10, pp. 2424–2427, 2019. [Google Scholar]
18. J. Zhang, L. Wei, Z. Guo, H. Sun, and Z. Hu, “A survey of meta-heuristic algorithms in optimization of space scale expansion,” Swarm Evol. Comput., vol. 84, no. 1, pp. 101462–101480, 2024. doi: 10.1016/j.swevo.2023.101462. [Google Scholar] [CrossRef]
19. N. Aslam et al., “Neuro-computing solution for Lorenz differential equations through artificial neural networks integrated with PSO-NNA hybrid meta-heuristic algorithms: A comparative study,” Sci. Rep., vol. 14, no. 1, pp. 7518–7524, 2024. doi: 10.1038/s41598-024-56995-2. [Google Scholar] [PubMed] [CrossRef]
20. J. W. Luo et al., “Accelerated genetic algorithm based on real number coding for solving mobile communication network site planning,” Academic J. Comput. Inf. Sci., vol. 6, no. 7, pp. 124–130, 2024. [Google Scholar]
21. A. M. Maia, Y. Ghamri-Doudane, D. Vieira, and M. Castro, “An improved multi-objective genetic algorithm with heuristic initialization for service placement and load distribution in edge computing,” Comput. Netw., vol. 194, no. 20, pp. 108146.1–108146.15, 2021. doi: 10.1016/j.comnet.2021.108146. [Google Scholar] [CrossRef]
22. X. Yu, Y. Liu, and Y. Liu, “Optimization of WSN localization algorithm based on improved multi-strategy seagull algorithm,” Telecommun. Syst., vol. 1, no. 1, pp. 1–12, 2024. doi: 10.1007/s11235-024-01137-2. [Google Scholar] [CrossRef]
23. M. Zuo, D. Gong, Y. Wang, X. Ye, B. Zeng and F. Meng, “Process knowledge-guided autonomous evolutionary optimization for constrained multiobjective problems,” IEEE Trans. Evol. Comput., vol. 28, no. 1, pp. 193–207, 2024. doi: 10.1109/TEVC.2023.3243109. [Google Scholar] [CrossRef]
24. G. Gu and G. Peng, “The survey of GSM wireless communication system,” in 2010 Int. Conf. Comput. Inf. App., Tianjin, China, Dec. 03–05, 2010, pp. 121–124. [Google Scholar]
25. J. Chen, C. Zhao, and K. Zhang, “Urban hotspots mining based on improved FDBSCAN algorithm,” in J. Phys.: Conf. Series, Xi’an, Shaanxi, China, May 21–24, 2020, vol. 1584, no. 1, pp. 012072. [Google Scholar]
26. J. Liang, X. Ban, K. Yu, B. Qu, K. Qiao and C. Yue, “A survey on evolutionary constrained multiobjective optimization,” IEEE Trans. Evol. Comput., vol. 27, no. 2, pp. 201–221, 2022. doi: 10.1109/TEVC.2022.3155533. [Google Scholar] [CrossRef]
Cite This Article
 Copyright © 2024 The Author(s). Published by Tech Science Press.
This work is licensed under a Creative Commons Attribution 4.0 International License , which permits unrestricted use, distribution, and reproduction in any medium, provided the original work is properly cited.
 Downloads
 Citation Tools