
 Submit a Paper
 Propose a Special lssue
 Open Access
ARTICLE
Enhancing Indoor User Localization: An Adaptive Bayesian Approach for Multi-Floor Environments
1 Center for Artificial Intelligence and Robotics (CAIRO), Malaysia-Japan International Institute of Technology, Universiti Teknologi Malaysia, Kuala Lumpur, 54100, Malaysia
2 Department of Electrical Engineering, College of Engineering, Imam Mohammad Ibn Saud Islamic University (IMSIU), Riyadh, 11432, Saudi Arabia
3 Department of Information Engineering, Electronics and Telecommunications, Sapienza University, Rome, 00185, Italy
* Corresponding Author: Abdulraqeb Alhammadi. Email:
Computers, Materials & Continua 2024, 80(2), 1889-1905. https://doi.org/10.32604/cmc.2024.051487
Received 06 March 2024; Accepted 14 June 2024; Issue published 15 August 2024
 View Full Text
 Download PDF
Abstract
Indoor localization systems are crucial in addressing the limitations of traditional global positioning system (GPS) in indoor environments due to signal attenuation issues. As complex indoor spaces become more sophisticated, indoor localization systems become essential for improving user experience, safety, and operational efficiency. Indoor localization methods based on Wi-Fi fingerprints require a high-density location fingerprint database, but this can increase the computational burden in the online phase. Bayesian networks, which integrate prior knowledge or domain expertise, are an effective solution for accurately determining indoor user locations. These networks use probabilistic reasoning to model relationships among various localization parameters for indoor environments that are challenging to navigate. This article proposes an adaptive Bayesian model for multi-floor environments based on fingerprinting techniques to minimize errors in estimating user location. The proposed system is an off-the-shelf solution that uses existing Wi-Fi infrastructures to estimate user’s location. It operates in both online and offline phases. In the offline phase, a mobile device with Wi-Fi capability collects radio signals, while in the online phase, generating samples using Gibbs sampling based on the proposed Bayesian model and radio map to predict user’s location. Experimental results unequivocally showcase the superior performance of the proposed model when compared to other existing models and methods. The proposed model achieved an impressive lower average localization error, surpassing the accuracy of competing approaches. Notably, this noteworthy achievement was attained with minimal reliance on reference points, underscoring the efficiency and efficacy of the proposed model in accurately estimating user locations in indoor environments.Keywords
Indoor localization systems play a pivotal role in helping address the limitations of traditional global positioning system (GPS) in indoor environments. Indoor localization systems play an integral part in providing viable navigation alternatives that overcome traditional GPS’s shortcomings for indoor navigation purposes. These systems can be categorized into a group of general/traditional localization techniques, a group of short-range wireless technologies that depend on the general techniques, and also emerging optimization techniques.
Many traditional localization techniques, such as angulation, proximity sensing, dead reckoning, lateration, fingerprinting, and hybrid approaches, are used to navigate objects in either indoor or outdoor environments [1]. Angulation and lateration are two techniques to determine the target position based on forming triangles from known points to the target. The former is a distance-based method that uses the time of arrival (TOA) way, and received signal strength, whereas the latter is a direction-based method that uses the angle of arrival (AOA) way. Angulation requires at least two available access points (APs) while lateration accuracy is reduced in an obstacle’s environment. The proximity sensing technique uses the coordinates of APs to determine the mobile location. It is a simple, cheap, and straightforward scheme to evaluate the span of mobile relative to AP location. However, the accuracy of this technique is limited to radio coverage of APs.
Dead reckoning (DR) uses sensors within an inertial measurement unit (IMU) to track movement. The main advantage of DR is its simplicity of distance; however, it suffers from accumulative errors. Regarding the fingerprinting technique, it consists of two phases (offline and online (radio map) phases) to collect received signal strength and compare them, and then determine the closest required location. The fingerprinting accuracy increases as the number of used APs increases. However, more reference points (RPs) highly raise labor work costs, in addition, this scheme requires regular radio map updates. Concerning hybrid approaches, two or more of the abovementioned positioning techniques can be combined to improve accuracy. Some combinations provide more accuracy than others for example, the combination of proximity sensing with other techniques is much more inaccurate than lateration or angulation.
In addition to the general techniques mentioned above, some technologies that depend on the general techniques can be grouped into short-range indoor localization wireless technologies which are used for tracking and navigating objects and humans. These technologies are either radio-based technologies such as Wi-Fi, Bluetooth, RFID, and ZigBee, or non-radio-based technologies such as visible light communication (VLC) [2]. These wireless technologies utilize various communication protocols and signal strength to offer precise positioning information in various indoor environments. However, RF-based technologies suffer from poor control accuracy in the areas with multi-devices due to the low positioning accuracy of meter level. Whereas, although the VLC method is characterized by long-life expectancy, immunity to humidity, low power consumption, low cost, and high speed modulated signals, VLC suffers from strict line of sight (LOS) requirements.
Besides, emerging optimization techniques do not depend only on general techniques but also on algorithms and artificial intelligence (AI). It includes machine learning (ML), deep learning, and particle swarm optimization (PSO), which are revolutionizing navigation to optimize and improve localization accuracy. For instance, ML represents an impressive solution in indoor localization systems [3]. Initially, fingerprinting involves creating an individual “fingerprint” of an indoor radio frequency environment by collecting and analyzing signal strength data from sources, such as Wi-Fi APs or Bluetooth low energy (BLE) beacons located throughout an environment [4]. This signature can then be mapped. ML algorithms then utilize these fingerprints to interpret and learn from them, enabling a system to predict user locations based on observed signal characteristics [5]. One key benefit of fingerprinting techniques is their ability to accommodate complex signal propagation patterns within indoor spaces, allowing more precise indoor localization. Several algorithms require the computation of the covariance matrix to analyze the data in a dataset. The covariance matrix is a mathematical matrix that summarizes the variances and covariances within a set of vectors, offering valuable insights into the relationships between variables. In order to do the tasks mentioned, a larger dataset is required. Additionally, every ML model must undergo validation and testing, necessitating another set of datasets. Therefore, a large dataset is necessary.
Bayesian networks allow the integration of prior knowledge or domain expertise into the model, especially when data is limited. Incorporating prior information helps make more informed predictions, compensating for the scarcity of data [6]. Bayesian inference represents an effective solution for accurately determining indoor user locations. Through Bayesian inference, this system utilizes probabilistic reasoning to model relationships among various localization parameters for indoor environments that are challenging to navigate and provide an effective navigation solution [7]. A network of sensors connected by Wi-Fi APs or other wireless signals is used in an offline calibration phase to gather data for analysis. These data, including received signal strength (RSS) measurements, are then utilized to generate a detailed radio map, which serves as the foundation for creating the Bayesian network. In the online phase, Bayesian networks adaptively respond to changing environmental conditions by employing the Markov Chain Monte Carlo (MCMC) sampling technique to estimate user locations.
Indoor localization methods based on Wi-Fi fingerprints require the creation of a high-density location fingerprint database to meet high-precision positioning requirements; however, when dealing with large areas or an increase in RPs, the computational burden of the online phase will increase significantly. To address both of these problems, we propose a Bayesian model for a multi-floor environment based on the fingerprinting technique. This article presents a comprehensive effort aimed at minimizing the error in estimating user location and reducing RPs in multi-floor environments. The contributions can be summarized as follows:
1. Proposing an adaptive Bayesian graphical model utilizing Wi-Fi deployment tailored for multi-floor environments to achieve accurate estimation of the user’s location.
2. Utilizing a sample clustering algorithm to diminish the database size for estimating the user’s location in the online phase.
3. Investigating and evaluating the proposed model with various factors: number of APs, number of iterations, and initial values.
The remaining parts of this paper are structured as follows. Section 2 provides a brief review of related work. Section 3 presents the proposed Bayesian model and explains the utilized clustering algorithm. Section 4 presents real experiments conducted to test the proposed model and discusses the results before concluding its assessment in Section 5.
This section examines the ever-evolving landscape of indoor localization systems, covering methods like Wi-Fi and Bluetooth positioning, fingerprinting techniques, and other applications. The work in this section serves as the cornerstone for research efforts. It illustrates its dynamic nature-driving us toward significant contributions in an emerging field like indoor localization research.
In [6,8,9], researches focused on technologies of Wi-Fi and Bluetooth for indoor positioning. As popular indoor localization techniques, these technologies leverage existing wireless infrastructure. Study in [6] has explored using Wi-Fi signal strength for 3D indoor positioning, often relying on Bayesian networks to process the data. Experiments were conducted using fingerprinting techniques, which collect received signal strength indicators from each AP during an offline training phase and then use this information in the online localization phase, can effectively estimate user location data. In [8], only one fixed AP is used with non-reconfigurable antennas, and no complex algorithms to measure RSS are employed. The algorithm measured RSS and mapped it back to an approximate location within a room by estimating RSS from direct LOS signals and first-order reflection signals off walls and surfaces. In [9], an indoor positioning system utilizing a k-means clustering algorithm (KLIP) is introduced for better characterizing indoor environments and further advancing position estimation using Bayesian inference. Large-scale real-world scenarios composed of Bluetooth low-energy-enabled devices are demonstrated.
In [10–14], data analysis and advanced Wi-Fi Techniques are presented, in which, it is shown that analyzing collected Wi-Fi data can provide valuable insights for improving localization accuracy. The research in [10] identified distinct power distribution models for Wi-Fi devices based on their environment (closed, open, and hybrid spaces). This analysis also explored the potential of service set identifier (SSID) as a reliable landmark for APs. The work also introduced an algorithm for tracking user movement based solely on the SSID information. Beyond basic signal strength, some studies explore more advanced Wi-Fi techniques. For instance, the system in [11] utilizes multipath signals (often considered noise) to estimate target location by building a geometric model and employing a PSO algorithm. The proposed system differs from conventional localization algorithms, which view multipath signals as enemies by employing only one receiver. It built a geometry model for jointly estimating locations of targets and scatterers, such as furniture using time of flight differences between reflection paths and direct path, followed by developing an algorithm utilizing PSO. The authors in [12] utilized the RSS channel model with the PSO algorithm to design an indoor target localization system in wireless sensor networks. Eight method combinations using random or regular points with fixed or adaptive weights and region segmentation methods are investigated with this PSO algorithm for target localization/tracking of 12, 24, 52, 72, and 100 particles each time. In another study [13], the researcher used a PSO algorithm for Wi-Fi fingerprint-based indoor localization, employing a new two-panel fingerprint homogeneity model to characterize fingerprint similarity to achieve improved performance. Furthermore, experimental verification is carried out to demonstrate how effectively the localization method operates. Accuracy in Wi-Fi-based indoor localization is severely limited by signal instability. To overcome this limitation, the authors in [14] introduced an interval random analysis approach for uncertain Wi-Fi localization that employs an interval random parameter lognormal shadowing model for radio map enhancement and adaptive Bayesian comprehensive learning PSO for location estimation accuracy enhancement.
As alternative techniques and network options, studies in [15–17] have been carried out. In [15], the authors compared two main localization techniques, fingerprints (real and synthetic) and ranging schemes, to identify likely locations. They also investigated four localization techniques (k-nearest neighbor (KNN), trilateration, multilayer perceptron, and long short-term memory recurrent neural network for indoor localization tasks using ZigBee networks: RSS indicator (RSSI). Tian et al. [16] proposed a location and tracking system using a single Wi-Fi link based on channel state information capable of real-time decimeter-level localization. Phase calibration and static path elimination are accomplished by multiplying conjugate signals of different antennas; three-dimensional multiple signal classification (MUSIC) algorithms are utilized to estimate the angle of arrival, time of flight, and velocity estimations. In [17], the researchers presented a Wi-Fi based passive indoor positioning system that does not require active user involvement or additional interfaces on devices under test. Properly deploying Wi-Fi Sniffers within their area of interest is of utmost importance to optimize system accuracy. They proposed a modified Genetic Algorithm with an enhanced objective function to optimize deployment. These Wi-Fi Sniffers are used to quickly scan and collect RSSIs of devices under test as Wi-Fi fingerprints; these fingerprints are then mapped onto RPs in the physical world using weighted KNN methods for positioning.
3 Proposed Bayesian Model and Clustering Algorithm
Structure of the proposed Bayesian model is determined based on the dependencies and relationships between different variables in the indoor localization system. It is typically determined based on domain knowledge and empirical observations. For example, the RSS from an AP is likely to depend on the user’s location and the floor index, so these variables are connected in the Bayesian network. In this study, openBUGS software was utilized, employing MCMC sampling techniques for estimating the posterior distribution [18].
The proposed model consists of several nodes, including floor attenuation factor (FAF). Including FAF within the model showcases our commitment to account for the intricacies of signal attenuation across different floors, contributing to a more accurate and robust indoor localization system. The proposed model draws inspiration from the first Bayesian network [19] and adaptive Bayesian [20], and the proposed model contains seven main nodes, including AP coordination (x, y), user location (x, y), sharing location, RSS, Euclidean distance, testbed dimension and FAF. Each node plays a pivotal role in capturing the complex dynamics of indoor environments. Fig. 1 illustrates this proposed Bayesian network designed for indoor localization using wireless local-area network (WLAN) technology.
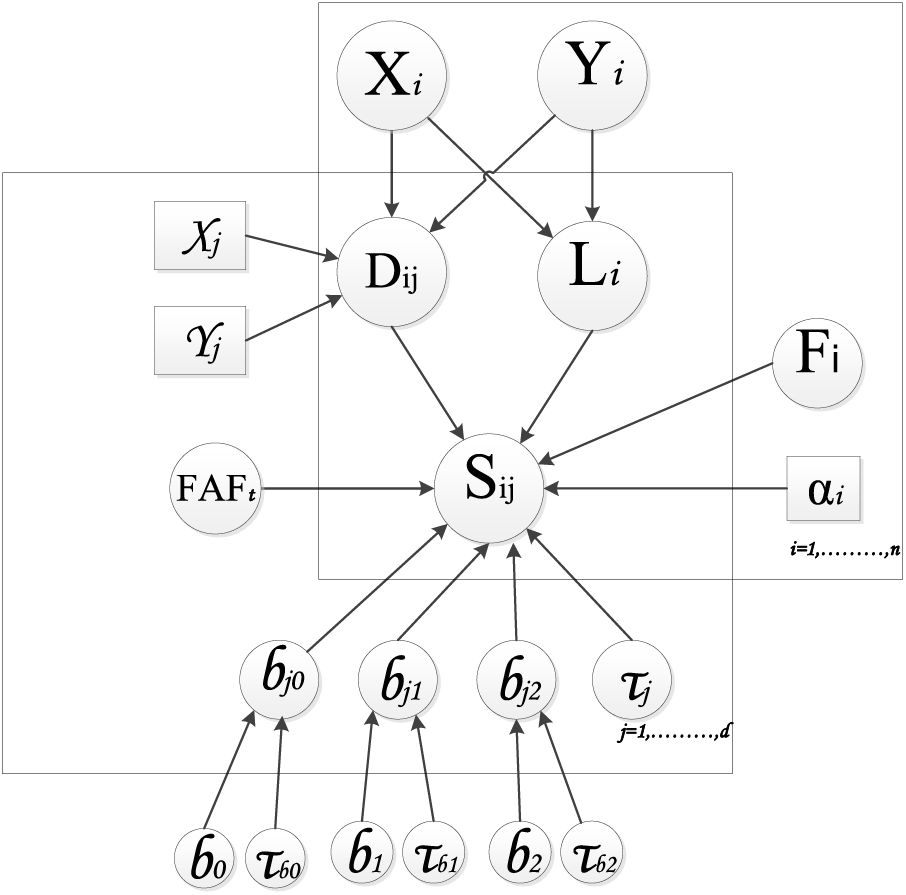
Figure 1: Proposed Bayesian graphical model
The (
User location (
APs location (
Euclidean distance Dij: it is a continuous stochastic node, which serves as a fundamental measure in the proposed model, capturing the geometric proximity between the user and the respective APs’ locations, and it is given by the following equation:
By considering Euclidean distance, this model can evaluate physical distances between users and each AP-providing invaluable data for indoor localization with WLAN technology. Assuming a multi-floor environment has an RSS of normal distribution, and its Euclidean distance will represent lognormal distribution, one is added as the additional factor to avoid an invalid log function argument value.
Sharing location
RSS
Floor Level
Binary node
In the OpenBUGS framework, where a discrete distribution is not available, we employed the categorical distribution to model
Initial values: For the initial values of our parameters, we follow a strategy where each parameter
.
.
.
A signal space clustering algorithm is used to reduce radio map size which was introduced in [21]. Clusters often include many RPs, which lead to an increase in map size; therefore, the signal space clustering algorithm provides a solution by merging adjacent points together and depending on the signal space distance between two points within a radio map as specified by Manhattan distance Eq. (14) as part of this clustering technique. The choice of using the Manhattan distance in the clustering algorithm is primarily due to its suitability for high-dimensional spaces, such as the signal space in indoor localization systems. It calculates the distance between two points as the sum of the absolute differences of their coordinates. This makes it particularly effective in high-dimensional spaces where Euclidean distance can be less discriminative due to the “curse of dimensionality”.
where
where M is the number of APs, and Sij is the RSS at point jth measured from APth.
Calculate the two distances between three points:
where
where
The following pseudocode provides a step-by-step description of the signal space clustering algorithm. The result is a reduced radio map that preserves the essential characteristics of the signal space while reducing its size for more efficient computation.
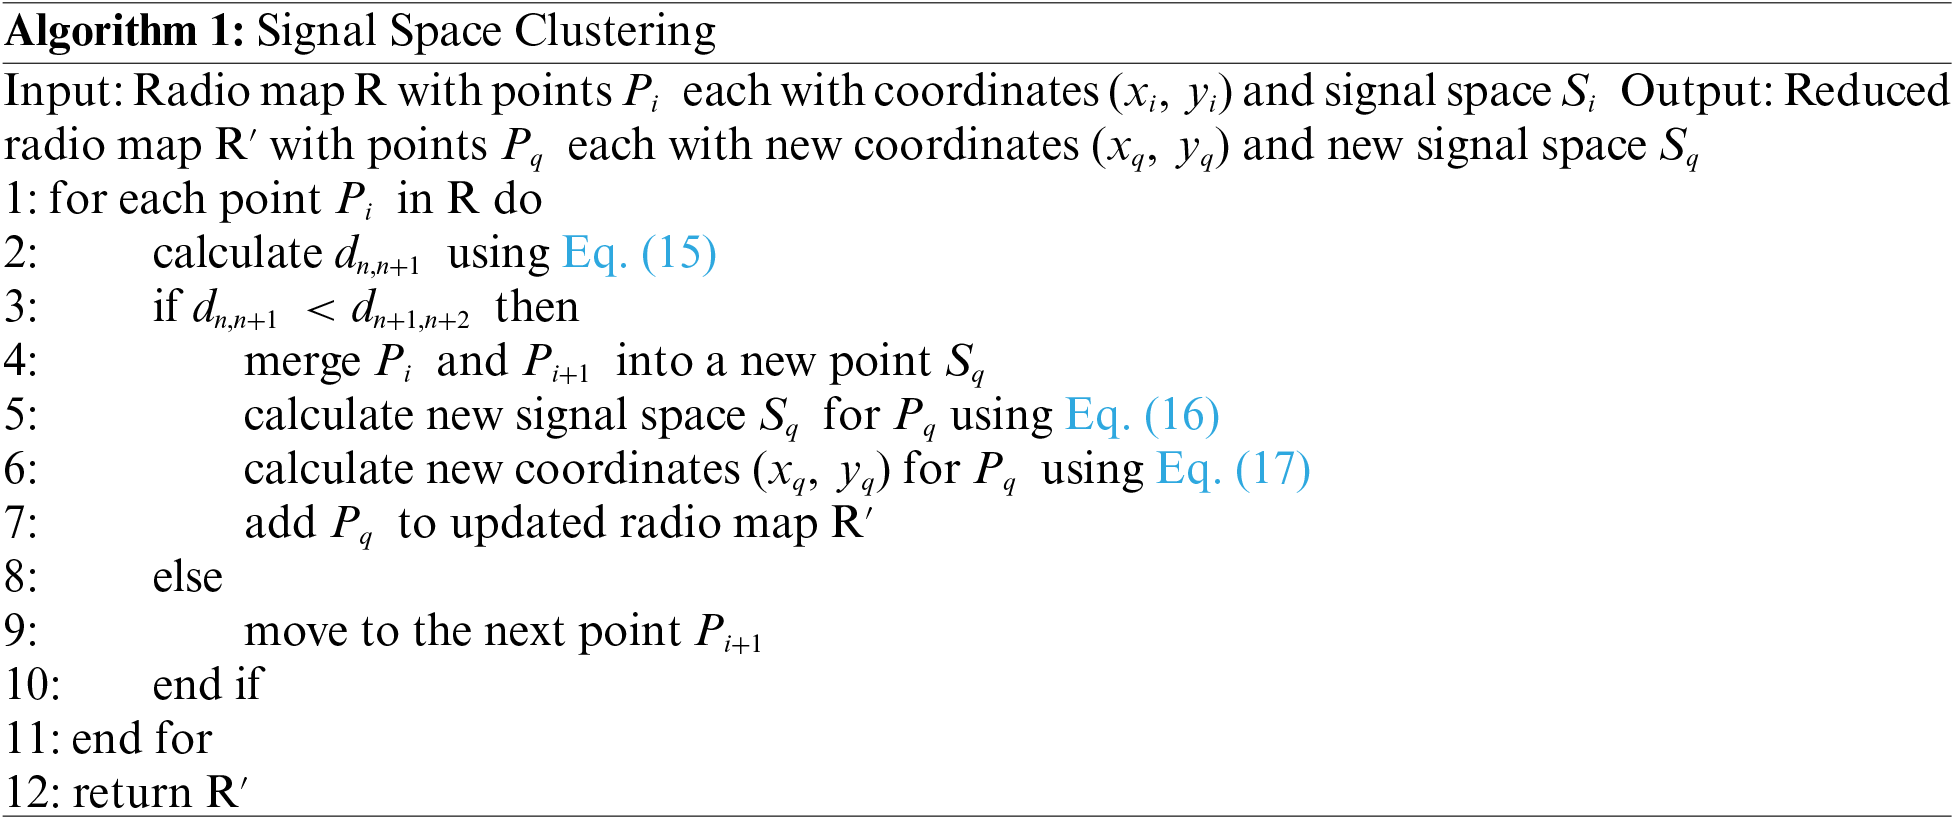
The complexity analysis reveals that the algorithm’s time complexity is influenced by the number of points in the radio map, with calculations taking O(n2) time, and space complexity being O(n). Thus, the algorithm reduces the radio map size by merging adjacent points, potentially enhancing computational efficiency during online phases. Besides, the algorithm can be resilience to noise and outliers, which is attributed to its utilization of the Manhattan distance metric.
4 Experimental Implementation and Analysis
Measurement experiments were conducted on both the ground floor and first floor of a multi-floor building, covering an area with dimensions of 52 × 22 square meters. To facilitate wireless connectivity, eight APs operating at a frequency of 2.4 GHz were strategically positioned, with four APs on each floor. The 2.4 GHz has a longer range, compared to 5.2 GHz, which is often used due to its wider coverage and ability to penetrate obstructions. The building features concrete and glass outer walls, and some internal walls are constructed with plaster partition boards. Fig. 2 shows the ground and first-floor structure. The APs were deployed at different locations throughout the building to emphasize diverse placements. The final AP locations were chosen based on optimizing signal coverage to encompass most areas on each floor. Symmetrically distributing the APs has been found, through previous investigations, to minimize the error in determining user location.

Figure 2: Floor plan: ground and first floor
In the offline phase, the Wi-Fi scanner initiates a search for available APs and records data at each reference point. The collected data consists of 30 samples obtained through a 360-degree rotation at one-second intervals for each AP. Once all necessary information is gathered, a radio map is constructed for online use. This radio map is developed by collecting RSS for each coordinate of the RPs on both the ground and first floors.
The proposed Bayesian model is implemented using the OpenBUGS software during the online phase. This software employs Bayesian inference through Gibbs sampling to estimate the user’s location. The estimation relies on the posterior distribution generated using the MCMC sampling technique.
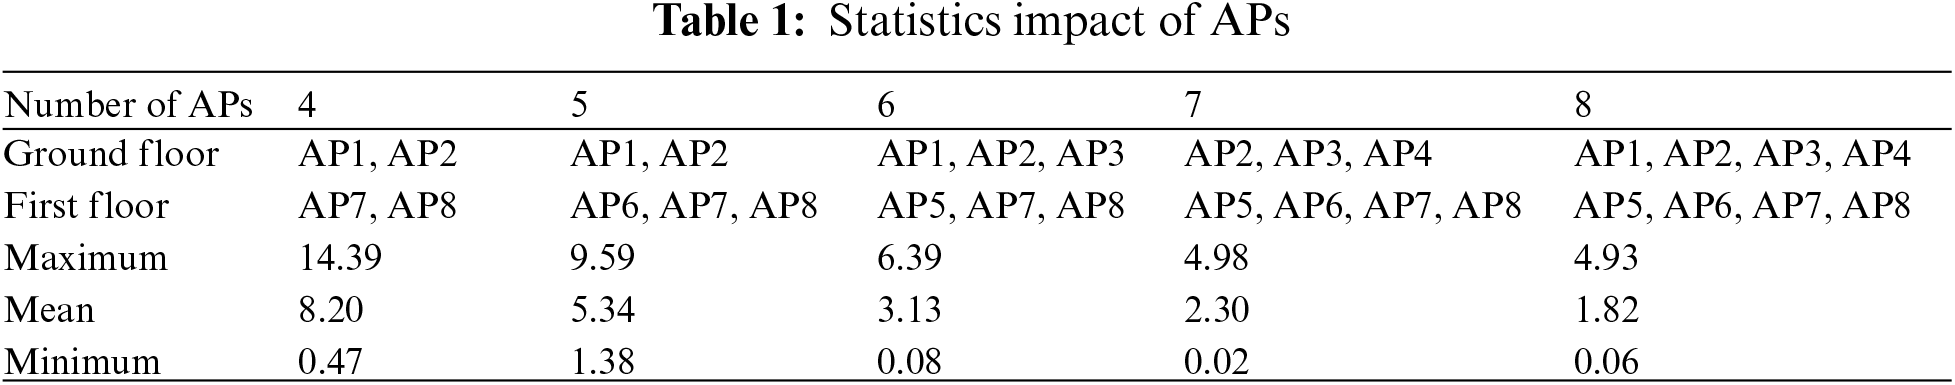
The comprehensive radio map includes all calibration locations measured on both floors. Therefore, to get accurate estimations in a multi-floor environment, FAF clustering is utilized to address the limitations of FAF. The system’s accuracy depends on the FAF, which varies across places. RSS could impact FAF, which is associated with signal propagation. FAF was measured at three different places (right side, corridor center, and left side) for both building floors. The measurements were taken at vertically aligned and symmetrical places, gathering 500 samples at a rate of one sample per second. FAF is determined using Eq. (19). Table 1 displays the three places categorized according to their FAF as: right side, left side, and corridor of the building.
where
A marked variance in FAF was noticed across different locations and floor levels within the building. To account for these variations and provide an optimal experimental setup, an average FAF value of 35 dB was considered in this study.
Accurate evaluation of indoor localization errors is vital to improving positioning systems and increasing the overall reliability of location-based services. Localization error (LE) refers to the difference between the predicted location
These formulas quantify the accuracy of the localization system by measuring the spatial discrepancies between predicted and actual locations, offering a comprehensive assessment of performance across multiple TP.
The mobile user’s location is inferred using OpenBUGS, employing a Bayesian network and Gibbs sampling. The user’s location, represented as (Xi, Yi, Fi), is denoted as NA in the radio map, signifying the location to be estimated. Fig. 3 visually presents an example of posterior probability density function of three variables: “Xi” in Fig. 3a, “Yi” in Fig. 3b, and “Fi” in Fig. 3c for the tenth sequence point (X (10), Y (10) and F (10)) in the radio map. A posterior distribution that resembles a bell-shaped curve suggests that the Monte Carlo (MC) chain has reached convergence. In other words, the three random variables are converged at a specific level, indicating that creating samples of over 100,000 iterations does not yield significant findings.

Figure 3: Tracing three variables of a predicted location (a) X (10), (b) Y (10), and (c) F (10)
Fig. 4 shows the estimated positions of three random variables corresponding to an unknown location, denoted as (X (10), Y (10), and F (10)), which are depicted based on node statistics. For F (10), the percentiles, including the 2.5th and 97.5th, along with the mean and median, all align at 1.0, reinforcing the consistent estimation. The start value, sample size, and lack of deviation in the standard error contribute to the robustness of these findings. Moving to variable X (10) and variable Y (10), representing the estimated X and Y coordinates, respectively, we observe similarly insightful results. The mean values of approximately 36.49 for X (10) and 8.7 for Y (10) provide central tendencies for the estimated positions. The standard deviations of approximately 2.682 and 2.435 for X (10) and Y (10) signify the dispersion of the estimated coordinates. However, variable F (10) represents the estimated floor level with the mean and standard deviations of approximately 1 and 0.0298, respectively.

Figure 4: Statistics prediction of unknown location
The MC error measures the statistical error or uncertainty associated with estimates obtained through MC simulations. It provides an estimate of the standard error of the sample mean, which reflects how much the sample mean is expected to vary across different samples drawn from the same distribution. Lower MC errors suggest more precise and reliable estimates.
Additionally, the figure illustrates both the precise and approximated positions of these three random variables, providing a visual comparison. The distance error of a single training data point is also displayed, offering insights into the accuracy and effectiveness of the estimation process. This comprehensive visualization facilitates a better understanding of the model’s performance in estimating the user’s location. The estimated location results were obtained by running an MC simulation for 100,000 iterations with initial 10,000 iterations of generated samples were designated as the burn-in period. Variable X (10) has an estimated position with a distance error of 0.51 centimeter, whereas variable Y (10) has a distance error of 1.3 m. Variable F (10) has an actual location with a 0 distance error.
4.2.1 The Effects of the Proposed Model
Number of APs: The number of APs dramatically impacts LE in a multi-floor environment. To investigate its effects, a random selection of two or three APs on each floor was undertaken before gradually increasing them up to four per floor, as seen in Table 1. Thirty RPs were utilized during this test. It provides statistics regarding the proposed model performance due to the number of APs implemented in it.
Fig. 5 visually demonstrates a notable enhancement in the ALE as the number of APs increases within the proposed model. The ALE exhibits a clear trend, with distances of 8.2, 5.3, 3.1, 2.3, and 1.8 m recorded for 4, 5, 6, 7, and 8 APs, respectively. This trend indicates a positive correlation between the number of APs and ALE.

Figure 5: Localization error of different numbers of APs
Moreover, a closer examination reveals interesting insights into the model’s performance with varying AP configurations. Surprisingly, the proposed model exhibited a higher maximum ALE of 14.39 m when utilizing 4 APs, compared to a significantly reduced error of 4.93 m with 8 APs. This observation challenges the assumption that a higher number of APs invariably results in a reduction in ALE. Notably, the lowest ALE, as achieved by the proposed model with 8 APs, is an impressive 1.8 m. This achievement signifies an 80.55% reduction in ALE compared to the model’s performance with 4 APs. This highlights the importance of carefully considering the number of APs in system design, as an increased count may not always guarantee improved system performance by obtaining low ALE.
Number of iteration effects: The localization error is influenced by the number of iterations, impacting the generation of samples from the posterior distribution. Seven settings of iteration numbers were employed to evaluate the ALE of the proposed model. As depicted in Fig. 6, the ALE exhibited an increase in the first four settings (from 20,000 to 80,000 iterations), with a marginal improvement in the last three settings (from 100,000 to 140,000 iterations). Notably, the lowest ALE achieved by the proposed model is 1.8 m, observed with 100,000 iterations.
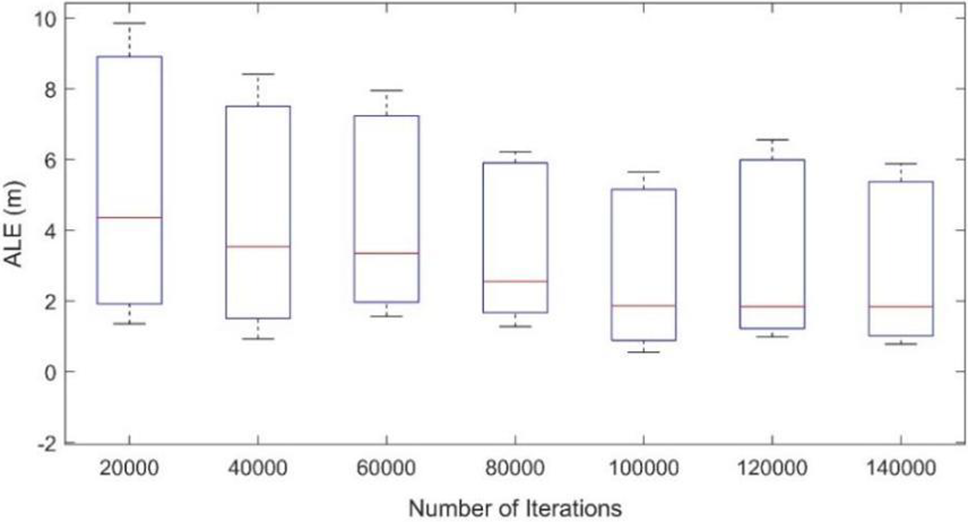
Figure 6: Localization error with various iteration numbers
It is evident from the results that the ALE experiences significant improvement with a moderate number of iterations, particularly in the initial sets. However, the gains in ALE become less pronounced in the later sets, indicating diminishing returns with increased iterations. The lower ALE of1.8 m achieved with 100,000 iterations is noteworthy, as it demonstrates a balance between ALE and computational efficiency.
Settings (120,000 and 140,000), while achieving commendable ALE, show limited improvement in ALE compared to the preceding settings and notably demand a higher number of iterations, potentially affecting the computational cost of the proposed model.
Initial values effects: The initial values play a crucial role in initiating the generation of samples, determined by the specified iteration number. However, the impact of the initial values diminishes as the iteration numbers increase. The careful selection of initial values is paramount for achieving lower ALE. In this test, a total of 100,000 iterations were utilized.
Table 2 presents the set of initial values employed to assess their influence on the system’s performance. As illustrated in Fig. 7, each set of initial values results in a distinct ALE value. While the observed effect of the initial values on ALE is relatively small, it remains an important factor to consider in the overall evaluation of system performance.
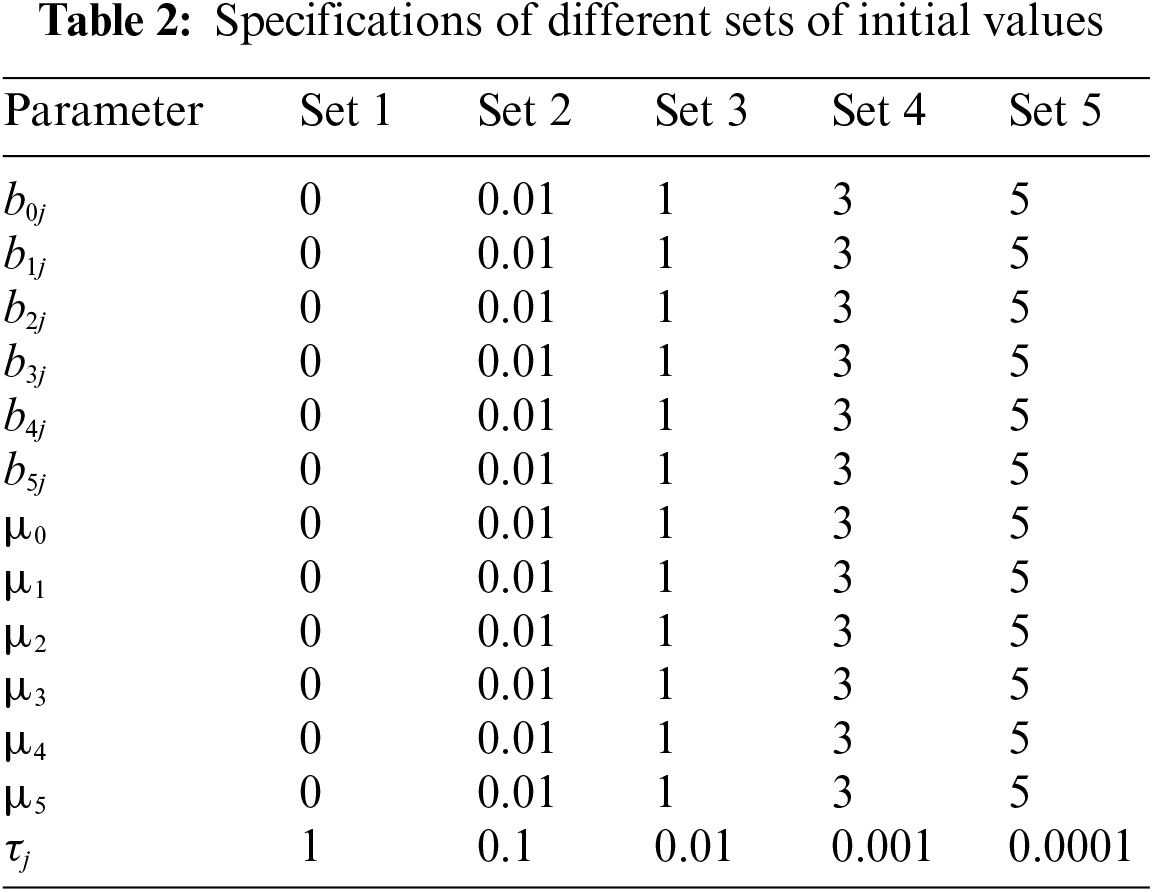

Figure 7: Localization error of various sets of initial values
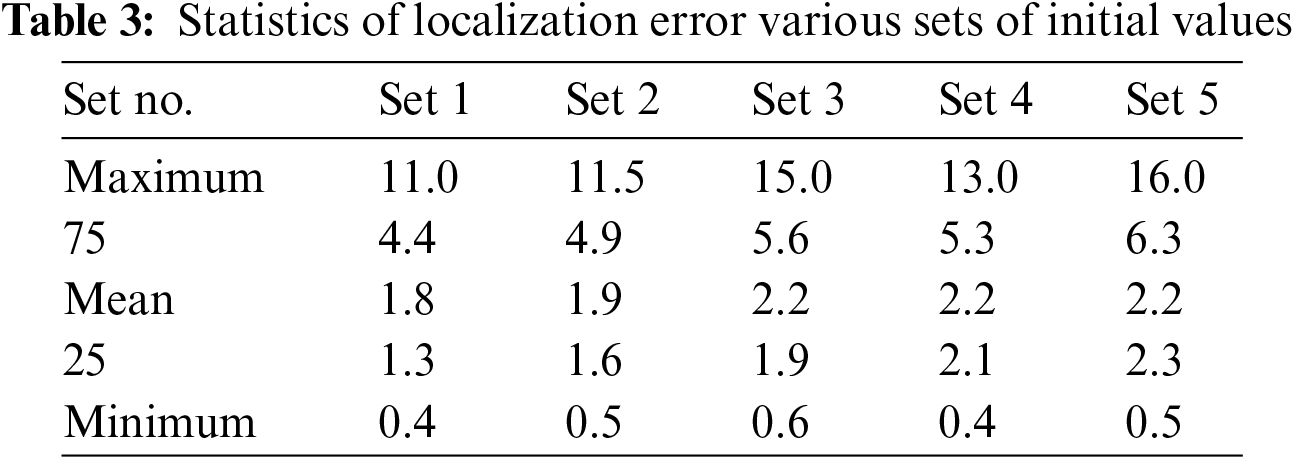
Furthermore, Table 3 highlights the lowest and highest ALE obtained, corresponding to sets 1 and 5, respectively. This emphasizes the significance of the initial values in influencing the system’s performance, reinforcing the need for a thoughtful selection process in the pursuit of the lowest ALE.
4.2.2 Comparison between the Proposed Model and the State-of-the-Art
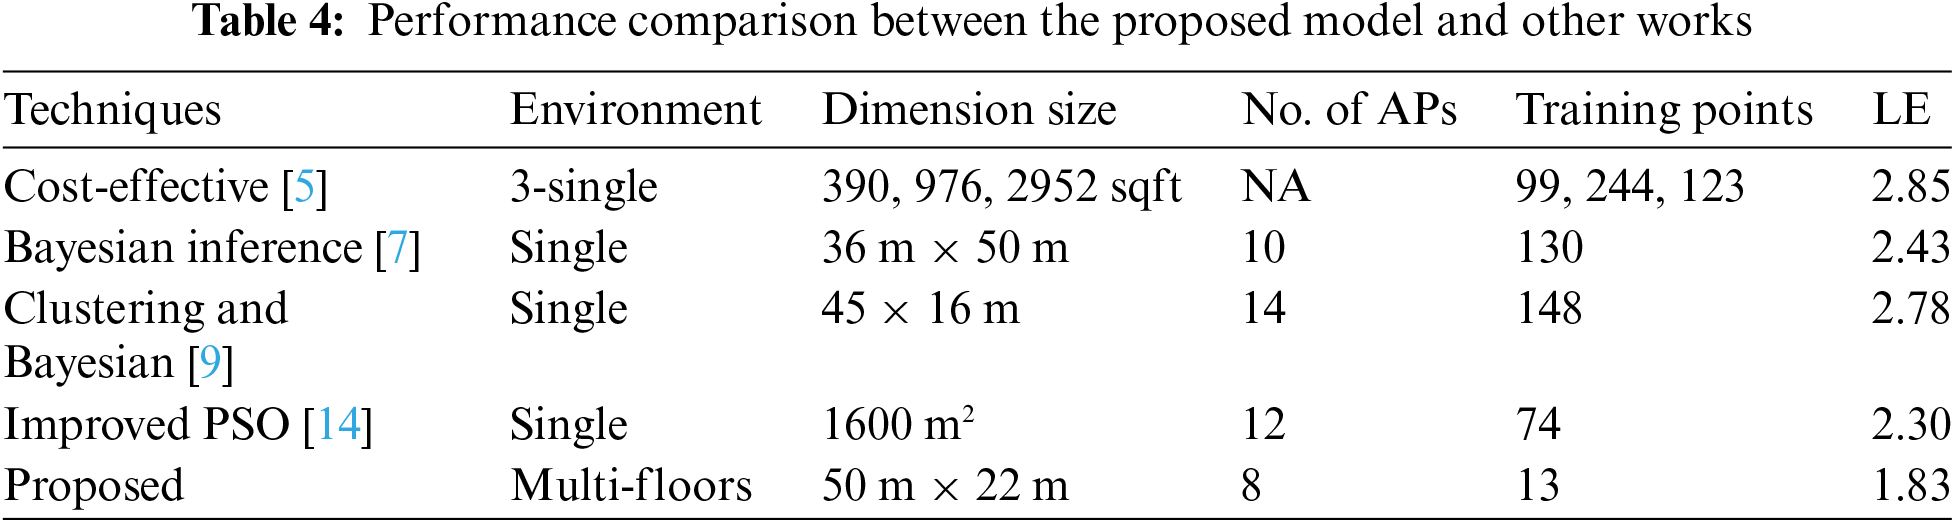
The proposed model underwent a comparative analysis against state-of-the-art models, including references [5,7,9,14]. This comparative evaluation aims to assess the efficacy and performance of the proposed model in indoor localization, providing insights into its relative strengths and capabilities compared to existing methodologies. Table 4 comprehensively compares various localization techniques, and each applied in distinct environments with varying dimension sizes, numbers of AP, training points, and ALE. In [5], implemented in a vast 390, 976, 2952 sqft single environment, employed 99, 244, and 123 APs with a resulting ALE of 2.85. In contrast, in [7], applied in a 36 m × 50 m environment, it utilized 10 APs and 130 training points and achieved a lower ALE of 2.43. Another technique [9], with a dimension size of 45 m × 16 m, deployed 14 APs and 148 training points, resulting in an ALE of 2.78. In a more confined 1600 m² space, a different technique in [14] employed 12 APs, 74 training points, and recorded an ALE of 2.30. The proposed method, designed for multi-floor environments with a dimension size of 50 m × 22 m, utilizes 8 APs and 13 training points, achieving a comparatively lower ALE of 1.83. This comparative analysis underscores the efficiency of the proposed method, showcasing error reduction in estimating user locations across multi-floor environments with fewer APs and training points.
In terms of computational efficiency, the real-time deployment of our proposed model for indoor localization systems is mitigated through several strategic optimizations. Initially, our Bayesian approach optimizes the inference process, facilitating swift localization updates. Through the utilization of efficient algorithms and parallel processing techniques, our model achieves inference times of mere seconds, even within intricate indoor environments. Additionally, our method adopts a condensed representation of the radio map, thereby minimizing memory and computational demands during localization. This reduction in map size enables rapid retrieval and processing of pertinent signal information, thereby further augmenting localization speed.
Moreover, the proposed method demonstrates versatility, applicable to diverse scenarios such as object tracking in warehouses for improved inventory management and aiding navigation in complex environments like shopping malls, airports, or hospitals where traditional GPS systems falter. Additionally, its utility extends to robotics, facilitating tasks or guiding autonomous robots; however, its effectiveness in these contexts would hinge on factors requiring further validation through theoretical and empirical means. Furthermore, the adaptability of the method allows for potential application in various emerging fields, including smart city infrastructure development and environmental monitoring. However, thorough testing and refinement are imperative to address specific challenges and optimize performance in these novel contexts.
Indoor localization methods using Wi-Fi fingerprints require a high-density database, but this can increase the computational burden in large areas or RPs. This article proposed a Bayesian model to minimize errors in estimating user location and reduce the size of the radio map in multi-floor environments. It is an off-the-shelf solution that uses existing Wi-Fi infrastructures to estimate user’s location. The adaptive Bayesian network, integrated with a sample clustering algorithm, contributes to a significant reduction in the radio map size, thereby optimizing the efficiency of the localization system. The proposed model has undergone a comprehensive evaluation, considering factors such as the number of APs, iteration counts, and initial values. The proposed model outperformed current approaches in ALE, achieving 1.8 m. This impressive result was achieved with minimal RPs, demonstrating the model’s efficiency and effectiveness in reliably estimating user locations in the indoor environment. Future research should explore integrating emerging technologies like sensor fusion to improve indoor localization systems’ robustness and accuracy. Investigating the Bayesian model’s adaptability, scalability, energy-efficient algorithms, and real-time dynamic adjustments could contribute to sustainable indoor localization solutions.
Acknowledgement: We would like to acknowledge Mohamad Yusoff Alias from Multimedia University for his assistance in this work. We also would like to express our sincere gratitude to University of Technology Malaysia for their invaluable support.
Funding Statement: This work was supported and funded by the Deanship of Scientific Research at Imam Mohammad Ibn Saud Islamic University (IMSIU) (Grant Number IMSIU-RPP2023011).
Author Contributions: The authors confirm contribution to the paper as follows: study conception and design: Abdulraqeb Alhammadi; data collection: Abdulraqeb Alhammadi; analysis and interpretation of results: Abdulraqeb Alhammadi, Zaid Ahmed Shamsan; draft manuscript preparation: Abdulraqeb Alhammadi, Zaid Ahmed Shamsan, Arijit De. All authors reviewed the results and approved the final version of the manuscript.
Availability of Data and Materials: The data that support the findings of this study are available from the corresponding author, Abdulraqeb Alhammadi, upon reasonable request.
Conflicts of Interest: The authors declare that they have no conflicts of interest to report regarding the present study.
References
1. K. A. Kordi, A. Alhammadi, M. Roslee, M. Y. Alias, and Q. Abdullah, “A review on wireless emerging IoT indoor localization,” presented at the IEEE 5th Int. Symp. Telecom. Tech., Shah Alam, Malaysia, Nov. 09–11, 2020. [Google Scholar]
2. H. Obeidat, W. Shuaieb, O. Obeidat, and R. Abd-Alhameed, “A review of indoor localization techniques and wireless technologies,” Wireless Pers. Commun., vol. 119, pp. 289–327, Feb. 2021. doi: 10.1007/s11277-021-08209-5. [Google Scholar] [CrossRef]
3. R. Shahbazian, G. Macrina, E. Scalzo, and F. Guerriero, “Machine learning assists IoT localization: A review of current challenges and future trends,” Sensors, vol. 23, no. 7, pp. 3551, Mar. 2023. doi: 10.3390/s23073551. [Google Scholar] [PubMed] [CrossRef]
4. S. Alraih, A. Alhammadi, I. Shayea, and A. M. Al-Samman, “Improving accuracy in indoor localization system using fingerprinting technique,” presented at the IEEE 2017 Int. Conf. Info. Commun. Tech. Conv., Jeju, Republic of Korea, Oct. 18–20, 2017. [Google Scholar]
5. R. Wandell, M. S. Hossain, and I. Hussain, “A cost-effective Wi-Fi-based indoor positioning system for mobile phones,” Wireless Netw., vol. 29, pp. 2845–2862, May. 2023. doi: 10.1007/s11276-023-03362-0. [Google Scholar] [CrossRef]
6. A. Alhammadi, S. Alraih, F. Hashim, and M. F. A. Rasid, “Robust 3D indoor positioning system based on radio map using Bayesian network,” presented at the IEEE 5th World Forum on Internet of Things, Limerick, Ireland, Apr. 15–18, 2019. [Google Scholar]
7. H. Huan, K. Wang, Y. Xie, and L. Zhou, “Indoor location fingerprinting algorithm based on path loss parameter estimation and Bayesian inference,” IEEE Sens. J., vol. 23, no. 3, pp. 2507–2521, Dec. 2022. doi: 10.1109/JSEN.2022.3227539. [Google Scholar] [CrossRef]
8. S. S. Al-Bawri et al., “RSS-based indoor localization system with single base station,” Comput. Mater. Contin., vol. 70, no. 3, pp. 5437–5452, Oct. 2022. doi: 10.32604/cmc.2022.020781. [Google Scholar] [CrossRef]
9. B. Pinto, R. Barreto, E. Souto, and H. Oliveira, “Robust RSSI-based indoor positioning system using K-means clustering and Bayesian estimation,” IEEE Sens. J., vol. 21, no. 21, pp. 24462–24470, Sep. 2021. doi: 10.1109/JSEN.2021.3113837. [Google Scholar] [CrossRef]
10. M. Z. Masoud, Y. Jaradat, and M. Alia, “IEEE802.11 access point’s service set identifier (SSID) for localization and tracking,” Comput. Mater. Contin., vol. 71, no. 3, pp. 5459–5476, Jan. 2022. doi: 10.32604/cmc.2022.023781. [Google Scholar] [CrossRef]
11. Z. Li, Z. Tian, Z. Wang, and Z. Zhang, “Multipath-assisted indoor localization using a single receiver,” IEEE Sens. J., vol. 21, no. 1, pp. 692–705, 2020. [Google Scholar]
12. S. H. Lee, C. H. Cheng, C. C. Lin, and Y. F. Huang, “PSO-based target localization and tracking in wireless sensor networks,” Electronics, vol. 12, no. 4, pp. 905, Feb. 2023. doi: 10.3390/electronics12040905. [Google Scholar] [CrossRef]
13. J. Zheng, K. Li, and X. Zhang, “Wi-Fi fingerprint-based indoor localization method via standard particle swarm optimization,” Sensors, vol. 22, no. 13, pp. 5051, Jul. 2022. doi: 10.3390/s22135051. [Google Scholar] [PubMed] [CrossRef]
14. X. Zhang, W. Sun, J. Zheng, A. Lin, J. Liu and S. S. Ge, “Wi-Fi-based indoor localization with interval random analysis and improved particle swarm optimization,” IEEE Trans. Mob. Comput., pp. 1–15, Jan. 2024. doi: 10.1109/TMC.2024.3359669. [Google Scholar] [CrossRef]
15. H. S. Fahama, K. Ansari-Asl, Y. S. Kavian, and M. N. Soorki, “An experimental comparison of RSSI-based indoor localization techniques using ZigBee technology,” IEEE Access, vol. 11, pp. 87985– 87996, Aug. 2023. doi: 10.1109/ACCESS.2023.3305396. [Google Scholar] [CrossRef]
16. L. P. Tian, L. Q. Chen, Z. M. Xu, and Z. Chen, “A localization and tracking system using single WiFi link,” Remote Sens., vol. 15, no. 9, pp. 2461, May. 2023. doi: 10.3390/rs15092461. [Google Scholar] [CrossRef]
17. P. Y. Chan, J. C. Chao, and R. B. Wu, “A Wi-Fi-based passive indoor positioning system via entropy-enhanced deployment of Wi-Fi sniffers,” Sensors, vol. 23, no. 3, pp. 1376, Jan. 2023. doi: 10.3390/s23031376. [Google Scholar] [PubMed] [CrossRef]
18. A. Thomas, “OpenBUGS” Accessed: Sep. 20, 2023. http://www.openbugs.net/w/FrontPage [Google Scholar]
19. D. Madigan, E. Einahrawy, R. P. Martin, W. H. Ju, P. Krishnan and A. S. Krishnakumar, “Bayesian indoor positioning systems,” presented at the IEEE 24th Annu. Joint Conf. Comput. Commun. Soc., Miami, FL, USA, Mar. 13–17, 2005. [Google Scholar]
20. A. S. Al-Ahmadi, A. I. Omer, M. R. Kamarudinand, and T. A. Rahman, “Multi-floor indoor positioning system using Bayesian graphical models,” Prog. In Electromagn. Res. B, vol. 25, pp. 241–259, 2010. [Google Scholar]
21. A. Alhammadi, M. Y. Alias, S. W. Tan, and C. Sapumohotti, “An enhanced localisation system for indoor environment using clustering technique,” Int. J. Comput. Vis. Robot, vol. 7, no. 1–2, pp. 83–98, Jan. 2017. doi: 10.1504/IJCVR.2017.081241. [Google Scholar] [CrossRef]
Cite This Article
 Copyright © 2024 The Author(s). Published by Tech Science Press.
This work is licensed under a Creative Commons Attribution 4.0 International License , which permits unrestricted use, distribution, and reproduction in any medium, provided the original work is properly cited.
 Downloads
 Citation Tools