
 Submit a Paper
 Propose a Special lssue
 Open Access
ARTICLE
Squeeze and Excitation Convolution with Shortcut for Complex Plasma Image Recognition
1 College of Information and Electrical Engineering, China Agricultural University, Beijing, 100083, China
2 College of Science, China Agricultural University, Beijing, 100083, China
* Corresponding Author: Feng Huang. Email:
Computers, Materials & Continua 2024, 80(2), 2221-2236. https://doi.org/10.32604/cmc.2024.049862
Received 20 January 2024; Accepted 11 May 2024; Issue published 15 August 2024
 View Full Text
 Download PDF
Abstract
Complex plasma widely exists in thin film deposition, material surface modification, and waste gas treatment in industrial plasma processes. During complex plasma discharge, the configuration, distribution, and size of particles, as well as the discharge glow, strongly depend on discharge parameters. However, traditional manual diagnosis methods for recognizing discharge parameters from discharge images are complicated to operate with low accuracy, time-consuming and high requirement of instruments. To solve these problems, by combining the two mechanisms of attention mechanism (strengthening the extraction of the channel feature) and shortcut connection (enabling the input information to be directly transmitted to deep networks and avoiding the disappearance or explosion of gradients), the network of squeeze and excitation convolution with shortcut (SECS) for complex plasma image recognition is proposed to effectively improve the model performance. The results show that the accuracy, precision, recall and F1-Score of our model are superior to other models in complex plasma image recognition, and the recognition accuracy reaches 97.38%. Moreover, the recognition accuracy for the Flowers and Chest X-ray publicly available data sets reaches 97.85% and 98.65%, respectively, and our model has robustness. This study shows that the proposed model provides a new method for the diagnosis of complex plasma images and also provides technical support for the application of plasma in industrial production.Keywords
Complex plasma, also known as dusty plasma, consists of micrometer-sized solid particles immersed in an ordinary ion-electron plasma [1,2]. Complex plasma widely exists in plasma industry processing [3,4], cosmic space [5,6], and laboratory plasma systems [7]. In plasma industry processing, Racka-Szmidt et al. [8] researched effect of O2 addition to the SF6 plasma was investigated to improve the etching rate and/or selectivity. In cosmic space, a description of the origin of dust particles, their dynamics and evolution in the atmosphere of Mars and the vicinity of its moons, Phobos and Deimos, were presented [5]. In laboratory complex plasmas [9–11], a complex plasma can be generated by the discharge of ethylene gas in a radio frequency (rf) discharge system [11], in which different discharge parameters will produce different complex plasma patterns formed by the combination of plasma glow and dust particles. Complex plasma patterns can be acquired by an image acquisition system to study the relationship between complex plasma images and discharge macro-parameters [12–14].
However, when the amount of captured images to be analyzed is large, it is difficult to efficiently and accurately analyze or recognize the relationship between images and parameters using the operators’ experimental experience and traditional manual diagnostic methods. Because the manual diagnostic methods which are introduced to determine the critical macro-parameters have some disadvantages, such as complicated operation, low accuracy, time-consuming, high requirement of instruments and equipment, and high requirement of operators. Machine learning has made emerging achievements in the field of complex plasmas. For example, Huang et al. [15] applied the support vector machine (SVM) method to achieve the identification of the interface in a binary complex plasma. SVM can be also used to estimate the in-flight particle properties in plasma spraying in a much faster manner [16]. However, machine learning often requires the manual design of feature extractors or manually selecting features from raw data, which is time-consuming and requires specialized knowledge. As a subset of machine learning, deep learning can automatically extract useful information from the original data by automatically learning the feature representation of the input data, which simplifies the engineering of manually designing extractors for machine learning. To overcome these shortcomings, this paper proposed a recognition model based on deep learning for complex plasma image recognition.
Deep learning, the process of extracting abstract features from original features through multi-layer neural networks for recognition or classification processing, can optimize itself by learning the characteristics and the laws of data through algorithms to realize the recognition of data and related parameters. In recent years, deep learning with its advantages in feature recognition has gained considerable achievements in computer vision, such as cancer detection [17], human activity recognition [18,19], and image classification [20–23]. For example, Kumar et al. [17] presented novel convolutional neural networks (CNN) based approach for the detection of breast cancer using the whole slide images with an accuracy of 83%. Wang et al. [18] proposed a comprehensive event detection method based on effective part-based deep network cascade-head-shoulder networks and trajectory analysis. This network can detect pedestrians and key-pose-based single events very precisely, which lays a foundation for tracking pedestrians. Verma et al. [19] proposed a human activity recognition method by deep fusion of multi-streams (RGB images, depth maps, and 3 dimensions skeleton) and using evolutionary algorithms to optimize decision-level scores. The method is an application of the human-machine interface, which can be used to identify normal activities, abnormal activities, and patient safety monitoring in the living room.
For deep learning, its typical application in image recognition experienced the development of a series of models. For example, as one of the earlier deep learning models, LeNet achieves good results on the small-scale MNIST dataset [20]. However, complex image recognition tasks require large-scale datasets and network models with stronger learning capabilities. Krizhevsky et al. [21] proposed AlexNet, in which the input image underwent 5 convolution operations and 3 fully connected layers. Finally, a Softmax classifier with 1000 nodes was input to complete image recognition. The network used the rectified linear unit (ReLU) activation function and introduced local response normalization to alleviate the problem of gradient disappearance. Data augmentation and dropout technology greatly alleviate the problem of overfitting. However, AlexNet has a shortcoming with a large number of parameters. Simonyan and Zisserman proposed a visual geometry group (VGG) [22], which inherited the framework of AlexNet and LeNet. The main contribution was to increase the network depth and improve the network by stacking convolutional layers with 3 × 3 small convolution kernels. However, as the depth of the network increases, the problem of gradient disappearance becomes more and more serious, and the optimization of the network becomes more and more difficult. So, He et al. [23] proposed a residual network (ResNet) composed of stacked residual blocks, which further deepened the network and improved the performance of image recognition tasks. However, the recognition performance of ResNet still needs to be improved when the irrelevant information is too much or the information is overloaded. The attention mechanism was introduced [24], which can filter out irrelevant information, solve the problem of information overload, and improve the efficiency and accuracy of task processing.
In the above researches, there are three important points: (1) The use of small convolutional kernels and stacked convolutional layers enables more nonlinear operations, improves the network’s non-linear expression ability, and enables it to better handle complex image data [22]; (2) The use of the residual block allows the input information to be directly transmitted to the deep network to avoid the disappearance or explosion of gradients during the propagation process [23]; (3) The use of attention mechanism improves the performance and accuracy of the model by learning the importance weights of each channel and then applying these weights to the channel feature map to enhance useful features and suppress useless ones [24]. Inspired by the above researches, we built a squeeze-and-excitation-convolution with shortcut (SECS) model based on deep learning to accurately recognize experimental macro-parameters from complex plasma images. The primary innovations and contributions of the paper are as follows:
(1) The complex plasma image dataset containing 5094 images is constructed, which is divided into four categories according to four different rf powers as the labels.
(2) The proposed SECS module combined two mechanisms of attention mechanism and shortcut connection to effectively improve the model performance with a high accuracy. Attention mechanism can strengthen the extraction of the channel feature of the input complex plasma images to improve the feature learning ability of network. Shortcut connection enables the input information to be directly transmitted to deep networks, avoiding the disappearance or explosion of gradients during the propagation process.
(3) The proposed SECS model learns the complex plasma image features through training to optimize model performance and establish the corresponding relationship between the input images and plasma discharge macro-parameters. When inputting a test-needed complex plasma image into the proposed model, the corresponding experimental macro-parameters can be recognized quickly and accurately. When plasma discharge conditions and images change, it is only need to change the dataset, retrain and retest the network. The network still has the ability to learn and extract the key features from new dataset.
Fig. 1 shows the technical route of our model. The deep learning and application processes can be roughly divided into two parts: the learning process and the application process. All the data is divided into three parts, i.e., training set, validation set, and test set. The training set is used for model training. During the training process, the training error is subjected to gradient descent and the trainable weight parameters. Validation set is a separate set during model training, which can be used to tune the model’s hyperparameters and to initially evaluate the model’s performance. The test set is used to evaluate the generalization ability of the final model and thereby the quantitative and qualitative analysis ability of the model is obtained. The test set and validation set can be exactly the same.
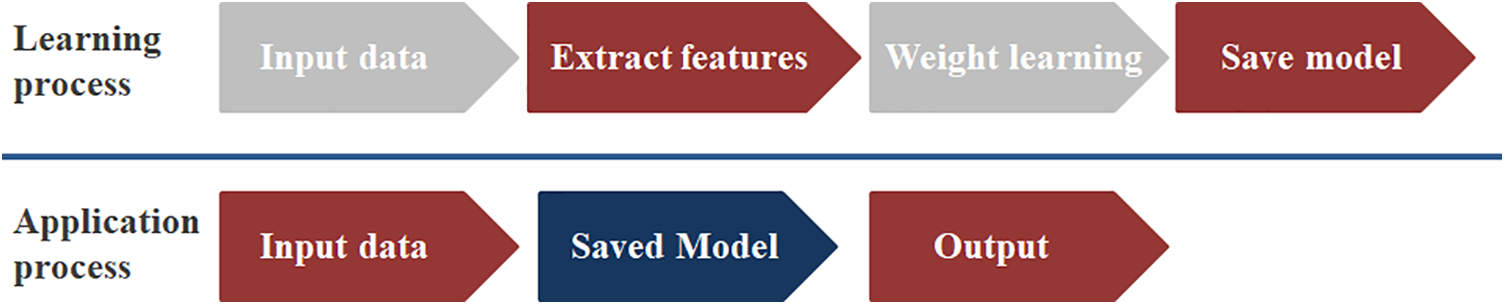
Figure 1: Technical route
2.2 Squeeze-and-Excitation Block (SE Block)
Fig. 2 shows the main block included in this model, i.e., the SE block [24]. The left half of the network
where
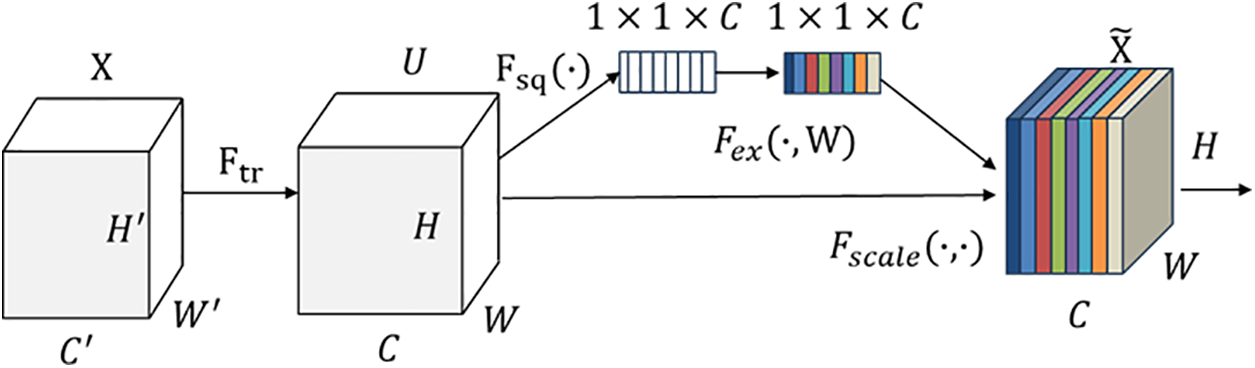
Figure 2: The SE block
To solve the problem of exploiting channel dependencies, we first consider the output feature of the signal in each channel. Each learned filter is associated with a local receptive field, so each transformed output unit
The squeeze operation is to use the global average pooling operation to compress each feature map after obtaining
In order to exploit the information aggregated in the squeeze operation, channel dependencies are fully captured by excitation. To achieve this, the function must satisfy two criteria. First, it must be able to learn nonlinear relationships between channels. Second, it must learn non-mutually exclusive relationships. Because it is hoped that multiple channels can be enhanced (rather than only one channel feature like one-hot enhancement). A gating mechanism with sigmoid activation is selected. In order to satisfy the above two conditions, the following transformation forms are used:
where
To limit the complexity of the model and make it general, the dimensionality reduction layer (by global average pooling), two full connection (FC) layers, the activation of ReLU and sigmoid, the dimensionality boosting layer by scale are used. The final output of the SE block is obtained by rescaling the feature map with activations. After getting
where
In this complex plasma experiment (see Fig. 3), ethylene gas is used to discharge in a capacitive coupled rf plasma experimental setup. The laser (with the wavelength of 532 nm and the power of 200 mW) is used to illuminate dust particles by scattering, then the complex plasma images were captured and recorded through a complementary metal-oxide-semiconductor (CMOS) camera with a microscope and an image acquisition software. In this experiment, ethylene gas, gas pressure is controlled at 190 Pa with changing rf power in 64–70 W. The amount of the captured images under different rf powers is shown in Table 1. The dataset is constructed from the totally captured 5094 images, in which the training set and test set are 70% and 30% of the images, respectively.
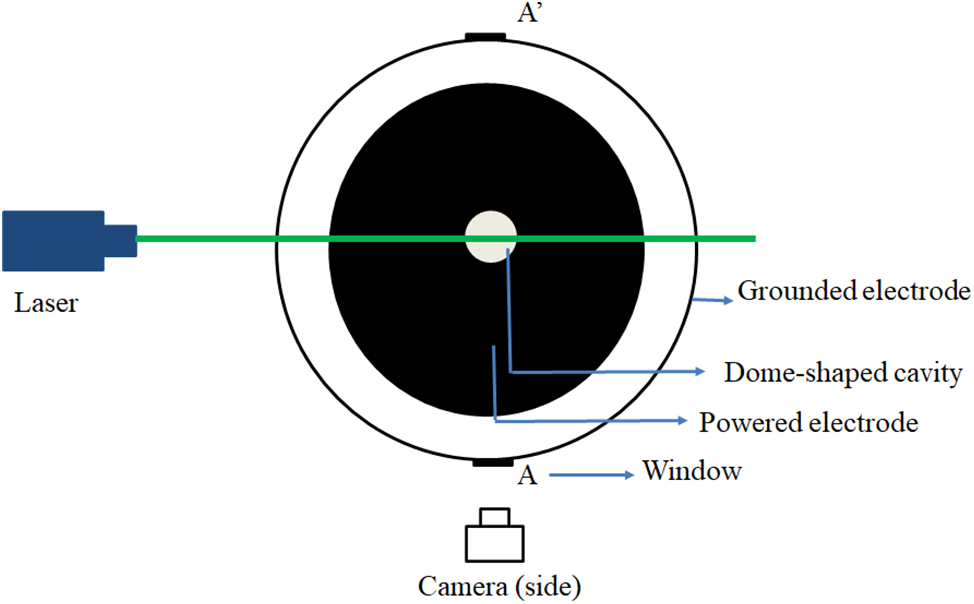
Figure 3: The top view of the complex plasma experimental system

Fig. 4 shows the complex plasma images under different rf powers, which are difficult to be distinguished by naked eyes. To efficiently recognize these images, an effective model is needed.

Figure 4: Complex plasma images under the rf power of 64 W (a1–a4), 66 W (b1–b4), 68 W (c1–c4), and 70 W (d1–d4)
Fig. 5 shows the schematic diagram of the SECS module. Firstly, the SECS module compresses spatial features of input feature map, realizes the global average pooling in the spatial dimension, and then learns the channel features of the compressed feature map to obtain the feature map with channel feature attention module. Next, the characteristics of channel attention and the characteristics of the input images after the convolution, batch normal (BN) and ReLU procedure are multiplied by the weight coefficient through channel by channel in the scale step, and then the characteristics with channel attention are output. The added shortcut can prevent gradient divergence of the network (see Fig. 5).

Figure 5: The SECS module
In this paper, the SECS network was constructed for recognition of ethylene discharge images under different parameters. Fig. 6 shows the SECS network structure. It mainly consists of SECS module, which mainly includes attention mechanism and shortcut connection. Attention mechanism can strengthen the extraction of the useful channel features and suppress those that are less important to improve the feature learning ability of network. Shortcut connection solves the gradient divergence problem by directly transmitting the input information to deep networks. The SECS module can effectively improve the model performance with a high accuracy. The SE attention mechanism concluded squeeze, excitation and scale. Squeeze compresses the 2D feature (H

Figure 6: The model structure for complex plasma image recognition

In this paper, the complex plasma images collected under the four rf powers are as the examples to introduce the application process of this model. Firstly, 70% of the dataset constructed from the collected complex plasma images are input into the model for training, and then the left 30% of the dataset are for testing the model. That is, randomly inputting the left of the dataset to the model, the model can accurately recognize the parameters from the unknown images.
Accuracy, precision, recall, F1-Score and confusion matrix were used as evaluation indicators for recognition (see Eqs. (5)–(8)).
where
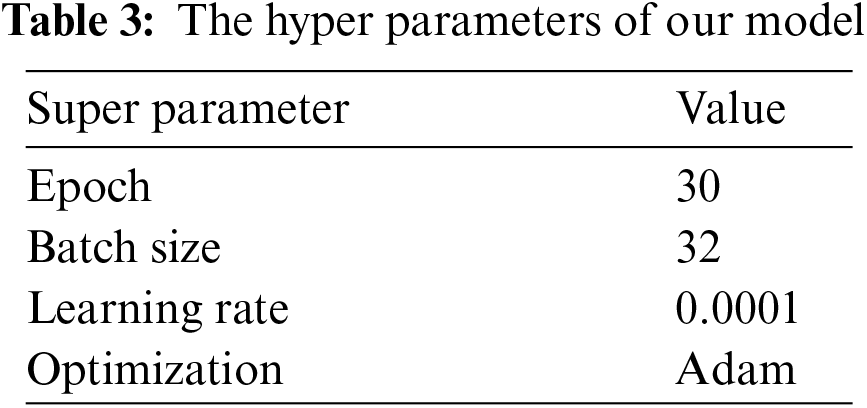
To enhance the generalization capability of the network and prevent overfitting of the network, data expansion methods can be used, such as rotation, deformation, normalization and so on. In this experiment, we use rotation, horizontal position translation, up and down position translation, staggering transformation, scaling, horizontal flipping and padding to expand the data. During the training process, the cross-entropy was used as the loss (see Eq. (9)). The hyper parameters in our model are shown in Table 3.
where
Accuracy, the proportion of correctly predicted samples for all predicted samples, is a very common evaluation index in recognition. Fig. 7 shows the accuracy and loss of the model on the training set and test set vs. iterations. It can be seen that within 0–10 epochs, the training and test accuracy are rising rapidly. When the epoch is within 10–26, the fluctuation of the accuracy curves can be observed. When the epoch exceeds 26, the accuracy curves tend to be stable. For the loss curve of the model, it decreases rapidly when the epoch is less than 10. The epoch is greater than 26, the loss curves of both the train and test sets reach stable with the low values (close to zero), which indicates the convergence state of the model after 26 epochs.

Figure 7: The accuracy and loss curve of our model during training and testing
Confusion matrix is often used to judge the pros and cons of models. Fig. 8 shows the confusion matrix for complex plasma image recognition by the SECS model. The abscissa represents the predicted labels, the ordinate represents the real categories, and the coordinates at (

Figure 8: The confusion matrix of the recognition for the ethylene complex plasma images with the SECS model
Table 4 shows the detailed recognition results of the four categories of images in Fig. 4 with image name, true label, predict label, and the corresponding accuracy. It can be seen that the predicted label of each image is consistent with the true labels with high accuracy of above 91% (the highest accuracy is 99.97%), indicating that our model has high feasibility on complex plasma image recognition.

Different learning rate and batch size will also affect the recognition accuracy of the model. Therefore, we compared the accuracy with different learning rates and batch size (see Tables 5 and 6). It can be seen from Table 5 that when the learning rate is 0.001, 0.0001 and 0.00001, the accuracy is 95.42%, 97.38% and 96.86%, respectively. The learning rate is 0.0001, the accuracy of the network is 1.96% and 0.52% higher than that of 0.001 and 0.00001, respectively. Table 6 shows the influence of different batch sizes on the recognition result. It can be seen that when the batch size is 32, the recognition effect is the best with 0.39% and 6.59% higher than that of the batch size of 16 and 64, respectively.


In order to verify the feasibility and effectiveness of this method for the recognition on complex plasma images, the proposed model was compared with residual network (ResNet18), VGG13, Alex network (AlexNet) and LeNet, respectively, shown in Fig. 9. It can be seen that the accuracy of our method is the highest among these models after the epoch is larger than 10. Therefore, our method has best recognition effect.

Figure 9: The accuracy curve of different methods in complex plasma image recognition
The evaluation indicators of our model and the four comparable models are shown in Table 7. It can be seen from Table 7 that the accuracy of the SECS model on complex plasma image recognition is 97.38%, while the accuracy of ResNet18, VGG13, AlexNet and LeNet are 80.09%, 70.71%, 66.73% and 56.11%, respectively. Compared with the four models, the accuracy of our method is improved by 17.29%, 26.66%, 30.65% and 41.27%, respectively. Moreover, the evaluation index of recall and F1-Score of our method are also the best. In addition, in order to compare with other methods more intuitively, we have given the four evaluation indicators in bar graph by different recognition models. It can be seen that all the four evaluation indicators of the proposed SECS network are the highest. From Table 7 and Fig. 10, one can see that our method can effectively recognize complex plasma images.


Figure 10: The bar graph comparison on the evaluation indicators by our method and other methods
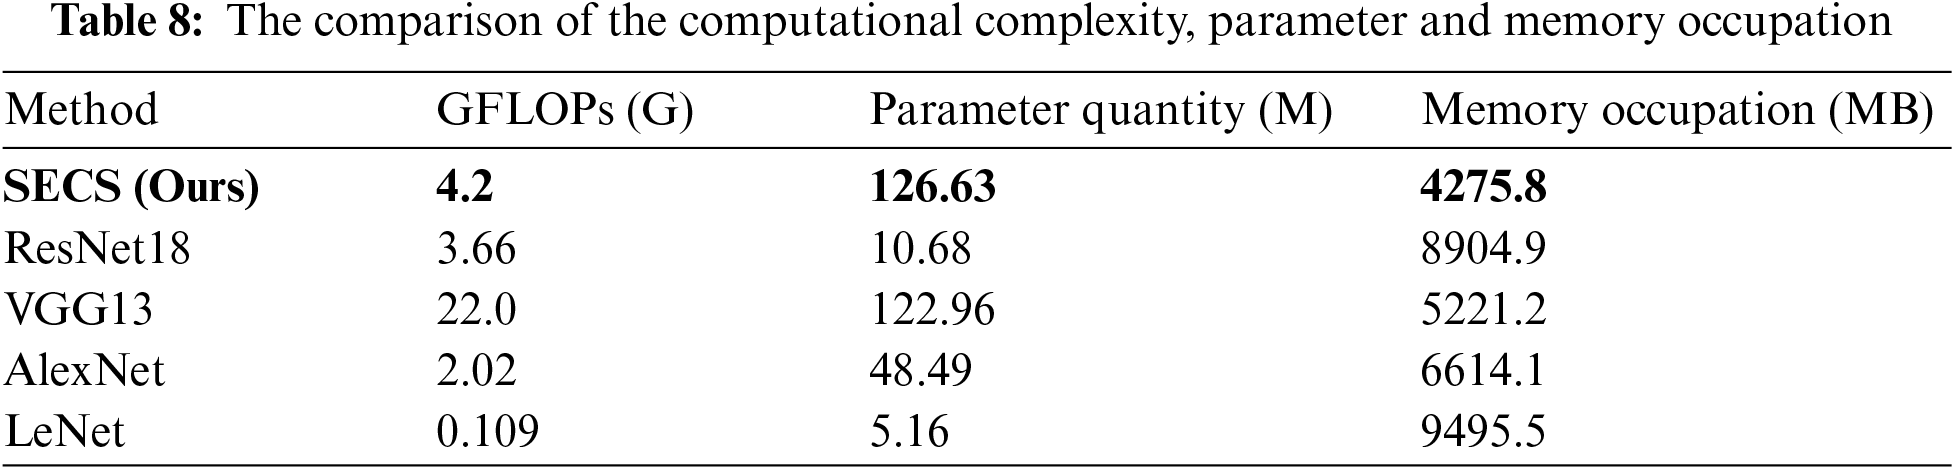
In order to compare the calculation performance, the calculation complexity (GFLOPs, i.e., giga floating-point operations per second, showing the measure of computing), the parameter quantity, and memory occupation of different models in the same running environment are shown in Table 8. It shows that the GFLOPs of our model is 4.2 G, while those of ResNet18, VGG13, AlexNet and LeNet are 3.66, 22.0, 2.02 and 0.109 G, respectively. The parameter quantity of our model is 126.63 M, while those of ResNet18, VGG13, AlexNet and LeNet are 10.68, 122.96, 48.49 and 5.16 M, respectively. Memory occupation refers to the amount of memory used by the model while it is running. In the same running environment, the higher the memory occupation of the model, the higher the requirements of the model on computer resources. The memory occupation of our model during running is 4275.8 MB. While that of ResNet18, VGG13, AlexNet and LeNet during running are 8904.9, 5221.2, 6614.1 and 9495.5 MB, respectively. It shows our model has the least memory occupation, meaning the lowest requirement of our model on computer resources during running. Although our model has the high calculation complexity and parameter quantity, the lowest memory occupation and the highest accuracy of our model means that our method has the best overall performance.
The robustness of the recognition is also an important consideration. In order to verify the robustness of our model, the public flower dataset (daisy, dandelion, rose, sunflower and tulip) and the Chest X ray (normal and pneumonia) dataset were used for the validation, showing the high evaluation indicators of about 98%–99% (shown in Table 9). For example, the average recognition accuracy of 97.85% and 98.65% respectively on these two public datasets by our model. In addition, the proposed model was also carried out on our constructed complex plasma image dataset with the operations of rotation, cutting and horizontal flipping. It can be seen from Table 9 that all the four evaluation indicators are higher than 97%, indicating the robustness of our model.

In this paper, the SECS model for complex plasma image recognition was built, which can strengthen the channel feature of the input images, solve the gradient divergence problem of the network, and improve model performance. The results show that the evaluation indicators of our network are all above 97%. Compared with other typical recognition networks, our method achieves significantly better performance with the highest evaluation indicators for complex plasma image recognition. The proposed model in this paper provides a new method for the diagnosis of complex plasma images and it also has potential for application in the plasma industry.
Acknowledgement: All authors would like to express their gratitude to the editors and reviewers for their valuable recommendations.
Funding Statement: This study was supported by a grand from the National Natural Science Foundation of China (No. 12075315).
Author Contributions: Writing, Baoxiao Li; methodology, Feng Huang; investigation, Wenzhuo Chen; software, Xiaojiang Tang and Shaohuang Bian; data collection, Yang Liu; visualization, Junwei Guo and Dan Zhang. All authors reviewed the results and approved the final version of the manuscript.
Availability of Data and Materials: This paper uses the Flowers (https://www.dilitanxianjia.com/14735/) (accessed on 6 March 2022) and Chest X ray (https://www.kaggle.com/datasets/paultimothymooney/chest-xray-pneumonia) (accessed on 22 February 2022).
Conflicts of Interest: The authors declare that they have no conflicts of interest to report regarding the present study.
References
1. M. Ghoranneviss et al., “Nano-microelectronics by plasma and electron beam techniques,” in Int. Congress Plasma Phys. (ICPP), Sydney, Australia, Jul. 15–19, 2003, pp. 15–19. doi: 10.1063/1.1593931. [Google Scholar] [CrossRef]
2. B. Ramkorun et al., “Introducing dusty plasma particle growth of nanospherical titanium dioxide,” Appl. Phys. Lett., vol. 124, no. 14, p. 144102, 2024. doi: 10.1063/5.0186797. [Google Scholar] [CrossRef]
3. J. Jadwiszczak, D. J. Kelly, J. Guo, Y. Zhou, and H. Zhang, “Plasma treatment of ultrathin layered semiconductors for electronic device applications,” ACS Appl. Electron. Mater., vol. 3, no. 4, pp. 1505–1529, 2021. doi: 10.1021/acsaelm.0c00901. [Google Scholar] [CrossRef]
4. B. Swain, M. Priyadarshini, S. S. Mohapatra, R. K. Gupta, and A. Behera, “Parametric optimization of atmospheric plasma spray coating using fuzzy TOPSIS hybrid technique,” J. Alloys Compd., vol. 867, pp. 159074, 2021. doi: 10.1016/j.jallcom.2021.159074. [Google Scholar] [CrossRef]
5. S. Popel, A. Golub, and L. M. Zelenyi, “Dusty plasmas in the system of mars: Review of recent theoretical research at the space research institute RAS,” in Russian Open Conf. Radio Wave Propag., Kazan, Russia, Jul. 1–6, 2019. doi: 10.1109/RWP.2019.8810398. [Google Scholar] [CrossRef]
6. Y. Zheng, “Effect of cosmic plasma on the observation of supernovae Ia,” Res. Astron. Astrphys., vol. 24, no. 2, pp. 025004, 2024. doi: 10.1088/1674-4527/ad12fb. [Google Scholar] [CrossRef]
7. Y. Song, F. Huang, Z. Chen, Y. Liu, and M. Yu, “Self-organization and oscillation of negatively charged dust particles in a 2-dimensional dusty plasma,” Phys. Lett. A, vol. 380, no. 7–8, pp. 886–895, 2016. doi: 10.1016/j.physleta.2015.12.028. [Google Scholar] [CrossRef]
8. K. Racka-Szmidt, B. Stonio, J. Zelazko, M. Filipiak, and M. Sochacki, “A review: Inductively coupled plasma reactive ion etching of silicon carbide,” Mater, vol. 15, no. 1, pp. 123, 2022. doi: 10.3390/ma15010123. [Google Scholar] [PubMed] [CrossRef]
9. S. Swarnima, B. Prasun, K. Krishan, and S. Abhijit, “Square lattice formation in a monodisperse complex plasma,” Phys. Rev. Lett., vol. 129, no. 11, pp. 115003, 2022. doi: 10.1103/PhysRevLett.129.115003. [Google Scholar] [PubMed] [CrossRef]
10. C. -F. López-Cámara et al., “Evolution of particle size and morphology in plasma synthesis of few-layer graphene and soot,” Combust. Flame, vol. 258, pp. 112713, 2023. doi: 10.1016/j.combustflame.2023.112713. [Google Scholar] [CrossRef]
11. Y. Liu, X. Zhu, Y. Wang, Z. Chen, and F. Huang, “Influence of flow on the structure and dynamics of clusters in complex plasma systems,” Contrib. Plasma Phys., vol. 60, no. 4, pp. e201900190, 2020. doi: 10.1002/ctpp.201900190. [Google Scholar] [CrossRef]
12. Y. Song et al., “Influence of system temperature on the micro-structures and dynamics of dust clusters in dusty plasmas,” Phys. Plasmas., vol. 22, no. 6, pp. 063702, 2015. doi: 10.1063/1.4922436. [Google Scholar] [CrossRef]
13. T. Aizawa, I. Rsadi, and E. E. Yunata, “High density RF-DC plasma nitriding under optimized conditions by plasma-diagnosis,” Appl. Sci., vol. 12, no. 8, pp. 3706, 2012. doi: 10.3390/app12083706. [Google Scholar] [CrossRef]
14. J. R. Nagahanumaiah, N. Glumac, S. G. Kapoor, and R. E. DeVor, “Characterization of plasma in micro-edm discharge using optical spectroscopy,” J. Manuf. Process., vol. 11, no. 2, pp. 82–87, 2009. doi: 10.1016/j.jmapro.2009.10.002. [Google Scholar] [CrossRef]
15. H. Huang, M. Schwabe, and C. Du, “Identification of the interface in a binary complex plasma using machine learning,” J. Imaging, vol. 5, no. 3, pp. 36, 2019. doi: 10.3390/jimaging5030036. [Google Scholar] [PubMed] [CrossRef]
16. K. Bobzin, W. Wietheger, H. Heinemann, S. R. Dokhanchi, M. Rom and G. Visconti, “Prediction of particle properties in plasma spraying based on machine learning,” J. Therm. Spray Techn., vol. 30, no. 7, pp. 1751–1764, 2021. doi: 10.1007/s11666-021-01239-2. [Google Scholar] [CrossRef]
17. K. Kumar, U. Saeed, A. Rai, N. Islam, G. M. Shaikh and A. Qayoom, “IDC breast cancer detection using deep learning schemes,” Adv. Data Sci. Adapt., vol. 12, no. 2, pp. 2041002, 2020. doi: 10.1142/S2424922X20410028. [Google Scholar] [CrossRef]
18. M. Wang, X. Li, Q. Chen, L. Li, and Y. Zhao, “Surveillance event detection based on CNN,” (in Chinese) Acta Automatica Sinica, vol. 42, pp. 892–903, 2016. [Google Scholar]
19. K. K. Verma and B. M. Singh, “Deep multi-model fusion for human activity recognition using evolutionary algorithms,” Int. J. Interact. Multimed. Artif. Intell., vol. 7, no. 2, pp. 44–58, 2021. doi: 10.9781/ijimai.2021.08.008. [Google Scholar] [CrossRef]
20. Y. LeCun, Y. Bengio, and G. Hinton, “Deep learning,” Nature, vol. 521, no. 7553, pp. 436–444, 2015. doi: 10.1038/nature14539. [Google Scholar] [PubMed] [CrossRef]
21. A. Krizhevsky, I. Sutskever, and G. E. Hinton, “Imagenet classification with deep convolutional neural networks,” Commun. ACM, vol. 60, no. 6, pp. 84–90, 2017. doi: 10.1145/3065386. [Google Scholar] [CrossRef]
22. K. Simonyan and A. Zisserman, “Very deep convolutional networks for large-scale image recognition,” arXiv preprint arXiv:1409.1556, 2014. [Google Scholar]
23. K. He, X. Zhang, S. Ren, and J. Sun, “Deep residual learning for image recognition,” in Comput. Vis. Pattern Recognit. (CVPR), Las Vegas, NV, USA, Jun. 27–30, 2016, pp. 27–30. doi: 10.1109/CVPR.2016.90. [Google Scholar] [CrossRef]
24. J. Hu, L. Shen, and G. Sun, “Squeeze-and-excitation networks,” in Conf. Comput. Vis. Pattern Recognit. (CVPR), Salt Lake City, UT, USA, Jun. 18–23, 2018, pp. 18–23. doi: 10.1109/CVPR.2018.00745. [Google Scholar] [CrossRef]
Cite This Article
 Copyright © 2024 The Author(s). Published by Tech Science Press.
This work is licensed under a Creative Commons Attribution 4.0 International License , which permits unrestricted use, distribution, and reproduction in any medium, provided the original work is properly cited.
 Downloads
 Citation Tools