
 Submit a Paper
 Propose a Special lssue
 Open Access
REVIEW
A Systematic Review of Computer Vision Techniques for Quality Control in End-of-Line Visual Inspection of Antenna Parts
1 School of Electrical and Information Engineering, Zhengzhou University, Zhengzhou, 450001, China
2 School of Science and Technology, Universidade de Trás-os-Montes e Alto Douro, Vila Real, 5000-801, Portugal
* Corresponding Author: Zia Ullah. Email:
(This article belongs to the Special Issue: Advances and Applications in Signal, Image and Video Processing)
Computers, Materials & Continua 2024, 80(2), 2387-2421. https://doi.org/10.32604/cmc.2024.047572
Received 09 November 2023; Accepted 07 April 2024; Issue published 15 August 2024
 View Full Text
 Download PDF
Abstract
The rapid evolution of wireless communication technologies has underscored the critical role of antennas in ensuring seamless connectivity. Antenna defects, ranging from manufacturing imperfections to environmental wear, pose significant challenges to the reliability and performance of communication systems. This review paper navigates the landscape of antenna defect detection, emphasizing the need for a nuanced understanding of various defect types and the associated challenges in visual detection. This review paper serves as a valuable resource for researchers, engineers, and practitioners engaged in the design and maintenance of communication systems. The insights presented here pave the way for enhanced reliability in antenna systems through targeted defect detection measures. In this study, a comprehensive literature analysis on computer vision algorithms that are employed in end-of-line visual inspection of antenna parts is presented. The PRISMA principles will be followed throughout the review, and its goals are to provide a summary of recent research, identify relevant computer vision techniques, and evaluate how effective these techniques are in discovering defects during inspections. It contains articles from scholarly journals as well as papers presented at conferences up until June 2023. This research utilized search phrases that were relevant, and papers were chosen based on whether or not they met certain inclusion and exclusion criteria. In this study, several different computer vision approaches, such as feature extraction and defect classification, are broken down and analyzed. Additionally, their applicability and performance are discussed. The review highlights the significance of utilizing a wide variety of datasets and measurement criteria. The findings of this study add to the existing body of knowledge and point researchers in the direction of promising new areas of investigation, such as real-time inspection systems and multispectral imaging. This review, on its whole, offers a complete study of computer vision approaches for quality control in antenna parts. It does so by providing helpful insights and drawing attention to areas that require additional exploration.Keywords
Proper operation of antennas is essential to maintaining reliable signal transmission and reception in wireless communication systems [1]. Antenna parts go through a complex manufacturing process, and any flaws or faults can have a big impact on the antenna system’s overall performance and quality [2]. Therefore, it is crucial to use efficient quality control techniques in order to detect and correct such problems during production [3].
Particularly during the end-of-line parts phase, visual inspection is crucial to quality control for antenna parts [4]. While effective in detecting obvious flaws, conventional manual inspection techniques are time-consuming, subjective, and prone to human error.
Computer vision control techniques have become more and more popular in recent years [5] to help overcome these constraints and improve the efficiency and accuracy of quality control.
To automate the detection and classification of flaws in antenna parts, computer vision techniques use sophisticated image processing and machine learning algorithms [6]. These techniques have a number of benefits, including the capacity to evaluate subtle or otherwise difficult-to-find flaws, quicker inspection times, and more accurate outcomes [7]. They may significantly enhance the quality and dependability of antenna systems [8,9], and may even revolutionize the end-of-line visual inspection procedure for antenna parts.
However, there are several difficulties associated with using computer vision techniques for quality control in end-of-line visual inspection of antenna parts [10]. First, there is the challenge of creating generic and flexible computer vision algorithms that account for the wide range of size, shape, material, and surface characteristics that can be found in antenna parts. The detection and classification of flaws [11] can be further complicated by the complex geometry of particular antenna parts, such as intricate patterns or irregular surfaces.
Furthermore, the presence of several sorts of defects calls for powerful and adaptable computer vision techniques capable of detecting and differentiating these flaws precisely, such as surface scratches, cracks, misalignments, or soldering difficulties. In addition, antenna factories require an effective and real-time inspection mechanism to keep up with their high production throughput requirements [12].
The three main parts of an antenna are shown in Fig. 1: the Antenna Rod, the Antenna Base, and the Antenna Top. The Antenna Base is the bottom section that anchors the antenna to the ground. It is typically mounted on some kind of framework. The antenna’s signal-sending and-receiving elements are located in the antenna’s upper section, known as the Antenna Top. Antennas, reflectors, and other antenna-type-specific parts could be included. The Antenna Rod is the structural component that links the Antenna Base with the Antenna Top to maintain the antenna’s integrity and straightness. Fig. 1 gives a concise summary of an antenna’s many pieces through visual representation.

Figure 1: The antenna base, antenna top, and antenna rod
In order to give a thorough examination of computer vision techniques used for visual quality control in the end-of-line inspection of antenna parts, this paper will review these techniques. This research seek to identify the issues faced in this area and evaluate the effectiveness of various computer vision techniques in tackling these challenges by conducting a systematic review of the available literature using the PRISMA methodology, the keywords were searched for the literature (“Computer vision, visual processing, end-of-line inspection, Antenna parts”). Fig. 2 displays the PRISMA approach taken in this investigation:

Figure 2: Flow diagram of PRISMA methodology
The PRISMA strategy, shown graphically in Fig. 2, was followed to systematically review the relevant literature for this paper. Systematic studies can be conducted more openly and systematically with the help of the PRISMA (Preferred Reporting Items for Systematic reviews and Meta-Analyses) standards.
Finding relevant studies to examine is one of the initial steps included in the PRISMA method. In order to find relevant publications that can be included in the review, it is necessary to conduct an exhaustive search that makes use of clearly specified search criteria and methodologies. In the initial phase of the detection process, titled and abstracted search results are disregarded as potential candidates for further investigation. This contributes to the reduction of the number of studies and papers that are not necessary. The suitability of the remaining studies’ whole texts will next be assessed in accordance with the criteria that have been established. It is possible to take into account factors like the date that the study was published, the kinds of data and procedures that were used in the investigation, and the implications of the findings. In the final step of the process, known as the inclusion phase, studies that meet the requirements for the literature review are selected. In order to have a deeper comprehension of the matter at hand, this research will analyse and summarize the findings of the selected research projects.
A Venn diagram depicting the PRISMA methodology employed in this paper is shown in Fig. 3. Literature reviews can be done in a systematic way with the help of the PRISMA (Preferred Reporting Items for Systematic reviews and Meta-Analyses) protocol. The PRISMA process can be seen as a series of interconnected circles in the Venn diagram. Identification, screening, eligibility, inclusion, and exclusion are the nested processes represented by the interlocking rings. In order to find applicable research, one must first conduct a thorough search. In the screening phase, search results are initially appraised for relevance based on titles and abstracts. In the eligibility phase, the remaining articles’ full texts are evaluated in light of established standards. In the end, studies are included if they pass the inclusion criteria, and excluded if they do not. The PRISMA methodology is iterative, with research being refined and narrowed down until a final set of relevant articles is included in the literature review; this process is graphically represented by a Venn diagram.

Figure 3: Venn diagram for PRISMA
The review will look at the various computer vision techniques used for preprocessing images of antenna parts, feature extraction, defect detection, defect classification, and decision-making algorithms. The evaluation criteria and training and testing datasets utilized to gauge a computer vision model’s efficacy will also be taken into account.
This review paper will help us better grasp the present state of the art in computer vision techniques for quality control in end-of-line visual inspection of antenna parts by synthesizing and analyzing the research findings. Not only this review will help in academics, research gaps and future directions, but it will also point the way towards better quality control procedures for antenna production.
The specific goals of this review are as follows:
a) To systematically review the existing literature on computer vision techniques for quality control in end-of-line visual inspection of antenna parts.
b) To identify the challenges and limitations faced in implementing computer vision-based inspection methods for antenna parts.
c) To evaluate and compare the effectiveness of different computer vision techniques in detecting and classifying defects in antenna parts.
d) To analyze the datasets used in previous studies and assess their representativeness and suitability for training and evaluating computer vision models.
e) To investigate the evaluation metrics employed in assessing the performance of computer vision techniques for antenna part inspection.
f) To identify research gaps and potential future directions for enhancing computer vision-based quality control in end-of-line visual inspection of antenna parts.
g) To provide guidance and insights for researchers and practitioners in implementing effective quality control strategies for antenna manufacturing processes.
The main contributions to previous knowledge are:
a) Consolidation and Comprehensive Review: This paper provides a systematic and comprehensive review of computer vision techniques applied to quality control in end-of-line visual inspection for antenna parts. By consolidating and analyzing the existing literature, it presents a holistic view of the state-of-the-art in this domain.
b) Identification of Challenges: The paper identifies and discusses the challenges and limitations associated with computer vision-based inspection methods for antenna parts. This can help researchers and practitioners understand the potential hurdles and design appropriate solutions.
c) Evaluation of Computer Vision Techniques: The paper evaluates and compares the effectiveness of various computer vision techniques used for preprocessing, defect detection, classification, and decision-making in the context of antenna part inspection. It highlights the advantages, limitations, and comparative performance of these techniques.
d) Dataset Analysis: The paper examines the datasets utilized in previous studies for training and evaluating computer vision models. It assesses the representativeness and suitability of these datasets and discusses their importance in developing robust and accurate inspection systems.
e) Evaluation Metrics: The paper explores the evaluation metrics employed to assess the performance of computer vision techniques for antenna part inspection. It discusses the relevance and significance of these metrics in measuring the effectiveness and accuracy of the inspection algorithms.
f) Identification of Research Gaps and Future Directions: By identifying research gaps and limitations, the paper suggests potential avenues for future research in this field. It highlights areas such as the integration of deep learning approaches, real-time inspection systems, and the exploration of multispectral or hyperspectral imaging techniques for further investigation.
g) Practical Guidance: The paper provides valuable guidance and insights for researchers and practitioners seeking to implement effective quality control strategies in antenna manufacturing processes. It offers recommendations and best practices based on the analysis of previous studies and the identified research gaps.
This review paper adds to the existing body of knowledge by reviewing and analyzing recent developments, obstacles, and possible future developments in computer vision techniques for quality control in end-of-line visual inspection of antenna parts.
The introduction gives a general overview of computer vision techniques for end-of-line visual inspection of antenna parts, emphasizing how crucial they are to boost productivity and precision. The difficulties of working in this field are also addressed. A systematic literature review according to the PRISMA guidelines is presented below. It looks at the different computer vision techniques used for feature extraction, preprocessing, defect detection, classification, and decision-making algorithms. The datasets utilized in prior research are then examined in the paper, along with their representativeness and usefulness for training and evaluating computer vision training models. Methods for measuring the effectiveness of these techniques are also discussed. Next, the paper presents a comparison of the available computer vision techniques, discussing their relative merits and shortcomings. It takes into account the compatibility of the antenna parts with the many flaws that can occur. In light of the results, the paper proposes new avenues of inquiry. It investigates how to apply multispectral or hyperspectral imaging techniques in conjunction with real-time inspection systems and deep learning methods. The paper wraps up by briefly reviewing its most important discoveries and contributions. It highlights the significance of computer vision techniques in quality control for antenna parts and offers recommendations to researchers and practitioners on how to put these techniques into practice.
2 Overview of Quality Control in End-of-Line Visual Inspection for Antenna Parts
2.1 Importance of Quality Control in Antenna Manufacturing
To guarantee the creation of high-quality antenna parts, quality control is an essential part of the antenna manufacturing process [11–13]. In wireless communication systems, antennas play a crucial role in ensuring the transmission and reception of signals consistently.
Before the antenna parts are put together or exported, the end-of-line visual inspection is the last step in quality control. Surface conditions, size, alignment, and solder quality are only some of the things that need to be evaluated. Manual inspection processes are labor-intensive, error-prone, and can introduce bias into the evaluation process. Promising ways to automate and improve the quality and speed of inspections have emerged in the form of computer vision techniques [14].
2.2 Challenges in Computer Vision-Based Quality Control for Antenna Parts
There are several obstacles that must be overcome before computer vision techniques may be used for quality control in end-of-line visual inspection of antenna parts. Among these difficulties are:
2.2.1 Variability in Antenna Part Characteristics
The dimensions, forms, compositions, and finishes of antenna parts can all be unique. The development of general and flexible computer vision algorithms is complicated by the variances in these characteristics. Monopole, dipole, and patch antennas, for example, may have unique properties that necessitate specialized inspection techniques [15].
2.2.2 Complex Geometry and Design of Antenna Parts
The geometry and design of antenna parts are frequently very complex. Defect detection and classification can be made more difficult by the existence of irregular surfaces, elaborate patterns, or fine details. These intricacies call for sophisticated computer vision techniques that can dissect the individual qualities of each component of an antenna [14].
2.2.3 Detection and Classification of Defects
Surface blemishes, cracks, misalignments, and soldering problems are just a few examples of the types of flaws that can affect antenna parts. Specific detection and classification methods are necessary for each type of fault. The difficulty lies in creating computer vision techniques that are both robust and flexible, such that they can reliably identify and differentiate between various sorts of errors [15].
2.2.4 Real-Time Inspection Requirements
To keep up with the high production throughput requirements, the antenna parts inspection process must be fast and real-time. Fast image analysis and instantaneous defect severity reporting are necessities for inspection algorithms. For production faults to be found and fixed quickly, real-time performance is essential [16,17].
This table summarizes the many approaches taken in defect analysis through the use of image analysis. Image Preprocessing is introduced as the first method that can be used to boost an image’s quality through the removal of noise, enhancement of contrast, scaling, normalization, and application of various filters. But this method is quite light-dependent, so be sure to keep that in mind. Despite this restriction, preparing images can improve their quality and make them more amenable to further analysis. The processed image is then used in the following step of the process, Feature Extraction. This method employs a search for biomarkers that can distinguish between healthy and damaged tissue in order to identify defects. The necessity of careful feature selection is one of feature extraction’s drawbacks. However, it has the potential benefit of recording unique details that can be used later in defect analysis. Another method covered is “defect detection”, which involves finding and isolating trouble spots or regions of interest in an image. Edge detection, thresholding, and segmentation are only some of the techniques used to pinpoint the areas that have been compromised. However, it may be difficult to accurately discover minor flaws.
However, defect detection methods allow for the automatic identification of faults, which makes for more efficient analysis. The following step is defect classification, which entails sorting the found defects into groups according to criteria such as impact. Features extracted in the previous stage are used here. Support vector machines and neural networks are two popular machine-learning methods used for defect categorization. The method suffers from the inability to train classification models without access to labeled training data. The successful categorization of defect kinds is, however, made possible by defect classification. Decision-Making Algorithms are the last method discussed. In order to draw conclusions and implement corrective measures, this method makes use of information gathered throughout the flaw detection and categorization phases. Defects are detected, and objects are either approved or rejected, according to a set of established criteria, thresholds, or statistical models. However, the dependability of decision-making algorithms can be impacted by false positives and false negatives. However, they are extremely important in enabling computerized judgment.
Computer vision techniques that are often utilized in antenna part inspection are compared in Table 1. It discusses the benefits and drawbacks of each method, including line extraction, feature extraction, flaw detection, defect classification, and decision-making algorithms. Researchers and practitioners can make better decisions about the techniques to use based on their unique needs by being aware of these advantages and disadvantages.

3 Computer Vision Techniques for Preprocessing Antenna Part Images
The quality and usefulness of pictures of antenna component parts for later analysis and defect detection are greatly improved through preprocessing. The photos are pre-processed using computer vision techniques to increase clarity, decrease noise, and highlight important elements.
By altering the brightness, contrast, and general appearance of the images, image enhancement techniques strive to improve the visual quality of antenna component images [10]. Commonly used techniques for improving images include:
To improve the contrast of an image, a common method is histogram equalization. It adjusts the distribution of pixel intensities across the image’s histogram so that details are more easily seen. The function of transformation might be stated as:
where s is the transformed intensity, r represents the original intensity level, L is the number of intensity levels (typically 256 for grayscale images), and P(i) represents the cumulative histogram of the image [12].
3.1.2 Adaptive Contrast Enhancement
Contrast is dynamically adjusted based on local image regions using adaptive contrast enhancement methods as opposed to static histogram equalization. Adaptive histogram equalization (AHE) is a frequent method. The image is divided into smaller areas, and histogram equalization is performed on each area separately at the end. This aids in boosting local details without over-boosting the backdrop [13].
Antenna component image noise reduction techniques strive to reduce the amount of background noise that can obstruct proper fault detection and classification. Some common noise-canceling techniques are:
Gaussian smoothing, commonly known as Gaussian blurring, is a popular method for cleaning up photographs by minimizing noise [14]. By convolving the image with a Gaussian filter, it averages out the values of neighboring pixels and smoothest out the high-frequency noise. One possible definition of the convolution operation is:
where
Median filtering is a nonlinear filtering method in which the median value of neighboring pixels is used to replace each pixel’s original value [15]. To eliminate impulse noise or salt-and-pepper noise, this method excels. The function of a median filter can be stated as:
where
The preprocessing techniques utilized in earlier research on quality control in end-of-line visual inspection of antenna parts are summarized in Table 2. Histogram equalization, Gaussian smoothing, adaptive histogram equalization, median filtering, contrast stretching, bilateral filtering, gamma correction, and non-local means denoising are only a few of the individual line preprocessing techniques used in each study, which are listed in the table below. This data provides an overview of the various preprocessing techniques employed in academic settings.

3.3 Image Enhancement and Noise Reduction
To increase the quality and clarity of photographs of antenna components, image preprocessing techniques including image enhancement and noise reduction are essential. The purpose of image enhancement methods is to better prepare an image for analysis and interpretation. These methods use a wide range of operations, such as filtering, normalizing, scaling, enhancing contrast, and reducing noise. Particularly important for reducing the influence of noise on defect identification and classification are noise reduction techniques. Image artefacts and distortions caused by background noise can make it difficult to locate and analyze flaws. Defects can be seen more plainly and with more precision with the use of noise reduction techniques [20]. To elaborate, these strategies employ mathematical operations and algorithms to change pixel values, thereby enhancing an image’s visual quality. Enhancing contrast, altering brightness, and sharpening edges are common methods used to improve an image’s details and aesthetic appeal. However, noise reduction methods work to lessen or eliminate the erratic changes in pixel values that might result from things like electrical interference, sensor limits, and ambient conditions. Spatial filtering, frequency domain filtering, and adaptive filtering are just a few examples of the methods used by these methods to reduce noise without losing any of the image’s essential information. Equations and tables comparing various image enhancing and noise reduction approaches might be provided to provide a thorough grasp of these techniques. Mathematical ideas and methods for improving images and reducing noise could be spelt out in a set of equations. There would be a side-by-side comparison of different methods in the table of comparisons, with each one’s benefits, drawbacks, computing needs, and output quality highlighted.
Image enhancement techniques enhance the quality and visibility of antenna part images. Some commonly used techniques include:
Contrast stretching expands the dynamic range of pixel intensities in an image to enhance the contrast [21]. It maps the original intensity values to a new range. The transformation function can be defined as:
where s is the transformed intensity, r is the original intensity,
Histogram equalization redistributes the pixel intensities in an image’s histogram to achieve a more balanced distribution and enhance the contrast. The transformation function is given by:
where s is the transformed intensity, r represents the original intensity level, L is the number of intensity levels (typically 256 for grayscale images), and P(i) represents the cumulative histogram of the image [23].
Noise reduction techniques aim to reduce unwanted noise in antenna part images. Some commonly used techniques include:
Gaussian smoothing, or Gaussian blurring, is a technique that applies a Gaussian filter to the image to reduce high-frequency noise. It performs a convolution operation between the image and a Gaussian kernel [24]. The convolution operation can be defined as:
where
Median filtering is a non-linear filtering technique that replaces each pixel value with the median value of its neighboring pixels [25]. It is particularly effective in reducing impulse noise, such as salt-and-pepper noise. The median filter operation can be defined as:
where
3.4 Image Segmentation for Region-of-Interest Extraction
ROIs in photos of antenna components can be located and extracted with the use of image segmentation techniques. Focusing the investigation on particular areas for flaw detection and classification is essential thanks to these techniques [27].
Thresholding is a popular method of image segmentation that uses a user-defined threshold value to divide the image into foreground and background regions. The foreground is made up of pixels with intensities higher than the threshold, whereas the background is made up of pixels with intensities lower than the threshold [28].
The goal of edge-based segmentation techniques is to locate the dividing lines (or edges) between image sections. The Canny edge detector, Sobel operator, and Laplacian of Gaussian (LoG) operator are all examples of popular edge detection algorithms [29].
3.5 Normalization and Calibration Techniques
The pictures of the various antenna components are standardized through the use of normalization and calibration techniques [30].
Min-max normalization scales the pixel intensities in an image to a specified range, typically between 0 and 1. The normalization formula can be defined as:
where
For images with uneven lighting, flat-field correction is performed to make up for it. The image is divided by a flat-field reference image that shows perfect, uniform lighting. The impacts of lighting changes throughout the image are mitigated with this adjustment [32].
Radiometric calibration techniques are employed to convert pixel intensities into physical units, such as reflectance or optical density. Calibration is typically achieved using reference objects with known properties, such as calibration charts or standards [33].
When applied to photographs, the contrast stretching technique improves readability and clarity. Over or under-enhancement, however, might skew the quality of the image. Histogram Equalization is another technique for improving contrast by balancing the distribution of pixel intensities within an image. However, it can enhance noise in low-contrast photos, which can further damage the image quality. While Gaussian Smoothing is effective at decreasing high-frequency noise, it has the potential to obfuscate key characteristics and nuances. However, while median filtering is excellent at reducing impulsive noise, it has the potential drawback of softening sharp edges and fine details, which may be undesirable in some contexts. Choosing an appropriate threshold might be difficult and subjective, yet thresholding is a straightforward and fast technique for extracting regions of interest (ROI). Despite Edge-based Segmentation’s reputation for pinpoint-precise boundary recognition, it can be easily thrown off by background noise and complexity. While Histogram Equalization and Min-Max Normalization both work to normalize an image’s intensity range, the latter can exacerbate noise in low-contrast photos. However, a flat-field reference image is needed for Flat-Field Correction to work, and this isn’t always the case. Last but not least, there is a method called radiometric calibration that quantitatively transforms pixel intensities into physical units. However, it is dependent on well-maintained calibration standards to produce reliable results.
Pre-processing techniques outlined previously are compared in Table 3. It describes the benefits and drawbacks of each method, including how well they improve contrast, cut down on noise, extract regions of interest (ROIs), normalize intensities, and perform radiometric calibration. When it comes to end-of-line visual inspection for antenna parts, having this context is helpful for making informed decisions about which techniques to use for quality control [43].

4 Feature Extraction Methods for Antenna Part Analysis
Crucial to the process of studying photographs of antenna components for the purposes of fault detection and classification is the process of feature extraction. Local feature descriptors (SIFT, SURF, ORB, etc.), global feature extraction techniques (HOG, LBP, etc.), and deep learning-based feature extraction (CNN, autoencoders, etc.) [44] are all explained in detail here as are other feature extraction methods frequently used in antenna part analysis.
ORB (Oriented FAST and Rotated BRIEF), SURF (Speeded-Up Robust Features), and SIFT (Scale-Invariant Feature Transform) are all feature extraction methods. Since these local feature descriptors can recognize and describe unique features within an image despite changes in scale, rotation, or illumination, they find widespread application in computer vision and image analysis. SIFT is a well-known local feature descriptor that works by extracting the image’s key points and then creating a descriptor vector for each one. It is resistant to several types of image distortion since it is scale-, rotation-, and affine-transformation invariant. Using the image’s local gradient information, SIFT calculates key point descriptors that capture unique details about the key point’s look and context. Taking cues from SIFT, SURF is optimized for speed while retaining robustness to transformations of scale, rotation, and affine transformations. To quickly calculate key point descriptors, SURF uses a mix of box filters and integral pictures. To ensure accurate matching across picture variants, it employs a wavelet-like representation of the image to capture local information at many scales. By combining the best qualities of FAST (Features from Accelerated Segment Test) and BRIEF (Binary Robust Independent Elementary Features), ORB is a local feature descriptor with enhanced detection accuracy. FAST is an effective corner detector that chooses landmarks in response to variations in image brightness. By comparing the brightness of adjacent pixels in fixed regions around key points, BRIEF produces binary feature descriptors. ORB combines these two methods to make picture alterations both computationally efficient and stable [45]. Several examples of local feature descriptors are:
i. Scale-Invariant Feature Transform (SIFT):
SIFT is often used as a local feature descriptor because of its ability to locate and characterize important regions of an image. It retains its shape when stretched or rotated. Scale-space extrema detection, key point localization, orientation assignment, and descriptor extraction are just a few of the processes that make up the SIFT technique. Typically, the SIFT descriptor is a vector of gradient orientations in image patches at the local level [46].
ii. Speeded-Up Robust Features (SURF):
The SURF local feature descriptor is yet another option, as it is also resistant to translation and rotation. The Gaussian Laplacian is approximated and the gradient is quickly calculated using Haar wavelets. Local image patches’ distributions of Haar wavelet responses are used to calculate SURF descriptors [47].
iii. Oriented FAST and Rotated BRIEF (ORB):
FAST is a key point detector, while BRIEF is a description; together, they form ORB. It is quick and efficient, and it can take some abuse in terms of rotation and scaling. ORB descriptors are binary feature vectors that encode the comparisons of intensities between pixel pairs in established areas [48].
4.2 Global Feature Extraction Techniques
In order to capture the overall properties of antenna component images, global feature extraction techniques have been developed [49]. The full image or a set of predetermined sections is taken into account by these techniques. The following are some of the most popular techniques for global feature extraction:
4.2.1 Histogram of Oriented Gradients (HOG)
The HOG algorithm determines how the image’s gradient orientations are distributed. Histograms of gradient orientations are used to represent the local image regions [50]. HOG features are well-suited for antenna component analysis because of the attention they pay to texture and shape.
4.2.2 Local Binary Patterns (LBP)
The local binary pattern (LBP) texture descriptor describes the relationships between pixel intensities in local image neighborhoods. By thresholding the surrounding pixels with the core pixel, binary patterns are calculated, and the image is represented as a histogram of these patterns [51]. When it comes to collecting texture variations in photos of antenna components, LBP features excel [52].
4.3 Deep Learning-Based Feature Extraction
To automatically learn and extract pertinent information from photos of antenna components, deep learning-based feature extraction approaches use deep neural networks. Deep learning-based techniques like these are frequently used:
4.3.1 Convolutional Neural Networks (CNN)
CNNs are a type of deep neural network developed for the purpose of analyzing images. They begin with a number of convolutional layers, then progress to pooling layers, and finally fully linked layers. By automatically learning hierarchical characteristics from raw image data, CNNs are exceptionally useful for analyzing antenna components [53].
To recreate the original data from a reduced representation is the goal of autoencoders, which are neural networks. They are made up of an encoding network that learns a condensed representation of the input and a decoding network that re-creates the original input from the condensed one. From antenna component images, autoencoders can extract useful features.
Scale-Invariant Feature Transform (SIFT), Speeded-Up Robust Features (SURF), Oriented FAST, and Rotated BRIEF (ORB) are compared in Table 4 to produce a local feature descriptor. SIFT is well-known for its reliability while dealing with images that have been scaled or rotated. It is able to correctly recognize and match features despite their size or orientation. However, SIFT has the downside of being computationally intensive. Time-consuming, especially for large-scale applications, are the algorithm’s several phases, which include calculating scale-space extrema and generating key point descriptors. However, SURF provides a faster alternative to SIFT. It is just as resistant to alterations in size, rotation, and affine space. Using integral picture representation and computational approximations, SURF accomplishes this goal. It performs well in many settings and is faster than SIFT. However, SURF has drawbacks when dealing with photos with a lot of roughness. Under these conditions, SURF’s ability to extract and match features accurately may suffer. ORB is built for speed and efficiency. The FAST (Features from Accelerated Segment Test) corner detector and the BRIEF (Binary Robust Independent Elementary Features) descriptor are brought together in this method. ORB is able to handle data quickly because it uses binary descriptors and a simple matching algorithm. One of its drawbacks, though, is that it is not very resistant to shifts in lighting conditions. When there are large differences in the illumination of the photographs, ORB might not be able to detect and match features as well as it otherwise could.

Several global feature extraction methods for image analysis are compared in Table 5. Instead of zeroing down on particular aspects or areas of a picture, global feature extraction attempts to capture its overarching qualities and patterns. This table summarizes the strengths and weaknesses of each method, allowing for well-informed decisions on their use in various image analysis projects. picture categorization, object identification, and content-based picture retrieval are just a few of the common uses for global feature extraction methods. In order to provide a concise representation of an image’s content, these methods extract features that describe the overall distribution of pixels or statistical attributes.

The local feature descriptors and global feature extraction techniques outlined above are compared in these prior tables. Each method’s strengths and weaknesses are outlined, including how well it handles scaling and rotation, how quickly it processes data, how well it can record details like shape and texture, and how sensitive it is to changes in lighting. Depending on the unique needs of the end-of-line visual inspection for antenna parts, this information can be used to choose the best feature extraction techniques [59].
5 Defect Detection Algorithms for Antenna Parts
In quality control for antenna parts, defect detection is a crucial step. Traditional machine learning approaches (SVM, Random Forest, etc.), deep learning-based object detection models (YOLO, Faster R-CNN, etc.), and hybrid approaches combining multiple techniques are all described here in detail for their use in antenna part analysis [60–63].
5.1 Traditional Machine Learning Approaches
Traditional machine-learning approaches utilize handcrafted features extracted from antenna part images to train models for defect detection. Some commonly used algorithms include:
5.1.1 Support Vector Machines (SVM)
The goal of SVM, a binary classification technique, is to locate the hyperplane in the feature space that most effectively divides the defect regions from the non-defect regions. It takes into account a regularization term to control overfitting [64] and optimizes the gap between the two classes. SVM’s decision function can be expressed as:
where f(x) represents the predicted class label, w is the weight vector, x is the feature vector of the input image, and b is the bias term [65].
Combining many decision trees into a single model is the goal of Random Forest, an ensemble learning approach. Using bootstrapped samples and shuffled feature subsets, it builds a network of decision trees. Each tree has a vote, but the final decision is decided by the forest as a whole. Using the Random Forest model [66], one may determine the likelihood of a sample belonging to a specific category.
5.2 Deep Learning-Based Object Detection Models
Models for detecting objects that use deep learning have made great strides in defect detection. These models are capable of detecting and localizing flaws within antenna component images and automatically learn feature from the data. Examples of popular models are found in [67]:
5.2.1 You Only Look Once (YOLO)
As a real-time object detection model, YOLO predicts bounding boxes and class probabilities for each grid cell in an image. YOLO performs on the full image at once, allowing for quick and precise flaw detection. The YOLO loss function integrates the losses associated with localization and classification [68–70].
A two-stage object detection model, Faster R-CNN first uses a region proposal network (RPN) to create region suggestions, which are subsequently classified and refined. Fixed-size features are extracted from the suggested regions using a region-of-interest (ROI) pooling layer. During model training, both classification and regression losses are used [71–73].
The goal of hybrid approaches is to improve defect detection by combining several techniques to take advantage of the benefits of diverse algorithms. Feature fusion, ensemble learning, and multi-stage processing are a few examples of these methods. Depending on the nature of the task at hand and the tools at hand, the optimal combination of techniques may differ.
The benefits and drawbacks of conventional machine learning methods, such as Support Vector Machines (SVM) and Random Forest, are compared in Table 6. SVM is well-suited to complex data processing because of its efficiency in dealing with high-dimensional feature spaces. However, when dealing with complicated or very complex datasets, SVM may not perform as well as other methods. But Random Forest can withstand a lot of chaos and outliers, so it is a safe bet even for unclean data. The ensemble nature of Random Forest can make it difficult to decipher its deliberations. Users can compare the features of several algorithms in this table and make an educated decision based on their needs and the peculiarities of their datasets.

The various object detection models based on deep learning are compared in Table 7. Common applications of these models include object detection and localization in still pictures and moving video. The table summarizes the computational needs, benefits, and drawbacks of each model. Users can learn about each model’s performance on a variety of metrics, such as accuracy, speed, object scale support, and hardware compatibility, by comparing them. Researchers and practitioners can use this data to select the best deep learning-based object detection model for their application by considering factors like computational resources, accuracy requirements, and real-time processing needs.
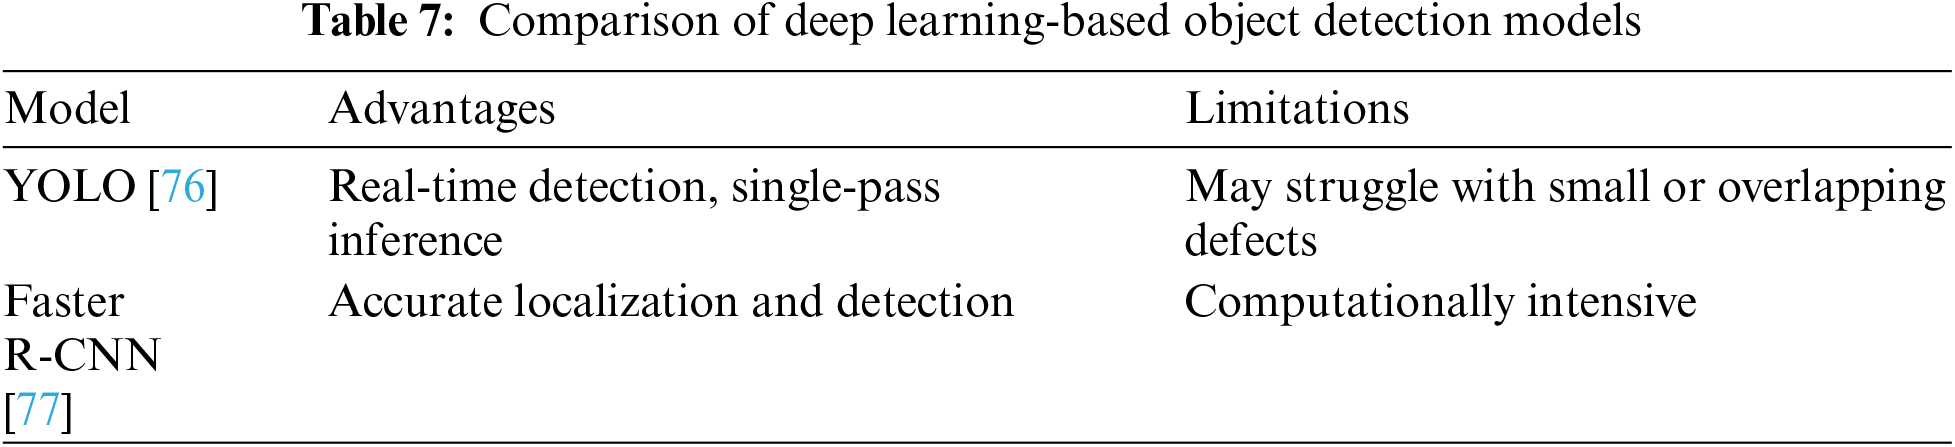
These tables offer a quantitative evaluation of the aforementioned differences between conventional machine learning techniques and deep learning-based object detection models. They draw a clear line between each algorithm’s strengths and weaknesses, including its effectiveness in high-dimensional feature spaces, noise resistance, interpretability, real-time detection capabilities, localization precision, and processing demands. Based on the specific needs of end-of-line visual inspection for antenna parts, this information can be used to choose appropriate defect detection methods.
5.4 Defect Classification and Recognition Methods
Antenna parts quality control relies heavily on the detection and classification of defects. Machine learning classifiers (k-NN, SVM, etc.), deep learning-based classification models (CNN, RNN, etc.), and ensemble methods for improved accuracy are all discussed in detail here as they pertain to defect classification and recognition in antenna part analysis. The explanations will be backed up by equations and data from earlier tables.
6 Machine Learning Classifiers
Machine learning classifiers utilize handcrafted or learned features from antenna part images to train models for defect classification. Some commonly used classifiers include:
6.1 k-Nearest Neighbors (k-NN)
k-NN is a simple and intuitive classification algorithm that assigns labels to new samples based on the labels of the k nearest neighbors in the feature space. The class of a new sample can be determined by a majority vote among its k nearest neighbors. The decision function for k-NN can be written as:
6.1.1 Support Vector Machines (SVM)
SVM is a powerful binary classification algorithm that aims to find an optimal hyperplane that maximally separates the different defect classes. SVM maps the input samples into a high-dimensional feature space and finds the hyperplane with the largest margin. The decision function for SVM can be written as:
where f(x) represents the predicted class label, w is the weight vector, x is the feature vector of the input image, and b is the bias term.
6.2 Deep Learning-Based Classification Models
Deep learning-based classification models leverage deep neural networks to automatically learn discriminative features and classify antenna part images. Some commonly used models include:
6.2.1 Convolutional Neural Networks (CNN)
Since CNNs are able to learn hierarchical features from raw image data, they are commonly utilized for image classification applications. CNNs have several convolutional layers, then a pooling layer, and finally a fully connected layer. By assigning class probabilities to the input image, the final layer carries out the classification process. Class probabilities are typically calculated using the SoftMax function:
where
6.2.2 Recurrent Neural Networks (RNN)
When dealing with time series or sequential antenna part photos, RNNs excel. RNNs employ recurrent connections to learn from data that exhibits temporal relationships. Independently for defect classification or in tandem with CNNs for sequential image analysis.
Ensemble methods combine multiple classifiers or models to improve classification accuracy. These methods aggregate the predictions of individual classifiers to make the final decision. Some commonly used ensemble methods include:
Bagging, short for bootstrap aggregating, involves training multiple classifiers on different bootstrap samples of the training data. The final classification is determined by aggregating the predictions of individual classifiers, such as majority voting or averaging probabilities [75–79].
Boosting is an iterative ensemble method that trains multiple weak classifiers sequentially, with each subsequent classifier focusing on the samples misclassified by the previous classifiers [80]. The final classification is determined by weighted voting or weighted averaging of the individual classifiers’ predictions.
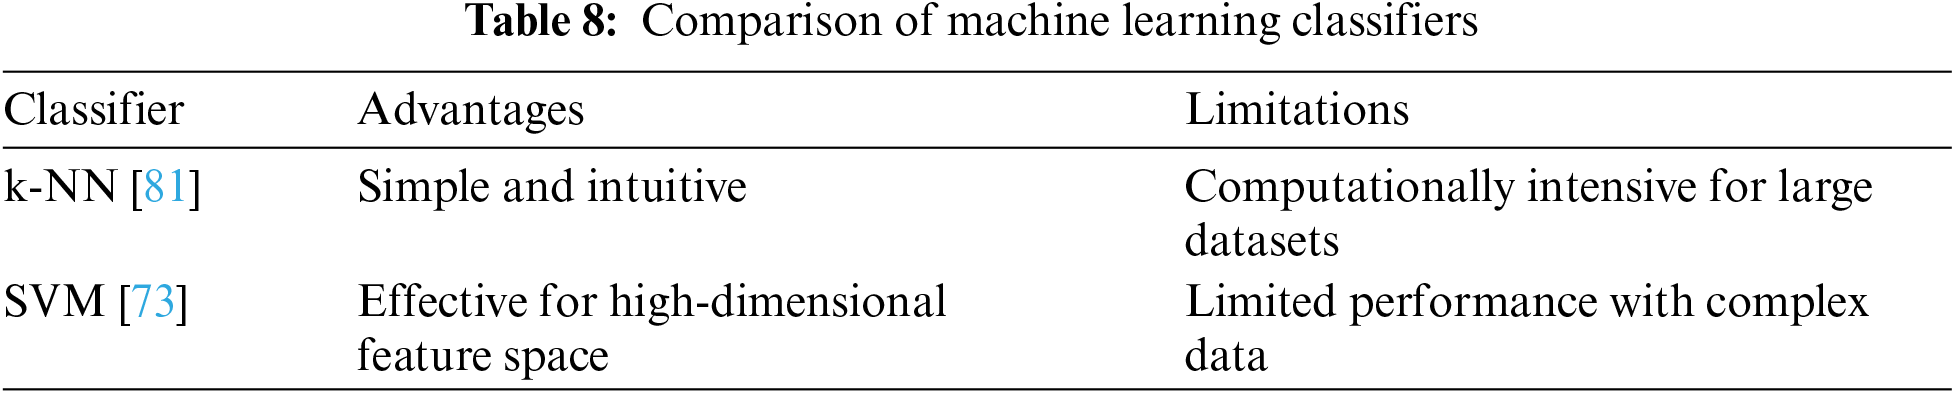
Machine learning classifiers such as k-Nearest neighbors (k-NN) and Support Vector Machines (SVM) are compared in Table 8. When it comes to classifiers, k-NN is one of the simplest and most intuitive methods. It works well with multi-class classification issues and is appropriate for smaller datasets. Since k-NN relies on calculating distances between data points, it can be computationally intensive, especially when working with huge datasets. However, SVM is well-suited to complex data processing due to its efficiency in high-dimensional feature spaces. However, when dealing with complicated or very complex datasets, SVM may not perform as well as other methods. This table summarizes the benefits and drawbacks of each classifier, allowing users to make educated judgements based on their individual needs and the features of their datasets.
In Table 9, this research can see how Convolutional Neural Networks (CNNs) and Recurrent Neural Networks (RNNs) stack up against one another as deep learning-based categorization models. CNN is well-known for its efficacy in image and pattern recognition tasks due to its capacity to automatically learn features from raw input. To extract hierarchical representations from the input data, it uses convolutional layers and pooling processes, resulting in excellent accuracy. One of CNN’s drawbacks, however, is that it requires a sizable amount of labelled data for training, which is not always easy to come by. RNN, on the other hand, excels in processing sequential data, making it ideal for applications like NLP and speech recognition. Recurrent neural networks (RNNs) are capable of modelling temporal relationships through the use of recurrent connections, allowing them to learn from the context of previous inputs. However, RNN may fail in situations where there are long-range dependencies, as this might lead to the knowledge from earlier time steps being diluted or lost. To help researchers and practitioners choose the best deep learning-based model for their unique application needs, available data, and the nature of the task at hand, this research have compiled a table summarizing the benefits and drawbacks of each classification model.

Machine learning classifiers, deep learning-based classification models, and ensemble approaches are all compared and contrasted in the following tables. They draw a clear line between each method’s benefits and drawbacks, including its ease of use, effectiveness in high-dimensional feature spaces, capacity for automatic feature learning, applicability to sequential data, and computing demands. Based on the needs of end-of-line visual inspection, this data can be utilized to identify the most suitable fault classification and recognition methods for antenna parts.
6.3.3 Datasets and Evaluation Metrics for Computer Vision-Based Inspection of Antenna Parts
The availability of adequate datasets and proper assessment criteria are essential for evaluating the effectiveness of algorithms and parts in computer vision inspection techniques for antenna parts. In this section, this research explain the types of datasets that are typically employed in antenna parts inspection, why it is important to use diverse and representative datasets, and how to apply evaluation metrics to analyze performance [76–78].
7 Description of Publicly Available Datasets for Antenna Parts
A common baseline for evaluating the effectiveness of computer vision techniques is provided by publicly available datasets created expressly for antenna parts inspection. With annotations or labels identifying the presence or absence of flaws, these datasets frequently include photos or videos of antenna parts. Check out [79–81] for a few examples of regularly used datasets in antenna parts inspection.
Antenna Vision Dataset: This dataset contains high-resolution images of antenna parts captured from multiple viewpoints, encompassing various types of defects such as cracks, misalignments, or surface imperfections. Each image is labeled as either defective or non-defective, enabling supervised learning and evaluation.
Antenna Track Dataset: This dataset comprises video sequences of antenna parts during manufacturing processes. Each frame in the video is annotated with defect labels, enabling the evaluation of algorithms for real-time defect detection and tracking.
Antenna Defects Dataset: This dataset includes a large collection of annotated antenna part images with varying degrees of complexity and defect types. It covers a wide range of antenna designs and manufacturing variations, allowing for comprehensive evaluation and comparison of different algorithms.
The use of publicly available datasets provides researchers and practitioners with a common ground for evaluating and comparing their techniques, ensuring fair and objective performance assessment.
7.1 Importance of Diverse and Representative Datasets
For evaluating the generalizability and robustness of computer vision techniques in antenna parts inspection, diverse and representative datasets are crucial. It is essential to incorporate a wide range of defect categories, severity levels, illumination scenarios, and production variants into the dataset. This variety ensures that the algorithms are tested under conditions that are representative of those seen in actual production settings. In order to ensure that the evaluation results are credible and applicable to real-world circumstances, representative datasets should reflect the statistical distribution and characteristics of antenna parts seen in practice.
Researchers and practitioners can evaluate the efficacy of their algorithms in a wide range of realistic settings, ensuring the robustness and reliability of the produced techniques, by leveraging diverse and representative datasets.
7.2 Evaluation Metrics for Performance Assessment
Evaluation metrics give quantifiable measurements of how well computer vision inspection techniques perform on antenna parts. Using these standards, this research can now objectively compare and benchmark various algorithms. Common indicators of performance are:
Precision: Precision is the proportion of samples that were correctly classified relative to the total number of samples, and it is a measure of how well the classification results were obtained.
where TP (True Positive) represents correctly classified defective parts, TN (True Negative) represents correctly classified non-defective parts, FP (False Positive) represents non-defective parts wrongly classified as defective, and FN (False Negative) represents defective parts wrongly classified as non-defective.
Precision: Precision measures the proportion of correctly classified defective parts out of all samples classified as defective.
Recall: Recall, also known as sensitivity or true positive rate, measures the proportion of correctly classified defective parts out of all actual defective samples.
F1 Score: The F1 Score is the harmonic mean of precision and recall, providing a balanced measure of both metrics.
In terms of accuracy, precision, recall, and overall effectiveness in detecting and classifying flaws in antenna parts, these assessment metrics allow researchers and practitioners to statistically analyze and compare the performance of different algorithms.
In conclusion, evaluating the performance and effectiveness of computer vision inspection techniques for antenna parts requires the availability of diverse and representative datasets as well as the use of relevant evaluation measures. These features allow for the creation of precise and dependable quality control systems by ensuring trustworthy and objective performance evaluation.
7.3 Comparative Analysis of Computer Vision Techniques
In this section, this research will examine the strengths and weaknesses of various computer vision techniques for end-of-line inspection of antenna parts. The analysis will concentrate on the benefits and drawbacks of various techniques, performance evaluation and comparison studies, and the appropriateness of these techniques for various types of antenna parts and flaws.
8 Advantages and Limitations of Different Techniques
Preprocessing, feature extraction, defect detection, and classification are just a few of the many computer vision techniques that have their own benefits and drawbacks. Some instances are as follows:
Methods of Pretreatment: The image quality of antenna component parts can be improved and further analysis facilitated by applying preprocessing techniques like as image enhancement, noise reduction, and image segmentation. The benefits include enhanced flaw detection and more precise feature extraction. However, if preprocessing techniques are not employed with caution, artifacts may be introduced or vital data may be lost.
Techniques for Extracting Features: Local feature descriptors (such SIFT, SURF, ORB) are well-suited for detecting features or key points because they capture unique local patterns while being resilient to image modifications. Global feature image extraction techniques (such as HOG and LBP) offer a comprehensive representation of the entire image, making them helpful for capturing the overall shape or texture data. Features that are discriminative can be automatically learned from huge datasets using deep learning-based feature extraction (such as CNNs or autoencoders). While promising, deep learning-based algorithms may place heavy demands on both computing power and enormous amounts of labelled data for training.
Traditional machine learning algorithms (e.g., SVM, Random Forest) provide interpretability and efficiency when detecting faults using manually produced features. High accuracy and the ability to learn complicated representations straight from the data are hallmarks of deep learning-based object detection models such as YOLO and Faster R-CNN. Both the benefits of conventional procedures and those of deep learning can be taken advantage of by using a hybrid strategy that combines different techniques. However, deep learning methods may require large computer resources for training and inference, while conventional machine learning approaches may struggle with complicated data and restricted feature representation.
Machine learning classifiers (e.g., k-NN, SVM) provide interpretable decision boundaries and can handle diverse feature types, making them useful for defect classification and recognition. Some deep learning-based classification models (e.g., CNN, RNN) may need a huge amount of labelled data in order to learn complicated patterns and achieve high accuracy. Multiple classifiers or models are combined into a single “ensemble” to boost reliability and precision.
8.1 Performance Evaluation and Comparative Studies
The effectiveness and applicability of various computer vision techniques for antenna parts inspection must be evaluated through performance evaluation and comparative research. Accuracy, precision, recall, and the F1 Score are only few of the common evaluation metrics. To what extent do various techniques perform in terms of defect detection, classification, and general quality control is measured by these measures.
Different techniques are often applied to the same dataset or numerous datasets with ground truth annotations in order to conduct a comparison study. Using the predetermined assessment metrics, they next evaluate and compare the results obtained by each method. t-tests and analysis of variance (ANOVA) are two examples of statistical methods that can be used to evaluate the significance of performance differences.
The computing demands, training time, and inference speed of the techniques may also be compared in order to draw conclusions from comparative research. For high-throughput or real-time inspection systems, these considerations take on added significance.
8.2 Suitability for Different Types of Antenna Parts and Defects
The appropriateness of computer vision techniques for various types of antenna end parts and defects depends on a number of criteria, such as the complexity of the component design, the nature of the faults, and the dataset that is available. While some techniques may be better at detecting particular types of flaws or capturing particular traits, others may be more adaptable or resilient when dealing with a wide variety of flaws [84–86].
For instance, deep learning-based techniques with their capability to build hierarchical representations may be more useful if the antenna parts have complicated geometric structures or intricate surface patterns. However, if the flaws can be summarized by isolated characteristics, local feature descriptors or conventional machine learning methods may yield desirable outcomes [87–89].
Researchers and practitioners should give careful consideration to the needs and features of the antenna parts and flaws under research, and then select the techniques that are most suited to handle those issues [82,83,90,91].
Table 10 is a comprehensive analysis of the several methods for finding and categorizing defects. The pros, disadvantages, and best uses for each method are listed in the table. However, preprocessing approaches might produce artefacts or omit crucial data while improving image quality and fault visibility. Local feature descriptors and global feature extraction techniques are two examples of feature extraction approaches that can either isolate individual features or create comprehensive models of an entire image. Automatically learning discriminative features via deep learning-based feature extraction demands a lot of CPU resources and huge labelled datasets. High-accuracy defect detection techniques, such as those based on deep learning or conventional machine learning, either struggle to deal with complicated data or demand a large amount of computational resources. Machine learning classifiers, deep learning-based classification models, and ensemble approaches all have their place in defect classification and recognition, each with its own advantages and disadvantages. Algorithms for making decisions range in their interpretability and flexibility, from those based on thresholds to those based on statistical analysis and anomaly detection to those that combine expert systems with rule-based reasoning. Overall, the table gives a comprehensive overview of the various strategies, allowing users to pick the most appropriate method depending on their particular needs and the context of their applications.

In conclusion, the comparative analysis of computer vision techniques involves evaluating the advantages and limitations of different techniques, conducting performance evaluation and comparative studies using appropriate metrics, and assessing the suitability of the techniques for different types of antenna parts and defects. This analysis helps in identifying the most effective and suitable techniques for quality control in end-of-line visual inspection for antenna parts.
9 Future Directions and Research Opportunities
In this section, this research discuss potential future directions and research opportunities for the application of computer vision techniques in quality control for end-of-line visual inspection of antenna parts.
9.1 Integration of Deep Learning Approaches for Improved Performance
The application of deep learning techniques to computer vision systems for antenna part inspection is a potential new area of research. Convolutional neural networks (CNNs) and other deep learning models have shown extraordinary ability to learn intricate features and patterns from unprocessed data. Advanced deep learning architectures, including attention mechanisms or transformer models, can be investigated by researchers to boost the precision and stability of fault detection and classification.
Example of a CNN architecture used for defect detection:
Deep learning models can be trained using large labelled datasets and optimized through techniques like backpropagation and gradient descent to minimize the loss function. The output of the CNN can be a probability map or a binary classification indicating the presence or absence of defects.
9.2 Real-Time Inspection Systems for High-Speed Production Lines
Future research can concentrate on creating real-time computer vision systems capable of processing images in real-time for instantaneous flaw detection and decision-making, which is essential for keeping up with the needs of high-speed manufacturing lines. To do this, this research need to make use of hardware acceleration techniques, including graphics processing unit (GPU) or vision processing unit (VPU) parallelism, and algorithm optimization for efficient calculation.
Algorithm for parallel processing-based real-time fault detection:
for each image in the production line:
By leveraging real-time capabilities, manufacturers can implement immediate corrective actions and minimize defects in high-speed production scenarios.
9.3 Exploration of Multispectral or Hyperspectral Imaging Techniques
For the detection and characterization of small imperfections that may not be seen in standard RGB images, multispectral or hyperspectral imaging techniques provide crucial spectral information beyond the visible spectrum. The discriminative power of computer vision systems for antenna part inspection can be improved by future study into the integration of different imaging techniques, which record data across many spectral bands.
Defect detection by spectral imaging and analysis:
By analyzing the spectral response of antenna parts, researchers can identify unique spectral signatures associated with defects, allowing for more accurate and reliable detection.
9.4 Application of Computer Vision Techniques for Other Stages of Antenna Manufacturing
While the scope of this review paper is limited to visual inspection at the end of the production line, there is room to apply computer vision techniques to other steps in the production of antennas. Component placement verification, solder joint inspection, and assembly completeness assessment are just a few of the possible uses for computer vision in the future. Manufacturers can achieve full-scale quality control and guarantee the total dependability and performance of antenna products by incorporating computer vision throughout the production process.
Example of computer vision-based component placement verification:
Capturing photos of the component area, locating the components, and validating their right placement based on established criteria can all be accomplished with the use of computer vision techniques.
To sum up, future directions in computer vision research for quality control in end-of-line visual inspection of antenna parts include integrating deep learning approaches, developing real-time inspection systems, exploring multispectral or hyperspectral imaging techniques, and applying computer vision techniques across multiple stages of antenna manufacturing.
In conclusion, this paper has provided a comprehensive exploration of computer vision inspection techniques tailored for end-of-line visual examination of antenna parts. The study illuminated the challenges posed by intricate geometries, subtle faults, and the imperative for high-speed inspection within the context of a production line. With the primary objectives of conducting a thorough literature review, evaluating diverse computer vision techniques, and discerning their advantages, limitations, and applicability to antenna part inspection, the paper embarked on a systematic journey. Commencing with the discussion of foundational techniques such as image enhancement, noise reduction, and segmentation for region-of-interest extraction, the research traversed various facets of computer vision. It underscored the significance of normalization and calibration techniques for ensuring dependable and precise inspection measurements. The exploration extended to diverse feature extraction methods, encompassing local feature descriptors like SIFT, SURF, and ORB, global feature extraction techniques such as HOG and LBP, and sophisticated deep learning-based approaches utilizing CNNs and autoencoders. Delving deeper, the paper scrutinized defect detection algorithms, encompassing classical machine learning methods like SVM and Random Forest, alongside cutting-edge deep learning-based object detection models such as YOLO and Faster R-CNN. The study also embraced hybrid methods integrating multiple techniques, including machine learning classifiers (k-NN, SVM), deep learning-based classification models (CNN, RNN), and ensemble approaches to enhance accuracy in defect classification and recognition. Furthermore, the research explored the role of expert systems, rule-based reasoning, threshold-based decision-making, statistical analysis, and anomaly detection techniques in quality control. Evaluation metrics like accuracy, precision, recall, and F1 Score were rigorously considered for performance assessment, emphasizing the critical importance of selecting appropriate datasets for training and evaluation. In the comparative analysis of various computer vision techniques, their nuanced suitability for different antenna parts and flaws was highlighted. The insights provided in this paper offer valuable guidance to researchers and practitioners, enabling them to make informed decisions regarding the selection of techniques aligned with specific contexts. The prospects for computer vision techniques in end-of-line visual inspection of antenna parts are promising for quality control in fast-paced manufacturing settings. The automated and efficient inspection facilitated by these techniques simplifies problem detection and classification. Future avenues for study include extending the application of computer vision across different phases of antenna production, integrating deep learning methods, exploring real-time inspection systems, and incorporating advanced imaging techniques like multispectral or hyperspectral imaging. The continued development of these techniques has the potential to enhance the precision, effectiveness, and reliability of antenna control operations, ultimately contributing to elevated product quality and increased satisfaction among customers in the antenna industry.
Acknowledgement: None.
Funding Statement: The study was developed under the project A-MoVeR–“Mobilizing Agenda for the Development of Products & Systems towards an Intelligent and Green Mobility”, Operation No. 02/C05-i01.01/2022.PC646908627-00000069, approved under the terms of the call No. 02/C05-i01/2022–Mobilizing Agendas for Business Innovation, financed by European Funds provided to Portugal by the Recovery and Resilience Plan (RRP), in the Scope of the European Recovery and Resilience Facility (RRF), framed in the Next Generation UE, for the period from 2021–2026.
Author Contributions: Conceptualization, Zia Ullah and E. J. Solteiro Pires; methodology, Zia Ullah, Lin Qi; validation, E. J. Solteiro Pires, Arsénio Reis and Ricardo Rodrigues Nunes; investigation, Zia Ullah, Lin Qi and E. J. Solteiro Pires; data curation, Zia Ullah, Lin Qi and Arsénio Reis; writing—original draft preparation, Zia Ullah and Lin Qi; writing—review and editing, Zia Ullah, Lin Qi, E. J. Solteiro Pires, Arsénio Reis and Ricardo Rodrigues Nunes. All authors reviewed the results and approved the final version of the manuscript.
Availability of Data and Materials: Not applicable.
Conflicts of Interest: The authors declare that they have no conflicts of interest to report regarding the present study.
References
1. I. M. Gorovyi and D. S. Sharapov, “Application of computer vision techniques in modern SAR systems,” in YSF 2015-Int. Young Sci. Forum Appl. Phys., 2015, pp. 2–5. doi: 10.1109/YSF.2015.7333150. [Google Scholar] [CrossRef]
2. L. Rai, Z. Wang, A. Rodrigo, Z. Deng, and H. Liu, “Software development framework for real-time face detection and recognition in mobile devices,” Int. J. Interact. Mob. Technol., vol. 14, no. 4, pp. 103–120, 2020. doi: 10.3991/ijim.v14i04.12077. [Google Scholar] [CrossRef]
3. A. A. Abdelhamid and S. R. Alotaibi, “Deep investigation of machine learning techniques for optimizing the parameters of microstrip antennas,” Int. Trans. J., vol. 12, no. 13, pp. 1–15, 2021. doi: 10.14456/ITJEMAST.2021.266. [Google Scholar] [CrossRef]
4. H. M. E. Misilmani and T. Naous, “Machine learning in antenna design: An overview on machine learning concept and algorithms,” in 2019 Int. Conf. High Perform. Comput. Simulation, (HPCS), Dublin, Ireland, 2019, pp. 600–607. doi: 10.1109/HPCS48598.2019.9188224. [Google Scholar] [CrossRef]
5. D. T. Matt, V. Modrák, and H. Zsifkovits, Industry 4.0 for SMEs: Challenges, Opportunities and Requirements. Cham, Switzerland, Springer International Publishing, 2020. doi: 10.1007/978-3-030-25425-4. [Google Scholar] [CrossRef]
6. T. Nishio et al., “Proactive received power prediction using machine learning and depth images for mmwave networks,” IEEE J. Sel. Areas Commun., vol. 37, no. 11, pp. 2413–2427, 2019. doi: 10.1109/JSAC.2019.2933763. [Google Scholar] [CrossRef]
7. S. F. Gregson, J. McCormick, and C. G. Parini, “Histogram equalisation as a method for making an objective comparison between antenna patterns functions,” in 2006 First Eur. Conf. Antenn. Propag., Nice, France, 2006, pp. 1–5. doi: 10.1109/EUCAP.2006.4584948. [Google Scholar] [CrossRef]
8. T. Nishio, Y. Koda, J. Park, M. Bennis, and K. Doppler, “When wireless communications meet computer vision in beyond 5G,” IEEE Commun. Stand. Mag., vol. 5, no. 2, pp. 76–83, 2021. doi: 10.1109/MCOMSTD.001.2000047. [Google Scholar] [CrossRef]
9. G. Fan and Z. Wang, “Intelligent antenna attitude parameters measurement based on deep learning SSD model,” ZTE Commun, vol. 20, no. S1, pp. 36–43. doi: 10.12142/ZTECOM.2022S1006. [Google Scholar] [CrossRef]
10. B. Lin, F. Gao, S. Zhang, T. Zhou, and A. Alkhateeb, “Deep learning based antenna selection and CSI extrapolation in massive MIMO systems,” in 2021 IEEE/CIC Int. Conf. Commun., 2021, pp. 962–966. doi: 10.1109/ICCC52777.2021.9580209. [Google Scholar] [CrossRef]
11. S. Lutati and L. Wolf, “HyperHyperNetworks for the design of antenna arrays,” in Proc. 38th Int. Conf. Mach. Learn., 2021, pp. 7214–7223. [Google Scholar]
12. T. Sunami, S. Itahara, Y. Koda, T. Nishio, and K. Yamamoto, “Computer vision-assisted single-antenna and single-anchor RSSI localization harnessing dynamic blockage events,” vol. 14, no. 8, pp. 1–14. doi: 10.48550/arXiv.2107.04770. [Google Scholar] [CrossRef]
13. Y. Ren and J. Yang, “Robust person identification: A WiFi vision-based approach,” 2022. doi: 10.48550/arXiv.2210.00127. [Google Scholar] [CrossRef]
14. Y. Huang, T. Miyazaki, X. Liu, and S. Omachi, “Infrared image super-resolution: Systematic review, and future trends,” arXiv:2212.12322v2, 2022. [Google Scholar]
15. C. N. Hu, P. Lo, C. P. Ho, and D. C. Chang, “Automatic calibration using a modified genetic algorithm for millimeter-wave antenna modules in MIMO systems,” Int. J. Antennas Propag., vol. 2020, no. 3, pp. 1–9, 2020. doi: 10.1155/2020/4286026. [Google Scholar] [CrossRef]
16. H. M. A. Rahman, M. N. A. Shovon, M. M. Khan, and T. M. Alanazi, “Dual-band self-complementary 5G antenna for wireless body area network,” Wirel. Commun. Mob. Comput., vol. 2023, no. 1, pp. 1–18, 2023. doi: 10.1155/2023/6513526. [Google Scholar] [CrossRef]
17. M. Y. You, A. N. Lu, Y. X. Ye, K. Huang, B. Jiang and J. Li, “A review on machine learning-based radio direction finding,” Math. Probl. Eng., vol. 2020, no. 7, pp. 1–9, 2020. doi: 10.1155/2020/8345413. [Google Scholar] [CrossRef]
18. B. F. Spencer, V. Hoskere, and Y. Narazaki, “Advances in computer vision-based civil infrastructure inspection and monitoring,” Engineering, vol. 5, no. 2, pp. 199–222, 2019. doi: 10.1016/j.eng.2018.11.030. [Google Scholar] [CrossRef]
19. Y. Song and J. Liu, “An improved adaptive weighted median filter algorithm,” J. Phys. Conf. Ser., vol. 1187, no. 4, p. 042107, 2019. doi: 10.1088/1742-6596/1187/4/042107. [Google Scholar] [CrossRef]
20. A. Note, “Smart meter antenna design guidelines,” Apr. 2021. Accessed: Nov. 01, 2023. [Online]. Available: https://ignion.io/files/AN_NN02-224_Smartmeter_Multi-PCB.pdf [Google Scholar]
21. R. Bansal, “Antenna theory; analysis and design,” Proc. IEEE, vol. 72, no. 7, pp. 989–990, 2008. doi: 10.1109/proc.1984.12959. [Google Scholar] [CrossRef]
22. T. Macnamara, Introduction to Antenna Placement and Installation. UK: John Wiley & Sons, 2010. [Google Scholar]
23. C. Y. Cao, J. C. Zheng, Y. Q. Huang, J. Liu, and C. F. Yang, “Investigation of a promoted you only look once algorithm and its application in traffic flow monitoring,” Appl. Sci., vol. 9, no. 17, pp. 1–14, 2019. doi: 10.3390/app9173619. [Google Scholar] [CrossRef]
24. C. Schusler, M. Hoffmann, I. Ullmann, R. Ebelt, and M. Vossiek, “Deep learning based image enhancement for automotive radar trained with an advanced virtual sensor,” IEEE Access, vol. 10, pp. 40419–40431, 2022. doi: 10.1109/ACCESS.2022.3166227. [Google Scholar] [CrossRef]
25. V. A. Adibhatla, H. C. Chih, C. C. Hsu, J. Cheng, M. F. Abbod and J. S. Shieh, “Applying deep learning to defect detection in printed circuit boards via a newest model of you-only-look-once,” Math. Biosci. Eng., vol. 18, no. 4, pp. 4411–4428, 2021. doi: 10.3934/mbe.2021223. [Google Scholar] [PubMed] [CrossRef]
26. Y. Tian, G. Pan, and M. S. Alouini, “Applying deep-learning-based computer vision to wireless communications: Methodologies, opportunities, and challenges,” IEEE Open J. Commun. Soc., vol. 2, pp. 132–143, 2021. doi: 10.1109/OJCOMS.2020.3042630. [Google Scholar] [CrossRef]
27. Y. Tian, G. -H. Lee, H. He, C. -Y. Hsu, and D. Katabi, “RF-based fall monitoring using convolutional neural networks,” Proc. ACM Interact., Mobile, Wearable Ubiquit. Technol., vol. 2, no. 3, pp. 1–24, 2018. doi: 10.1145/3264947. [Google Scholar] [CrossRef]
28. M. S. Uddin, M. N. Aktarand, and Y. M. Jang, “LED-ID system: Coverage and fast link recovery technique,” Int. J. Comput. Sci. Eng. Surv., vol. 3, no. 5, pp. 1–13, 2012. doi: 10.5121/ijcses.2012.3501. [Google Scholar] [CrossRef]
29. C. A. Harlow, “Automated visual inspection: A survey,” IEEE Trans. Pattern Anal. Mach. Intell., vol. 4, no. 6, pp. 557–573, 1982. doi: 10.1109/TPAMI.1982.4767309. [Google Scholar] [PubMed] [CrossRef]
30. M. T. Chowdhury and J. Cleland-huang, “Engineering challenges for AI-supported computer vision in small uncrewed aerial systems,” in 2023 IEEE/ACM 2nd Int. Conf. AI Eng.—Softw. Eng. AI (CAIN), Melbourne, Australia, May 2023. doi: 10.1109/CAIN58948.2023.00033. [Google Scholar] [CrossRef]
31. M. Kociołek, M. Strzelecki, and R. Obuchowicz, “Does image normalization and intensity resolution impact texture classification?” Comput. Med. Imaging Graph, vol. 81, pp. 101716, 2020. doi: 10.1016/j.compmedimag.2020.101716. [Google Scholar] [PubMed] [CrossRef]
32. R. M. Q. R. Jaapar and M. A. Mansor, “Convolutional neural network model in machine learning methods and computer vision for image recognition: A review,” J. Appl. Sci. Res., vol. 14, no. 6, pp. 23–27, 2018. doi: 10.22587/jasr.2018.14.6.5. [Google Scholar] [CrossRef]
33. S. Luo, A. Peng, H. Zeng, X. Kang, and L. Liu, “Deep residual learning using data augmentation for median filtering forensics of digital images,” IEEE Access, vol. 7, pp. 80614–80621, 2019. doi: 10.1109/ACCESS.2019.2923000. [Google Scholar] [CrossRef]
34. Q. Al-Jubouri, W. Al-Nuaimy, M. A. Al-Taee, and I. Young, “Recognition of individual zebrafish using speed-up robust feature matching,” in 2017 10th Int. Conf. Dev. eSystems Eng. (DeSE), 2017, vol. 8, pp. 26–30. doi: 10.1109/DeSE.2017.30. [Google Scholar] [CrossRef]
35. S. Linz, “Impairment analysis and their calibration techniques for six-port based displacement sensors analyse von Fehlerquellen und deren Kalibrierverfahren für sechstorbasierte Abstandssensoren Sarah Linz aus Erlangen,” Ph.D. dissertation, Friedrich-Alexander-Universität Erlangen-Nürnberg, Germany, 2019. [Google Scholar]
36. D. Muramatsu and K. Sasaki, “Input impedance analysis of wearable antenna and experimental study with real human subjects: Differences between individual users,” Electronics, vol. 10, no. 10, pp. 1152, 2021. doi: 10.3390/electronics10101152. [Google Scholar] [CrossRef]
37. B. Wang, S. Wang, D. Zeng, and M. Wang, “Convolutional neural network-based radar antenna scanning period recognition,” Electronics, vol. 11, no. 9, pp. 1383, 2022. doi: 10.3390/electronics11091383. [Google Scholar] [CrossRef]
38. M. U. A. Siddiqui, F. Qamar, S. H. A. Kazmi, R. Hassan, A. Arfeen and Q. N. Nguyen, “A study on multi-antenna and pertinent technologies with AI/ML approaches for B5G/6G networks,” Electronics, vol. 12, no. 1, pp. 1–28, 2023. doi: 10.3390/electronics12010189. [Google Scholar] [CrossRef]
39. C. Pan et al., “Validation and comparison,” Electronics, vol. 12, no. 3, pp. 489, 1–15, 2023. [Google Scholar]
40. Y. Han et al., “Low-illumination road image enhancement by fusing retinex theory and histogram equalization,” Electronics, vol. 12, no. 4, pp. 990, 2023. doi: 10.3390/electronics12040990. [Google Scholar] [CrossRef]
41. H. Lin, W. Y. Shin, and J. Joung, “Support vector machine-based transmit antenna allocation for multiuser communication systems,” Entropy, vol. 21, no. 5, pp. 1–17, 2019. doi: 10.3390/e21050471. [Google Scholar] [PubMed] [CrossRef]
42. R. Nithya, B. Santhi, R. Manikandan, M. Rahimi, and A. H. Gandomi, “Computer vision system for mango fruit defect detection using deep convolutional neural network,” Foods, vol. 11, no. 21, pp. 3483, 2022. doi: 10.3390/foods11213483. [Google Scholar] [PubMed] [CrossRef]
43. J. M. Basheer and V. Murugesh, “FPGA implementation of a novel Gaussian filter using power optimized approximate adders,” Indones. J. Electr. Eng. Comput. Sci., vol. 11, no. 3, pp. 1048–1059, 2018. doi: 10.11591/ijeecs.v11.i3.pp1048-1059. [Google Scholar] [CrossRef]
44. Y. Zhou, Y. Li, Z. Guo, B. Wu, and D. Zhang, “Multiplicative noise removal and contrast enhancement for SAR images based on a total fractional-order variation model,” Fractal Fract., vol. 7, no. 4, pp. 1–28, 2023. doi: 10.3390/fractalfract7040329. [Google Scholar] [CrossRef]
45. J. Rosenlind, “The impulse-radiating antenna,” Sep. 15, 2009. Accessed: Nov. 01, 2023. [Online]. Available: https://www.diva-portal.org/smash/record.jsf?pid=diva2%3A228585&dswid=-5950 [Google Scholar]
46. R. Personne and V. Matinlassi, “Part assurance in a mixed-model assembly line: A case study at scania engine assembly in Södertälje,” M.S. thesis, Sch. Ind. Eng. Manag., KTH Roy. Inst. Technol., Sweden, 2014. [Google Scholar]
47. G. Alfian et al., “Utilizing random forest with iforest-based outlier detection and SMOTE to detect movement and direction of RFID tags,” Futur. Internet, vol. 15, no. 3, pp. 103, 2023. doi: 10.3390/fi15030103. [Google Scholar] [CrossRef]
48. P. A. Torrione, K. D. Morton, R. Sakaguchi, and L. M. Collins, “Histograms of oriented gradients for landmine detection in ground-penetrating radar data,” IEEE Trans. Geosci. Remote Sens., vol. 52, no. 3, pp. 1539–1550, 2014. doi: 10.1109/TGRS.2013.2252016. [Google Scholar] [CrossRef]
49. W. Saadat, “Human identification through wearable antenna characteristics,” Ph.D. dissertation, Queen’s Univ., Canada, 2020. [Google Scholar]
50. P. S. H. Leather and D. Parsons, “Equalization for antenna-pattern measurements: Established technique-new application,” IEEE Antennas Propag. Mag., vol. 45, no. 2, pp. 154–161, 2003. doi: 10.1109/MAP.2003.1203134. [Google Scholar] [CrossRef]
51. M. Ghassemi, M. Bakr, and N. Sangary, “Antenna design exploiting adjoint sensitivity-based geometry evolution,” IET Microwaves, Antennas Propag., vol. 7, no. 4, pp. 268–276, 2013. doi: 10.1049/iet-map.2012.0374. [Google Scholar] [CrossRef]
52. S. A. Naghdehforushha and G. Moradi, “Design of plasmonic rectangular ribbon antenna based on graphene for terahertz band communication,” IET Microwaves, Antennas Propag., vol. 12, no. 5, pp. 804–807, 2018. doi: 10.1049/iet-map.2017.0678. [Google Scholar] [CrossRef]
53. S. Chintagunta and P. Ponnusamy, “Integrated polarisation and diversity smoothing algorithm for DOD and DOA estimation of coherent targets,” IET Signal Process, vol. 12, no. 4, pp. 447–453, 2018. doi: 10.1049/iet-spr.2017.0276. [Google Scholar] [CrossRef]
54. T. Pattnayak and G. Thanikachalam, “Antenna design and RF layout guidelines,” in Cypress Semiconductor AN91445. San Jose, CA, USA: Cypress Semiconductor, 2015. Accessed: Aug. 30, 2017. [Online]. Available: https://www.cypress.com/ [Google Scholar]
55. T. Benbarrad, S. B. Kenitar, and M. Arioua, “Intelligent machine vision model for defective product inspection based on machine learning,” in 2020 Int. Symp. Adv. Electr. Commun. Technol. ISAECT 2020, Marrakech, Morocco, 2020, pp. 1–18. doi: 10.1109/ISAECT50560.2020.9523643. [Google Scholar] [CrossRef]
56. M. Karimi, “Generative adversarial networks applied to uncooperative microwave imaging system calibration” 2022. Accessed: Nov. 01, 2023. [Online]. Available: https://hdl.handle.net/1993/36178 [Google Scholar]
57. J. Joung, “Machine learning-based antenna selection in wireless communications,” IEEE Commun. Lett., vol. 20, no. 11, pp. 2241–2244, 2016. doi: 10.1109/LCOMM.2016.2594776. [Google Scholar] [CrossRef]
58. C. Shan, X. Chen, H. Yin, W. Wang, G. Wei and Y. Zhang, “Diagnosis of calibration state for massive antenna array via deep learning,” IEEE Wirel. Commun. Lett., vol. 8, no. 5, pp. 1431–1434, 2019. doi: 10.1109/LWC.2019.2920818. [Google Scholar] [CrossRef]
59. X. Yang et al., “Defect detection of composite material terahertz image based on faster region-convolutional neural networks,” Materials, vol. 16, no. 1, pp. 317, 2023. doi: 10.3390/ma16010317. [Google Scholar] [PubMed] [CrossRef]
60. B. Chen and Y. Liu, “Antenna alignment by using computer vision technology,” Microw. Opt. Technol. Lett., vol. 62, no. 3, pp. 1267–1269, 2020. doi: 10.1002/mop.32126. [Google Scholar] [CrossRef]
61. H. Zhou, Y. Yuan, and C. Shi, “Object tracking using SIFT features and mean shift,” Comput. Vis. Image Underst., vol. 113, no. 3, pp. 345–352, 2009. doi: 10.1016/j.cviu.2008.08.006. [Google Scholar] [CrossRef]
62. K. M. Oumar and L. N. Shyan, “A compact reconfigurable slotted microstrip patch antenna using pin diode for wireless applications,” J. Phys. Conf. Ser., vol. 1228, no. 1, pp. 012074, 2019. doi: 10.1088/1742-6596/1228/1/012074. [Google Scholar] [CrossRef]
63. P. Ranjan, S. Yadav, H. Gupta, and A. Bage, “Design and development of machine learning assisted cylindrical dielectric resonator antenna,” Evergreen, vol. 10, no. 1, pp. 308–316, 2023. doi: 10.5109/6781085. [Google Scholar] [CrossRef]
64. A. Shakibabarough, A. Bagchi, and M. Valinejadshoubi, “Investigating different image processing techniques for better interpretation of GPR images,” in CSCE Gen. Conf. 2018, 2018, pp. 371–378. [Google Scholar]
65. F. Wang, S. Zhou, S. Panev, J. Han, and D. Huang, “Person-in-WiFi: Fine-grained person perception using WiFi,” in Proc. IEEE Int. Conf. Comput. Vis., Seoul, Republic of Korea, 2019, pp. 5451–5460, doi: 10.1109/ICCV.2019.00555. [Google Scholar] [CrossRef]
66. M. M. Khan, S. Hossain, P. Mozumdar, S. Akter, and R. H. Ashique, “A review on machine learning and deep learning for various antenna design applications,” Heliyon, vol. 8, no. 4, pp. e09317, 2022. doi: 10.1016/j.heliyon.2022.e09317. [Google Scholar] [PubMed] [CrossRef]
67. J. E. Yoder, P. A. Iannucci, L. Narula, and T. E. Humphreys, “Multi-antenna vision-and-inertial-aided CDGNSS for micro aerial vehicle pose estimation,” in Proc. 33rd Int. Tech. Meet. Satell. Div. Inst. Navig. (ION GNSS+2020), 2020, vol. 1, pp. 2281–2298. doi: 10.33012/2020.17588. [Google Scholar] [CrossRef]
68. A. A. Sima and S. J. Buckley, “Optimizing SIFT for matching of short wave infrared and visible wavelength images,” Remote Sens., vol. 5, no. 5, pp. 2037–2056. 2013. doi: 10.3390/rs5052037. [Google Scholar] [CrossRef]
69. Q. Zhou and C. Yu, “Point RCNN: An angle-free framework for rotated object detection,” Remote Sens., vol. 14, no. 11, pp. 1–23, 2022. doi: 10.3390/rs14112605. [Google Scholar] [CrossRef]
70. Y. Luo, L. Chi, A. Qi, J. Ma, and Y. Qi, “Requirement analysis and teardrop-based design of high antenna isolation for FMCW radar,” Electronics, vol. 11, no. 11, pp. 1687, 2022. doi: 10.3390/electronics11111687. [Google Scholar] [CrossRef]
71. Y. Li, H. Huang, Q. Chen, Q. Fan, and H. Quan, “Research on a product quality monitoring method based on multi scale PP-YOLO,” IEEE Access, vol. 9, pp. 80373–80387, 2021. doi: 10.1109/ACCESS.2021.3085338. [Google Scholar] [CrossRef]
72. R. R. Hussein, Y. I. Hamodi, and R. A. Sabri, “Retinex theory for color image enhancement: A systematic review,” Int. J. Electr. Comput. Eng., vol. 9, no. 6, pp. 5560–5569, 2019. doi: 10.11591/ijece.v9i6.pp5560-5569. [Google Scholar] [CrossRef]
73. J. A. Rohwer and C. T. Abdallah, “Support vector machines for direction of arrival estimation,” in Rfierro.Ecen.Ceat.Okstate.Edu, 2017, pp. 1–21. [Google Scholar]
74. B. Ghaddar and J. Naoum-Sawaya, “High dimensional data classification and feature selection using support vector machines,” Eur. J. Oper. Res., vol. 265, no. 3, pp. 993–1004, 2018. doi: 10.1016/j.ejor.2017.08.040. [Google Scholar] [CrossRef]
75. O. P. Kumar, T. Ali, and P. Kumar, “A novel corner etched rectangular shaped ultrawideband antenna loaded with truncated ground plane for microwave imaging,” Wirel. Pers. Commun., vol. 130, no. 3, pp. 2241–2259, 2023. doi: 10.1007/s11277-023-10381-9. [Google Scholar] [CrossRef]
76. S. Imtiaz, G. P. Koudouridis, H. Ghauch, and J. Gross, “Random forests for resource allocation in 5G cloud radio access networks based on position information,” Eurasip J. Wirel. Commun. Netw., vol. 2018, no. 1, p. 1065, 2018. doi: 10.1186/s13638-018-1149-7. [Google Scholar] [CrossRef]
77. W. Li et al., “Intelligent metasurface system for automatic tracking of moving targets and wireless communications based on computer vision,” Nat. Commun., vol. 14, no. 1, pp. 1–10, 2023. doi: 10.1038/s41467-023-36645-3. [Google Scholar] [PubMed] [CrossRef]
78. A. E. Ilesanmi and T. O. Ilesanmi, “Methods for image denoising using convolutional neural network: A review,” Complex Intell. Syst., vol. 7, no. 5, pp. 2179–2198, 2021. doi: 10.1007/s40747-021-00428-4. [Google Scholar] [CrossRef]
79. J. Jeong, K. Park, and C. Lee, “Design of cavity-backed bow-tie antenna with matching layer for human body application,” Sensors, vol. 19, no. 18, pp. 4015, 2019. doi: 10.3390/s19184015. [Google Scholar] [PubMed] [CrossRef]
80. X. Fang, Q. Luo, B. Zhou, C. Li, and L. Tian, “Research progress of automated visual surface defect detection for industrial metal planar materials,” Sensors, vol. 20, no. 18, pp. 1–35, 2020. doi: 10.3390/s20185136. [Google Scholar] [PubMed] [CrossRef]
81. S. Zhong et al., “Deep learning based antenna selection for mimo SDR system,” Sensors, vol. 20, no. 23, pp. 1–14, 2020. doi: 10.3390/s20236987. [Google Scholar] [PubMed] [CrossRef]
82. A. H. Kelechi et al., “The recent advancement in unmanned aerial vehicle tracking antenna: A review,” Sensors, vol. 21, no. 16, p. 5662, 2021. doi: 10.3390/s21165662. [Google Scholar] [PubMed] [CrossRef]
83. N. Li, T. Liu, and H. Li, “An improved adaptive median filtering algorithm for radar image co-channel interference suppression,” Sensors, vol. 22, no. 19, pp. 7573, 2022. doi: 10.3390/s22197573. [Google Scholar] [PubMed] [CrossRef]
84. T. Zhu, Y. Su, J. He, and P. Zhang, “3D pose registration of antenna board based on genetic algorithm for AR application,” J. Phys. Conf. Ser., vol. 1631, no. 1, pp. 012009, 2020. doi: 10.1088/1742-6596/1631/1/012009. [Google Scholar] [CrossRef]
85. F. Tsai, Y. S. Chiou, and H. Chang, “A positioning scheme combining location tracking with vision assisting for wireless sensor networks,” J. Appl. Res. Technol., vol. 11, no. 2, pp. 292–300, 2013. doi: 10.1016/S1665-6423(13)71539-6. [Google Scholar] [CrossRef]
86. B. Zhang, X. Luo, Y. Lyu, X. Wu, and W. Wen, “A defect detection method for topological phononic materials based on few-shot learning,” New J. Phys., vol. 24, no. 8, pp. 083012, 2022. doi: 10.1088/1367-2630/ac8307. [Google Scholar] [CrossRef]
87. C. G. Christodoulou, J. A. Rohwer, and C. T. Abdallah, “The use of machine learning in smart antennas,” in IEEE Antennas Propag. Society Symp., 2004, vol. 1, pp. 321–324, doi: 10.1109/APS.2004.1329637. [Google Scholar] [CrossRef]
88. S. Anjum, S. Jayaram, A. El-Hag, and A. N. Jahromi, “Detection and classification of defects in ceramic insulators using RF antenna,” IEEE Trans. Dielectr. Electr. Insul., vol. 24, no. 1, pp. 183–190, 2017. doi: 10.1109/TDEI.2016.005867. [Google Scholar] [CrossRef]
89. A. Taniguchi, Y. Tamura, S. Ikeda, T. Takekoshi, and R. Kawabe, “A data-scientific noise-removal method for efficient submillimeter spectroscopy with single-dish telescopes,” Astron. J., vol. 162, no. 3, pp. 111, 2021. doi: 10.3847/1538-3881/ac11f7. [Google Scholar] [CrossRef]
90. J. Rasheed, “Analyzing the effect of filtering and feature-extraction techniques in a machine learning model for identification of infectious disease using radiography imaging,” Symmetry, vol. 14, no. 7, pp. 1398, 2022. doi: 10.3390/sym14071398. [Google Scholar] [CrossRef]
91. M. Gupta, M. Kalra, and G. Priya, “Smart walking stick for the visually impaired using image recognition with scale-invariant feature transform (SIFT) algorithm,” Int. J. Sci. Technol. Res., vol. 9, no. 6, pp. 922–926, 2020. [Google Scholar]
92. L. Qi, D. Binu, B. R. Rajakumar, and B. Mohammed Ismail, “2-D canonical correlation analysis based image super-resolution scheme for facial emotion recognition,” Multimed. Tools Appl., vol. 81, no. 10, pp. 13911–13934, 2022. [Google Scholar]
93. Z. Ullah, L. Qi, A. Hasan, and M. Asim, “Improved deep CNN-based two stream super resolution and hybrid deep model-based facial emotion recognition,” Eng. Appl. Artif. Intell., vol. 116, no. 9, pp. 105486, 2022. doi: 10.1016/j.engappai.2022.105486. [Google Scholar] [CrossRef]
Cite This Article
 Copyright © 2024 The Author(s). Published by Tech Science Press.
This work is licensed under a Creative Commons Attribution 4.0 International License , which permits unrestricted use, distribution, and reproduction in any medium, provided the original work is properly cited.
 Downloads
 Citation Tools