
 Submit a Paper
 Propose a Special lssue
 Open Access
ARTICLE

Enhancing Network Design through Statistical Evaluation of MANET Routing Protocols
1 Faculty of Medical Sciences, Jabir ibn Hayyan Medical University, Alkufa Qu, Najaf, 54001, Iraq
2 Computer Science Department, School of Science and Technology, Nottingham Trent University, Nottingham, NG11 8NS, UK
3 Department of Computing, Faculty of Engineering Sciences & Technology (FEST) Hamdard University, Karachi, 74600, Pakistan
4 Department of Information Technology, College of Computing and Information Technology, Northern Border University, Arar, 91431, Saudi Arabia
5 Department of Information System, College of Computing and Information Technology, Northern Border University, Arar, 91431, Saudi Arabia
* Corresponding Author: Ibrahim Alameri. Email:
Computers, Materials & Continua 2024, 80(1), 319-339. https://doi.org/10.32604/cmc.2024.052999
Received 22 April 2024; Accepted 27 May 2024; Issue published 18 July 2024
 View Full Text
 Download PDF
Abstract
This paper contributes a sophisticated statistical method for the assessment of performance in routing protocols salient Mobile Ad Hoc Network (MANET) routing protocols: Destination Sequenced Distance Vector (DSDV), Ad hoc On-Demand Distance Vector (AODV), Dynamic Source Routing (DSR), and Zone Routing Protocol (ZRP). In this paper, the evaluation will be carried out using complete sets of statistical tests such as Kruskal-Wallis, Mann-Whitney, and Friedman. It articulates a systematic evaluation of how the performance of the previous protocols varies with the number of nodes and the mobility patterns. The study is premised upon the Quality of Service (QoS) metrics of throughput, packet delivery ratio, and end-to-end delay to gain an adequate understanding of the operational efficiency of each protocol under different network scenarios. The findings explained significant differences in the performance of different routing protocols; as a result, decisions for the selection and optimization of routing protocols can be taken effectively according to different network requirements. This paper is a step forward in the general understanding of the routing dynamics of MANETs and contributes significantly to the strategic deployment of robust and efficient network infrastructures.Keywords
The utilization of wireless connectivity in the exchange of equipment information has revolutionized communication by eliminating the need for costly cable installations. Wireless networks, which can be categorized into infrastructure-based or infrastructure-less networks, offer distinct benefits but also present challenges. Infrastructure networks, encompassing cellular networks and Wi-Fi Internet, rely on interconnected base stations or require internet access points. Conversely, infrastructure-less networks, such as MANET networks, provide versatile solutions for transient communication in various scenarios, including emergency response and military operations [1].
Despite their inherent advantages, both network categories confront distinct challenges. Infrastructure-based networks grapple with cost, scalability, privacy, and reliability issues, whereas infrastructure-less networks, such as MANET, navigate the complexities of security, network stability, and performance consistency.
The present situation highlights the requirements and limits of both network types. Based on the requirements, it will be capable of focusing on promoting the effectiveness and efficiency of wireless communication based on the discussion of the MANET networks, which have the capability of hopping communication. Henceforth, both networks are non-structured and would be designed to support a peer-to-peer distribution of computational resources. However, node mobility at MANET can bring up some network connectivity and stability issues, for which routing protocols have to navigate through the network topology [2,3].
Work in [4] by Aakanksha Devrari et al. tackles the near-far effects problem in MANETs using Direct Sequence Spread Spectrum-Code Division Multiple Access (DSSS-CDMA) based systems implemented on Field-Programmable Gate Arrays (FPGAs). The DSSS-CDMA based model helps combat other related issues and improves even more consistency in the signal, which betters the network throughput. This paper demonstrates that aided with market tools such as Model Sim and Xilinx for simulation and synthesis operations, the system can handle simultaneous signals far more efficiently across the network. This technical solution will improve the reliability of the communication network in MANETs, and network scalability and efficiency could be interesting future research areas.
Bhupesh [5] performs a statistical evaluation of power-aware routing protocols for wireless networks, comparing their performance to aid researchers in choosing context-specific routing models. This empirical study focuses on enhancing network efficiency based on power consumption metrics.
The present study has stronger statistical analyses because of the use of tests such as Kruskal-Wallis, Mann-Whitney, and Friedman, among others. Such tests provide a robust measure for the protocols under various conditions, making the results more reliable, handling data variability, and increasing the practical significance of our results. Furthermore, our research places importance on Quality of Service (QoS), which is essential for dynamic network scenarios, such as disaster recovery or military operations. That aspect raises the practical network design enormously. The study by Singh [6] is more informational and, further, does not look into the QoS, which makes it of little use to scenarios where the quality of service is essential. The proposed paper, with its methodological density and emphasis on QoS, delivers a difference in performance, which is validated, and practical recommendations for network design, to ensure better service delivery in complex MANET environments.
In the work of [7], performance analysis of routing protocols in MANET, and performance comparison of different MANET routing protocols—DSDV, OLSR, AODV, AOMDV, and DSR—has been put forth by the simulations employing NS-2. The focus is on assessing protocols across the metrics such as packet delivery ratio, delay, throughput, control overhead, and energy consumption. The study shows that reactive protocols, for example, AODV and DSR, behave better in high mobility; in other words, they will have lower control overhead and higher throughput, while proactive protocols like DSDV behave better at low mobility and traffic scenarios but with high energy and overhead costs.
While reference [7] makes a straightforward comparative analysis based on results derived from simulation, the proposed work is more valuable by having a statistical frame applied to confirm the reliability of the results and the significance of performance differences among the protocols. It may be a potential gap in the prior research itself, use of thoroughness fails to use advanced statistical techniques in validating its findings. The presented paper thus reaffirms or contradicts previous conclusions under different scenarios but strengthens the conclusion through statistically significant evidence in favor of network design and protocol selection based on network scenarios and requirements.
The need to address significant variances in the performance of routing protocols within MANETs under varying network conditions is the key point captured by the problem statement in the proposed work. Because the study is motivated by the challenges posed by node density and mobility, this has a significant impact on the effectiveness of routing protocols like DSDV, AODV, DSR, and ZRP. Consequently, this paper aims to develop a systematic, data-driven means of assessing these protocols to enhance network design and deployment strategies. This will be achieved by using advanced statistical tests, including Kruskal-Wallis, Mann-Whitney, and Friedman, to assess and compare the performance of the aforementioned protocols with respect to throughput, packet delivery ratio, and end-to-end delay as Quality of Service (QoS) metrics.
This study uses analysis to assess the performance of routing protocols in MANET networks and evaluates protocol performance supported by a comprehensive statistical framework using Network Simulator version 2 (NS-2) across node densities and routing protocols. Diving into the world of MANET routing protocols, this analysis pulls out all the stops with some slick ANOVA techniques, including the Kruskal Wallis and Mann-Whitney tests. Researching network protocols is a major challenge due to their mobility nature.
This paper evaluates several routing protocols on a rigorous basis of performance in a variety of network conditions, focusing on QoS metrics such as speed, reliability, and efficiency. It will explore how protocol effectiveness is affected by node density and mobility through the use of statistic analysis and programming as a means of identifying optimal strategies to enhance network performance in the context of mobile ad hoc networks. This thorough assessment aims to scrutinize routing protocols by analyzing their performance metrics within the non-parametric ANOVA framework. Using the Kruskal-Wallis, Mann-Whitney, and Friedman tests, this study aims to identify the routing protocol through analysis, adding valuable insights to the field of wireless communication research.
The rest of the paper’s content is organized into five sections. Section 2 gives information on the conceptual overview of the routing protocols. Section 3 briefly discusses the materials and methods of this study. Section 4 describes the data collection methods of this paper. The statistical methodology approach is described in Section 5. The conclusion of this paper is presented in Section 6.
MANETs are considered highly significant for creating modern network architectures due to their adaptability and flexibility [8]. This paper analyzes the effectiveness and dependability of four existing MANET routing protocols: Ad-hoc On-Demand Distance Vector (AODV), Dynamic Source Routing (DSR), Destination-Sequenced Distance Vector (DSDV), and Zone Routing Protocol (ZRP) [9]. Each protocol has specific benefits and challenges when used for dynamic and complex network topologies in order to provide data transmission and dependable connectivity [10,11].
AODV (Ad-hoc On-demand Distance Vector) is also an on-demand routing protocol, meaning that it establishes a route only when needed [12]. This minimizes the routing overhead, hence AODV is suitable for use by networks in which the topology changes very frequently. The protocol builds up communication routes on the fly. This provides for effective data delivery, where a system of route requests and route maintenance conserves network resources and quickly reacts to changes in the network [13,14].
Dynamic Source Routing (DSR) source routing basically means that the data packets in this approach bear the whole routing information by themselves [15]. This protocol is very adaptive to network changes and enjoys a caching mechanism that allows multiple routes to be stored within the intermediate nodes. The increase in the size of headers, though, with route information may affect the performance of the protocol adversely in low-bandwidth environments.
DSDV (Destination-Sequenced Distance Vector) is a proactive routing protocol in which every node maintains full routing tables and updates them periodically. DSDV uses sequence numbers in such a way that routing information is always fresh, and there are no routing loops. It always provides immediate route availability. However, this type of routing protocol may generate significant overhead when the network is very dynamic [16,17]. Zone Routing Protocol (ZRP) combines the best features of proactive intra-zone routing maintenance and reactive inter-zone routing [18,19]. This hybrid approach results in a reduction of the overhead and time required for route discovery, making ZRP adaptive for a wide range of network conditions, and particularly effective in networks broken down into zones [20].
This paper introduces a novel way of carrying out statistical analysis on these protocols under a variety of network conditions using combined Kruskal-Wallis, Mann-Whitney, and Friedman tests for performance evaluation based on QoS metrics (throughput, packet delivery ratio, and end-to-end delay). The results of this test give a proper understanding of each operational strength and limitation of the protocols and an insight into the suitability of the protocols under various network scenarios.
The present paper, with enough comparative analysis at the theoretical level, supports the individual abilities of protocols and also aids in the conceptual understanding of their operational mechanisms within MANETs. The results are targeted to assist in the design and selection of an appropriate routing protocol tailor-made to the specific network requirements in light of the fact that adaptability and efficiency are most needed within the changing landscape of network technologies.
This section explores the simulation configuration, data collection, and data analysis for MANET protocols in NS-2. NS-2 has been selected due to its being widely available open-source software. Similarly, NS-2 has also adopted several MANET protocols, such as AODV, DSR, DSDV, and ZRP. However, the authors have implemented and configured the ZRP in NS2 because it is not installed by default. The most significant part of the simulator is written in the Object Tool Command Language (OTCL). OTCL is used to simulate a wireless network, so the MANET scenario includes routing protocol, traffic details, details of mobile nodes, output files represented in the network animator (NAM) and trace files, and topology layout made within OTCL. In the figure below, a network simulation is carried out according to NS-2. The Perl scripts are used to extract information from the trace files.
MATLAB is used to plot graphs. The result of the simulation process is conducted and analyzed within SPSS as it is a valuable statistical and powerful software application. The result of the simulation is conducted and analyzed. A trace file was created, which was used to evaluate the values of throughput, packet delivery ratio (PDR), normalized routing overhead (NRL), and end-to-end delay (E-2-E delay).
3.1 Simulation Implementation & Network Assumption
The simulation process was critical in this study because it influenced the result of the experimental tests. To achieve this simulation, the current paper used 800 m × 800 m as a coverage area; the Transportation protocol was (UDP). The packet size was 512 bytes, and the number of iterations for a parameter was 40 for every number of nodes. For each simulation scenario, 40 simulation iterations were performed. This repetitive exercise aims to reduce the statistical anomalies/discrepancies in the result. Therefore, 160 total rounds/iterations of the simulation are carried out during this investigation. The mobility of nodes affects the performance of a network drastically. The presented study used the Random Way Point (RWP) mobility model in this study. RWP is the most used movement pattern. The velocity (speed) of nodes also plays a crucial role. In this topology, all nodes can move up to (20 m/s) velocities. The network topology of the MANET, obtained from the NS-2 NAM, is shown in Fig. 1. The number of nodes was various: 40, 60, 80, and 100 nodes.

Figure 1: Network topology of 40 nodes (top) and network topology of 100 nodes (bottom)
Fig. 1 presents the network topology of the Network Animator (NAM) tool. This figure tableau brings to nodes densities and the ballet of mobility, underscoring their significant impact on network efficiency. Through detailed simulation and visual storytelling, this study aims to examine the protocols of MANET network behavior, shedding light on their adaptability and resilience in the face of change and their operation.
Fig. 1 (top) 40 node instance topologies in environments with limited node densities show exactly how the routing protocols performed. When the distance between nodes increases, the effects of node mobility become more evident.
Fig. 1 (bottom) is with a denser topology, having 100 nodes, to compare the scalability and efficiency of the protocols under more challenging and realistic conditions.
Both visualizations in Fig. 1 show the routing protocol performance under dynamic scenarios, thus demonstrating that dynamism in MANETs requires adaptability and efficiency. Simulating network mobility through the Random Waypoint model with node speeds up to 20 m/s shows the performance drop that node mobility induces. This set of visual and numeric data gives the reader a good insight into protocol capabilities and limitations, contributing to the network design field.
3.2 Evaluating the Efficacy of Routing Protocols
Several software approaches, such as Perl language, were used in the data analysis to extract information from the trace file. Also, mathematical equations have been employed to calculate the metric performance. The paper evaluated and analyzed the output of AODV, DSR, DSDV, and ZRP with a variety number of nodes. The variety of node numbers in the MANET network affects the overall parameters and efficiency of a network.
Furthermore, as previously mentioned, the simulation was run 160 times with the number of nodes in each iteration changing. The simulation setup uses NS-2.35 and programming languages MATLAB, Perl, and OTCL. It runs 180 s in a 1000 m² area, utilizing UDP for transport, CBR packets of 512 bytes, and routing protocols AODV, DSR, DSDV, and ZRP. Node configurations include 40, 60, 80, and 100 nodes with a Random Waypoint mobility model, omni-directional antennas, and a mobility speed of 20 m/s.
The study is based on two experimental environments which are conducted carefully in order to add informative insights to the current study. The two experiments shed light on Quality of Service (QoS) metrics. The purpose of conducting such experiments is to test various routing protocols handle efficiency and scalability, especially when there are changes in node densities.
The study concerns the set of factors that determine the performance of the network: from end-to-end delay to vital metrics in throughput—the rate at which data is transmitted and the packet delivery ratio (PDR) that can track the successful arrival of data packets.
This developed new approach aims to find the nuances of network performance and capabilities, which is a panoramic view of how networks can adapt themselves to increasing complexity and a higher density of nodes. This work integrates Quality of Service (QoS) metrics along with some statistical methods to prove the relationship of node density with network performance and how such elements work for the efficiency of the network.
Data for this study was collected from Network Simulator version 2 (NS-2) and the MANET network routing protocols. The routing protocols used in this study are AODV, DSR, DSDV, and ZRP, as previously stipulated. The data of such an investigation have been gathered following several network metrics, such as network throughput, normalized routing load (NRL), end-to-end delay (E-2-E delay), and packet delivery ratio.
Network Throughput: As far as Network Throughput is concerned, every node throughput is traditionally defined as the time-averaged quantity of bits each node can transmit to its intended destination. The piling up of each node throughput throughout all nodes within a network forms the network’s overall throughput in Eq. (1), which is used for this purpose and is shown below:
Packet Delivery Ratio (PDR): Comparing the total number of packets that the destination node has to the total amount of packets that the source node has sent, it is found that PDR is used to determine the transmission ratio’s success and it is one of the quality of service (QoS) arguments. Here, PDR is utilized to calculate the results by Eq. (2).
End-to-End Delay (E-2-E Delay): End-to-end delay (E-2-E delay) refers to the time required to transmit packets from the source to their destination through a series of nodes. Many elements could affect this delay such as congestion, overloaded networks, and the duration between network access points. E-2-E delay is viewed as a significant parameter for evaluating QoS. Eq. (3), below, calculates it.
5 Statistical Analysis and Comparative Discussion
This section is pivotal and gives a comprehensive statistical analysis and comparatives in the discussion based on accuracy and an in-depth understanding of the performance of various routing protocols. Using advanced testing tools namely ANOVA, Kruskal-Wallis, and Friedman, this paper looks at how these protocols interact under a variety of conditions, therefore allowing the revelation of subtler details that might elude superficial analyses.
It goes with every measurement and analysis and heads for a better and more profound understanding of how this node density and dynamic changes in the network improve the quality and performance parameters. This section is more than a mere presentation of data. This section constitutes an exploratory journey into the world of networks, where we harmonize scientific rigor with in-depth analysis to provide insight that will contribute to and assist in shaping the future of the technology around networks.
5.1 Analysis of Variance ANOVA (Kruskal-Wallis Test)
Robust statistical analysis was performed so that our findings are pertinent, and the results have significance from a statistical point of view. We used the one-way Analysis of Variance (ANOVA) test to assess the significant difference in performance of all investigated protocols.
The study was subjected to statistical investigation in order to acquire sound results that are of statistical significance. Therefore, a one-way ANOVA test was carried out to test whether the differences in the performance of the protocols were significant. There are many methods to carry out statistical tests to analyze variance. However, The Kruskal-Wallis test of the one-way ANOVA is the best method to analyze data obtained from the experimental works, and the data distribution is unknown. Regarding analyzing and understanding findings from multiple data groups, the non-parametric ANOVA test provides a powerful statistical decision. It breaks down the observations into various components and determines whether the results are substantial. In other words, it analyses the observations into multiple sources of heterogeneity and then computes a dispersion coefficient, revealing whether there are significant variations among the contributions.
In the same context, the Kruskal-Wallis test is efficient as it involves additional information other than the mediator. When there are two samples, the Kruskal-Wallis test is equivalent to the Mann-Whitney test.
To achieve accurate outcomes, the Kruskal-Wallis test must be applied to all conditions and valid. The conditions must be satisfied regarding measurements being independent and homoscedastic, and the data does not need to be generally distributed as mentioned in this test’s assumptions [21,22].
Testing statistical hypotheses can be applied in various aspects of science, including economics, architecture, medical technology, chemistry, biology, and computer science, (for example MANET networks), to help prove a theory. For further investigation to ensure the results are robust, additional investigation has been conducted using the statistical hypothesis. The current project tries to address the question of whether the null hypothesis H0 is correct from a statistical point of view. It is rarely appropriate to contend that there is no alternative to the status quo unless a compelling counterexample is given. When the argument is accepted, the assertion is referred to as an alternative hypothesis and referred to as H1.
When performing a statistical evaluation of a hypothesis, it is helpful first to accept or deny H0 regarding the significant probability of the result. The standard distribution (Z) is carried out to test the proposed hypothesis and population distribution. The standard distribution (Z) has a known distribution, which is used to compare with the obtained results to make the correct statistical decision where, if the null hypothesis is true, the critical region (CR) is a subset of a set of values of test statistics whose probability is under the assumption of the validity of hypothesis so small that a random event that “a value of test statistics lies in a critical region” is supposed to be an impossible event. In the context of testing hypotheses, rejecting the null hypothesis indicates that the test results are significant when the p-value is less than 0.05. In contrast, if the p-value is higher than 0.05, the null hypothesis is not rejected.
Acceptance region (AR) is a set of test statistic values that do not lie in a critical region. Rejection point (RP)–partitions a critical region and an acceptance region. A significant level of the test is the probability of a critical region. The process of hypothesis testing:
noitemsep One concrete realization
noiitemsep the statistical test verifying the certain statistical H0 with the relevant critical region is determined.
noiiitemsep the probability of significance level of the test is chosen, generally = 0.05. noivtemsep the value of test statistics is calculated.
novtemsep This paper determines whether the value of test statistics lies in the critical region (the acceptance region). By comparing the calculated value with the table Z value. When the value of the test statistics lies in the critical region, the hypothesis H0 is rejected. When the value of the test statistics lies in the acceptance region, hypothesis H0 is not rejected.
The conditions must be satisfied with respect to measurements must be independent and homoscedastic.
The test under consideration serves as a non-parametric counterpart to the one-way analysis of variance, designed to evaluate the statistical equivalence of more than two distinct samples. Consider the scenario where we possess k independent random samples, each comprising
The primary objective of this test is to examine the hypothesis asserting that all samples derive from a singular population, implying the uniformity of all distribution functions Fi for i ranging from 1 to k. Consequently, the null hypothesis is articulated as follows in Eq. (4):
The alternative hypothesis H1 is
where k is the number of observations for a variable,
Assuming the hypothesis H0 is valid, so random variable Q has asymptotically (for
For a small number of factor levels and a small number of observations at individual variable levels (k ≤ 3 and ni ≤ 5), the χ2 probability distribution approximation is not appropriate. In this case, it is possible to use special tables constructed by Kruskal and Wallis.
Practical test application: All n values from the k-independent samples are rank-ordered from the lowest (rank 1) to the highest. The sum of the ranks in the j-th group (
When hypothesis H0 is rejected, it is necessary to find out which sample differs significantly from another, which causes the hypothesis to be rejected. Statistical analysis was executed employing SPSS software (version 25) for this issue.
The throughput could be defined as the total data received during the simulation time. Kruskal-Wallis test one-way ANOVA, revealed that the statistical results indicated that the current work rejects the null hypothesis, where the p < 0.05 was considered significantly important as shown in Table 1, consequently there are meaningful differences in terms of throughput efficiency (Asymp. Sig > 0.05). The throughput analysis via a one-way Analysis of Variance (ANOVA) test offers profound insights into the efficacy of four distinct routing protocols: AODV, DSR, DSDV, and ZRP. An evaluation encompassing 160 observations for each protocol, resulting in a total dataset of 640 observations, determined that AODV surpasses its counterparts by achieving the highest mean throughput of 526.96. This superiority in performance, indicative of AODV’s enhanced efficiency in network packet delivery, may be attributed to its dynamic approach to route establishment, which significantly improves path selection and reduces latency. Conversely, DSR demonstrates a moderate mean throughput of 324.92, situating it between AODV’s superior performance and the lesser throughput achieved by DSDV and ZRP. The use of source routing in DSR, which necessitates the inclusion of the route within the packet header, potentially offers flexibility in routing and benefits from caching. However, this comes at the cost of an overhead that may adversely affect throughput.

Furthermore, DSDV and ZRP exhibit comparatively lower mean throughputs of 218.90 and 211.22, respectively. The performance shortfall in DSDV can be ascribed to delays caused by periodic updates, a characteristic of table-driven routing protocols. In the case of ZRP, its endeavor to merge proactive and reactive routing strategies appears to compromise its throughput, possibly due to the inefficiencies of its hybrid mechanism or the impact of the chosen zone radius size. The rationale behind employing the one way ANOVA test is to verify the statistical significance of the variances observed in the mean throughput across the routing protocols.
A significant F-statistic resulting from the ANOVA and a p-value falling below the established threshold of significance would validate the hypothesis that the throughput performance of at least one protocol markedly differs from the rest. This finding is of paramount importance to network designers and researchers, as it informs the protocol selection process, considering the specific throughput requirements for diverse network scenarios and applications.
This thorough analysis accentuates the importance of choosing the appropriate protocol to optimize network throughput. While AODV is optimal for high-throughput scenarios, DSR offers a balanced alternative. Despite their lower throughput metrics, DSDV and ZRP remain viable options in contexts where scalability and network stability are prioritized over outright performance. Additional investigations, particularly posthoc analyses after the ANOVA, promise to provide a more granular comparative analysis of the protocols, elucidating their strengths and weaknesses.
Table 2 summarizes the results from a Kruskal-Wallis H test, a non-parametric version of ANOVA, used to compare the throughput across four different routing protocols. The Kruskal-Wallis H statistic is 303.846, with 3 degrees of freedom (df), indicating the number of groups minus one. The asymptotic significance (Asymp. Sig.) value is 0.000, typically interpreted as p < 0.001. This extremely low p-value suggests significant differences in throughput among the four routing protocols. In simpler terms, the test shows that not all routing protocols perform the same throughput, with the differences being statistically significant.

In this analysis, the Asymptotic Significance (Asymp. Sig.) value of 0.000 at the 5% significance level holds substantial importance. According to the Kruskal-Wallis test, a p-value less than or equal to the named significance level necessitates the rejection of the null hypothesis. This implies that the medians of the groups under consideration are not identical. The observed variance is significant and cannot be disregarded at this level of importance, underscored by an Asymp. Sig. value of 0.000.
Consequently, further analysis was conducted through Non-parametric test, specifically the Mann-Whitney test, to discern which specific types of protocols exhibit this notable variance. The outcomes of this subsequent examination, detailed in Table 2, elucidate the significant differences in performance between the AODV and DSR routing protocols. This stepwise approach, beginning with the Kruskal-Wallis test and progressing to the Mann-Whitney test, allows for precise identification of variations in protocol performance, thereby providing a comprehensive understanding of their comparative efficacy. This result led us to conclude which type of protocols had this significant value by using the Non-parametric Tests-Mann-Whitney t-test, as shown in Table 3 between the AODV and DSR routing protocols.

5.4.1 Mann-Whitney Test of AODV & DSR Throughput Term
The Mann-Whitney test, alternatively recognized as the Wilcoxon Rank Sum Test, constitutes a non-parametric statistical methodology designed to compare two independent samples or groups. This test evaluates the likelihood that the two groups under consideration originate from the same distribution. It probes the hypothesis concerning the similarity in distribution shapes of the two populations, focusing on the variable of interest. The core inquiry facilitated by the Mann-Whitney test revolves around determining whether the observed groups derive from populations exhibiting distinct characteristics regarding the variable under scrutiny. Table 3 shows the statistics test results.
Table 3 presents the outcomes of the Mann-Whitney test, offering a statistical comparison between two groups. The results are as follows: the Mann-Whitney value stands at 3599.000, the Wilcoxon W at 16479.000, and the Z-score at −11.127, with an Asymptotic Significance (Asymp. Sig.) of 0.000 on a two-tailed test. This Asymp. Sig. value, being less than 0.05, signifies that the findings are statistically significant at the 5% significance level. Consequently, this leads to the rejection of the null hypothesis, suggesting a notable difference between the groups under comparison.
Conversely, Table 4 details the Mann-Whitney test results for the DSDV and ZRP protocols. The values reported are as follows: Mann-Whitney at 11622.500, Wilcoxon W at 24502.500, and Z-score at −1.423, with an Asymp. Sig. (2-tailed) of 0.155. The Asymp. Sig. value exceeding 0.05 indicates that there is no statistically significant difference between the DSDV and ZRP protocols, thereby not warranting the rejection of the null hypothesis in this instance.

5.4.2 Evaluation of Throughput Variability in Routing Protocols
Further analysis showed the standard deviation (SD) and the results are correct. Table 5 states the summary statistics for the standard deviation study of throughput for routing protocols—the suggested work calculated the cumulated standard deviation throughput for all four routing protocols testbeds. Standard deviation measures the amount of deviation from the Mean. The outcome of the standard deviation analysis is shown in Table 5, below, and the experiment results were accurate.

The PDR metric is greatly influenced by throughput. The results obtained from the ANOVA hypothesis analysis of the four routing protocols are summarized in Table 6. The result proved the evidence to refute the null hypothesis. Table 6, below, presents the vital difference in the PDR term. Table 6 presents the Kruskal-Wallis test one-way ANOVA to show the Sig. value.

This method stands as a reliable alternative to the conventional one-way Analysis of Variance (ANOVA), adept at handling data that doesn’t fit the normal distribution assumptions required by ANOVA. This analytical approach is employed to rigorously assess the statistical significance of variance across multiple groups. The values presented in Table 7 include a Kruskal-Wallis H statistic of 260.416 with degrees of freedom (df) set at 3, alongside an Asymptotic Significance (Asymp. Sig.) of 0.000. This result unambiguously indicates a statistically significant difference among the groups under examination, substantiating the hypothesis that not all group medians are equivalent. The negligible Asymp. Sig. value, effectively zero, underscores the high degree of confidence in these findings, reinforcing the pivotal role of the Kruskal-Wallis test in identifying and validating significant variances within the data as shown in Table 7.

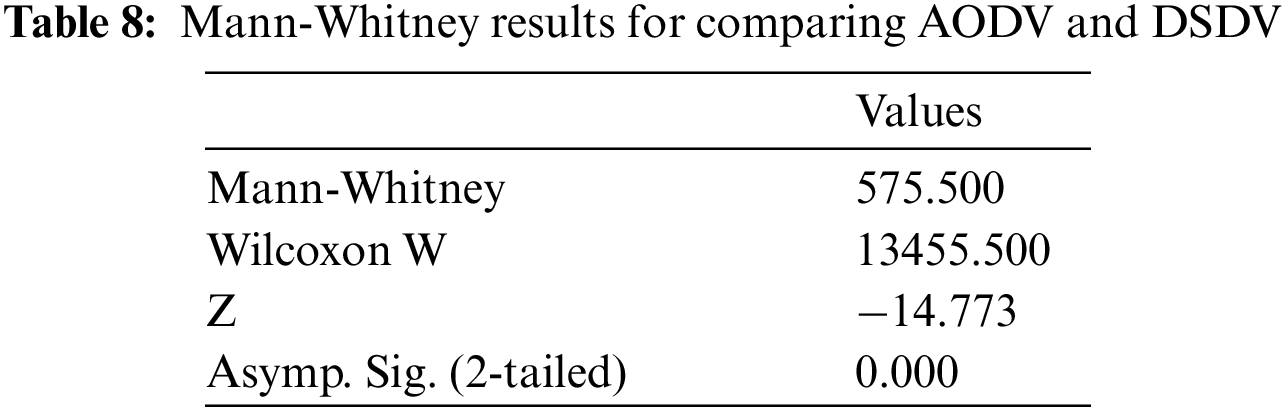
Table 8 confirms significant findings at the 0.05 level, indicating a departure from the null hypothesis due to Asymp. Sig. being less than 0.05. Employing the Mann-Whitney test, significant differences between AODV and DSDV routing protocols were identified, reinforcing the rejection of the null hypothesis, as detailed in Table 8 below.
The Friedman test, a non-parametric statistical analysis, is suitable for evaluating the end-to-end (E-2-E) delay across various routing protocols under different testing conditions or time points. This test is particularly advantageous when the data deviates from the normal distribution, offering a robust alternative for related samples, akin to the Kruskal-Wallis test.
Within the framework of this study, should there be a collection of E-2-E delay measurements acquired under disparate conditions or across sequential time intervals for identical routing protocols, the Friedman test is instrumental in ascertaining whether the observed differences in E-2-E delays are statistically significant across these varied scenarios.
For example, in scenarios where the E-2-E delay has been quantified for each routing protocol subjected to diverse network densities or mobility patterns, the Friedman test can be employed to determine the significance of these delay variances. It achieves this by comparing the rank order of the E-2-E delay for each protocol under different conditions, thereby elucidating which specific conditions or protocols are associated with significant fluctuations in delay. This analysis provides critical insights into the dynamic performance characteristics of the routing protocols under examination.
5.5.1 Friedman Test for Non-Parametric Analysis
The Friedman test is an extension of Wilcoxon’s one-sample test to three or more samples. It is essentially a generalization of a two-factor analysis of variance with one observation in each subclass.
Null Hypothesis: The null hypothesis H0 is that the population probability distributions are identical across groups, specifically:
Practical Application of the Friedman Test
1. Observation of each statistical unit is ranked from 1 to J.
2. Sum of ranks is calculated for each sample (factor), obtaining J sums of ranks
3. Check that as shown in (9) and (10):
4. The value Q is calculated as:
5. Decision about H0 is made:
• Q follows χ2 distribution with J −1 degrees of freedom (for I, J > 5).
• For small sample sizes, use the critical values for Friedman test from tables.
Post-Hoc Analysis When H0 is Rejected: If the null hypothesis is rejected, further analysis is required, such as Nemenyi’s method (balanced classification), which assesses the difference between rank sums for significance as shown in (11):
5.5.2 Results Analysis and Discussion of the Friedman Test
SPSS was employed to analyze and evaluate the performance of the AODV, DSR, DSDV, and ZRP routing protocol. This evaluation was conducted to assess the results of the protocols for the E-2-E delay metrics, which are critical and fit the Friedman test.
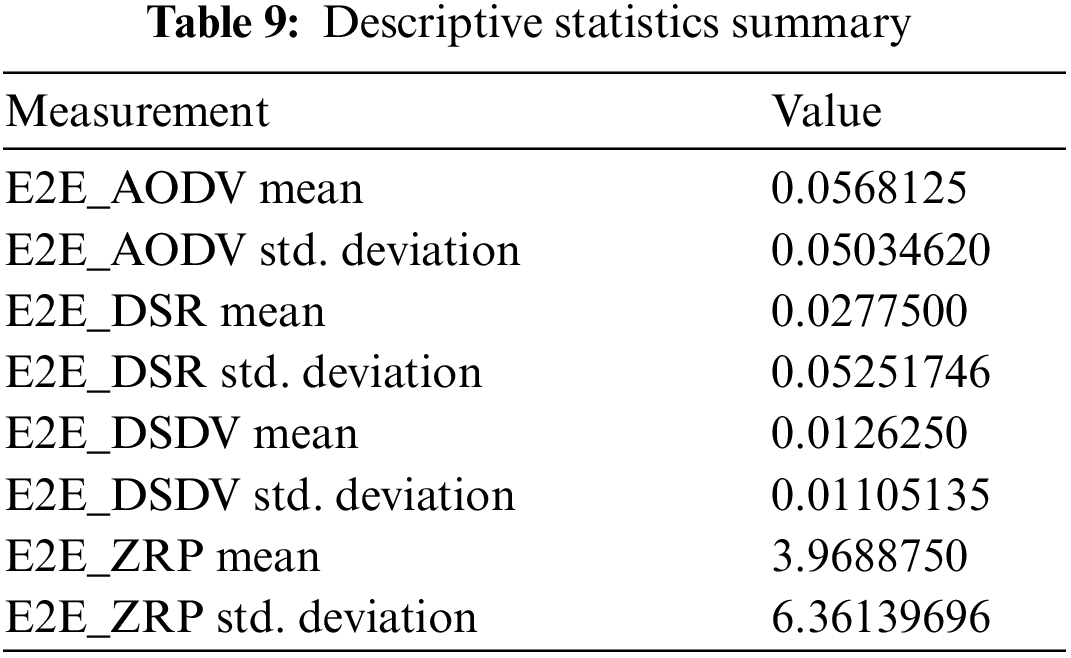
Table 9 contains descriptive statistics for four data sets, which represent the end-to-end delay times for four different protocols in communications networks: AODV, DSR, DSDV, and ZRP. Table 9 shows that the AODV (E-2-E_AODV) protocol has the lowest average end-to-end delay compared to other protocols. ZRP Protocol (E-2-E_ZRP) has the highest average delay and the highest dispersion (standard deviation), which indicates that performance can fluctuate significantly. DSR and DSDV protocols fall between AODV and ZRP in terms of average delay.
According to the results presented in Table 10, the significant statistic in the Friedman test indicates a statistically significant difference. The Chi-Square value is 386.575 with 3 degrees of freedom (df), and the Asymptotic Significance, also known as the p-value, is 0.000. This value signifies statistical significance at the conventional threshold of 0.05.

Therefore, this study rejects the null hypothesis H0 that posits no differences between groups. This analysis concludes that there are significant differences between the samples tested.
5.5.3 Related-Samples Friedman’s Two-Way Analysis of Variance
This procedure was used to determine the differences in 5.5.2. This investigation concerned whether the differences above were between AODV and DSDV, AODV and DSR, or DSR and ZRP, or which types of protocols achieved the result above. This investigation uses this type of test to determine that.
Table 11, shown below, summarizes the results of hypothesis testing. The results indicate statistically significant differences. The Chi-Square is 386.575 with 3 degrees of freedom (df), and the Asymptotic Significance, also known as the p-value, is 0.000. This means that it is well below 0.05, which is generally considered the level of significance in statistical tests.

Accordingly, researchers can reject the null hypothesis (H0), which assumes no group differences. Instead, we conclude that there are significant differences between the samples tested. Applying the Friedman test for correlated samples and two-way analysis of variance by ranks, it was found that the end-to-end (E-2-E) time distributions of the AODV, DSR, DSDV, and ZRP routing protocols are not identical.
Asymptotic significances are presented. The significance level is 0.050.
This shows that the performance of these protocols in terms of end-to-end delay varies significantly, meaning that at least one protocol shows significantly different performance compared to other protocols.
This result is of great interest to network designers and researchers in the field of communications because it helps determine the best protocols that can be utilized to enhance the overall performance of the network.
Fig. 2 and Table 12 present the results of pairwise comparisons between end-to-end delay time distributions for four different network protocols using a statistical test. Each row compares a pair of protocols to test the null-hypothesis that the distributions are similar between the two samples.

Figure 2: Related-samples friedman’s

Fig. 2 is used to compare the various protocols with respect to the frequency of rank occurrence. The number of times each of the ranks is observed has been charted along the horizontal axis ‘Frequency’, thus essentially showing the frequency a certain rank occurs for each protocol. The vertical axis shows the position of the rank, whereby lower ranks such as 1 and 2 are always better than other ranks, such as 4 and 5.
Asymptotic importance (two-sided tests) is shown. The statistical significance level is 0.05. The Bonferroni adaptation was used to alter the importance values for several tests.
By analyzing the values provided, the presented investigation observes the following:
There are no statistically significant differences between the E2E_DSDV and E2E_DSR protocols, as the significance value is higher than 0.05.
Every row examines the null hypothesis, which claims that the data from Sample 1 and Sample 2 are equal. There are no substantial statistical variations between E2E_DSDV and E2E_AODV, as well as between E2E_DSDV and E2E_ZRP, because the significance values are equal to 0.000, which is much less than 0.05.
Other comparisons also show similar statistically significant differences. Overall, the table indicates that the performance of the protocols varies significantly when it comes to end-to-end delay, and the results show which protocols have significantly different distributions.
Figs. 3 and 4 present end-to-end delay histograms for four routing protocols in telecommunications networks: AODV, DSR, DSDV, and ZRP. This investigation can observe the following issues.

Figure 3: Frequency distribution of E-2-E delay for AODV & DSR protocols

Figure 4: Frequency distribution of E-2-E delay for DSDV& ZRP protocols
1. AODV protocol: The delay distribution appears concentrated around the average value, with a relatively narrow spread that shows consistency in performance.
2. DSR protocol: Similar to AODV in terms of the general shape of the distribution but with a higher frequency of very short delays (near zero).
3. DSDV protocol: Shows a delay distribution characterized by a large concentration of lower values, indicating that most packets are delivered with little delay.
4. ZRP: Shows a significant variation in delays, with some packets arriving with extensive delays compared to other protocols.
5. These results conclude that there is a clear difference in the performance of these protocols regarding delay time. In these cases, the ZRP protocol can fail in quite a high number, and the result is a high delay. The DSDV protocol will have predictable performance since most packets come through with little delay. The DSR and AODV protocols give similar performance but with slightly different tolerances.
The horizontal axis is in unit measure (in milliseconds). It carries the normalized delay for the experiment on the end-to-end delays for all four routing protocols: AODV, DSR, DSDV, and ZRP. The vertical axis is denoted “Frequency”, a dimensionless count of occurrences.
Statistical analysis of the performance differences among these MANET routing protocols, through NS-2 simulation, provides valid in-depth information. This difference was statistically significant, as it was confirmed rigorously through robust confidence tests that there is indeed a difference in throughput from the null hypothesis. AODV has greater throughput at lower end-to-end delay and is hence a better option for those scenarios when the required levels of efficiency and reliability are high. From the other perspective, this fact can be considered to mean that the performance of DSDV and ZRP is preferable in the applications where the priority is granted to stability and predictability, rather than the need for high throughput. The results would highlight the need for an informed choice of the protocol based on the exact requirements of the network and the scenarios that could very well lead to future research on MANET and its practical implementations. Furthermore, these methodologies and resultant approaches of the study open the space for further research into MANET routing optimizations. In fact, the study results recommend that a more nuanced approach to the analysis and deployment of protocols is necessary for further advancements in mobile ad hoc networking technology.
Acknowledgement: The authors extend their appreciation to the Deanship of Scientific Research at Northern Border University, Arar, KSA for funding this research work through the Project Number “NBU-FFR-2024- 2248-02”.
Funding Statement: This research was supported by Northern Border University, Arar, KSA, through the Project Number “NBU-FFR-2024- 2248-02”.
Author Contributions: The specific contributions of each author are as follows: The study conception and design: I.B., T.A.H. Data collection: I.A., A.N., A.E.Y. Analysis and interpretation of results: I.A., A.N., A.G. Draft manuscript preparation: I.A., T.A.H., A.E.Y., A.G. All authors reviewed the results and approved the final version of the manuscript.
Availability of Data and Materials: The corresponding author can provide data supporting the study’s conclusions upon an adequate request.
Conflicts of Interest: The authors declare that they have no conflicts of interest to report regarding the present study.
References
1. I. Alameri, J. Komarkova, T. Al-Hadhrami, and A. Lotfi, “Systematic review on modification to the ad-hoc on-demand distance vector routing discovery mechanics,” PeerJ Comput. Sci., vol. 8, no. 1, pp. e1079, 2022. doi: 10.7717/peerj-cs.1079. [Google Scholar] [PubMed] [CrossRef]
2. S. M. Darroudi and C. Gomez, “Bluetooth low energy mesh networks: A survey,” Sensors, vol. 17, no. 7, pp. 1467, 2017. doi: 10.3390/s17071467. [Google Scholar] [PubMed] [CrossRef]
3. Y. Chai and W. Shi, “Access-enhanced hybrid routing protocol for hybrid wireless mesh network,” in 2017 IEEE 9th Int. Conf. Commun. Softw. Netw. (ICCSN), Guangzhou, China, IEEE, May 2017, pp. 138–141. doi: 10.1109/ICCSN.2017.8230094. [Google Scholar] [CrossRef]
4. A. Devrari, A. Kumar, A. Kumar, and S. Singh, “Design and FPGA implementation of DSSS for near-far effect in MANET,” in Proc Int Conf Intell Commun, Control Dev: ICICCD 2016, pp. 425–434, 2017. doi: 10.1007/978-981-10-1708-7_48. [Google Scholar] [CrossRef]
5. Y. Chai and X. J. Zeng, “Regional condition-aware hybrid routing protocol for hybrid wireless mesh network,” Comput. Netw., vol. 148, no. 3, pp. 120–128, Jan. 2019. doi: 10.1016/j.comnet.2018.11.008. [Google Scholar] [CrossRef]
6. M. Naravani, D. G. Narayan, S. Shinde, and M. M. Mulla, “A cross-layer routing metric with link prediction in wireless mesh networks,” Procedia Comput. Sci., vol. 171, no. 4, pp. 2215–2224, 2020. doi: 10.1016/j.procs.2020.04.239. [Google Scholar] [CrossRef]
7. S. Sophie Maria Vincent and N. Duraipandian, “Detection and prevention of sinkhole attacks in MANETS based routing protocol using hybrid AdaBoost-Random forest algorithm,” Expert. Syst. Appl., vol. 249, no. 1, pp. 123765, Sep. 2024. doi: 10.1016/j.eswa.2024.123765. [Google Scholar] [CrossRef]
8. G. R. Rama Devi, M. Swamy Das, and M. V. Ramana Murthy, “Secure cross-layer routing protocol with authentication key management scheme for manets,” Meas.: Sens., vol. 29, no. 3, pp. 100869, 2023. doi: 10.1016/j.measen.2023.100869. [Google Scholar] [CrossRef]
9. S. Shafi, S. Mounika, and S. Velliangiri, “Machine learning and trust based AODV routing protocol to mitigate flooding and blackhole attacks in MANET,” Procedia Comput. Sci., vol. 218, no. 1, pp. 2309–2318, Jan. 2023. doi: 10.1016/j.procs.2023.01.206. [Google Scholar] [CrossRef]
10. C. Fathy, M. El-Hadidi, and M. Abou El-Nasr, “Fuzzy-based adaptive cross layer routing protocol for mobile ad hoc networks,” in 30th IEEE Int. Perform. Comput. Commun. Conf., Orlando, FL, USA, IEEE, Dec. 2011, pp. 1–10. doi: 10.1109/PCCC.2011.6108079. [Google Scholar] [CrossRef]
11. P. Reddy, B. Reddy, and B. Dhananjaya, “The AODV routing protocol with built-in security to counter blackhole attack in MANET,” Mater Today Proc., vol. 50, no. 5, pp. 1152–1158, Jan. 2022. doi: 10.1016/j.matpr.2021.08.039. [Google Scholar] [CrossRef]
12. S. Khan, A. A. Pirzada, and M. Portmann, “Performance comparison of reactive routing protocols for hybrid wireless mesh networks,” in 2nd Int. Conf. Wirel. Broadband Ultra Wideband Commun. (AusWireless 2007), Sydney, NSW, Australia, IEEE, Aug. 2007, pp. 78. doi: 10.1109/AUSWIRELESS.2007.55. [Google Scholar] [CrossRef]
13. Y. Yu, Y. Peng, L. Guo, and X. Wang, “Performance evaluation for routing protocols in wireless mesh networks,” in 2010 Int. Corif. Educ. Inform. Technol. (ICEIT 2010), Chongqing, China, IEEE, Sep. 2010, pp. 107–109. doi: 10.1109/ICEIT.2010.5607513. [Google Scholar] [CrossRef]
14. T. Anne Ramya, J. M. Mathana, R. Nirmala, and R. Gomathi, “Exploration on enhanced quality of services for MANET through modified Lumer and Fai-eta algorithm with modified AODV and DSR protocol,” Mater Today Proc., vol. 80, no. 3, pp. 1765–1771, Jan. 2023. doi: 10.1016/j.matpr.2021.05.601. [Google Scholar] [CrossRef]
15. F. J. Yin, H. Yang, and Y. Zhang, “Research on DSDV routing protocol based on wireless mesh network,” in Proc. 30th Chi. Control Decis. Conf., CCDC 2018, 2018, pp. 4292–4297. doi: 10.1109/CCDC.2018.8407870. [Google Scholar] [CrossRef]
16. R. Singh and N. Singh, “Performance assessment of DSDV and AODV routing protocols in mobile adhoc networks with focus on node density and routing overhead,” in 2020 Int. Conf. Emerg. Smart Comput. Inform., ESCI 2020, 2020, pp. 298–303. doi: 10.1109/ESCI48226.2020.9167627. [Google Scholar] [CrossRef]
17. X. Yang, Q. Chen, C. Chen, and J. Zhao, “Improved ZRP routing protocol based on clustering,” Procedia Comput. Sci., vol. 131, no. 5, pp. 992–1000, Jan. 2018. doi: 10.1016/j.procs.2018.04.242. [Google Scholar] [CrossRef]
18. A. Zakrzewska, L. Koszałka, and I. Poźniak-Koszałka, “Performance study of routing protocols for wireless mesh networks,” in Proc. 19th Int. Conf. Syst. Eng., 2008, pp. 331–336. doi: 10.1109/ICSEng.2008.49. [Google Scholar] [CrossRef]
19. N. Beijar, “Zone routing protocol (ZRP),” in Networking Laboratory. Finland: Helsinki University of Technology, Apr. 2002, vol. 9, no. 1, pp. 1–12. [Google Scholar]
20. C. M. Kwai, J. L. Tan, and K. Dodo, “Empirical comparative study of AODV, DSR, OLSR and ZRP routing protocol for IoT blockchain,” in 2022 Int. Conf. Digital Transform. Intell. (ICDI), Sarawak, Malaysia, IEEE, Dec. 2022, pp. 1–6. doi: 10.1109/ICDI57181.2022.10007424. [Google Scholar] [CrossRef]
21. A. Manhar and D. Dembla, “Design an improved hybrid routing protocol strategy to minimize delay & overhead for MANET,” Turk. J. Comput. Math. Educ., vol. 12, no. 6, pp. 2407–2419, Apr. 2021. doi: 10.17762/turcomat.v12i6.5685. [Google Scholar] [CrossRef]
22. C. Janicak and M. Zreiqat, “Descriptive statistics,” in Applied Statistics in Occupational Safety and Health, 4th ed. Lanham, USA: Rowman & Littlefield, 2023, vol. 4. [Google Scholar]
Cite This Article
 Copyright © 2024 The Author(s). Published by Tech Science Press.
This work is licensed under a Creative Commons Attribution 4.0 International License , which permits unrestricted use, distribution, and reproduction in any medium, provided the original work is properly cited.
 Downloads
 Citation Tools