
 Submit a Paper
 Propose a Special lssue
 Open Access
ARTICLE

A Hybrid Feature Fusion Traffic Sign Detection Algorithm Based on YOLOv7
1 School of Mechanical Engineering, Henan University of Science and Technology, Luoyang, 471000, China
2 School of Information Engineering, Henan University of Science and Technology, Luoyang, 471000, China
3 School of Electronic Information, Zhengzhou Institute of Aeronautical Industry Management, Zhengzhou, 450046, China
4 Henan Province New Energy Vehicle Power Electronics and Power Transmission Engineering Research Center, Luoyang, 471000, China
* Corresponding Author: Juwei Zhang. Email:
(This article belongs to the Special Issue: Metaheuristics, Soft Computing, and Machine Learning in Image Processing and Computer Vision)
Computers, Materials & Continua 2024, 80(1), 1425-1440. https://doi.org/10.32604/cmc.2024.052667
Received 10 April 2024; Accepted 11 June 2024; Issue published 18 July 2024
 View Full Text
 Download PDF
Abstract
Autonomous driving technology has entered a period of rapid development, and traffic sign detection is one of the important tasks. Existing target detection networks are difficult to adapt to scenarios where target sizes are seriously imbalanced, and traffic sign targets are small and have unclear features, which makes detection more difficult. Therefore, we propose a Hybrid Feature Fusion Traffic Sign detection algorithm based on YOLOv7 (HFFT-YOLO). First, a self-attention mechanism is incorporated at the end of the backbone network to calculate feature interactions within scales; Secondly, the cross-scale fusion part of the neck introduces a bottom-up multi-path fusion method. Design reuse paths at the end of the neck, paying particular attention to cross-scale fusion of high-level features. In addition, we found the appropriate channel width through a lot of experiments and reduced the superfluous parameters. In terms of training, a new regression loss CMPDIoU is proposed, which not only considers the problem of loss degradation when the aspect ratio is the same but the width and height are different, but also enables the penalty term to dynamically change at different scales. Finally, our proposed improved method shows excellent results on the TT100K dataset. Compared with the baseline model, without increasing the number of parameters and computational complexity, and increased by 2.2% and 2.7%, respectively, reaching 92.9% and 58.1%.Keywords
With the rapid development of computer technology, especially the substantial increase in computing speed (FLOPS), complex assisted driving and driverless have entered people’s lives. Traffic signs play an essential role in improving road safety and personal safety. This technology can identify traffic signs in on-board cameras, including warning, speed limit, prohibition, and other signs, and provide drivers with necessary information in advance.
Because during driving, the size of traffic signs is inversely proportional to the driving distance. Therefore, traffic signs become small targets at longer distances. To ensure that high-speed vehicles have sufficient braking distance, longer-distance traffic signs need to be recognized. As shown in Fig. 1, the average size of the traffic signs that can be identified in the traffic sign scene map captured by a real on-board camera with a resolution of 2048 × 2048 is 40 × 40 pixels, accounting for approximately 0.04% of the entire image. Due to the low resolution and limited feature information of small targets, these will bring great challenges to detection.
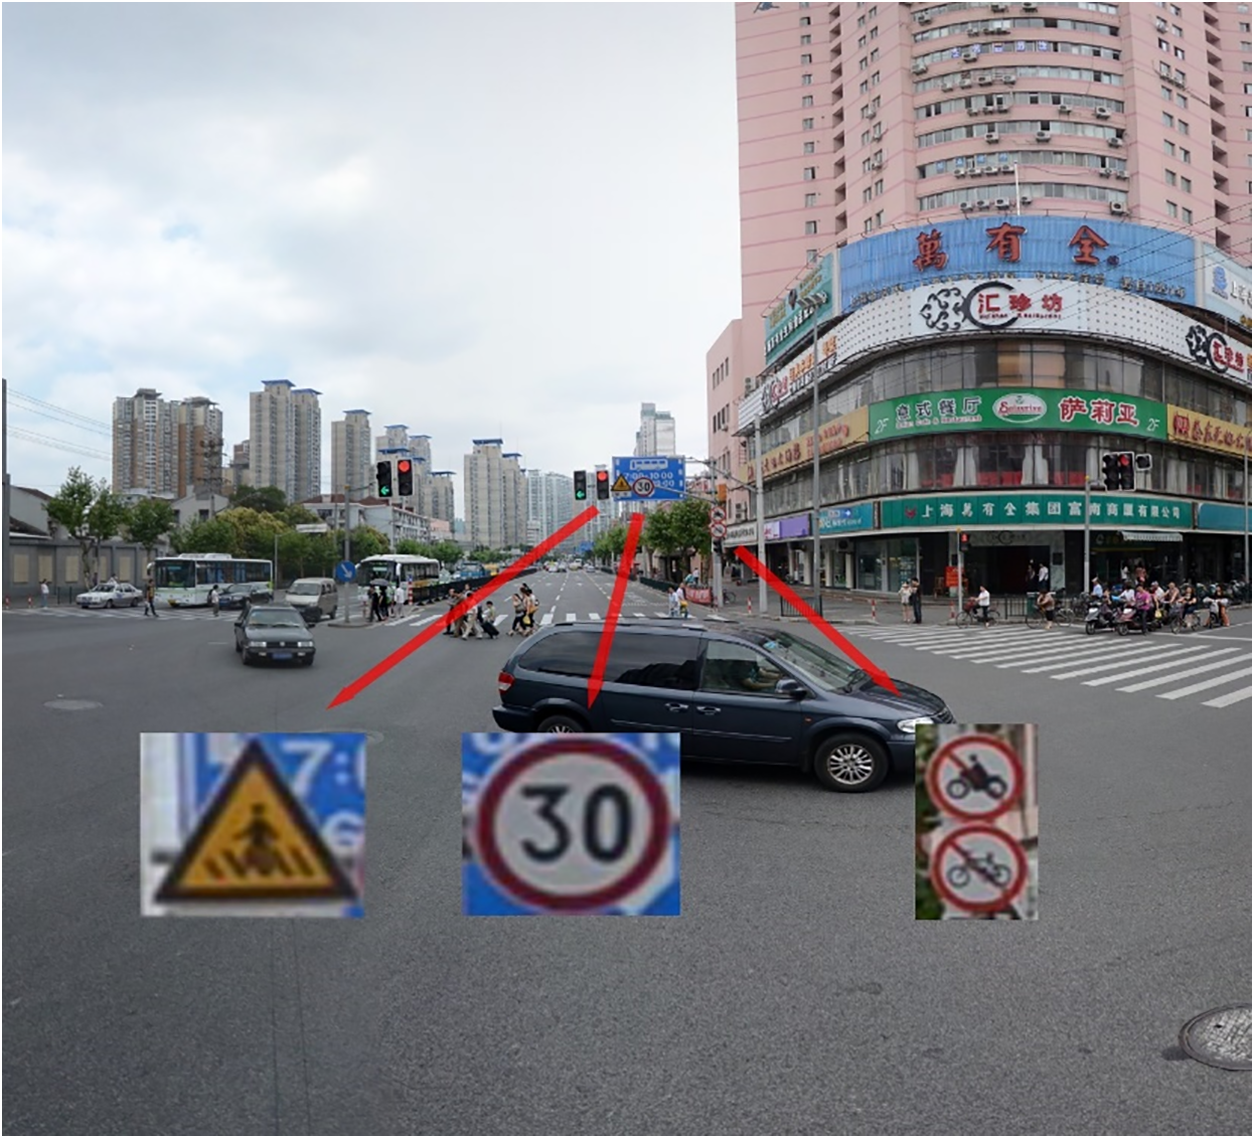
Figure 1: Small targets in traffic signs
Deep learning is a common method for modern target detection technology. It has more potent feature extraction and expression capabilities, robustness, and high accuracy. Therefore, deep learning algorithms have become the most commonly used technology in the current field of target detection. Currently, target detection algorithms based on deep learning are divided into two categories: the self-attention neural network based on Transformer [1] and the convolutional neural network (CNN) based on convolution. However, the “pure blood self-attention neural network” is still in the research stage and is difficult to use for real-time detection. Therefore, most deep learning target detection algorithms are based on CNN. For example, the two-stage detector Faster R-CNN [2], the one-stage detector SSD [3], and You Only Look Once (YOLO) [4], but when these algorithms are directly applied to traffic sign data, the actual effect is often not good.
To improve the YOLO algorithm’s detection ability of traffic signs, we proposed the HFFT-YOLO algorithm to locate and classify traffic signs. The algorithm is based on the YOLOv7 [5] framework, which naturally possesses advantages for the detection of traffic signs due to its positive and negative sample allocation strategy. This strategy effectively prevents accuracy loss caused by an imbalance between positive and negative samples. The HFFT-YOLO algorithm has achieved better performance in the detection results of traffic signs.
The main contributions of this paper are summarized as follows:
• An efficient hybrid feature pyramid fusion structure has been proposed, which includes two modules: the BiFormer-based self-attention Intra-scale feature interaction module and the DAMO-YOLO-based Cross-scale Feature-fusion module.
• A regression loss CMPDIoU and regression loss function
The rest of this paper is organized as follows: Section 2 introduces related work on CNN-based traffic sign detection. Section 3 introduces the research content in detail. Section 4 describes the experimental results. In Section 5, the content of this paper is summarized and conclusions are presented.
Nowadays, target detection algorithms are widely used in the field of computer vision. According to whether it is necessary to divide the region of interest (ROI), it is divided into a two-stage detector and a one-stage detector. The two-stage detector has high detection accuracy, but is slow and is mostly used for research. One-stage detectors are often used for real-time detection due to their fast detection speed and good detection accuracy.
In traffic sign detection, Lai et al. [6] constructed a new traffic sign data set based on TT100K, which includes various complex weather. At the same time, the downsampling multiple of YOLOv5 was adjusted, and the width of the detection layer was adjusted to obtain richer small target features. The limitation of this method is that the clustering algorithm based only on Kmeans++ cannot provide suitable anchor boxes for the new detection head. The average accuracy of the proposed algorithm STC-YOLO on the TT100K data set reached 89.9%. Mahaur et al. [7] proposed IS-YOLOv5 based on YOLOv5 for small targets of traffic signs and traffic lights. By replacing standard convolutions with depth-wise separable convolutions and improving the SPP (Spatial Pyramid Pooling) and PANET (Path Aggregation Network), the overall performance is enhanced. Furthermore, a universal network pruner has been proposed to significantly reduce the number of parameters and computational complexity of the network while preserving its accuracy. The algorithm achieves an average accuracy of 70.2% on the BDD100K data set. Liu et al. [8] proposed the UCN-YOLOv5 algorithm for the complex and changeable environment of traffic sign detection. This algorithm enhances the feature extraction capability of the network through U2net’s core module. It adds a lightweight receptive field attention module LPFAConv to the detection head to represent a potential enhancement to receptive field feature extraction. Li et al. [9] proposed a Sano-YOLOv7 algorithm, which introduced dynamic convolution (ODConv) to replace the conventional convolution of the neck structure. By introducing Gaussian Wasserstein distance (NWD) as the loss function, the sensitivity of small target detection to small position deviations is reduced. The algorithm achieves an average accuracy of 87.1% on the TT100K data set. Yang et al. [10] proposed an improved algorithm for YOLOv3 by introducing a visual multi-scale attention module (MSAM) and adding new detection heads. This effectively enhances the network’s recall capability for small objects. The algorithm achieved an average precision of 96.5% on the TT100K dataset. However, the addition of the new detection heads has a significant impact on the conventional network, particularly increasing computational complexity and affecting real-time performance. Xu et al. [11] proposed an improved YOLOv5 network model, proposed a Hierarchical Classifier Module (HCM), and constructed a multi-frame information fusion module that does not require training. This model significantly reduces the imbalance between traffic sign types without changing the sample size. HCM (Hierarchical Classification and Re-prediction Method) addresses the issue of uneven data distribution by re-predicting the traffic signs after classifying them. This approach effectively improves the problem of uneven data allocation. The model achieved an impressive average precision of 79.0% on the entire TT100K dataset, demonstrating excellent performance. However, the “pseudo one-stage” approach significantly affects the real-time capability of the algorithm. Wang et al. [12] designed an improved feature pyramid structure called AF-FPN (Adaptive Feature Fusion Pyramid Network). This structure replaces the neck part of YOLOv5 and reduces information loss during the feature map generation process, thereby enhancing the original network’s multi-scale detection capability. In addition, an automatic learning data enhancement algorithm is proposed to enhance the robustness of the model. This algorithm has fewer parameters and computational complexity, and the average accuracy on the TT100K data set reaches 65.1%. Zhao et al. [13] designed the YOLOv7-TS algorithm to solve the problem of missed detection of small targets and low accuracy in traffic sign detection. By utilizing sub-pixel convolution combined with the channel dimension’s upsampling capability and the Feature Map Extraction Module (FMEM), the perception ability of small objects is effectively enhanced. The algorithm achieved an average precision of 92.4% on the TT100K dataset. While the algorithm reduced the parameter count, it did not result in faster inference speed. Zhang et al. [14] proposed a multi-scale traffic sign detection algorithm called CR-YOLOv8. By introducing attention modules and improving the loss function, the algorithm effectively balances the detection of objects at multiple scales. Based on the lightweight YOLOv8 architecture, the algorithm achieved an average precision of 86.9% on the TT100K dataset. It effectively reduced the detection accuracy discrepancies between different scales. Wei et al. [15] introduced ConvNeSe, a lightweight detection model that utilizes separable convolutions. By adding the reversed residual structure and ConvNeSe block, the problems of gradient disappearance and structural information loss were avoided. The lightweight convolution utilized in the algorithm is based on depth-wise separable convolution. However, it is regrettable that deep separable convolution does not exhibit fast execution speed on GPUs. The algorithm achieved an average precision of 99.85% on the GTSRB dataset.
In summary, the fusion of feature information at multiple scales has been proven to be a simple and effective method to improve network performance. In addition, changing the optimization strategy of the neural network is also one of the most effective methods. Therefore, this article optimizes YOLOv7 from these two aspects: network structure improvement and regression loss function optimization.
YOLOv7 is currently one of the few one-stage detectors that can maintain high accuracy while still maintaining detection speeds exceeding 30FPS. YOLOv7-tiny is suitable for edge GPUs, YOLOv7 is suitable for regular GPUs, and YOLOv7-W6 is suitable for cloud GPUs. Each is designed for different application scenarios. Fig. 2 shows the backbone network of YOLOv7.
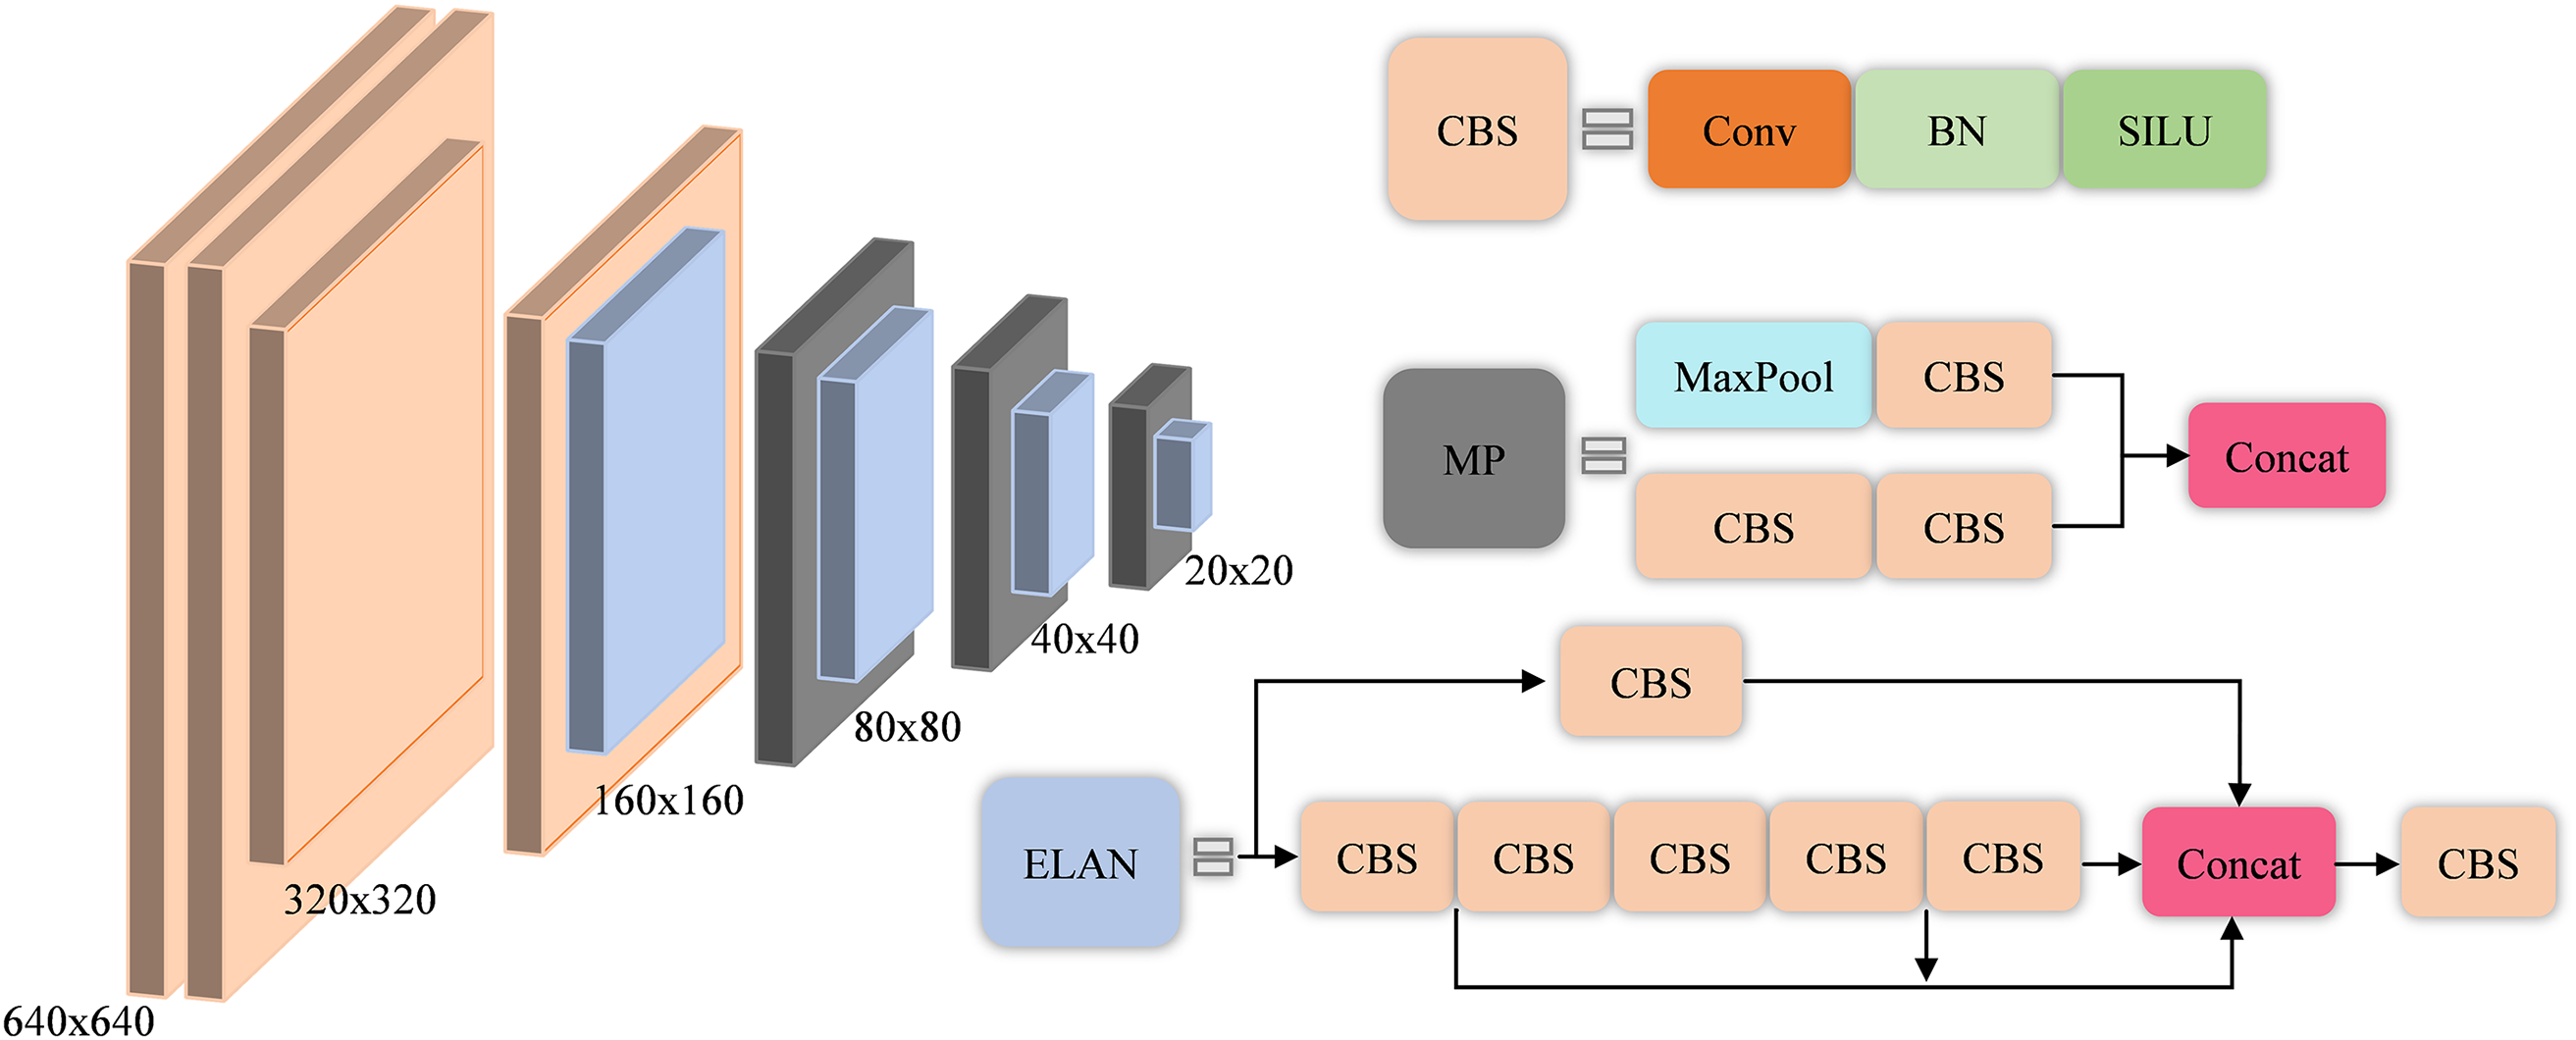
Figure 2: YOLOv7 backbone structure
The YOLOv7 consists of four parts, namely input, backbone, neck, and predicted head. For the input of color images, they are uniformly adjusted to 640 × 640 pixels to meet the input size requirements of the backbone network. CBS includes two-dimensional convolution layers, normalization (BN), and SILU activation functions. ELAN includes multi-branch CBS, which improves the information richness of the network through the fusion of multi-layer convolutions. The MP layer replaces the original pooling layer and is divided into multiple branches. There are not only convolutional layers that change the step size, but also ordinary pooling layers with maximum pooling. Through the fusion of the two, the selectivity of the feature map of the network is improved.
The loss functions of the target detection task include classification loss and regression loss. The two are combined into the loss of the entire network through a certain proportional relationship. L1 Loss, L2 Loss, and smooth L1 Loss [16] is the original regression loss. It calculates the loss directly by calculating the difference X between the predicted value and the true value. The smooth L1 Loss is described as formula (1). As the initial regression loss function, it makes a great contribution to the positioning of network targets. However, when this kind of loss is used to calculate the regression loss, the differences X are all independent, which is not valid for the four-corner coordinates of a box.
Therefore, Yu et al. [17] proposed a new calculation method called Intersection over Union (IoU), which represents the ratio of the intersection to the union between the ground truth and the bounding box. IoU resolves the issue of disconnected coordinates but also introduces new challenges. For example, when the intersection is 0, it cannot reflect the distance between A and B. Currently, it is not differentiable, and the gradient cannot be updated. Another example is that the IoU value cannot reflect how the two boxes intersect. In response to these problems, scholars have introduced penalty terms, such as GIoU, DIoU, CIoU, EIoU, and WIoU [18–21]. These loss functions supplement IoU and take more comprehensive considerations. Fig. 3 shows the calculation method of standard IoU and the performance of GIoU after adding penalty terms.
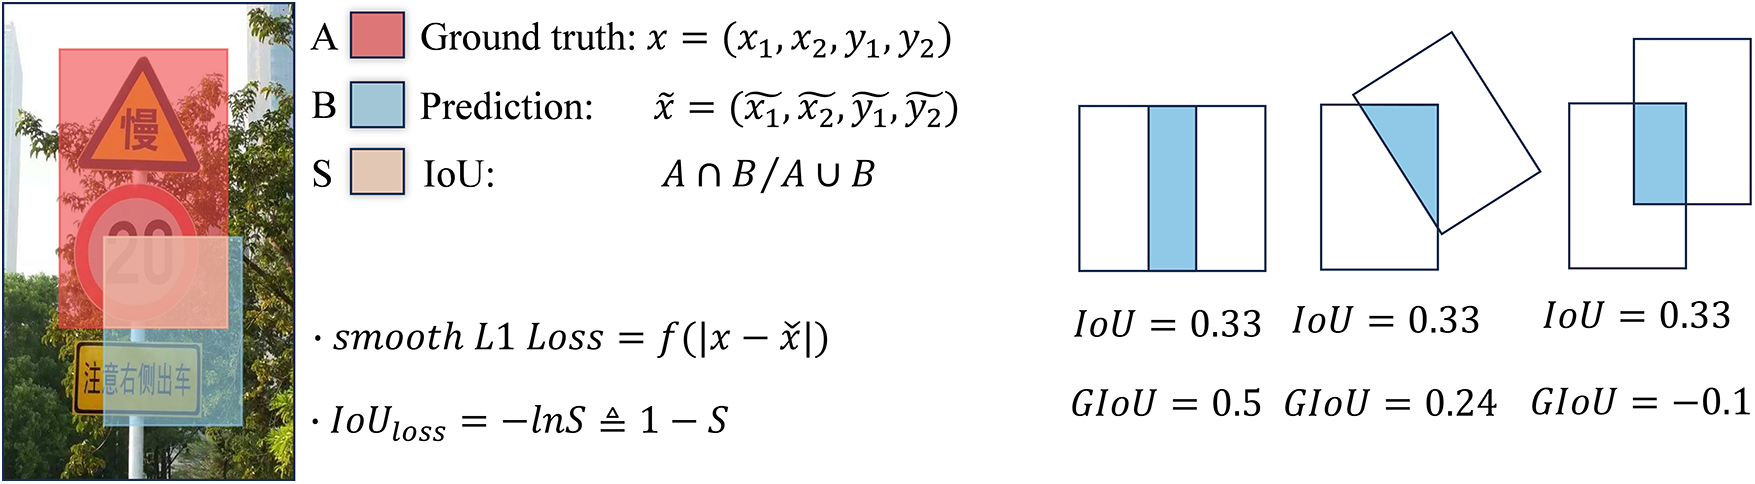
Figure 3: IoU calculation method (Left) and GIoU have the same IoU but different intersection situations (Right)
3.1 Intra-Feature Interaction BiFormer
BiFormer [22] is a variant of Transformer and is a global self-attention mechanism suitable for computer vision. The self-attention mechanism has a wider receptive field than convolution. Its receptive field at the low level already includes the receptive field deep in the convolution block [23]. Although self-attention has such advantages, the rapidly growing “graph vector” for images will cause the model to be unable to meet real-time requirements. This is why convolutional neural networks remain the first choice for modern object detection algorithms.
BiFormer introduces a novel Bi-level Routing Attention (BRA), which contains a region-level crude extraction and a token-level fine extraction, reducing the computing resources consumed by the self-attention mechanism while also meeting the characteristics of dynamic adaptive query. The specific structure is shown in Fig. 4.
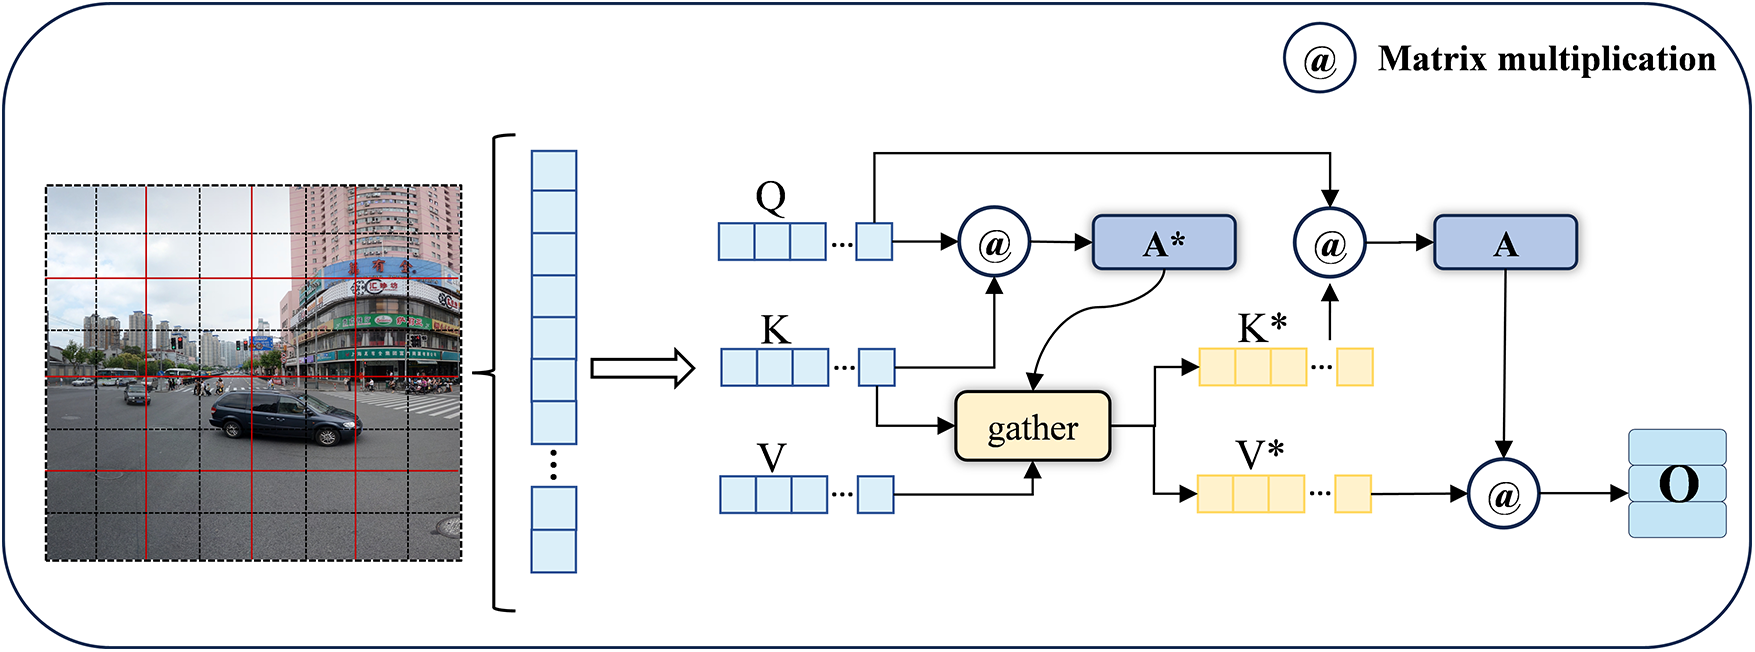
Figure 4: BRA mechanism
In the rough extraction stage, the entire image is divided into several areas of equal area. Then the whole image is linearly mapped to Quary, Key, and Value (Q, K, V) according to pixels. After averaging Q and K according to the assigned area, the adjacency matrix A* is obtained by matrix multiplication. In layman’s terms, A* represents a rough extraction at the regional level. In the fine extraction stage, the top four largest values and indexes in K and V are obtained through the gather method, namely Key* and Value*. They represent the most closely connected areas in K and V, respectively. The Q and K* matrices are multiplied to obtain the adjacency matrix A, which represents the fine extraction after the initial screening. Finally, the A and V* matrices are multiplied to get the same output as the input.
The entire process can be summarized as follows:
where W represents the linear mapping weight of Q, K, V, Mean represents the averaging operation, gather represents the collection and merging of tensors, and Attention represents the calculation method of the attention mechanism.
3.2 Efficient Hybrid Feature Fusion
Objects with a pixel area smaller than 32 × 32 pixels defined in the COCO dataset are small targets. To effectively detect small targets in traffic signs, two main problems must be overcome. First, the RGB information of traffic signs is too little, resulting in a lack of representative features. Second, in complex background environments, small targets are easily confused with the background, making it difficult to distinguish the two when extracting features of small targets. To solve these problems, the self-attention mechanism can be integrated into the network. For the traffic sign detection task, adding the attention module can improve the representation ability of the network model and effectively reduce the interference of background environments [24].
On this basis, we combine the advantages of self-attention and propose an efficient hybrid feature pyramid fusion structure. The proposed neck structure consists of two modules, the self-attention Intra-scale feature interaction (B-AIFI) based on BiFormer, and the Cross-scale Feature-fusion module (D-CCMF) based on DAMO-YOLO [25], as shown in Fig. 5.
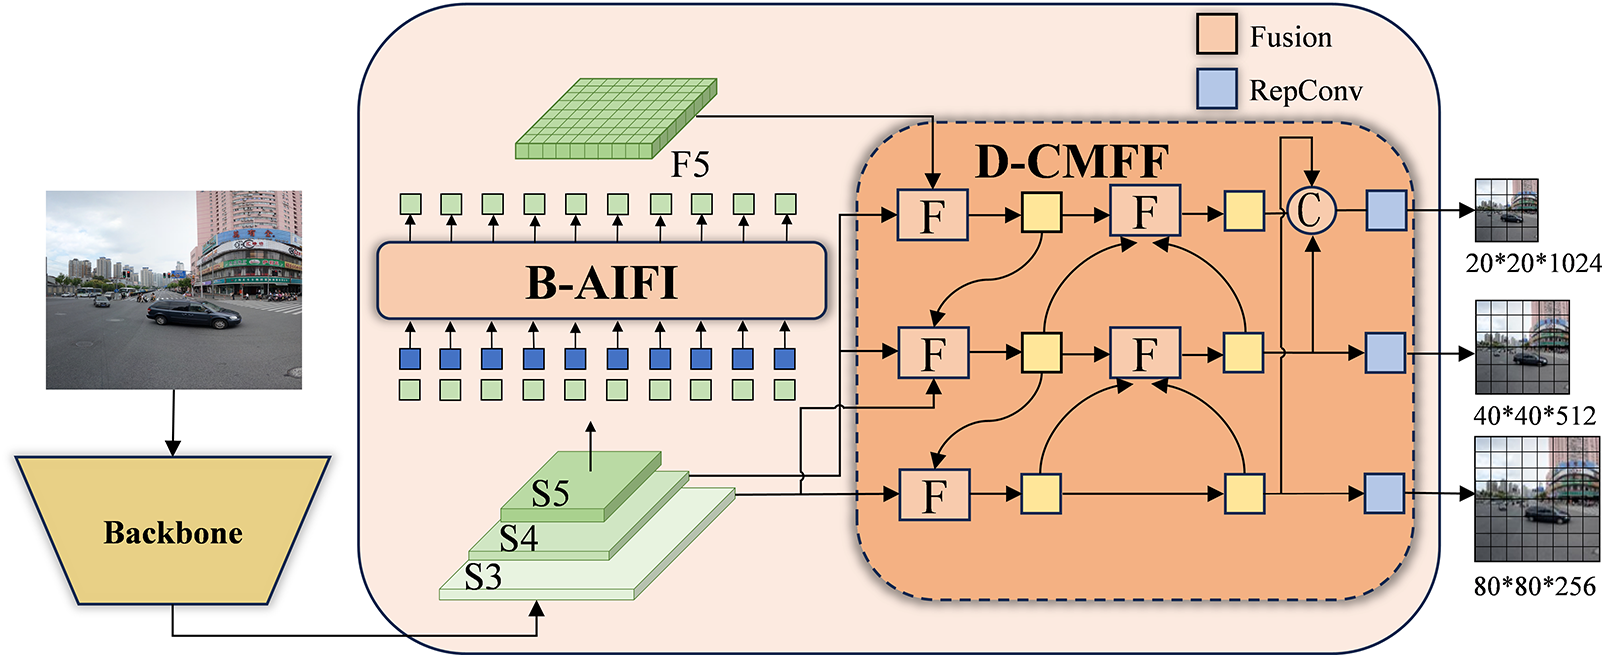
Figure 5: Hybrid feature fusion module
As described in [26], in the Deformable-DETR detector, 49% of the calculation amount only achieved an 11% improvement in accuracy, which contains a large amount of structural and parameter redundancy. Lv et al. [27] analyzed the computational redundancy of the Cross-scale fusion Transformer encoder and designed a series of different decoder variants, proving that it is unnecessary to fuse low-level information on concatenated Cross-scale features. Therefore, B-AIFI only processes high-level feature information from S5, and abandons the fusion of low-level information, improving computing efficiency.
Based on the D-CMFF module, the feature information of different layers is mainly fused through the Fashion module. The structure is shown in Fig. 6. The Fusion module integrates information from different paths by parallel fusion using residual layers and N layers of reparameterized convolutions (RepConv). Subsequently, the Concat method is employed to merge the fused information into new feature maps.
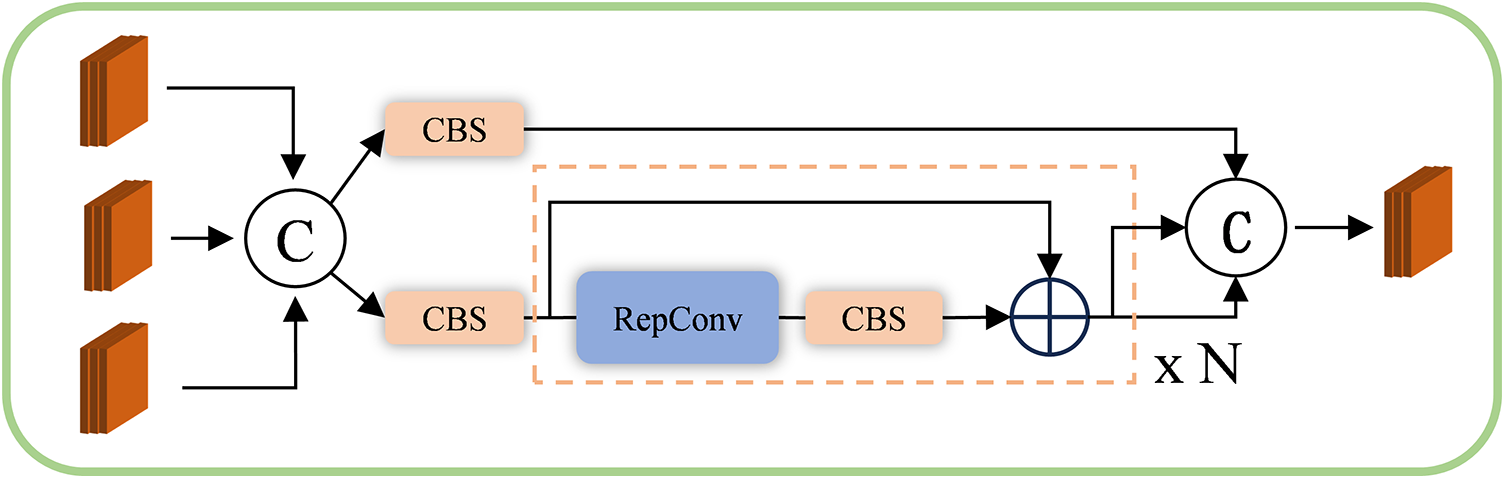
Figure 6: Fusion module
In addition, we improve the efficiency of the D-CMFF module from two aspects. First, find the optimal network depth and width. Since the FLOPs of the three feature map sizes are too different, maintaining a unified feature channel will undoubtedly significantly increase the amount of calculation and slow down the detection speed, which is contrary to real-time performance. Therefore, we adopt the setting of different scale feature maps with different dimensions of channels. Performance with the same and other channels as well as precision benefits from the Neck depth and width trade-offs are compared, it can be concluded that when the depth N = 3 and the width is (96, 192, 384), it has the highest AP. Table 1 shows the results, “Depth” denotes the repeat times on the bottleneck of the fusion block. “Width” indicates the channel dimensions of feature maps. Second, design reuse paths to improve the utilization rate of information at the end of the network. By summarizing the convergence of positive samples during the network training process, we found that the number of positive samples detected in the feature map of 20 * 20 size is far less than the number of samples of 40 × 40 and 80 × 80 size. This shows that in this detection task, the performance of the highest-level feature information is at a disadvantage. Therefore, the end of the network enhances the highest-level features using reuse paths.

The entire fusion process can be summarized as:
where Linear represents a linear mapping of feature maps. Path means extracting feature maps into blocks. Reshape means restoring the sequence matrix to the feature map standard format.
Currently, one-stage object detection networks based on CNN use IoU with an additional penalty term as the confidence of the bounding box. Ma et al. [28] proposed an MPDIoU, which considers the problem that the penalty term loses its effect when the predicted and the ground truth boxes have the same aspect ratio but different widths and heights. After experimental testing, MPDIoU is the most suitable solution for general detection tasks at this stage. It not only solves the above problems but also optimizes the calculation method and improves the calculation efficiency. It can be summarized as formula (9).
Although MPDIOU has better performance, the paper does not describe why
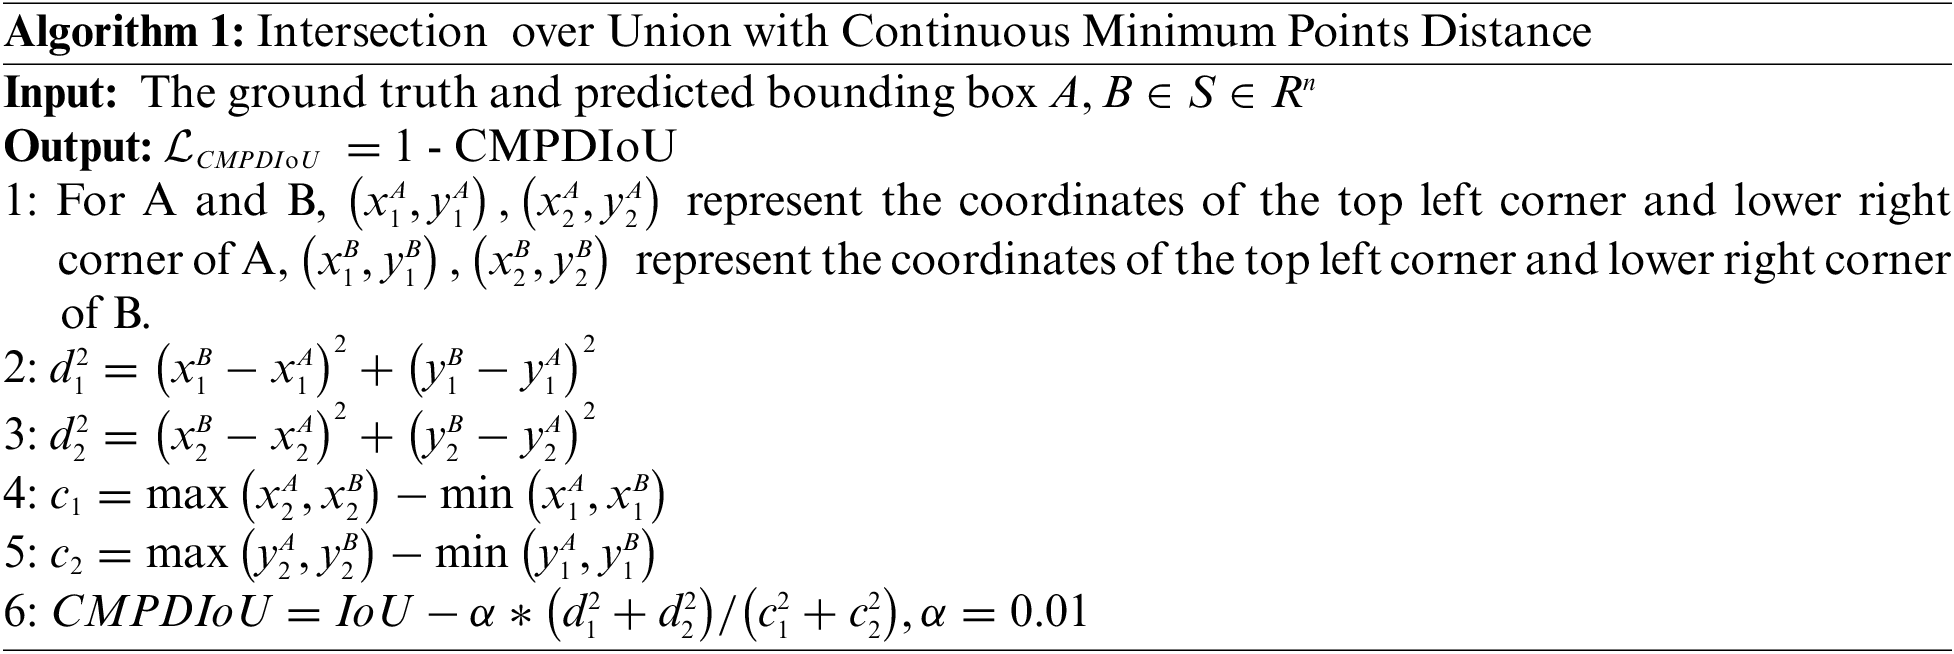
For this type of data, small jitters in the bounding box will cause large loss fluctuations, which will affect the convergence of the network and hurt parameter updates for small targets [29]. In Algorithm 1, when the bounding box and the ground truth box are relatively offset, different intersection situations correspond to different

Taking the YOLOv7 network as the basic model, CMPDIoU shows the best performance in TT100K [30] compared to standard IoU and its advanced IoU.
All algorithms in this article are trained and verified through the TT100K [30] traffic sign data set. The TT100K data set is an open-source traffic sign data jointly published by Tsinghua University and Tencent. The data set contains 42.05% of small targets and 50.1% of medium targets, making it a challenging data set. The data set has a total of 26,349 images in 128 categories with a resolution of 8192 × 2048 pixels, which are then cropped to 2048 × 2048 pixels as the original image for detection. In addition, since the number of images in different categories in this data set is very unevenly distributed, the top 45 categories with the largest number are generally used as training and validation data to balance the sample differences in the data set. After screening, the total data volume is 9738, including 7790 training and verification data and 1948 test sets.
All algorithms in this article follow the evaluation criteria of the COCO data set and mainly use two performance indicators for evaluation: Recall rate and mAP with different thresholds. Precision represents the probability that a positive sample in the prediction result is predicted correctly. The recall rate represents the probability of correct recognition among all positive samples. The formulas for calculating precision and recall are as follows:
TP indicates that the model predicts positive categories as positive, FP indicates that the model predicts negative categories as positive, and FN indicates that the model predicts positive categories as negative.
AP represents the average precision of a single category object, which combines the performance of the model under different precision and recall rates. Corresponding to the area under the PR curve, the Recall value is the horizontal axis and the Precision value is the vertical axis.
mAP averages AP from the category dimension, so it is mostly used to evaluate the performance of multi-classifiers. The formula for calculating mAP is as follows:
It is worth noting that the COCO data set evaluation standards do not distinguish the difference in naming between AP and mAP, and mAP is uniformly called AP. To maintain consistency with the evaluation indicators of other related articles, the evaluation indicators of all algorithms in this article are
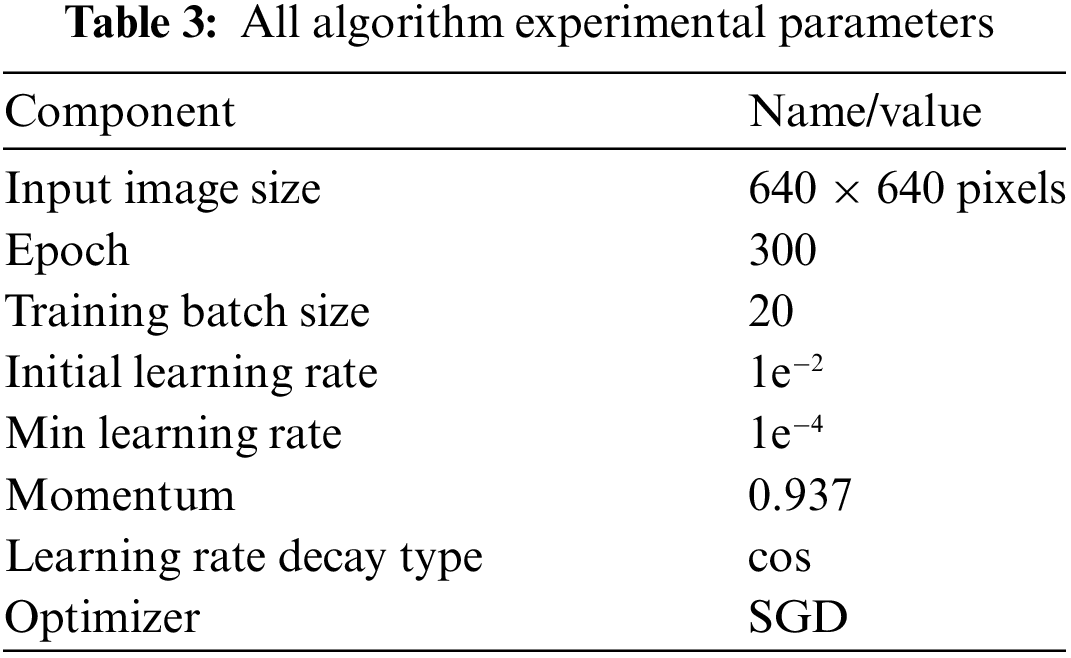
4.3 Experimental Environment and Parameters
All experiments in this article use the Windows 10 system to build the experimental platform on the Pycharm code editor. The system uses Intel i9-13600 CPU@5.60 GHZ, 128 GB RAM, and NVIDIA 4090 GPU with 24 GB of video memory. PyTorch, TensorFlow and Keras are the most prominent deep learning frameworks. In order to maintain consistency with the field of object detection, we choose the PyTorch deep learning framework. The detailed experimental parameters are shown in Table 3 below.
4.4 Experimental Results and Analysis
To demonstrate the positive impact of each improvement on the YOLOv7 traffic sign detection algorithm, we designed a series of ablation experiments. First, a CMPDIoU regression loss function is developed, which can stabilize model convergence and effectively prevent dangerous gradients caused by jitter during medium and small target training. This method leads to an improvement of 0.9% in terms of

To evaluate the detection performance of HFFT-YOLO with existing object detection algorithms, we evaluate various algorithms, including SSD, YOLOv3, YOLOv5, YOLOv7, YOLOv8, and models proposed by Liu et al. [8], Li et al. [9], Xu et al. [11], Wang et al. [12], and Zhao et al. [13]. Table 5 summarizes the evaluation metrics for each network, providing more comprehensive numerical results.
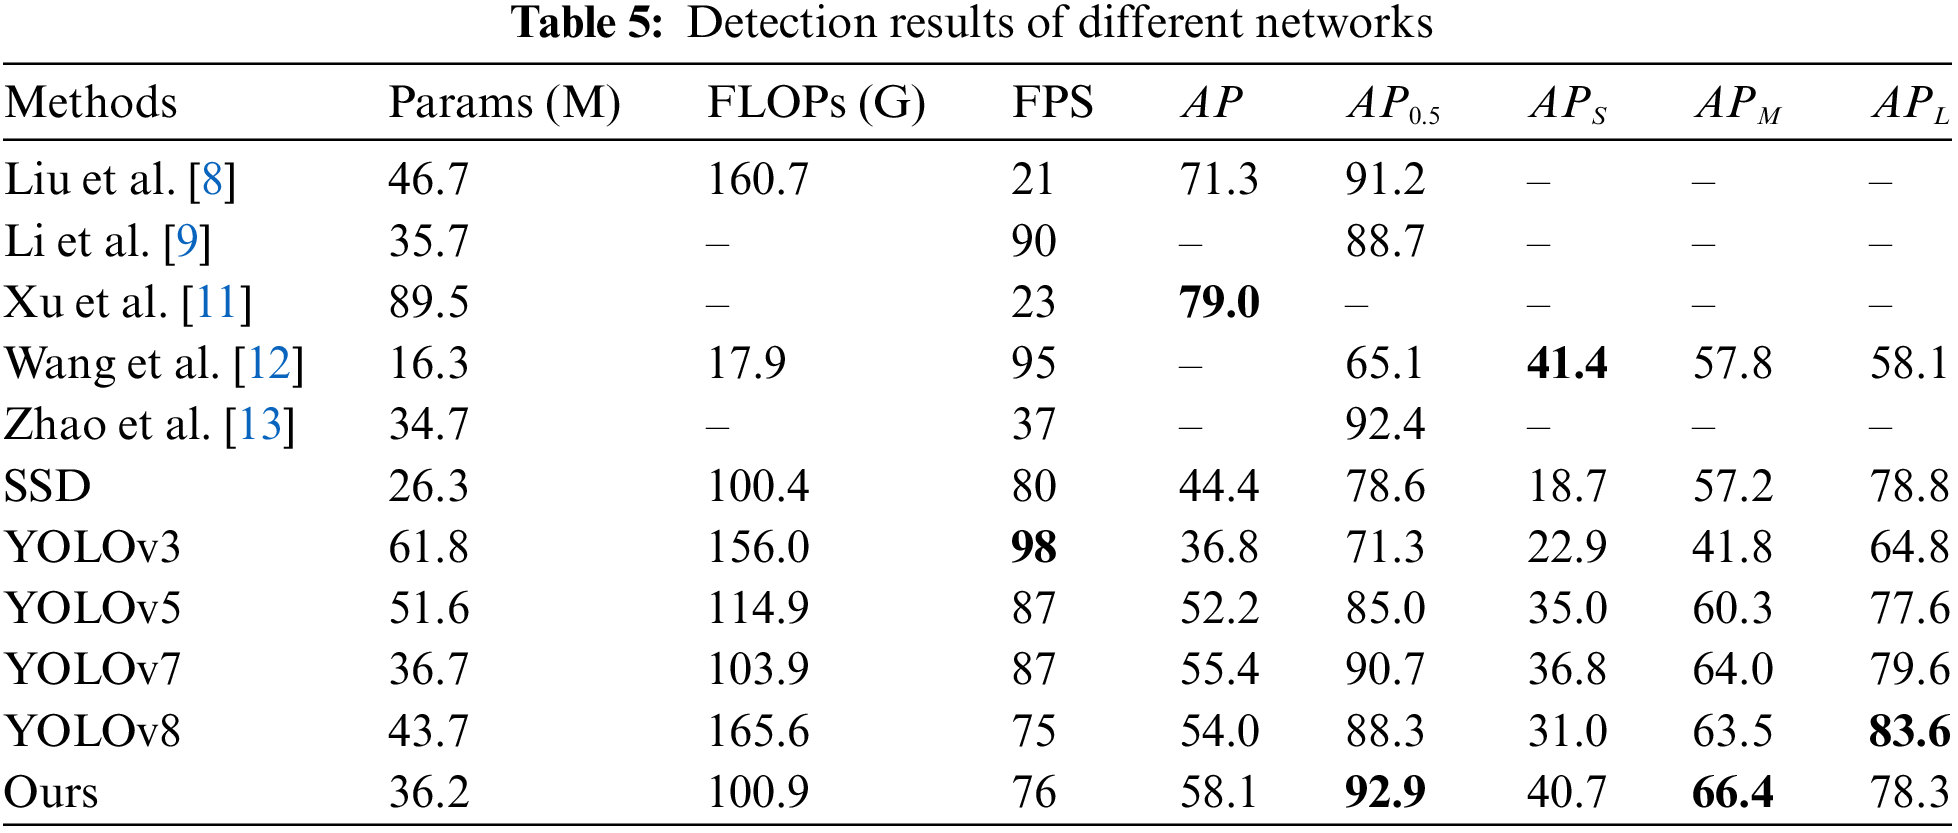
Indeed, from Table 5, it is evident that the proposed HFFT-YOLO model has shown improved performance compared to classical traffic sign detection networks. Compared YOLOv7, the HFFT-YOLO algorithm not only does not increase the number of parameters and computational complexity but also improves AP by 2.2%. In terms of small object detection, the model exhibits varying degrees of improvement compared to the YOLO series algorithms. The most significant improvement is seen in
Fig. 7 shows the comparison between HFFT-YOLO and other networks during the training process. The vertical axis represents the AP value when IOU = 0.5, and the horizontal axis represents the number of training rounds. Because too frequent testing will seriously affect the progress of the experiment, the program is set to save the test results of the current model on the training set every 10 rounds. This figure shows that our model is very smooth throughout the training process, has stronger and faster learning ability in the early stage, and has stable convergence in the later stage. Compared with other models, it achieves better results.
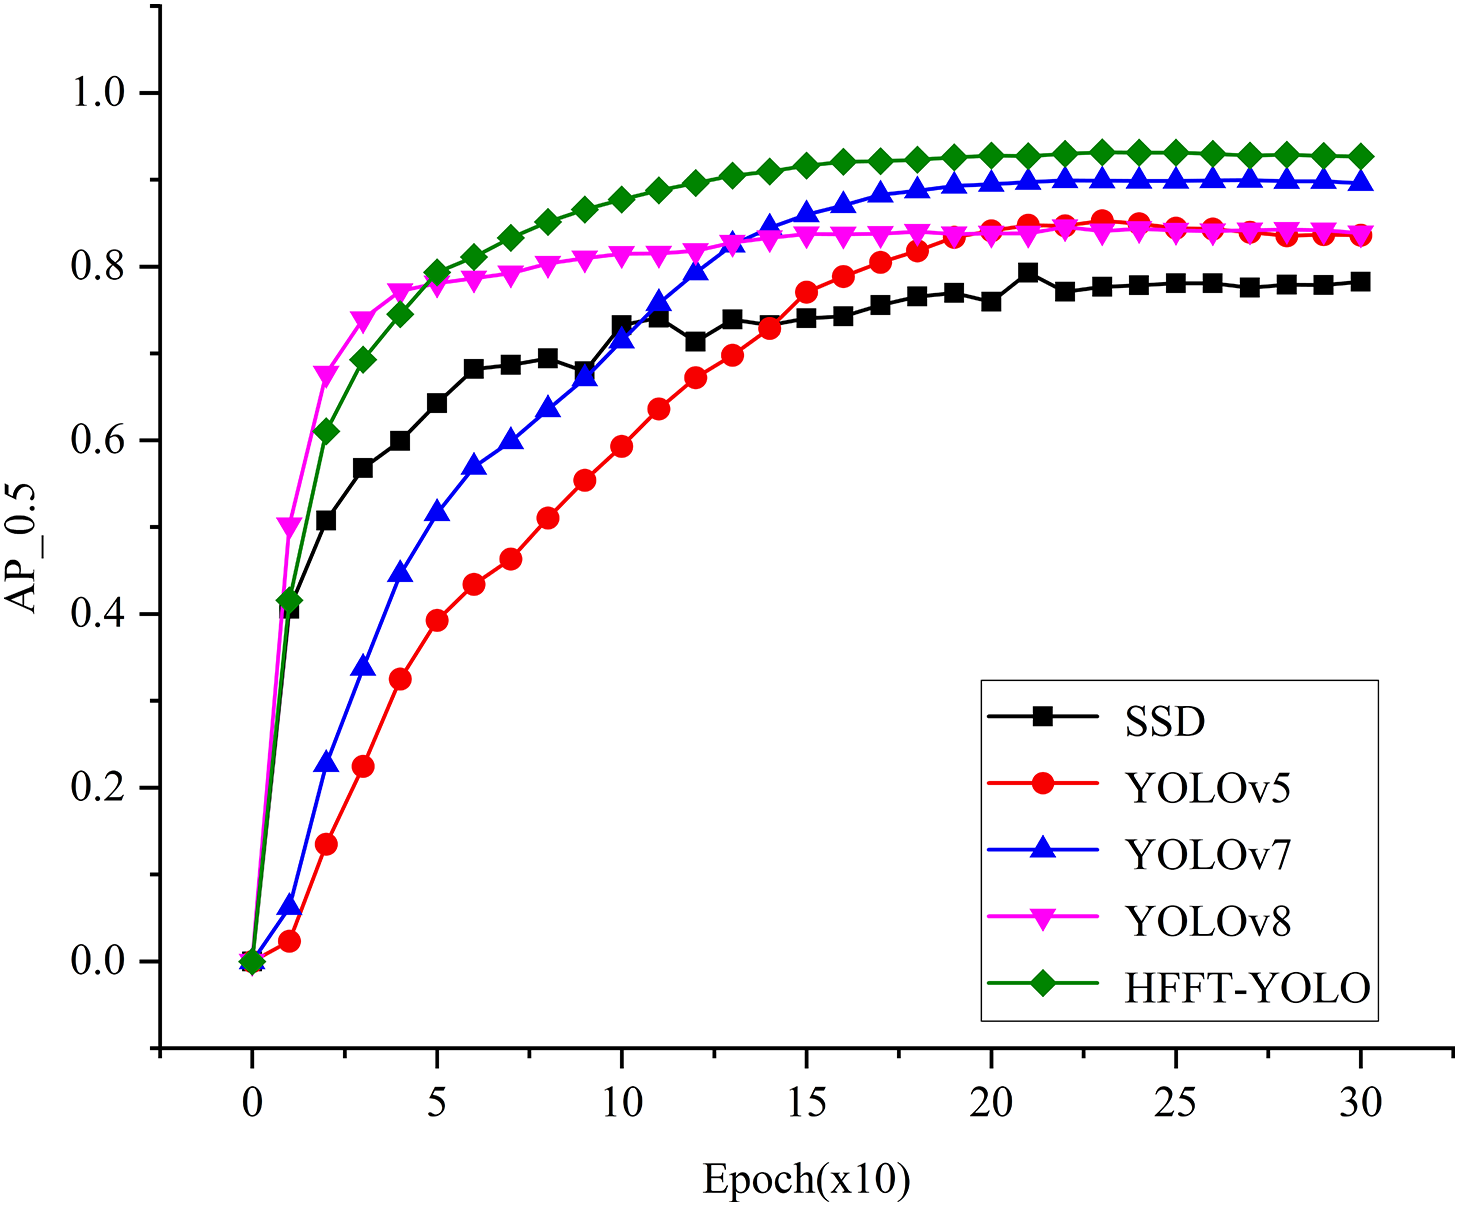
Figure 7: Comparison of AP between HFFT-YOLO and other single-stage networks
By selecting some samples that are difficult for the YOLOv7 network for comparative detection, the comparison results are in Fig. 8. The first row is the inference results of YOLOv7 algorithm, and the second row is HFFT-YOLO. The ground truth from left to right are w59, w59 and p5, p6, w59. What is worth noting is that our algorithm has completed inference for targets that the original algorithm cannot detect.
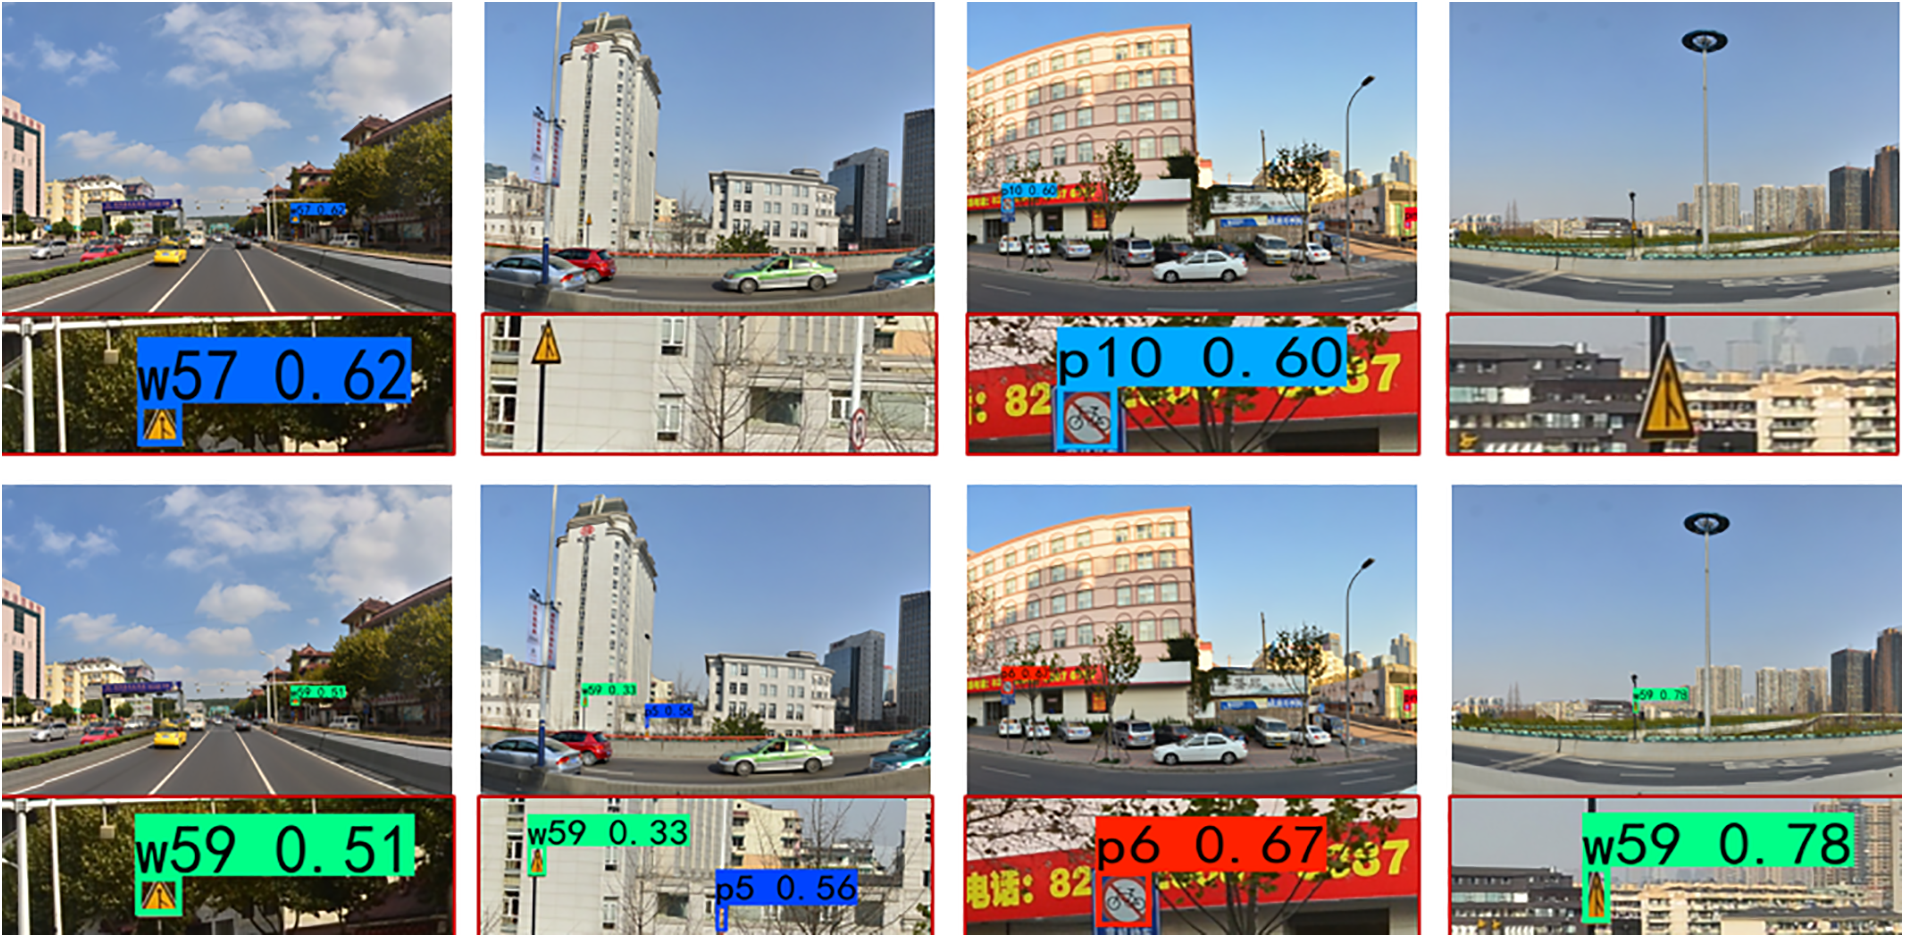
Figure 8: Comparison of YOLOv7 and HFFT-YOLO algorithms
The HFFT-YOLO algorithm shows better accuracy and recall rate on traffic signs, especially the recall ability has been greatly improved. These results provide strong evidence for the reliability and accuracy of our algorithm in practical applications.
In this study, HFFT-YOLO is proposed to improve the application of YOLOv7 in traffic sign detection. First, through B-AIFI, the problem of traditional convolution being limited in the shallow receptive field is improved. Through the unique calculation method of the self-attention mechanism, the feature maps are globally connected and actively promote the positioning ability of the model. Secondly, D-CMFF is introduced to promote information interaction between feature layers through multiple paths through the Fashion module. At the same time, combined with the reuse structure, it deepens the fusion of advanced features and alleviates the problem of missed target detection. In addition, we also designed a series of experiments to find the number and width of channels suitable for traffic sign detection, which reduced a large amount of parameter redundancy and improved calculation efficiency. Finally, a regression loss function
In addition to the above, our work also has certain limitations. Since the hard improvement of deep learning requires more data, the algorithm only considers the traffic sign data of some cities in China and ignores the data of other countries. This makes the algorithm lack generality. In addition, as a real-time detector, the model still has parameter redundancy. Using distillation and pruning techniques to reduce the model and improve its real-time performance so that it can be deployed on small mobile devices is our next research goal.
Acknowledgement: None.
Funding Statement: This study was funded by National Natural Science Foundation of China (Grant No. U2004163).
Author Contributions: Research conceptualization and model building: Bingyi Ren; Experimental data preprocessing: Bingyi Ren, Tong Wang; Experiment design: Bingyi Ren, Juwei Zhang; Manuscript review: Bingyi Ren, Juwei Zhang. All authors reviewed the results and approved the final version of the manuscript.
Availability of Data and Materials: The TT100K dataset can be obtained from https://cg.cs.tsinghua.edu.cn/traffic-sign/ (accessed on 10/05/2024). The code and the outcomes of this study can be obtained from the corresponding authors upon a request.
Conflicts of Interest: The authors declare that they have no conflicts of interest to report regarding the present study.
References
1. A. Vaswabi et al., “Attention is all you need,” Adv. Neural Inf. Process. Syst., vol. 30, pp. 5998–6008, 2017. [Google Scholar]
2. S. Ren, K. He, R. Girshick, and J. Sun, “Faster R-CNN: Towards real-time object detection with region proposal networks,” Adv. Neural Inf. Process. Syst., vol. 28, pp. 1–9, 2015. [Google Scholar]
3. W. Liu et al., “SSD: Single shot multibox detector,” in Comput. Vis.–ECCV 2016: 14th Eur. Con., Amsterdam, The Netherlands, Oct. 11–14, 2016. [Google Scholar]
4. J. Redmon, S. Divvala, R. Girshick, and A. Farhadi, “You only look once: Unified, real-time object detection,” in Comput. Vis. Pattern Recogn. IEEE. Proc. IEEE Conf. Comput. Vis. Pattern Recogn. (CVPR), Las Vegas, USA, 2016, pp. 779–788. [Google Scholar]
5. C. Y. Wang, A. Bochkovskiy, and H. Y. M. Liao, “YOLOv7: Trainable bag-of-freebies sets new state-of-the-art for real-time object detectors,” in Proc. IEEE/CVF Conf. Comput. Vis. Pattern Recognit. (CVPR), Vancouver, Canada, 2023, pp. 7464–7475. [Google Scholar]
6. H. Lai, L. Chen, W. Liu, Z. Yan, and S. Ye, “STC-YOLO: Small object detection network for traffic signs in complex environments,” Sensors, vol. 23, no. 11, Jun. 2023. doi: 10.3390/s23115307. [Google Scholar] [PubMed] [CrossRef]
7. B. Mahaur, K. K. Mishra, and A. Kumar, “An improved lightweight small object detection framework applied to real-time autonomous driving,” Expert. Syst. Appl., vol. 234, Dec. 2023. doi: 10.1016/j.eswa.2023.121036. [Google Scholar] [CrossRef]
8. P. Liu, Z. Xie, and T. Li, “UCN-YOLOv5: Traffic sign target detection algorithm based on deep learning,” IEEE Access, vol. 11, pp. 110039–110050, Nov. 2023. doi: 10.1109/ACCESS.2023.3322371. [Google Scholar] [CrossRef]
9. S. Li, S. Wang, and P. Wang, “A small object detection algorithm for traffic signs based on improved YOLOv7,” Sensors, vol. 23, no. 16, Aug. 2023. doi: 10.3390/s23167145. [Google Scholar] [PubMed] [CrossRef]
10. Y. T. Ting and T. Chao, “Real-time detection network for tiny traffic sign using multi-scale attention module,” Sci. China Technol. Sci., vol. 65, no. 2, pp. 396–406, Feb. 2022. doi: 10.1007/s11431-021-1950-9. [Google Scholar] [CrossRef]
11. J. Xu, Y. Huang, and D. Ying, “Traffic sign detection and recognition using multi-frame embedding of video-log images,” Remote Sens., vol. 15, no. 12, Jun. 2023. doi: 10.3390/rs15122959. [Google Scholar] [CrossRef]
12. J. Wang, Y. Chen, Z. Dong, and M. Gao, “Improved YOLOv5 network for real-time multi-scale traffic sign detection,” Neural Comput. Appl., vol. 35, no. 10, pp. 7853–7865, Apr. 2023. doi: 10.1007/s00521-022-08077-5. [Google Scholar] [CrossRef]
13. S. Zhao, Y. Yuan, X. Wu, Y. Wang, and F. Zhang, “YOLOv7-TS: A traffic sign detection model based on sub-pixel convolution and feature fusion,” Sensors, vol. 24, no. 3, Feb. 2024. doi: 10.3390/s24030989. [Google Scholar] [PubMed] [CrossRef]
14. L. J. Zhang, J. J. Fang, Y. X. Liu, H. F. Le, Z. Q. Rao, and J. X. Zhao, “CR-YOLOv8: Multiscale object detection in traffic sign images,” IEEE Access, vol. 12, pp. 219–228, Dec. 2023. doi: 10.1109/ACCESS.2023.3347352. [Google Scholar] [CrossRef]
15. W. Wei et al., “A lightweight network for traffic sign recognition based on multi-scale feature and attention mechanism,” Heliyon, vol. 10, no. 4, Feb. 2024. doi: 10.1016/j.heliyon.2024.e26182. [Google Scholar] [PubMed] [CrossRef]
16. R. Girshick, J. Donahue, T. Darrell, and J. Malik, “Rich feature hierarchies for accurate object detection and semantic segmentation,” in Proc. IEEE/CVF Conf. Comput. Vis. Pattern Recognit. (CVPR), Columbus, OH, USA, Jun. 23–28, 2014. [Google Scholar]
17. J. Yu, Y. Jiang, Z. Wang, Z. Cao, and T. Huang, “UnitBox: An advanced object detection network,” in Proc. 24th ACM Int. Conf. Multimedia, Amsterdam, Netherlands, 2016, pp. 516–520. [Google Scholar]
18. H. Rezatofighi, N. Tsoi, J. Gwak, A. Sadeghian, I. Reid and S. Savarese, “Generalized intersection over union: A metric and a loss for bounding box regression,” in Proc. IEEE/CVF Conf. Comput. Vis. Pattern Recognit. (CVPR), Long Beach, CA, USA, 2019, pp. 658–666. [Google Scholar]
19. Z. Zheng, P. Wang, W. Liu, J. Li, R. Ye and D. Ren, “Distance-IoU loss: Faster and better learning for bounding box regression,” in Proc. IEEE/CVF Conf. Comput. Vis. Pattern Recognit. (CVPR), 2020, vol. 34, pp. 12993–13000. [Google Scholar]
20. Y. F. Zhang, W. Ren, Z. Zhang, Z. Jia, L. Wang and T. Tan, “Focal and efficient IOU loss for accurate bounding box regression,” Neurocomputing, vol. 506, pp. 146–157, Sep. 2022. doi: 10.1016/j.neucom.2022.07.042. [Google Scholar] [CrossRef]
21. Z. Tong, Y. Chen, Z. Xu, and R. Yu, “Wise-IoU: Bounding box regression loss with dynamic focusing mechanism,” arXiv preprint arXiv:2301.10051, 2023. [Google Scholar]
22. L. Zhu, X. Wang, Z. Ke, W. Zhang, and R. Lau, “BiFormer: Vision transformer with bi-level routing attention,” in Proc. IEEE/CVF Conf. Comput. Vis. Pattern Recognit. (CVPR), Vancouver, BC, Canada, Jun. 17–24, 2023. [Google Scholar]
23. A. Dosovitskiy et al., “An image is worth 16x16 words: Transformers for image recognition at scale,” arXiv preprint arXiv:2020.11929, 2010. [Google Scholar]
24. Z. Niu, G. Zhong, and H. Yu, “A review on the attention mechanism of deep learning,” Neurocomputing, vol. 452, no. 10, pp. 48–62, Mar. 2021. doi: 10.1016/j.neucom.2021.03.091. [Google Scholar] [CrossRef]
25. X. Xu, Y. Jiang, W. Chen, Y. Huang, Y. Zhang, and X. Sun, “DAMO-YOLO: A report on real-time object detection design,” arXiv preprint arXiv:2211.15444, 2022. [Google Scholar]
26. J. Lin et al., “D2ETR: Decoder-only DETR with computationally efficient cross-scale attention,” arXiv preprint arXiv:2203.00860, 2022. [Google Scholar]
27. W. Lv et al., “Detrs beat yolos on real-time object detection,” arXiv preprint arXiv:2304.08069, 2023. [Google Scholar]
28. S. Ma and Y. Xu, “MPDIoU: A loss for efficient and accurate bounding box regression,” arXiv preprint arXiv:2307.07662, 2023. [Google Scholar]
29. J. Wang, C. Xu, W. Yang, and L. Yu, “A normalized Gaussian Wasserstein distance for tiny object detection,” arXiv preprint arXiv:2110.13389, 2021. [Google Scholar]
30. Z. Zhu, D. Liang, S. Zhang, X. Huang, B. Li and S. Hu, “Traffic-sign detection and classification in the wild,” in Proc. IEEE/CVF Conf. Comput. Vis. Pattern Recognit. (CVPR), Las Vegas, NV, USA, 2016, pp. 2110–2118. [Google Scholar]
Cite This Article
 Copyright © 2024 The Author(s). Published by Tech Science Press.
This work is licensed under a Creative Commons Attribution 4.0 International License , which permits unrestricted use, distribution, and reproduction in any medium, provided the original work is properly cited.
 Downloads
 Citation Tools