
 Submit a Paper
 Propose a Special lssue
 Open Access
ARTICLE

YOLO-O2E: A Variant YOLO Model for Anomalous Rail Fastening Detection
1 Department of Computer Science and Engineering, Chongqing University of Technology, Chongqing, 400054, China
2 Institute of Flexible Electronics (Future Technologies), Xiamen University, Xiamen, 361000, China
3 College of Mechanical Engineering, Chongqing University of Technology, Chongqing, 400054, China
* Corresponding Author: Jianxun Zhang. Email:
(This article belongs to the Special Issue: The Latest Deep Learning Architectures for Artificial Intelligence Applications)
Computers, Materials & Continua 2024, 80(1), 1143-1161. https://doi.org/10.32604/cmc.2024.052269
Received 28 March 2024; Accepted 31 May 2024; Issue published 18 July 2024
 View Full Text
 Download PDF
Abstract
Rail fasteners are a crucial component of the railway transportation safety system. These fasteners, distinguished by their high length-to-width ratio, frequently encounter elevated failure rates, necessitating manual inspection and maintenance. Manual inspection not only consumes time but also poses the risk of potential oversights. With the advancement of deep learning technology in rail fasteners, challenges such as the complex background of rail fasteners and the similarity in their states are addressed. We have proposed an efficient and high-precision rail fastener detection algorithm, named YOLO-O2E (you only look once-O2E). Firstly, we propose the EFOV (Enhanced Field of View) structure, aiming to adjust the effective receptive field size of convolutional kernels to enhance insensitivity to small spatial variations. Additionally, The OD_MP (ODConv and MP_2) and EMA (Efficient Multi-Scale Attention) modules mentioned in the algorithm can acquire a wider spectrum of contextual information, enhancing the model’s ability to recognize and locate objectives. Additionally, we collected and prepared the GKA dataset, sourced from real train tracks. Through testing on the GKA dataset and the publicly available NUE-DET dataset, our method outperforms general-purpose object detection algorithms. On the GKA dataset, our model achieved a mAP@0.5 value of 97.6% and a mAP@0.5:0.95 value of 83.9%, demonstrating excellent inference speed. YOLO-O2E is an algorithm for detecting anomalies in railway fasteners that is applicable in practical industrial settings, addressing the industry gap in rail fastener detection.Keywords
The Belt and Road Initiative has made the development of railway safety an imperative, involving the assurance of safe, reliable, and sustainable railway transportation. This holds significant importance in fostering the development of countries and regions along the routes. Railway is also an important means of transportation in people’s lives, and ensuring railway safety is crucial to safeguarding the lives of passengers. As a means of efficient, rapid and mass transportation, railways play a crucial role in economic development [1]. Track fracture and abnormal track fasteners are the two most common causes, which have affected the safety of railway line operation [2].
Rail fasteners are crucial to railway infrastructure, securing rails to sleepers to ensure stability and prevent movement. However, prolonged exposure to adverse weather and friction from train wheels can lead to fastener fractures and anomalies [3]. Therefore, detecting the health status of rail fasteners is indispensable. At present, the detection of railway track lines in our country is mainly assisted by manual inspection or the use of track detection car. However, there are about 6700 fastenings per kilometer of railway transportation in our country. The efficiency of manual inspection is too low, and it is easy to be affected by subjective judgment. However, the track detection car has some shortcomings such as high manufacturing cost and long detection cycle [4]. Hence, developing a rail line detection system leveraging advanced technologies like deep learning is of paramount importance. This endeavor aims to address the deficiencies of current methods, streamline detection processes, enhance the precision in identifying fastener anomalies, and bolster the safety and reliability of railway transportation [5].
Over the past decade, researchers at home and abroad have proposed the use of digital technology and various sensors to detect anomalies in orbit. For example, detection based on vibration signal [6,7], ultrasonic detection [8], acoustic analysis detection [9]. These methods require expensive equipment and require detailed track geometry parameters to help locate the position and state of the fastener, so this method is not popular due to its high cost. With the development of machine learning, many scholars strive to explore its application in the field of track fastener detection. Liu et al. [10] extracted improved edge gradient characteristics and macro-texture characteristics of fasteners, and used image fusion features and Bayesian compressed sensing model to realize automatic recognition of anomalies of track fasteners. Ma et al. [11] proposed a method combining improved Canny edge detection and median filter, and used the curve feature projection template to match the edge profile of fasteners to achieve rapid detection of missing fasteners. Gibert et al. [12,13] proposed a method based on extreme value theory (EVT) and Bayesian framework to show that detection performance can be enhanced across various detectors, and the accuracy of this method in railway track anomaly detection has been improved. In order to address the issue of insufficient abnormal fastener samples, Li et al. [14] generated virtual negative samples of simulated broken fasteners based on normal fastener images. They extracted image features using the HOG feature calculation method and ultimately achieved abnormal fastener detection through a trained SVM classifier. Although the above machine learning detection method has enhanced the detection precision to a certain degree, it still has poor robustness, easy to be affected by the environment, many constraints, a large amount of computation, and low recognition speed due to complex image processing and feature extraction.
In this paper, we attempt to choose the state-of-the-art object detection model YOLOv7 for anomaly detection and apply it to the detection of rail fastening anomalies. Fig. 1 illustrates the entire process of rail fastening anomaly detection. The visual acquisition system introduces mileage-related functionality, allowing users to set and track the mileage of railway vehicles or engineering projects, real-time monitoring of equipment operating status and key milestones achieved, and collection of fastening information. Subsequently, the collected data files in both DAT and XML formats are visualized, and the images are preprocessed. The trained model is then utilized to locate and classify various anomaly categories in the fastening images. In Fig. 1, the rightmost section represents the rail fastening pattern categories predicted by our model, comprising one normal category and four fault mode categories. Finally, the detected fastening anomalies provide maintenance references for railway maintenance personnel.

Figure 1: The overall process of rail fastener anomaly detection
Specifically, the contributions outlined in this paper can be summarized in the following four aspects:
(1) A platform has been established for gathering datasets on rail fastener anomalies, designated as GKA, which encompasses a standardized category of railway fastening datasets. Furthermore, it addresses certain fastening anomaly categories omitted in existing literature, encompassing diverse railway fastening categories across various conditions. Precise manual annotations have been provided through discussions with railway technicians and maintenance personnel.
(2) We propose a Multi-branch Parallel and Enhanced Field of View (EFOV) module, which operates in parallel branches within the EFOV. By extracting features at different scales and utilizing dilated convolutions in the module, the receptive field can be enlarged without increasing network depth and computational load.
(3) In real-world scenarios, rail fastener anomaly detection can be affected by changes in lighting conditions, and the images may experience blurring as the equipment moves. To address this, we propose OD_MP, which incorporates Orthogonal Dynamic Convolution (ODConv) and constructs a parallel four-dimensional attention mechanism. This mechanism refines local fine-grained features in the image, facilitating the extraction of salient features.
(4) Introducing the Efficient Multi-Scale Attention module (EMA) based on cross-space learning, we leverage a cross-space learning approach and design a multi-scale parallel sub-network to establish short and long dependencies. This enhancement aims to improve multi-dimensional perception and multi-scale feature extraction capabilities.
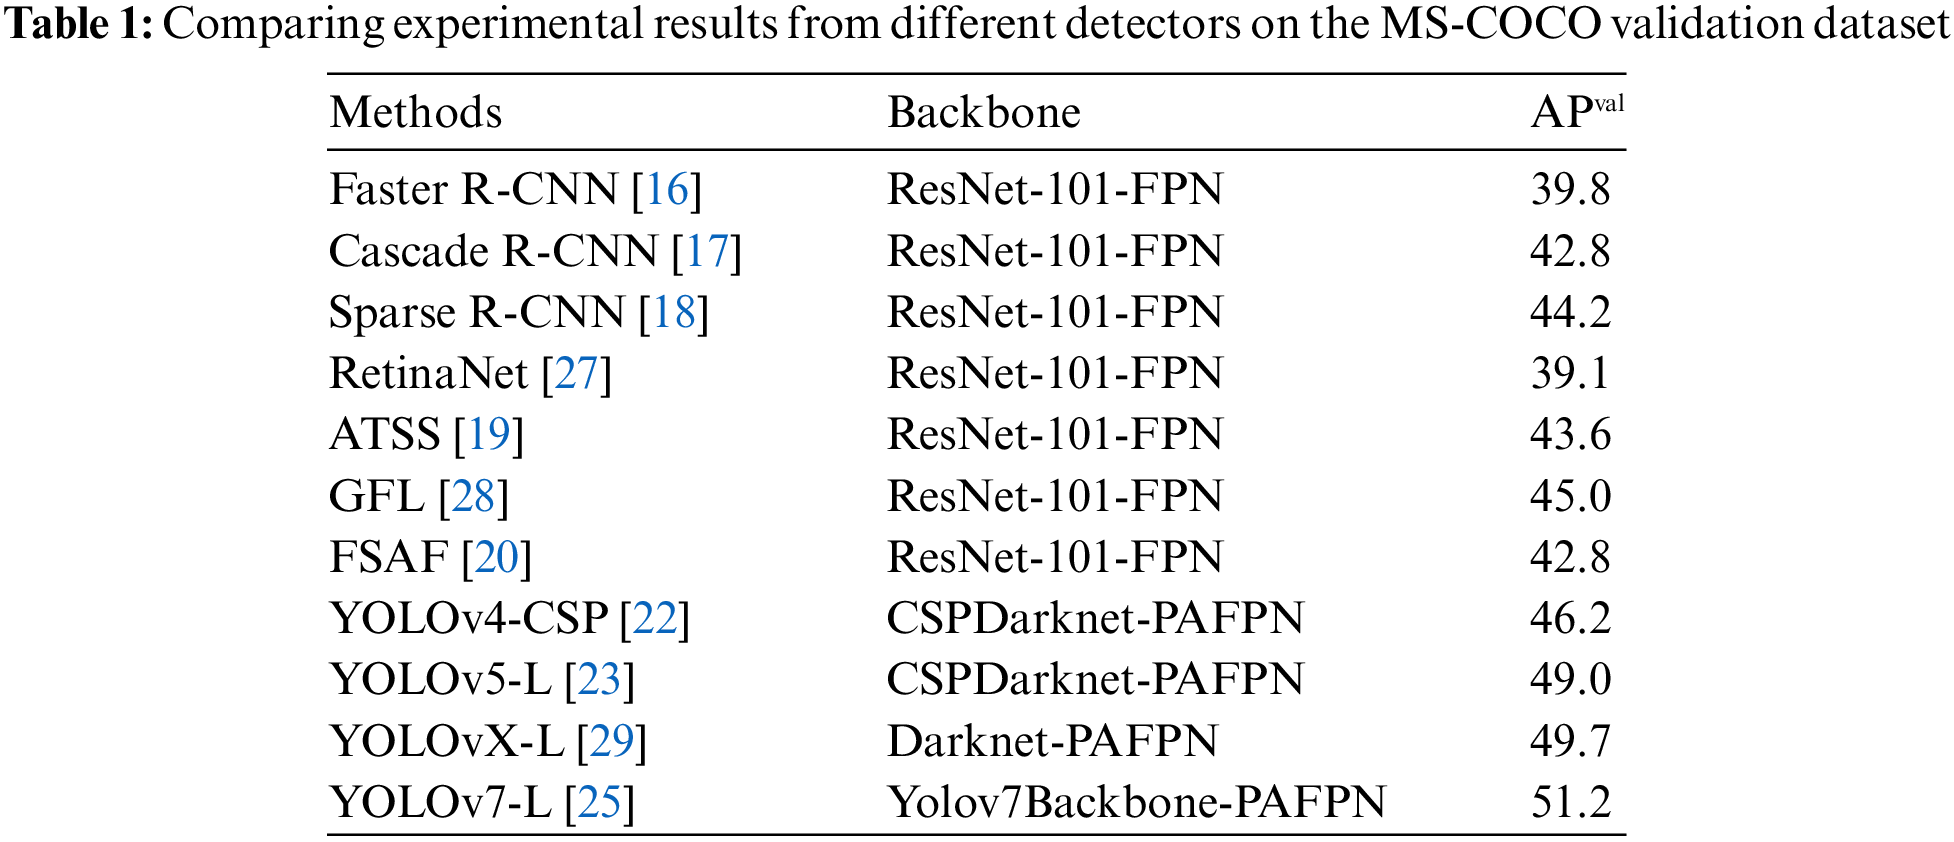
In the contemporary realm of computer vision, fueled by the rapid growth of deep learning and ongoing advancements in computing resources, object detection evaluation metrics have significantly improved. This progress offers robust technical backing for industrial anomaly detection applications. Object detection networks can be classified into two-stage and one-stage [15]. Two-stage object detection networks typically consist of two main stages: The Region Proposal Network (RPN) and the stage of target classification and regression. In contrast, one-stage networks directly complete object detection in a single forward pass without generating candidate regions. For instance, two-stage detection models are more inclined to incorporate R-CNN networks [16–18]. Subsequently, anchor-free detection methods emerged, such as ATSS [19], FSAF [20], CornerNet [21], and others. Models that have appeared in the development history of YOLO, such as [22–25], also dominate the realm of one-stage models. These networks greatly influenced object detection development. Table 1 presents the results from different detectors on the MS-COCO [26] dataset and contrasts their attributes. The table highlights the notably superior performance of one-stage models.
The YOLO series has seen rapid development since YOLOv3. Initially, YOLOv4 and YOLOv5 emerged as successors to YOLOv3, all developed based on the Darknet framework. YOLOv4 employs the CSPDarknet53 [30] backbone, enhancing the expressive power of the backbone network. Additionally, the model’s Neck section utilizes PANet [31] for feature fusion, enhancing the top-down pathway and facilitating the propagation of low-level spatial information to the top. It utilizes three detection heads to predict targets at multiple scales. YOLOv5 shares a similar overall framework with YOLOv4, but differs in the backbone part, incorporating the Focus structure. Both models adopt an Anchor-Based approach to extract target boxes. After YOLOv5, there have been more iterative versions, such as YOLOX and YOLOv7. YOLOX introduces the anchor-free approach into the YOLO series, and after replacing the previous Coupled head with Decoupled Head, the model’s expressive power is further improved. In 2022, the team led by Alexey Bochkovskiy introduced the forefront YOLOv7 for object detection. This anchor-based algorithm is characterized by its lightweight and high-speed features, resulting in improved performance. Consequently, it is well-suited for industrial anomaly detection.
The rapid development of target detection has propelled advancements in railway track detection technology, with many deep learning methods being applied to the abnormal detection of railway track fasteners. This field has shifted from traditional visual methods to deep learning approaches, leading to the emergence of representative models for rail fastening anomaly detection [32]. Wei et al. [1] introduced an innovative and intelligent method using image processing technology and deep learning network to realize automatic detection of fastener anomalies on the railway track bed, thus significantly improving railway safety. Faster R-CNN [16] is used to detect fastener anomalies to improve the detection speed and efficiency. However, Faster R-CNN, as a two-stage detection model based on anchor frames, has complex structure and slow positioning speed, rendering it unsuitable for meeting real-time requirements. Aydin et al. [33] proposed to combine the features of MobileNetV2 [34] and SqueezeNet [35] to achieve a compromise between computational efficiency and accuracy. However, this method may still have some difficulties in detecting the noise, low contrast and uneven density of the track surface. Wei et al. [4] introduced an improved YOLOv3 [36] model TLMDDNet, and used DenseNet [37] to optimize the feature extraction of the backbone in TLMDDNet model. While accuracy has been appropriately improved, there is still potential for enhancement in both accuracy and speed. This study can be considered the first application of the YOLO series algorithm in the field of anomaly recognition of track fasteners.
The YOLO series models have gradually gained traction and innovation in computer vision, but have been scarcely seen in the field of railway fastening components. Therefore, we conducted a comprehensive comparison of the evaluation metrics of the YOLO series and selected YOLOv7 as the most suitable model for improvement. Addressing the characteristics and challenges of the GKA dataset, we proposed YOLO-O2E. It can be effortlessly integrated into track inspection vehicle systems for real-time object detection, surpassing cutting-edge models in identifying anomalies in rail fastenings.
We use YOLOv7 as the base model, which is an advanced one-stage deep learning detector, achieving a good balance of accuracy and speed. To enhance the practical performance of YOLOv7 in rail fastening anomaly detection, three improvements to YOLOv7 are introduced: EFOV Block, OD_MP, and EMA. Based on these enhancements, we propose YOLO-O2E, and its overall structure is depicted in Fig. 2.

Figure 2: The structure diagram of YOLO-O2E we designed, where EFOV Block, OD_MP and EMA are detailed in the “Multi-branch Parallel and Enhanced Field of View”, “OD_MP” and “EMA Attention Mechanism” module, respectively
YOLO-O2E consists of three main components: Backbone, Neck, and Head. The feature extraction stage of the backbone comprises four CBS, one ELAN Block, three MP-1, and three EFOV Blocks. In the backbone structure, we introduce a Multi-branch Parallel Enhanced Field of View module (EFOV) to enhance the performance of feature extraction. The area between the backbone and the prediction is where the improved OD_MP is integrated into the feature pyramid fusion stage. After three ELAN Block layers, EMA attention is merged, aiming to enhance various features to enhance robustness and learning performance of the model. Ultimately, various-scale features produced by the Neck structure are inputted into the original head detection layer for regression and classification procedures.
3.2 Multi-Branch Parallel and Enhanced Field of View Module (EFOV)
In the category of rail fastening component anomalies, regions with lower anomaly severity occupy fewer pixels, resulting in fewer extractable features and lower detection accuracy. However, the information carried by feature points near the target center is crucial for the detection results. For feature maps, each neuron captures a different receptive field area, and there is overlap between receptive field areas. Moreover, elements closer to the center are scanned more frequently, resulting in more overlap of receptive fields. As the depth of convolutional neural networks increases, the receptive fields on neurons become larger, meaning that neurons carry more information. At the feature extraction network of the Backbone, we introduce an improved Multi-branch Parallel Enhanced Field of View module (EFOV). This module employs convolutional kernels of different sizes to capture features from the feature map, further improving the network’s ability to fuse features. The EFOV module serves to enlarge the receptive field, concentrating more information about fastening component anomalies in the center of the receptive field, allowing the features of fastening component anomalies to be better refined by the network. This allows for better categorization and differentiation of defective rail fastenings with similar features.
The proposed EFOV, inspired by the Receptive Field Block (RFB) [38] in Fig. 3, simulates the receptive field of human vision. It utilizes a multi-branch structure and introduces dilated convolutions. Different scales of conventional and dilated convolutions are applied in the multi-branch structure to enlarge the effective receptive field area of the feature map, enhancing feature resolution capability. As shown in Fig. 4, the designed EFOV structure starts by reducing the number of channels using a 1 × 1 convolution. The three middle branches of the original structure undergo three convolutional layers with kernel sizes of 1, 3, and 5, respectively. We modify the 5 × 5 convolutional kernel in the branch with a rate of 5 to two stacked 3 × 3 convolutions, simulating perception fields at different scales and reducing the parameter count. The tail end employs dilated convolutions to replicate the correlation between receptive field size and eccentricity observed within the human visual system. Different dilation factors are employed to simulate this relationship. By simulating the human eye’s sensitivity to the central region, we adjust the effective receptive field size of the convolutional kernel to improve insensitivity to small spatial changes. In Fig. 4, the EFOV structure’s upper part demonstrates the expansion of the receptive field of feature maps without losing image information, where zero values are inserted into the middle of the convolution kernel. Fig. 4a is a common 3 × 3 convolution. As shown in Fig. 4b,c, the 5 × 5 zero convolution is essentially a 3 × 3 convolution with the addition of 2 zero values in the middle. Similarly, the 7 × 7 zero convolution is essentially a 3 × 3 convolution with the addition of 4 zero values in the middle. This enlarges the perceptual range, but during actual training, the parameters are the same as those in a 3 × 3 convolution. A residual branch is added on the far left to concatenate the input features directly with the receptive fields obtained at three eccentricities, ensuring comprehensive fusion and preventing feature loss or distortion, thus enhancing network performance and convergence speed. On the far right is an efficient aggregation network structure that fuses features from different hierarchies, effectively utilizing semantic information at different levels to improve the model’s capacity for feature representation. Finally, the branches are concatenated and the quantity of channels is modified using a 1 × 1 convolution.
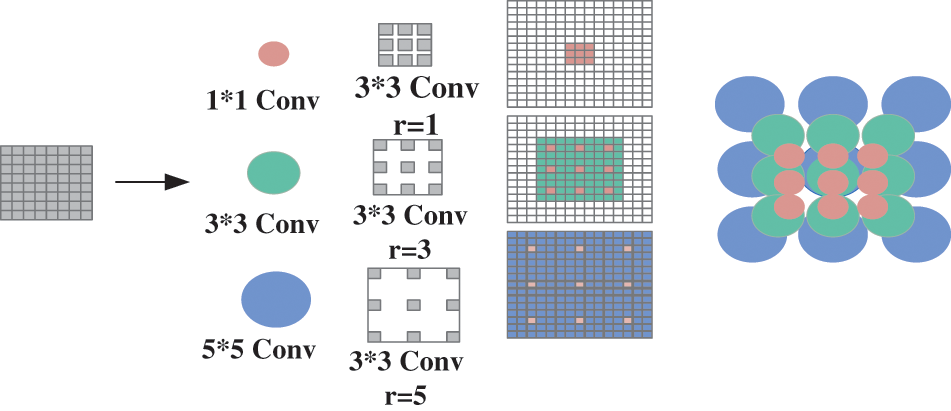
Figure 3: Schematic diagram of feature extraction of perceptual field module

Figure 4: EFOV architecture
In railway fastening component images, well-lit and clear normal fastening components typically dominate the feature learning process compared to blurry images and components with low lighting conditions. This makes it difficult to detect some low-quality fastening components.
In most cases, images typically boast high resolution, allowing the model to effectively learn features by skipping redundant pixel information when capturing visual features of targets in the feature pyramid. However, in rail fastening component anomaly detection, the assumption of skipping redundant information is no longer valid due to the characteristics of blurry images and dim lighting, leading to the loss of fine-grained information and inadequate feature learning outcomes. To address this issue, we introduce the OD_MP module, which can downsample while preserving learnable information within the feature maps.
We introduce an Orthogonal Dynamic Convolution (ODConv) proposed by Li et al. [39], as an embedded design that can replace many regular convolutions in CNN architectures. It enhances the ability of dynamic convolution to capture rich contextual clues in terms of spatial dimensions, input channel numbers, and output channel numbers for each convolutional kernel. Compared to existing dynamic convolution designs, it achieves a more optimal balance model accuracy and efficiency. In ODConv, as shown in Fig. 5, (a) allocates varying attention values αsi to the convolutional parameters at the K * K spatial positions for the convolution kernel Wi; (b) allocates varying attention values αci to handle convolution kernels for different input channels; (c) allocates varying attention values αfi to handle convolution kernels for different output channels, and (d) assigns different attention values αwi to handle n overall convolutional kernels. According to Eq. (1), ODConv can be defined as:

Figure 5: Progressive fusion of four attention mechanisms with convolutional kernels in ODConv
In the formula, X embodies input features, and Y embodies output features. αwi ∈ R represents the attention vector of the convolutional kernel Wi, αsi ∈ Rk×k, αci ∈ RCin, αfi ∈ RCout represent the attention vectors along the spatial dimension of the kernel space, the input channel dimension, and the output channel dimension of the convolutional kernel Wi, respectively. ⊙ denotes element-wise multiplication of attention vectors along different dimensions of the convolutional kernel Wi, and ∗ represents convolution operation.
In the Neck, the MP-2 module has two branches, as shown in Fig. 6a, with the purpose of downsampling. The first branch undergoes downsampling through a max-pooling operation, followed by a 1 × 1 convolution to modify the channel quantity. The second branch performs channel adjustment with a 1 × 1 convolution, followed by downsampling using a 3 × 3 convolution with a stride of 2. Finally, the results of the first and second branches are added together to achieve super downsampling. In Fig. 6b, the ODConv module replaces the normal 1 × 1 convolution in the bottom right part of the MP-2 module. Utilizing the multidimensional attention mechanism of ODConv, attention is learned across multiple dimensions of the convolutional kernel space, allowing the model to capture a broader context and enhance expressive power. ODConv is also employed to replace the normal 3 × 3 convolution in the MP-2 module, further diminishing the model’s computational complexity and mitigating memory access burden. This improved module is referred to as OD_MP, as illustrated in Fig. 6c. By integrating this module, we can improve the ability to extract features for dark and low-quality fastening components, further improving the model’s detection accuracy.

Figure 6: The composition of OD_MP (ODConv + MP-2) module in the Neck network: (a) The composition diagram of the MP-2 module, (b) the architectural diagram of the lightweight ODConv module, and (c) the architectural diagram of the OD_MP module designed in this work,which is the integration of MP-2 and ODConv modules
3.4 Efficient Multiscale Attention Mechanism (EMA)
Attention mechanisms play a pivotal role in the realm of computer vision by capturing locally important information, enabling models to focus on relevant features for target detection. EMA (Efficient Multiscale Attention) [40] is an efficient multiscale attention mechanism that reshapes certain channels into the batch dimension, preventing channel reduction. When fastening components appear blurred or indistinguishable due to lighting conditions, there is a high level of uncertainty in target boundaries, which can interfere with localization performance. By adding EMA attention before the number of channels in the final outputs P3, P4, and P5, the center of the target becomes more certain, facilitating the distinction between foreground and background. The EMA mechanism structure is illustrated in Fig. 7.

Figure 7: Depiction of our proposed EMA. Here, “g” means the divided groups, “X Avg Pool” embodies the 1D lateral global pooling and “Y Avg Pool” signifies the 1D vertical global pooling, respectively
In the diagram, for the input feature X ∈ RC×H×W, EMA divides it into G sub-features based on the number of channels to learn different semantic information. The input feature X is represented as X = [X0, X1,
Here, Zc is the pooling result on channel c, and H and W are the height and width of the input feature map, respectively. xc(i, j) represents the value of channel c at position (i, j) in the input feature map. Finally, a non-linear softmax function is applied to fit the linear transformation. The outputs of the three branches are computed by combining the two spatial attention weight values. The Sigmoid activation function is used to highlight the contextual pixels for each pixels. The final output is of the same dimension as the input feature map X ∈ RC×H×W.
This paper chooses to integrate the EMA module at the end of the three outputs from the Neck, effectively establishing short-term and long-term dependencies. This contributes to the model capturing spatial and temporal information of the target at different scales, enhancing the model’s capability for target recognition and localization. Moreover,the attention mechanism in the EMA module helps the neck focus on important feature channels, enabling it to adapt better to targets at various scales and low resolutions. Through multidimensional interactions, EMA enhances the representational capability of the feature pyramid, improving the model’s robustness.
We implemented our network on the PyTorch framework, a widely-used deep learning library. Our training strategy follows a similar approach to YOLOv7, utilizing stochastic gradient descent with cosine annealing learning rate decay. During training of YOLO-O2E, we employed the Adam optimizer with a preset learning rate of 0.01. The input image size was set to 640 × 640. All experiments were conducted under consistent conditions with a predetermined quantity of training epochs set to 100. Considering memory utilization, we used a batch size of 16.
To achieve high-speed image acquisition of railway fasteners, the image acquisition system used in this paper is illustrated in Fig. 8. The system comprises a data collection module, a trigger module, and an industrial computer, all mounted on a detection vehicle. The data collection module consists of an industrial camera, a structured light laser, and an inertial navigation unit. It employs the camera to capture the projection of structured light on the object, acquiring laser reflection intensity and object contour information. To enhance data accuracy and reliability, an inertial navigation unit is introduced for calibrating the collected data. The trigger module includes an encoder and a signal trigger distributor. The encoder generates signals as the vehicle travels a fixed distance, transmitting them to the distributor to trigger camera capture. The encoder generates signals 10 times for every 1 mm of forward movement, and the data is collected every 10 signals, as set based on the detection requirements. The industrial computer is responsible for controlling the start and stop of the detection process, storing collected data, and performing post-processing and analysis.
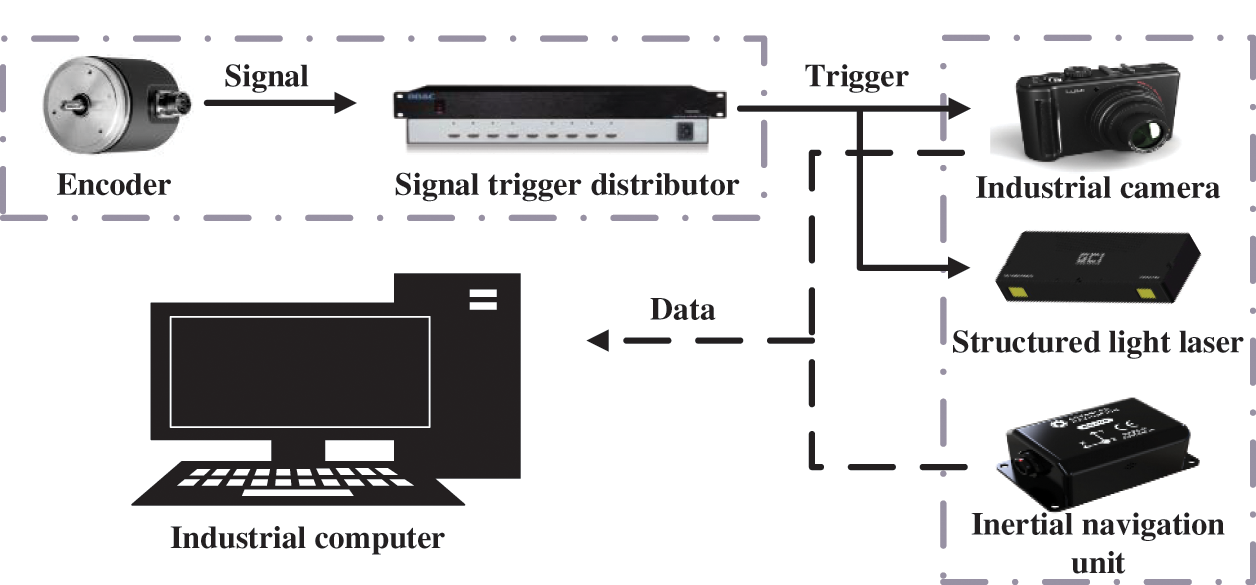
Figure 8: Sketch of image acquisition system
The collected data is in DAT format and is accompanied by an XML format data description file. By reading the data description file, images of railway fasteners of various sizes can be obtained. To achieve better detection results, certain sections of the rail are preconfigured with Deficiency, Displacement, Snap, and Skew of rail fasteners.
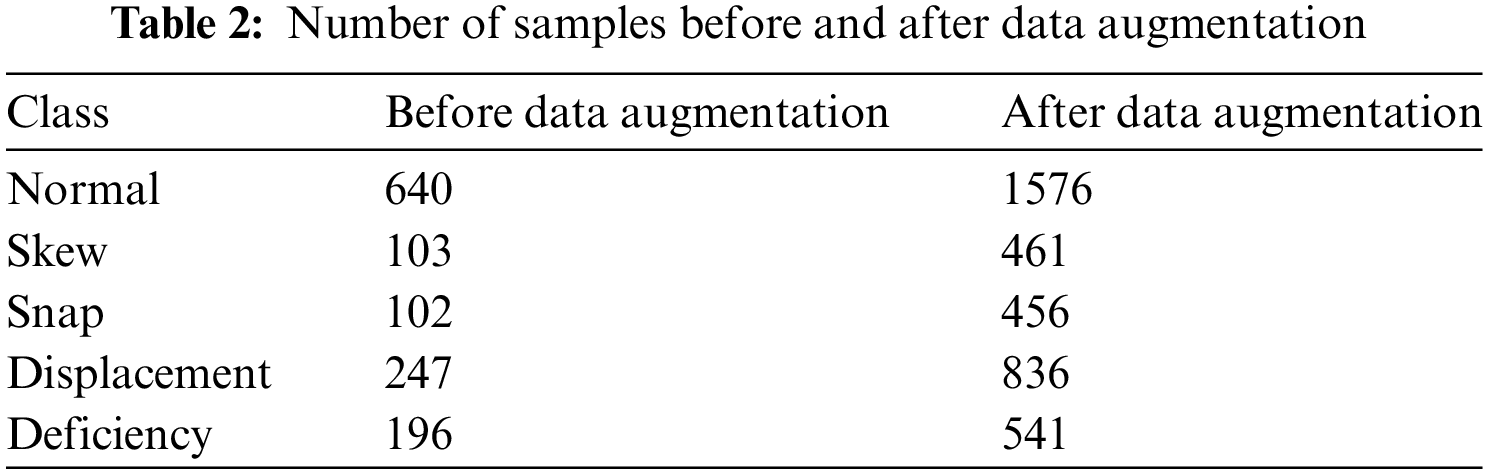
We have filtered through a set of images captured continuously by a rail vehicle. The images have been stitched to create compositions containing various types of fasteners. In total, there are 1288 images. An analysis of the dataset revealed several issues: there is significant noise, uneven lighting, and image blurring in images captured during rapid movement of railway vehicles. Additionally, sample labels in the railway fastener dataset often exhibit imbalances, with the “normal” category representing more than 50% of the overall label distribution. In response to these challenges, we applied data augmentation techniques to the dataset, including horizontal flipping, random brightness adjustments, random occlusion, and motion blur algorithms. The types of data augmentation are illustrated in Fig. 9. By applying the above-mentioned algorithms for augmentation, we obtained a dataset comprising 3870 images, including authentic photographs. We named the final dataset ‘GKA’. Subsequently, we partitioned the dataset, allocating 75% for training, 12.5% for validation, and another 12.5% designated for testing purposes. Table 2 provides a statistical comparison of the fastener categories before and after data augmentation.

Figure 9: (a) The obtained image via the image acquisition system. (b) Data augmentation
For the annotation of GKA, we have consistently followed the format of YOLO. To conduct a thorough and impartial evaluation of the model’s performance in this paper, we use precision (PR), recall (RE), and mAP as evaluation metrics. Precision (PR) measures the true positives among all samples predicted as positive, providing an indicator of the model’s accuracy, as shown in Eq. (3). Recall (RE) gauges the proportion of actual positives successfully predicted as positive by the model. This metric relates to the model’s coverage of positives, i.e., how many positives the model captures without missing, as expressed in Eq. (4). Average Precision (AP) refers to the area beneath the Precision-Recall curve, while mAP denotes the mean of AP across all classes, as defined in Eq. (5).
In the above formulas, TP, FP, and FN represent true positives (correctly predicted positive samples), false positives (incorrectly predicted positive samples), and false negatives (correctly predicted negative samples), respectively. In the domain of object detection, mAP@0.5 and mAP@0.5:0.95 are two crucial metrics for evaluating the performance of object detection models, measuring the accuracy of the model under different conditions. When assessing object detection performance, the Intersection over Union (IoU) between predicted bounding boxes and ground truth boxes is commonly used as a criterion. mAP@0.5 calculates the mAP considering detection results with an IoU greater than or equal to 0.5 as correct, while mAP@0.5:0.95 considers a range of IoU thresholds from 0.5 to 0.95, computing the model’s average precision.
FLOPs refers to the number of floating-point operations and is used to measure the computational complexity of a model. Params represents the sum of all parameters in a trained model and serves as an indicator of the model’s scale. The calculation method for FLOPs is outlined in Eq. (6), while the calculation method for Params is provided in Eq. (7).
Here, H × W denotes the size of the input feature map. Cin and Cout represent the channel numbers of the input and output feature maps, respectively, measured in quantity. K indicates the size of the convolution kernel.
4.3 Experimental Comparison with Other Models
4.3.1 Experimental Verification Based on GKA
To validate the effectiveness and superiority of our proposed YOLO-O2E detection method, we conducted comparative experiments on the GKA dataset against current relatively lightweight YOLO series models. To guarantee a fair comparison, we trained all models from scratch without any pre-training and tested their runtime on an RTX 3060 Ti. We conducted training and evaluation of YOLOv4, YOLOv5, YOLOX, and YOLOv7 using the GKA dataset, juxtaposing their empirical results against those of our proposed model.
By comparing the results in Table 3, although our proposed model has a higher parameter count than models such as YOLOv5 and YOLOX, it is significantly lower than YOLOv4. Moreover, it outperforms other models in terms of mAP@0.5 and mAP@0.5:0.95. Simultaneously, our proposed YOLO-O2E model achieves an inference time of 27.3 ms, which can be considered at an advanced level. YOLOv4 demonstrates the lowest overall performance on the GKA dataset. YOLOv5, currently the most widely used network, still has room for improvement in both detection accuracy and speed compared to the network proposed in this paper. YOLOX, an Anchor-free object detection model, demonstrates excellent overall performance but when compared to YOLO-O2E, it has certain limitations in various aspects, except for the parameter count, where it stands out. The results are shown in Fig. 10. From the graph, we can observe the comparative performance of these models. Our model exhibits superior performance in terms of Precision, Recall, and loss, among other metrics.
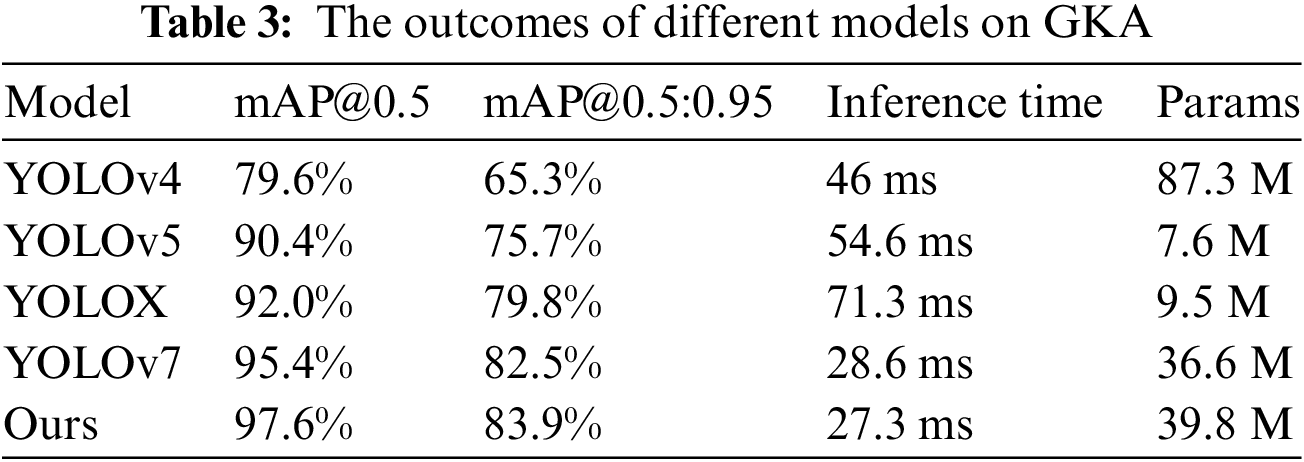

Figure 10: The performance of GKA across various models
4.3.2 Comparison and Discussion of Current Object Detection Models
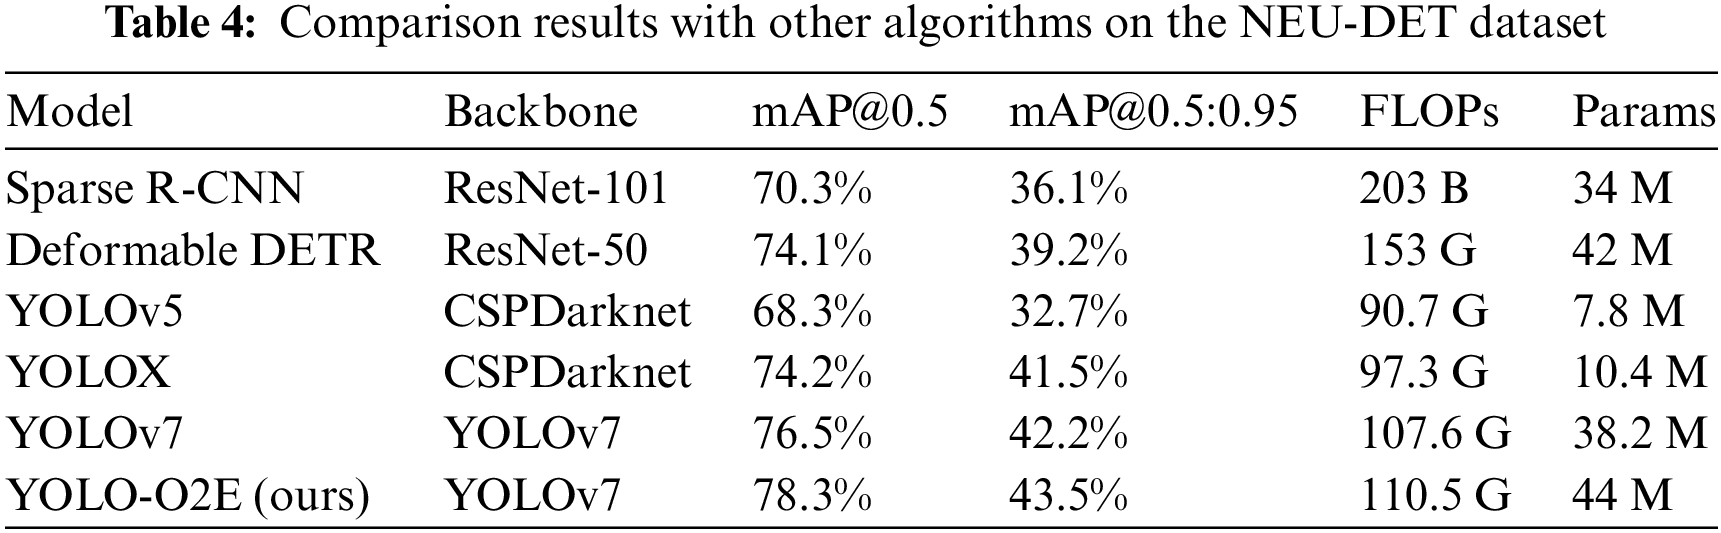
To further assess the model’s robustness, We performed precision evaluations, comparing our model with contemporary mainstream object detection models using the NEU-DET dataset. NEU-DET is a publicly available dataset for surface defect detection, comprising 1800 grayscale images featuring six distinct types of typical surface defects. We allocated 75% of the dataset for training and 25% for validation.
While models like Sparse R-CNN, Deformable DETR, and YOLOv7 have comparable Params to our model, their performance in terms of accuracy is inferior, as indicated in Table 4. YOLOv5, with relatively fewer Params, yields the poorest results. Our algorithm outperforms Deformable DETR by a substantial margin in FLOPs metrics. It is important to highlight that our proposed model achieves notably higher mAP@0.5 and mAP@0.5:0.95 in contrast to Sparse R-CNN, Deformable DETR, YOLOv5, and YOLOX. Furthermore, when compared to YOLOv7, despite respective increases of 5.8 and 2.9 GFLOPs in parameter count and model computation, our model realizes improvements of 1.8% and 1.3% in mAP@0.5 and mAP@0.5:0.95 metrics, demonstrating its outstanding performance.
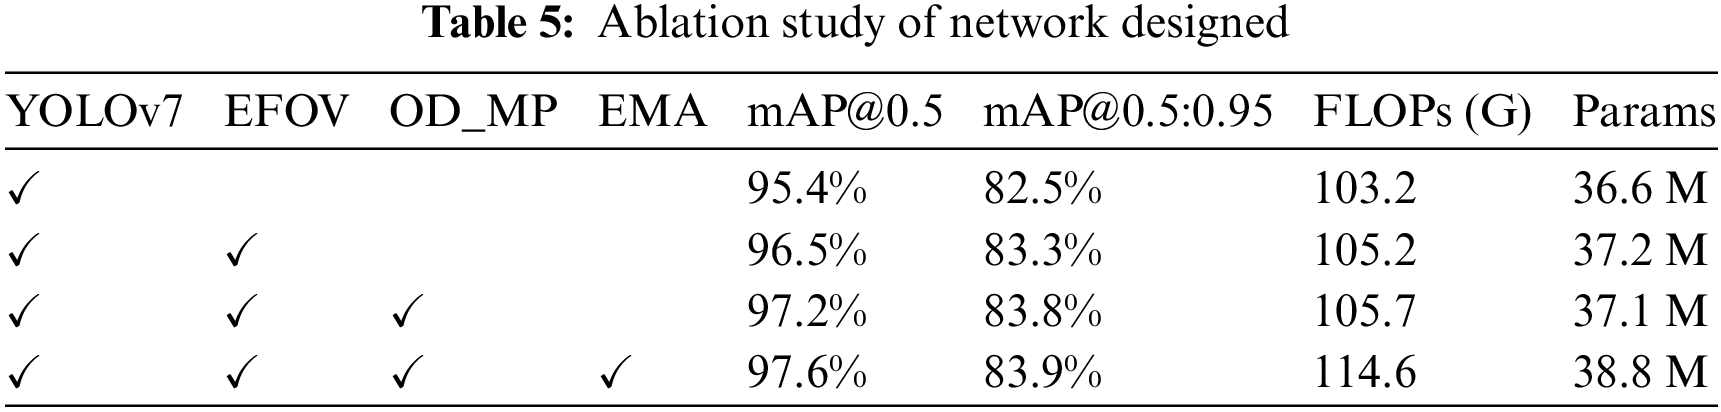
In this article, we introduce a new object detection model, YOLO-O2E. To validate the effectiveness of this model on the GKA dataset, YOLOv7 is taken as the baseline. Iterative improvements are made based on the methods described in the paper, sequentially incorporating the enhanced EFOV module, OD_MP module, and attention-enhanced EMA. The final aggregated model is our proposed one. The ablation study results on the dismantled networks are presented in Table 5. After integrating the proposed EFOV structure into the base model, mAP@0.5 improved by 1.1%, mAP@0.5:0.95 increased by 0.8%, with a slight increase in parameter count and GFLOPs. This is because the EFOV module, replacing the original ELAN, introduces additional channels, requiring some computational overhead. Subsequently, incorporating the proposed OD_MP module resulted in a further increase of 0.7% in mAP@0.5, and 0.5% in mAP@0.5:0.95, with a slight reduction in parameter count compared to when the EFOV module was added, and a negligible increase in GFLOPs. This suggests that the module enhances accuracy while maintaining model lightweight. Introducing EMA led to an additional improvement of 0.4% in mAP@0.5 and 0.1% in mAP@0.5:0.95, with corresponding slight increases in parameter count and GFLOPs. Compared to the baseline YOLOv7, our proposed model achieved a 2.2% improvement in mAP@0.5, a 1.4% improvement in mAP@0.5:0.95, with negligible increases in parameter count and GFLOPs.
Meanwhile, we have compiled the mAP for all types of rail fastener detections in different improved models, as shown in Table 6. The mAP for Normal, Skew, Snap, Displacement, and Deficiency has been enhanced in our proposed model. Particularly, in the Baseline, the mAP for Skew and Displacement types is relatively low. However, with the inclusion of the EFOV module, there is a significant increase in mAP. One major reason is the similarity in the states of Skew and Displacement types, making it relatively challenging for the original model to discern. The introduction of the improvement module enables the model to identify them more clearly. Fig. 11 compares the impact of the standard model YOLOv7 and YOLO-O2E on the rail fastener detection results. The left, middle, and right sides of the figure respectively display the input original rail fastener image, the detection outcomes of YOLOv7, and YOLO-O2E.
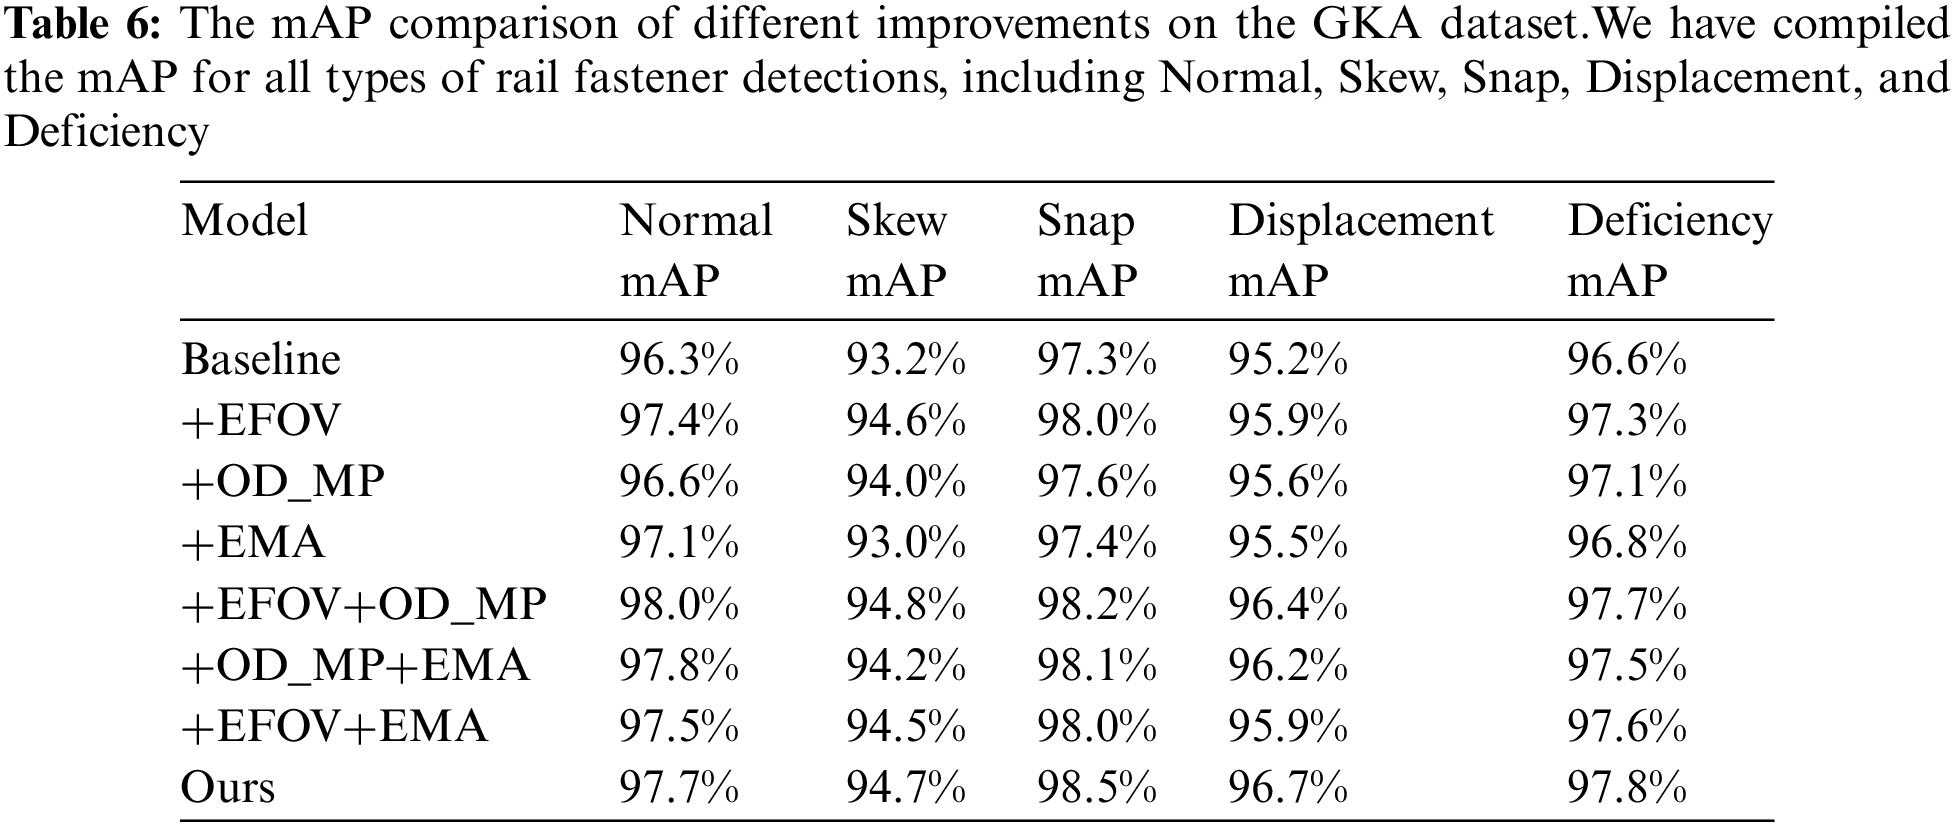


Figure 11: Baseline and proposed model detection performance on GKA dataset
In this paper, we propose an enhanced object detection model, named YOLO-O2E, designed to improve the accuracy of detecting anomalies in rail fastening components under challenging conditions. The algorithm introduced in this research is tailored for the detection of anomalies in rail fastening components and is applicable to objects with high feature similarity and suboptimal image quality. Our proposed EFOV (Multi-branch Parallel and Enhanced Field of View) module, achieved through dilated convolution layers with varying dilation factors, simulates the heightened sensitivity of the human eye to the central region. This allows the network to better distinguish between similarly shaped fastening components. Additionally, we introduce the OD_MP and EMA (Efficient Multiscale Attention) module to enhance feature extraction capabilities. We comprehensively evaluated the model’s performance and design characteristics, revealing its significant advantages in terms of accuracy, real-time capability, and robustness, rendering it suitable for deployment on mobile devices. Addressing challenges arising from adverse weather conditions, temperature fluctuations, and humidity in real-world scenarios will constitute the focal point of our future research endeavors, ensuring reliable detection and analysis of rail fastening components under diverse environmental conditions.
Acknowledgement: We want to express our gratitude to the editors and every reviewer for their hard work and professional advice throughout the process. Their careful review and valuable feedback have made significant contributions to the improvement of this paper.
Funding Statement: This work is supported in part by the National Natural Science Foundation of China (Grant Number 61971078), which provided domain expertise and computational power that greatly assisted the activity. This work was financially supported by Chongqing Municipal Education Commission Grants for Major Science and Technology Project (KJZD-M202301901) and the Chongqing University of Technology Graduate Innovation Foundation (Grant No. gzlcx20223222).
Author Contributions: The authors confirm contribution to the paper as follows: Zhuhong Chu: Designing methodologies, crafting network modules, coding, and thesis composition. Jianxun Zhang: Guides the work and analyzes the theoretical nature of the module. Chengdong Wang: Dataset analysis, inference result uploading, and recent paper collection. Changhui Yang: Review, supervision, and acquiring funding. All authors reviewed the results and approved the final version of the manuscript.
Availability of Data and Materials: Data is not available due to commercial restrictions.
Conflicts of Interest: The authors declare that they have no conflicts of interest to report regarding the present study.
References
1. X. Wei, Z. Yang, Y. Liu, D. Wei, L. Jia and Y. Li, “Railway track fastener defect detection based on image processing and deep learning techniques: A comparative study,” Eng. Appl. Artif. Intell., vol. 80, no. 4, pp. 1766–1781, 2019. doi: 10.1016/j.engappai.2019.01.008. [Google Scholar] [CrossRef]
2. Q. Li and S. Ren, “A real-time visual inspection system for discrete surface defects of rail heads,” IEEE Trans. Instrum. Meas., vol. 61, no. 8, pp. 2189–2199, 2012. doi: 10.1109/TIM.2012.2184959. [Google Scholar] [CrossRef]
3. H. Qi, T. Xu, G. Wang, Y. Cheng, and C. Chen, “MYOLOv3-Tiny: A new convolutional neural network architecture for real time detection of track fasteners,” Comput. Ind., vol. 123, no. 12, pp. 103303, 2020. doi: 10.1016/j.compind.2020.103303. [Google Scholar] [CrossRef]
4. X. Wei, D. Wei, D. Suo, L. Jia, and Y. Li, “Multi-target defect identification for railway track line based on image processing and improved YOLOv3 model,” IEEE Access, vol. 8, pp. 61973–61988, 2020. doi: 10.1109/ACCESS.2020.2984264. [Google Scholar] [CrossRef]
5. Z. W. Lu, “Overall comments on track technology of high-speed railway,” J. Railw. Eng. Soc., vol. 1, pp. 41–54, 2007. (In Chinese). doi: 10.3969/j.issn.1006-2106.2007.01.007. [Google Scholar] [CrossRef]
6. C. Chellaswamy, M. Krishnasamy, L. Balaji, A. Dhanalakshmi, and R. Ramesh, “Optimized ilwayra track health monitoring system based on dynamic differential evolution algorithm,” Measurement, vol. 152, no. 5, pp. 107332, 2020. doi: 10.1016/j.measurement.2019.107332. [Google Scholar] [CrossRef]
7. Z. Zhan et al., “Wireless rail fastener looseness detection based on mems accelerometer and vibration entropy,” IEEE Sens. J., vol. 20, no. 6, pp. 3226–3234, 2019. doi: 10.1109/JSEN.2019.2955378. [Google Scholar] [CrossRef]
8. Q. Mao, H. Cui, Q. Hu, and X. Ren, “A rigorous fastener inspection approach for high-speed railway from structured light sensors,” ISPRS J. Photogramm. Remote Sens., vol. 143, pp. 249–267, 2018. doi: 10.1016/j.isprsjprs.2017.11.007. [Google Scholar] [CrossRef]
9. A. A. Shah, N. A. Bhatti, K. Dev, and B. S. Chowdhry, “MUHAFIZ: IoT-based track recording vehicle for the damage analysis of the railway track,” IEEE Internet Things J., vol. 8, no. 11, pp. 9397–9406, 2021. doi: 10.1109/JIOT.2021.3057835. [Google Scholar] [CrossRef]
10. J. Liu, Y. Xiong, B. Li, and L. Li, “Research on automatic inspection algorithm for railway fastener defects based on computer vision,” J. China Railw. Soc., vol. 38, no. 8, pp. 73–80, 2016 (In Chinese). [Google Scholar]
11. H. Ma et al., “A real time detection method of track fasteners missing of railway based on machine vision,” Int. J. Performability Eng., vol. 14, no. 6, pp. 1190, 2018. doi: 10.23940/ijpe.18.06.p10.11901200. [Google Scholar] [CrossRef]
12. X. Gibert, V. M. Patel, and R. Chellappa, “Sequential score adaptation with extreme value theory for robust railway track inspection,” in Proc. IEEE Int. Conf. Comput. Vis. Workshops, Santiago, Chile, 2015, pp. 42–49. [Google Scholar]
13. X. Gibert, V. M. Patel, and R. Chellappa, “Deep multitask learning for railway track inspection,” IEEE Trans. Intell. Transp. Syst., vol. 18, no. 1, pp. 153–164, 2016. doi: 10.1109/TITS.2016.2568758. [Google Scholar] [CrossRef]
14. X. Li, Q. Wang, X. Yang, K. Wang, and H. Zhang, “Track fastener defect detection model based on improved YOLOv5s,” Sensors, vol. 23, no. 14, pp. 6457, 2023. doi: 10.3390/s23146457. [Google Scholar] [PubMed] [CrossRef]
15. Z. Q. Zhao, P. Zheng, S. T. Xu, and X. Wu, “Object detection with deep learning: A review,” IEEE Trans. Neural Netw. Learn. Syst., vol. 30, no. 11, pp. 3212–3232, 2019. doi: 10.1109/TNNLS.2018.2876865. [Google Scholar] [PubMed] [CrossRef]
16. S. Ren, K. He, K. He, R. Girshick, and J. Sun, “Faster R-CNN: Towards real-time object detection with region proposal networks,” Adv. Neural Inf. Process. Syst., vol. 39, no. 6, pp. 1137–1149, 2016. [Google Scholar]
17. Z. Cai and N. Vasconcelos, “Cascade R-CNN: Delving into high quality object detection,” in Proc. IEEE Conf. Comput. Vis. Pattern Recognit., 2018, pp. 6154–6162. [Google Scholar]
18. P. Sun et al., “Sparse R-CNN: End-to-end object detection with learnable proposals,” in Proc. IEEE/CVF Conf. Comput. Vis. Pattern Recognit., Nashville, TN, USA, 2021, pp. 14454–14463. [Google Scholar]
19. S. Zhang, C. Chi, Y. Yao, Z. Lei, and Z. Stan, “Li Bridging the gap between anchor-based and anchor-free detection via adaptive training sample selection,” in Proc. IEEE/CVF Conf. Comput. Vis. Pattern Recognit., Seattle, WA, USA, 2020, pp. 9759–9768. [Google Scholar]
20. C. Zhu, Y. He, and M. Savvides, “Feature selective anchor-free module for single-shot object detection,” in Proc. IEEE/CVF Conf. Comput. Vis. Pattern Recognit., Long Beach, CA, USA, 2019, pp. 840–849. [Google Scholar]
21. H. Law and J. Deng, “CornerNet: Detecting objects as paired keypoints,” in Proc. Eur. Conf. Comput. Vis. (ECCV), Munich, Germany, 2018, pp. 734–750. [Google Scholar]
22. A. Bochkovskiy, C. Y. Wang, and H. Y. M. Liao, “YOLOv4: Optimal speed and accuracy of object detection,” arXiv preprint arXiv:2004.10934, 2004. [Google Scholar]
23. Ultralytics, “ultralytics/yolov5: v7.0 - YOLOv5 SOTA Realtime Instance Segmentation,” 2022. Accessed: May 7, 2023. [Online]. Available: https://github.com/ultralytics/yolov5 [Google Scholar]
24. C. Li et al., “YOLOv6: A single-stage object detection framework for industrial applications,” arXiv preprint arXiv: 2209.02976, 2022. [Google Scholar]
25. C. Y. Wang, A. Bochkovskiy, and H. Y. M. Liao, “YOLOv7: Trainable bag-of-freebies sets new state-of-the-art for real-time object detectors,” in Proc. IEEE/CVF Conf. Comput. Vis. Pattern Recognit., Vancouver, BC, Canada, 2023, pp. 7464–7475. [Google Scholar]
26. T. Y. Lin et al., “Microsoft COCO: Common objects in context,” in Comput. Vis.—ECCV 2014: 13th Eur. Conf., Zurich, Switzerlan, Springer International Publishing, 2014, pp. 740–755. [Google Scholar]
27. T. Y. Lin, G. Priya, G. Ross, H. Kaiming, and P. Dollár, “Focal loss for dense object detection,” in Proc. IEEE Int. Conf. Comput. Vis., Venice, Italy, 2017, pp. 2980–2988. [Google Scholar]
28. X. Li et al., “Generalized focal loss: Learning qualified and distributed bounding boxes for dense object detection,” Adv. Neural Inf. Process Syst., vol. 33, pp. 21002–21012, 2020. [Google Scholar]
29. Z. Ge, S. Liu, F. Wang, Z. Li, and J. Sun, “YOLOX: Exceeding YOLO series in 2021,” arXiv preprint arXiv:2107.08430, 2021. [Google Scholar]
30. C. Y. Wang et al., “CSPNet: A new backbone that can enhance learning capability of CNN,” in Proc. IEEE/CVF Conf. Comput. Vis. Pattern Recognit. Workshops, Seattle, WA, USA, 2020, pp. 390–391. [Google Scholar]
31. H. Li, P. Xiong, J. An, and L. Wang, “Pyramid attention network for semantic segmentation,” arXiv preprint arXiv:1805.10180, 2018. [Google Scholar]
32. X. Fan, X. Jiao, M. Shuai, Y. Qin, and J. Chen, “Application research of image recognition technology based on improved svm in abnormal monitoring of rail fasteners,” J. Comput. Methods Sci. Eng., vol. 23, no. 3, pp. 1307–1319, 2023. doi: 10.3233/JCM-226723. [Google Scholar] [CrossRef]
33. I. Aydin, E. Akin, and M. Karakose, “Defect classification based on deep features for railway tracks in sustainable transportation,” Appl. Soft Comput., vol. 111, no. 7, pp. 107706, 2021. doi: 10.1016/j.asoc.2021.107706 [Google Scholar] [CrossRef]
34. M. Sandler, A. Howard, M. Zhu, A. Zhmoginov, and L. C. Chen, “MobileNetV2: Inverted residuals and linear bottlenecks,” in Proc. IEEE Conf. Comput. Vis. Pattern Recognit., Salt Lake City, UT, USA, 2018, pp. 4510–4520. [Google Scholar]
35. F. N. Iandola, S. Han, M. W. Moskewicz, K. Ashraf, W. J. Dally and K. Keutzer, “SqueezeNet: Alexnet-level accuracy with 50x fewer parameters and <0.5MB model size,” arXiv preprint arXiv:1602.07360, 2016. [Google Scholar]
36. J. Redmon and A. Farhadi, “YOLOv3: An incremental improvement,” arXiv preprint arXiv:1804.02767, 2018. [Google Scholar]
37. G. Huang, Z. Liu, L. V. D. Maaten, and K. Q. Weinberger, “Densely connected convolutional networks,” in Proc. IEEE Conf. Comput. Vis. Pattern Recognit., Honolulu, HI, USA, 2017, pp. 4700–4708. [Google Scholar]
38. S. Liu, D. Huang, and W. Yunhong, “Receptive field block net for accurate and fast object detection,” in Proc. Eur. Conf. Comput. Vis. (ECCV), Munich, Germany, 2018, pp. 385–400. [Google Scholar]
39. C. Li, A. Zhou, and A. Yao, “Omni-dimensional dynamic convolution,” arXiv preprint arXiv:2209.07947, 2022. [Google Scholar]
40. D. Ouyang et al., “Efficient multi-scale attention module with cross-spatial learning,” in ICASSP 2023—2023 IEEE Int. Conf. Acoust., Speech Signal Process. (ICASSP), Rhodes Island, Greece, IEEE, 2023, pp. 1–5. [Google Scholar]
Cite This Article
 Copyright © 2024 The Author(s). Published by Tech Science Press.
This work is licensed under a Creative Commons Attribution 4.0 International License , which permits unrestricted use, distribution, and reproduction in any medium, provided the original work is properly cited.
 Downloads
 Citation Tools