
 Submit a Paper
 Propose a Special lssue
 Open Access
ARTICLE

Transformer-Based Cloud Detection Method for High-Resolution Remote Sensing Imagery
1 Key Laboratory of GIS Application Research, School of Geography and Tourism, Chongqing Normal University, Chongqing, 401331, China
2 College of Computer and Information Science, Chongqing Normal University, Chongqing, 401331, China
3 Department of Military Installations, Army Logistics Academy, Chongqing, 401331, China
* Corresponding Author: Song Sun. Email:
(This article belongs to the Special Issue: The Latest Deep Learning Architectures for Artificial Intelligence Applications)
Computers, Materials & Continua 2024, 80(1), 661-678. https://doi.org/10.32604/cmc.2024.052208
Received 26 March 2024; Accepted 22 May 2024; Issue published 18 July 2024
 View Full Text
 Download PDF
Abstract
Cloud detection from satellite and drone imagery is crucial for applications such as weather forecasting and environmental monitoring. Addressing the limitations of conventional convolutional neural networks, we propose an innovative transformer-based method. This method leverages transformers, which are adept at processing data sequences, to enhance cloud detection accuracy. Additionally, we introduce a Cyclic Refinement Architecture that improves the resolution and quality of feature extraction, thereby aiding in the retention of critical details often lost during cloud detection. Our extensive experimental validation shows that our approach significantly outperforms established models, excelling in high-resolution feature extraction and precise cloud segmentation. By integrating Positional Visual Transformers (PVT) with this architecture, our method advances high-resolution feature delineation and segmentation accuracy. Ultimately, our research offers a novel perspective for surmounting traditional challenges in cloud detection and contributes to the advancement of precise and dependable image analysis across various domains.Keywords
Cloud detection in remote sensing is crucial for accurate analysis of satellite and aerial imagery. Clouds cover approximately 67% of the Earth’s surface at any given time [1], significantly impacting the quality of data from these images due to obscuration of the Earth’s surface. This often leads to erroneous measurements or interpretations. Therefore, the development of effective cloud detection methods is essential to preserve data integrity and mitigate the impact of clouds that may obscure surface features. This is particularly vital in applications that require precise surface observations, such as land cover classification [2,3], agricultural monitoring [4,5], and urban planning [6].
Cloud detection methodologies encompass a diverse range of techniques. Threshold-based methods [7] leverage specific spectral bands—namely visible and infrared—to set thresholds, utilizing the higher brightness levels of clouds within these bands to accurately classify pixels exceeding predetermined brightness values as clouds. Additionally, the use of spectral indices, such as the Normalized Difference Snow Index (NDSI) [8] and the Normalized Difference Vegetation Index (NDVI) [9], provides an alternative by exploiting the distinct spectral signatures of clouds, snow, and vegetation to facilitate their differentiation.
In recent years, the application of machine learning and deep learning (DL) [10] algorithms has attracted considerable attention for their ability to autonomously learn from training datasets and distinguish between cloudy and clear pixels. Convolutional Neural Networks (CNN)-based methods [11,12] are notably effective, excelling at identifying spatial hierarchies in images. This ability highlights CNNs’ strength in recognizing spatial features within cloud imagery with remarkable precision. However, despite their efficacy in recognizing spatial features, CNNs often fall short in capturing global image features, presenting a significant research opportunity to develop advanced algorithms that provide a more comprehensive understanding of image data.
In this study, we propose a novel transformer-based approach to address these enduring challenges. Our methodology utilizes the Pyramid Vision Transformer (PVT) [13] as the core network for feature extraction, specifically chosen to enhance the extraction of high-resolution features—a known limitation of traditional CNN architectures. The selection of PVT over other Transformer [14] architectures is due to its ability to efficiently process high-resolution inputs while maintaining computational efficiency, facilitated by its innovative design featuring a progressive shrinking pyramid and spatial-reduction attention mechanisms. These design elements contribute to a more computationally efficient model, enabling the extraction of high-quality features with less computational overhead typically required for processing high-resolution data.
We introduce the Cyclic Refinement Architecture (CRA) to extract multi-scale features and simultaneously generate multiple prediction results using feature maps at various scales. Additionally, this framework enhances the utilization and refinement of both high and low-resolution features through iterative feedback loops, providing comprehensive solutions to the challenges identified without compromising the ability to learn high-resolution features. To improve the performance and efficacy of these methodologies, we compute the loss for each of the five predictions generated by the CRA module. This computation aggregates these individual losses to formulate the final loss function, concluding the optimization process. The primary contributions of our work are as follows:
1) We introduce a transformer-based architecture, specifically the Pyramid Vision Transformer (PVT), tailored for cloud detection tasks. This model excels in learning global features, significantly enhancing high-resolution segmentation under challenging conditions.
2) We design the CRA module to refine multi-scale feature maps and generate iterative predictions through feedback loops, thereby offering a robust solution that supports high-resolution learning.
3) Our methodology has undergone rigorous evaluation through comprehensive experiments conducted on the HRC_WHU dataset. The results of these experiments unequivocally confirm the superior performance of our proposed approach, showcasing its effectiveness in cloud detection tasks.
Remotely sensed imagery is an essential tool for capturing the physical characteristics of a geographic area without physical presence. This technology enables the capture, visualization, and analysis of objects and features on the Earth’s surface. Remote sensing utilizes sensors mounted on specialized platforms such as airplanes, satellites, and Unmanned Aerial Vehicles (UAVs). Each platform category offers distinct advantages and disadvantages, enhancing the versatility and applicability of remote sensing across various research and practical applications.
For example, UAVs and drones provide very high-resolution imagery and can follow programmable flight paths equipped with LiDAR technology. However, they are limited by small coverage areas and the requirement for a visual line of sight. Airplanes and helicopters also capture high-resolution images and possess LiDAR capabilities; they follow specific flight paths but face limitations due to small coverage areas and complex flight operations. Conversely, low Earth orbit satellites offer imagery from high to coarse resolution across extensive areas, but their coverage is constrained by orbital paths and can be adversely affected by cloud cover.
Remote sensors are pivotal in acquiring remotely sensed images, primarily categorized into two types: active and passive. Active sensors emit energy toward the target and measure the reflection back to the sensor, proving invaluable in low-light conditions or for capturing specific wavelengths. Conversely, passive sensors detect natural radiation emitted or reflected by objects, often utilizing sunlight reflected from the Earth’s surface. This abundant natural illumination makes passive sensors highly effective for a variety of Earth observation tasks.
The analysis of such reflected light supports numerous applications including environmental monitoring, land use mapping, and atmospheric studies. Among the key datasets for cloud detection and other remote sensing applications are those derived from passive sensors on Landsat and Sentinel satellites at the present time, Landsat imagery has been foundational in remote sensing research due to its open data policy, enabling widespread use in diverse studies for many years. Similarly, imagery from the Sentinel program (Europe), Gaofen (China), and Himawari (Japan) has also seen increased use in recent years.
Recognized for its diversity and high resolution, the HRC_WHU dataset, sourced from Google Earth, includes a wide range of landscapes such as water bodies, vegetated areas, urban environments, snow/ice regions, and barren terrains. The high resolution and variety of scene categories enable thorough evaluations of the algorithm’s adaptability and performance across different environmental contexts. Each image in the dataset is paired with a Ground Truth (GT) cloud mask, meticulously annotated by remote sensing experts at Wuhan University. These expertly annotated GT cloud masks serve as a high-quality, authoritative benchmark, ensuring accurate and credible evaluations of cloud detection algorithms. Additionally, the public availability of the HRC_WHU dataset promotes its widespread adoption and benchmarking within the research community.
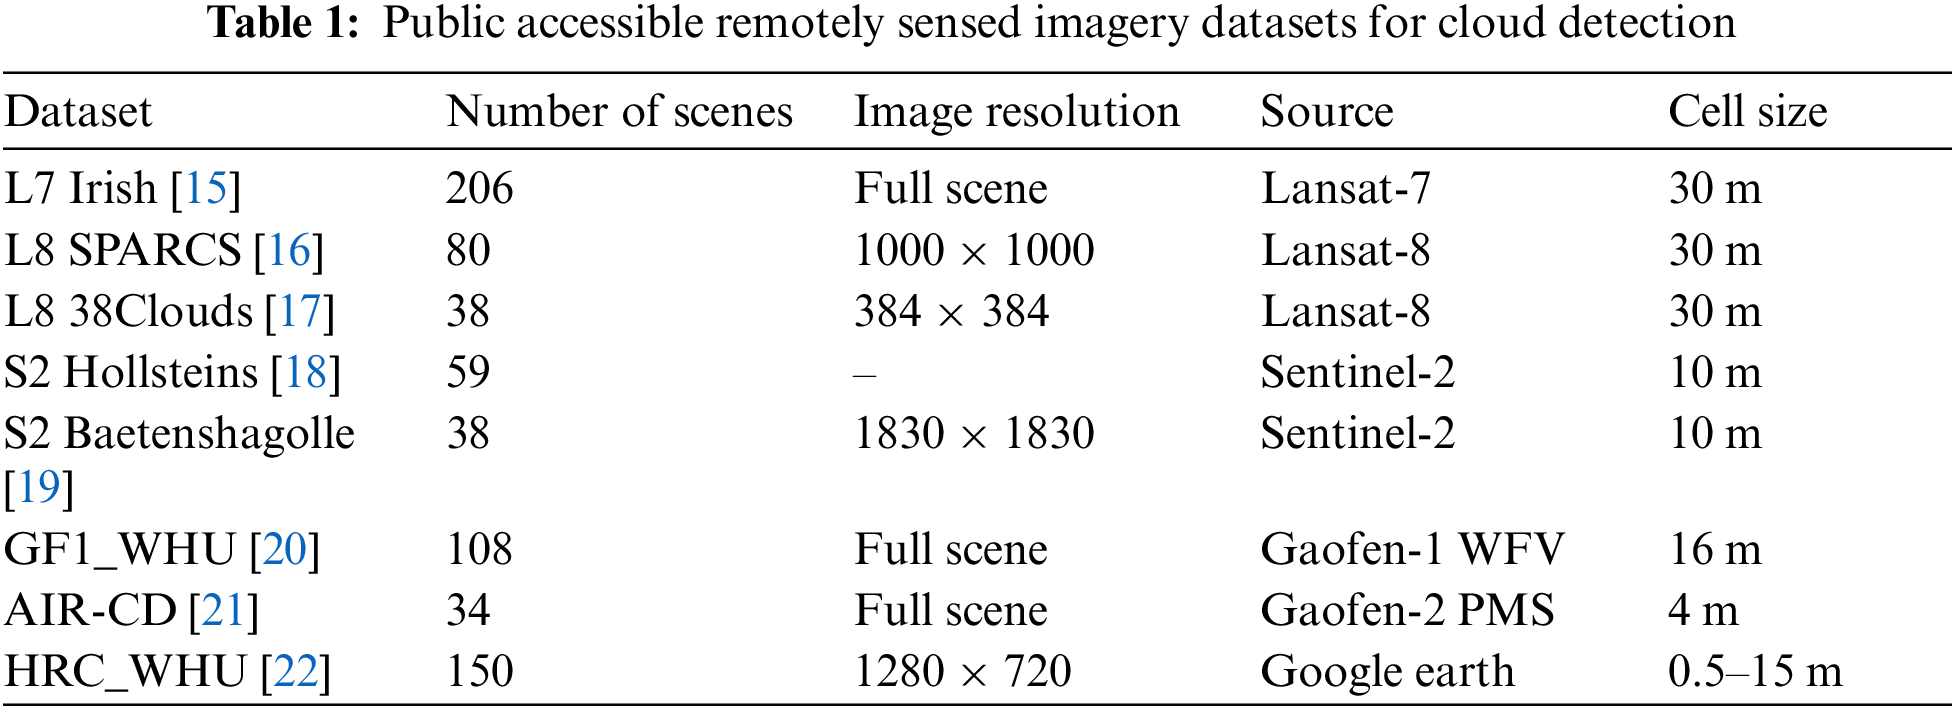
Table 1 provides a concise summary of several prominent datasets used in cloud detection. These datasets primarily originate from the Landsat, Sentinel, Google Earth and Gaofen satellite programs. The datasets cover a wide range of scenes, with specific datasets like L8 SPARCS and L8 38 Clouds tailored to smaller dimensions for particular needs. In contrast, the S2 Hollsteins dataset is noted for its use of pixel-level data.
Cloud detection is crucial in the preprocessing of satellite imagery. With the increasing availability of data, significant research has been directed toward this area, focusing on images captured by various remote sensors. Zhu et al. [23] provided a comprehensive classification of cloud and cloud shadow detection algorithms, while Li et al. [24] offered an in-depth review of features, algorithms, and validation aspects.
In satellite-based atmospheric observation, the extraction of specific cloud features depends on satellite conditions. This analysis explores cloud characteristics across spectral, spatial, and temporal dimensions. Spectrally, clouds are identified by high brightness and a predominantly white appearance, with a distinct low thermal signature. Various methodologies [25] explicitly use spectral features, employing artificially designed feature extractors for cloud detection. These methods typically involve establishing either fixed or dynamic thresholds, ascertained through parametric sensitivity analysis [26] or supported by supplementary data. The Fmask series [27] estimates cloud probabilities by analyzing spectral variability and brightness temperature, facilitating dynamic threshold-based segmentation and cloud mask generation. Due to its robust performance globally, the latest version of Fmask is widely adopted for quality assessment in Landsat imagery.
Spatially, clouds are characterized by their high-altitude presence and homogeneous texture with blurred edges, indicating minimal shape complexity.
Temporally, an increase in cloud reflectance is a key indicator of dynamic behavior in atmospheric layers. Innovative methodologies for cloud detection leverage these temporal variations. For example, Lin et al. [28] introduced a multi-temporal cloud detection method using invariant pixels identified across multiple images, highlighting the utility of temporal information in enhancing detection accuracy. Similarly, Bian et al. [29] developed a technique for detecting clouds and snow in multi-temporal imagery by using a series of images over several days to compose a cloud-and snow-free reference image.
From an algorithmic perspective, the advent of deep learning (DL) algorithms for cloud detection marks a significant research focus. By treating cloud detection as an image segmentation task, DL algorithms demonstrate substantial capabilities. Unlike traditional machine learning methods like Random Forests [30] or Support Vector Machines (SVM) [31], which often fall short in feature extraction and representational capacity. DL approaches show superior promise. This is highlighted in studies like that by Mateo-Garcia et al. [32], which demonstrated the effectiveness of CNNs in multispectral satellite imagery for cloud detection and supported by Li et al. [33] through the development of a DL-based algorithm using multi-scale feature fusion. Further advancements in weakly supervised learning [34,35], unsupervised learning [36,37], semisupervised learning [38], and domain adaptation [38] are addressing the challenges of data label dependency and model generalizability across different sensors, making significant progress in the field of cloud detection.
Originally introduced in the literature, the Transformer architecture has marked a significant advancement in deep learning. Comprehensive analyses by Hu et al. [39] and Liu et al. [40] have explored its application and impact. Initially dominant in natural language processing (NLP), this model has powered major language models like BERT [41], RoBERTa [42], and GPT 1-4 [43], demonstrating exceptional performance across various NLP tasks. Hu et al. [39] highlighted the substantial contributions of Transformers to NLP.
The success of Transformers in NLP has generated considerable interest in their application to computer vision. For example, the Vision Transformer (ViT) [44] adapts the Transformer Encoder, originally for NLP, to process images by embedding image patches linearly with positional embeddings for effective image classification. The Detection Transformer (DETR) [45] introduces a linear projection layer to reduce the dimensionality of CNN features, integrates spatial positional embeddings in each multi-head self-attention layer of both the encoder and decoder and adds object queries to enhance object detection capabilities in each decoder’s layer. The Contrastive Language–Image Pre-training (CLIP) [46] framework trains image and text encoders using image-text pairs, optimizing for maximum similarity between valid pairs and minimum otherwise, showcasing the adaptability of Transformer models beyond NLP.
The Pyramid Vision Transformer (PVT) is a novel adaptation within computer vision, enhancing the ViT model to support diverse image resolutions and computational demands with a scalable and efficient architecture. Unlike ViT’s single-scale patch processing, PVT employs a hierarchical, multi-scale strategy akin to CNNs’ pyramidal feature hierarchies, allowing for the capture of a wide range of features from fine to coarse details. This approach makes PVT suitable for tasks requiring multi-scale representations. Traditional transformer models face substantial computational costs when applying self-attention across global scales, especially at higher image resolutions. PVT addresses these issues through spatial-reduction attention, which reduces the spatial dimensions of the self-attention mechanism’s key and value matrices, significantly lowering computational complexity and memory requirements.
With its pyramidal architecture, PVT effectively integrates into various downstream tasks like object detection, semantic segmentation, and instance segmentation, serving as a backbone network that provides essential multi-scale feature maps. Its compatibility with conventional CNN components—such as convolutional layers, pooling layers, and skip connections—allows for seamless integration into existing CNN frameworks, enabling the synergistic utilization of both transformers and CNNs. By offering hierarchical and multi-scale representations, PVT outperforms traditional CNNs and standard ViT models in various vision tasks, including image classification, object detection [47], and semantic segmentation. Its spatial-reduction attention mechanism also makes it highly suitable for processing high-resolution images under tight computational constraints. Due to these attributes, we have chosen PVT as the network feature extractor for our study.
To attain a high standard of cloud detection, our method employs a novel strategy that emphasizes both low-resolution and high-resolution image features. This is achieved by incorporating the Pyramid Vision Transformer (PVT) and a cyclic refinement architecture. The PVT is designed to extract multi-scale features, while the cyclic refinement architecture facilitates the generation of multiple prediction results using feature maps at various scales. By integrating these predictions, we compute a comprehensive final loss, significantly enhancing the accuracy of cloud detection. We will discuss the PVT, cyclic refinement architecture, and the final optimization method in detail subsequently. Fig. 1 illustrates the technology roadmap.

Figure 1: Technology roadmap
3.2 Pyramid Vision Transformer
Our research highlights the significant performance advantages of the Transformer architecture and addresses one of its main drawbacks: high memory consumption. This issue is particularly acute in resource-constrained environments, which can limit the widespread adoption of Transformers. To mitigate this, we have implemented the Pyramid Vision Transformer (PVT) as our primary backbone network architecture. The PVT is designed to alleviate the memory constraints of traditional Transformer models without compromising on performance.
First, we introduce the overall structure of the Pyramid Vision Transformer (PVT). The PVT processes the input image, denoted as
In addition to partitioning the input image
Following the extraction of feature maps at four distinct scales, we conduct further operations on these maps, completing the structure of the PVT.
3.3 Cyclic Refinement Architecture
Utilizing the Pyramid Vision Transformer (PVT) solely to extract multi-scale feature maps and generate multiple predictive outcomes through upsampling does not fully achieve high-precision predictions. With this limitation in mind, our study introduces a PVT-based cyclic refinement architecture specifically designed to efficiently extract information from multi-scale feature maps. The core of this architecture is a meticulously designed iterative feedback process that progressively enhances the quality and accuracy of the feature maps by effectively integrating them across different scales.
Next, we provide a detailed introduction to the specific implementation details of this architecture. At the start of the iteration, feature FMi is merged with the feedback feature map FD left over from the previous iteration. It is important to note that during the first iteration stage, there will be no feedback feature map FD, and only FM1 and FM3 will be merged with the feedback feature map FD:
The fusion is a method of integration, mainly achieved by up-sampling FMi to match the dimensions of FD. Upon completion of the fusion method, we proceed to refine the feature maps of different scales, a process that begins with the smallest scale feature map, FM1. This refining process incrementally improves the detail and quality of the feature maps, working progressively from the smallest scale upwards. To further illustrate this process, we will describe the refinement steps using pseudocode. This approach not only provides a clear understanding of the sequential nature of the refinement but also offers insight into the algorithmic logic used to improve the precision and effectiveness of the feature maps.

P is an array that stores the four predictions finally obtained. ↑ represents an up-sampling operation. The cat means concatenation according to channel = 1.
The most important structure is the CAB, a Channel Attention Block. The CAB plays a crucial role in our cyclic refinement architecture. We utilize the CAB to extract and refine channel features, achieving efficient and precise feature processing. The workflow of the CAB is as follows: Initially, the input image X is passed through the CAB. The image then undergoes deep feature extraction through multiple convolutional layers, accompanied by ReLU activation layers. In the mid-stage of the CAB, a pooling operation is conducted to simplify the features and reduce computational complexity. Finally, the output undergoes normalization via a Sigmoid function, ensuring the stability and effectiveness of the extracted features. Therefore, this module not only enhances the model’s focus on channel features but also improves the accuracy and fineness of feature extraction, playing a pivotal role in our architecture.
After detailing each part of the pseudocode, we will proceed with a holistic discussion following its content. As described earlier, the process starts with the smallest scale feature map, FM1. We first merge the current feature map with the feedback feature returned from the previous iteration by processing it through a CAB module. It is then merged with the larger scale module, FM2, using a concatenation function (cat). Then FM2 passes through a CAB module and continues to merge with FM3, which has been fused with feedback features. Finally, FM4 passes through a CAB module, resulting in the final feature map of the current iteration. This feature map is not only used to provide feedback to the feature map FD of the next iteration but it is also used for upsampling to produce a predictive result. This iteration is run a total of four times, resulting in four predicted outcomes and the feedback feature left over from the last iteration. Note that any operation involving fusion or concatenation (cat) may require up-sampling to match feature dimensions. This step will not be discussed further and should be implemented in the code.
At the end of the iterative process, the final feedback feature is no longer used for additional feedback but is merged with the larger FM4 feature processed by the CAB module. This step marks the generation of the final, fifth prediction result, which is achieved by up-sampling to provide a wider view and higher resolution. We also use a graph fusion module in our feature fusion process [48].
After completing the cyclical refinement architecture, we obtained four prediction results from different cycles of refinement, along with a final prediction processed by a graph fusion module. Each prediction accurately reflects the meticulous precision in feature extraction and fusion at each refinement stage, ensuring high accuracy and robustness in the task. This innovative method has not only enhanced the interaction between features of different scales but also significantly improved the prediction accuracy in edge regions, thus achieving a significant breakthrough in the field of cloud detection technology.
Having summarized two key methodologies, we now turn to the optimization of these approaches. In this section, we will explore how we have enhanced the effectiveness and efficiency of these methodologies to maximize performance and results from their application. Our focus will be on refining and fine-tuning these methodologies to achieve optimal outcomes in our respective areas of study.
Therefore, to enhance the accuracy of the predictive images generated by the Pyramid Vision Transformer (PVT) and cyclic refinement architecture, designing an effective loss function is crucial. We employ the following loss function formula:
In this formula, LwIoU is the weighted intersection over the union loss, while LwBCE is the weighted binary cross entropy loss. The specific implementation details of these two types of loss functions are not covered in this paper.
Clearly, by using PVT and the iterative refinement architecture, we have obtained five prediction results of varying levels of detail. Therefore, for each of these five prediction maps, we need to calculate
This concludes our methodological process. Through the Pyramid Vision Transformer (PVT), we obtained feature maps at various scales. The cyclic refinement architecture then generated five final predictive outcome maps. By employing a specially designed loss function, we continuously optimized both the PVT and the cyclic refinement architecture to achieve superior prediction results, thereby facilitating high-precision cloud detection.
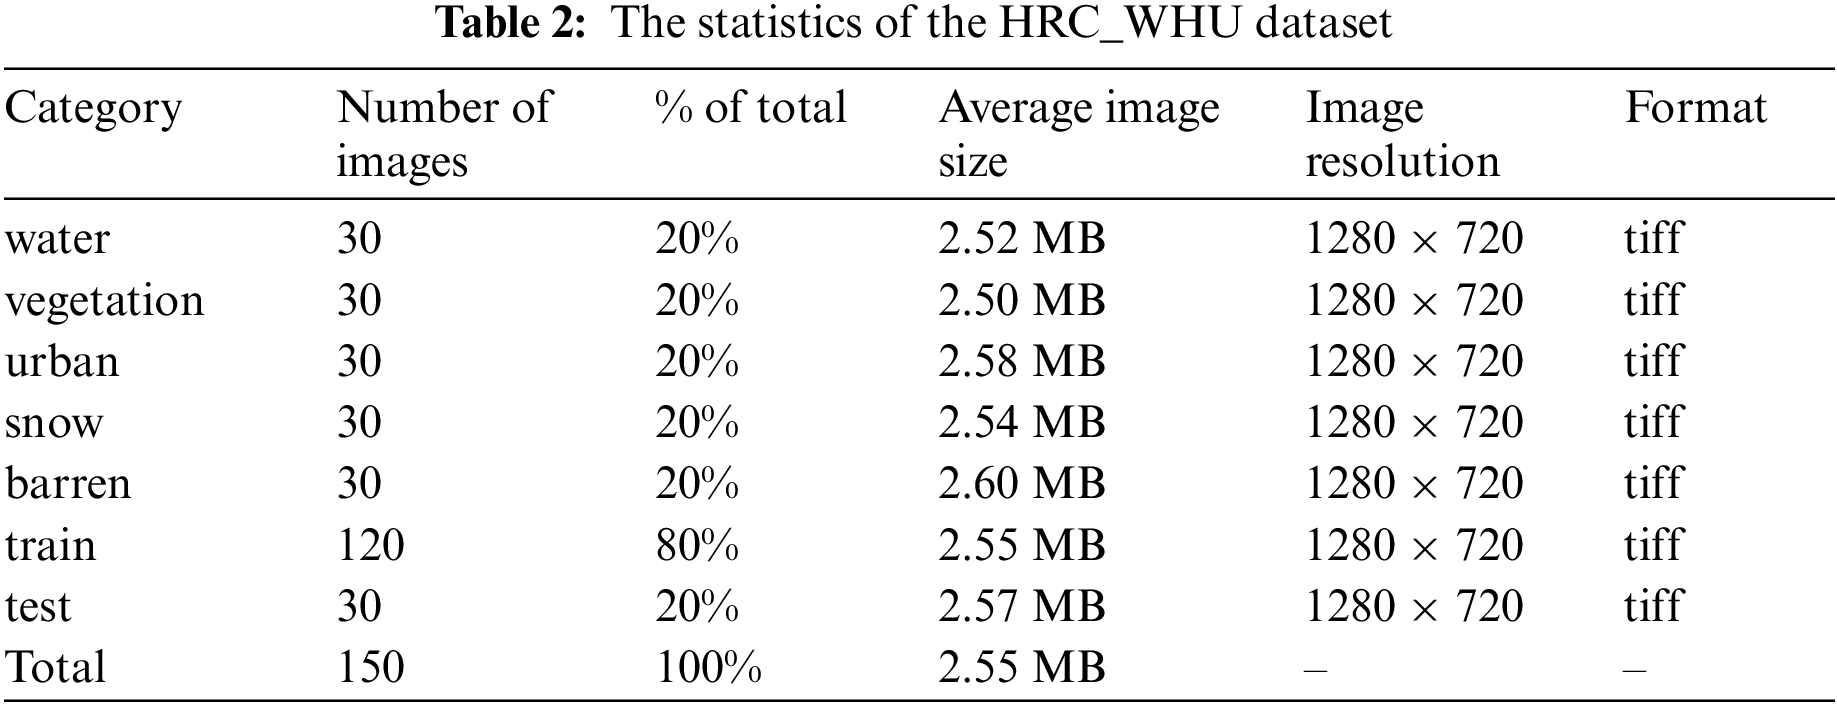
To validate the overall efficacy of our proposed algorithm across diverse scenes, comprehensive experiments were conducted using the High-Resolution Cloud dataset (HRC_WHU) [33]. Table 2 provides a detailed overview of the HRC_WHU dataset, which consists of 150 high-resolution remote sensing images covering extensive scenes in three channels (RGB). All images, including reference masks, are provided in TIFF format, chosen during the initial collection phase to preserve data quality. The images are 1280 × 720 pixels in resolution, with an average file size of approximately 2.55 MB. Each category in the dataset is equally represented by 30 images, ensuring a balanced distribution for comprehensive training and testing across various environmental contexts. We adhere to the dataset’s default configuration, designating 120 images for training and 30 images for testing.
Above, Fig. 2 showcases a selection of sample images from the HRC_WHU dataset. Starting from the cell positioned at the far right, the sequence includes categories such as barren, snow, urban, and water environments. These images provide a clear understanding of the diverse environmental conditions and the inherent challenges faced in the analysis of remote sensing imagery.

Figure 2: Sample images with various backgrounds from HRC_WHU dataset. (a) cloud image and corresponding mask with barren terrains as background, (b) cloud image and corresponding mask with snow/ice regions as background, (c) cloud image and corresponding mask with urban environments as background, (d) cloud image and corresponding mask with vegetation-covered areas as background, (e) cloud image and corresponding mask with water bodies as background
For each designated class, the imagery displayed in the first and third rows originates from satellite or aerial sources, illustrating the natural appearance of the environments. In contrast, the second and fourth rows feature binary segmentation masks corresponding to the original images. These masks serve as the ground truth (GT) within the dataset, where white regions indicate pixels identified by the model as belonging to the target class, and black regions represent either the background or pixels classified under other categories.
In the development of our model, we utilized the PyTorch framework. The computational experiments were conducted on a single NVIDIA GTX 4090 GPU during both the training and testing phases. For data input, we retained the original resolution of the dataset images at 1920 × 720 pixels, demonstrating our model’s ability to process high-resolution imagery.
For optimization, we chose AdamW [49], a variant of the Adam optimizer that includes a decoupled weight decay component, specifically addressing some challenges associated with Transformer-based models. We initialized the learning rate at 0.0001 and implemented a dynamic learning rate scheduling scheme. This schedule incorporates a decay factor of 0.1 every 20 epochs to gradually reduce the learning rate and stabilize training. Our training regimen extended over 150 epochs with a batch size of 8, allowing the model to be exposed to a wide variety of data samples and to generalize effectively from the training dataset.
To assess our model’s performance on the HRC_WHU dataset, we employed five standard metrics commonly used in image segmentation: Mean Average Error (MAE), mean Intersection over Union (mIoU), Pixel Accuracy (PA), and F1 score. Each metric provides a unique perspective on accuracy and effectiveness, facilitating a balanced comparison with other models. MAE quantifies the average prediction error, mIoU evaluates the accuracy of overlap between predicted and actual segments, and PA measures the proportion of correctly categorized pixels. The F1 score assesses the model’s precision and recall, respectively. Collectively, these metrics offer a comprehensive evaluation, enabling a precise comparison of our model’s efficacy against others.
In this study, we conducted a comparative analysis between our proposed model and five other models widely used in the field. The results are systematically presented in Table 3, which shows that our model achieved state-of-the-art (SOTA) outcomes across all evaluated metrics selected for this research.
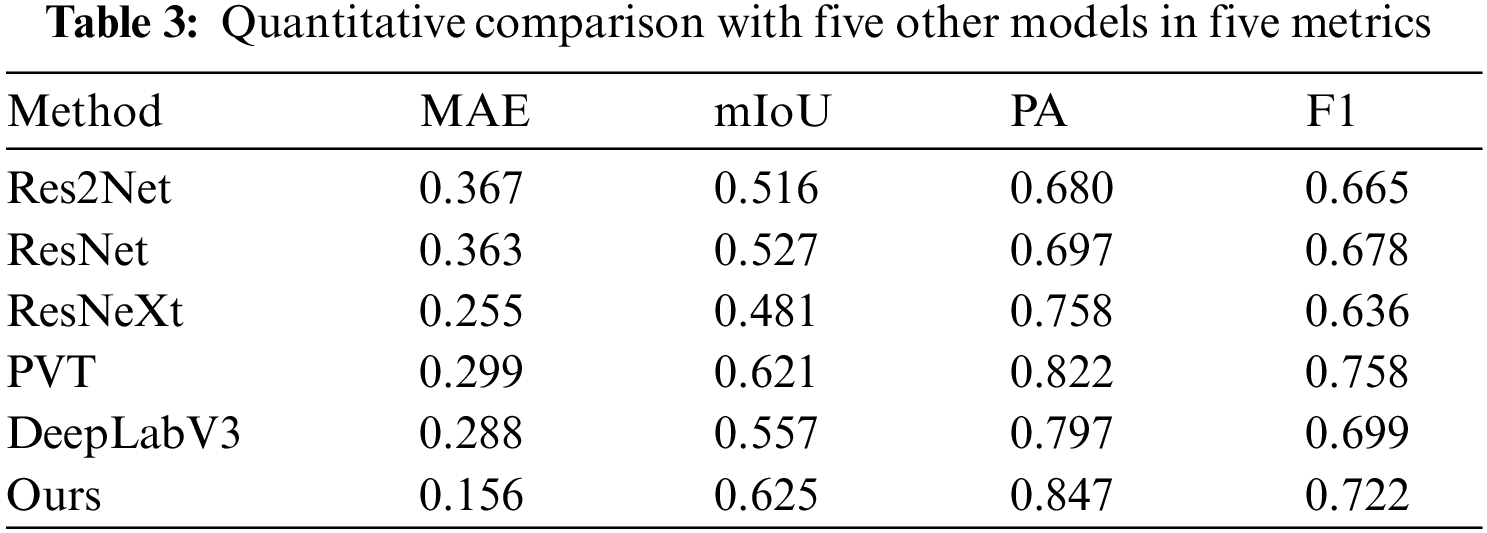
The neural network architectures evaluated in our experiments include Res2Net [50], ResNet [51], ResNeXt [52], PVT [13], DeepLabV3 [53], and our proposed model, referred to as “Ours”. Our model demonstrates superior performance across multiple evaluation metrics. It achieves the lowest MAE of 0.156, the highest mIoU of 0.625, the highest PA of 0.847, and the highest F1 score of 0.722. In comparison, the DeepLabV3 architecture achieves the second-best results in PA but scores lower in the F1 score relative to our model. The PVT architecture shows notable competitiveness with a mIoU of 0.621 and an F1 score of 0.758, yet it exhibits weaker performance in PA when compared with our model. Both the Res2Net and ResNet architectures yield similar outcomes, with minor discrepancies in MAE and mIoU, and underperform in the other metrics. The ResNeXt model, despite achieving the second-lowest MAE of 0.255, does not excel beyond our model in any other metric.
This evaluation underscores the effectiveness and superiority of our proposed methodology, illustrating the robust performance and notable advantages our approach offers compared to existing methods within the field.
For a graphical demonstration of our model’s superiority, we juxtaposed the predictive mapping generated by our model against those produced by other methodologies, with the comparative results illustrated in Fig. 3. This figure includes a selection of random samples from the test subset of the original dataset. It features two images per category, resulting in a total of ten subfigures. The depicted scenarios within these figures are notably complex, characterized by the absence of fixed shapes and complicated further by snow/ice environments. This setting presents a significant challenge, as the visual similarity between snow, ice, and clouds can complicate accurate cloud detection.
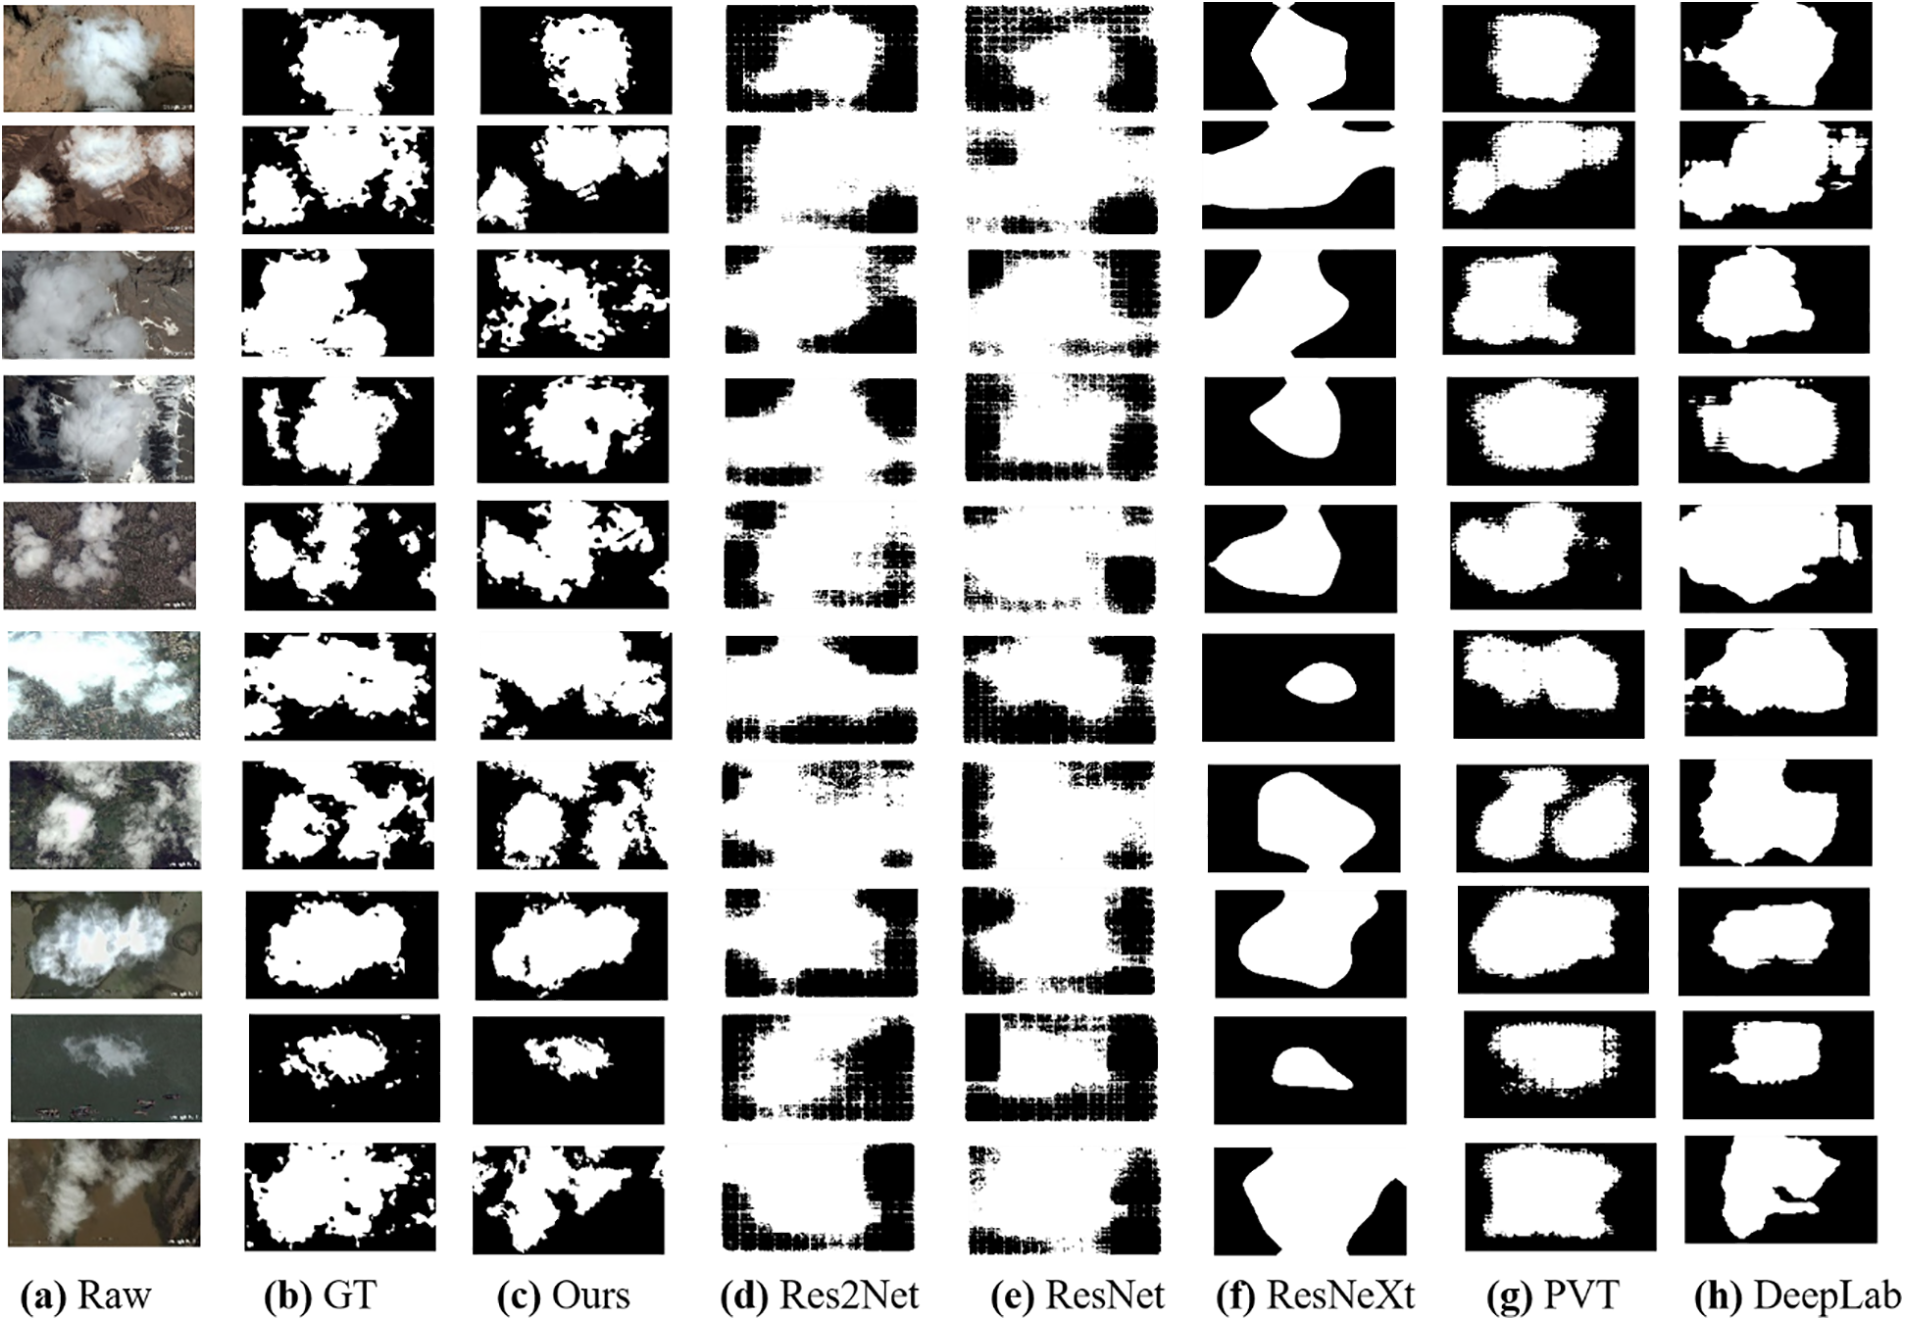
Figure 3: Qualitative comparison of twenties images in the test set. (a) the raw image from the dataset, (b) the ground truth for the cloud masks, (c) the prediction maps generated by our method, (d–h) the prediction maps generated by other methods
We benchmark our model against several well-known architectures, including ResNet, Res2Net, ResNeXt, DeepLabV3, and PVT, to evaluate its efficacy in cloud detection tasks. The comparative analysis showed that in scenarios with barren backgrounds, as illustrated in the first four rows of our results, conventional models struggled with identifying sporadic and small-scale cloud formations. Conversely, our model demonstrated superior accuracy in identifying almost all cloud instances within these images. In challenging environments with snow backgrounds, our model uniquely excelled in detecting thin cloud formations, as evidenced in the third and fourth rows.
Despite these strengths, it is crucial to acknowledge the limitations observed under specific conditions, notably in the sixth and tenth rows of our results, where the complex dynamics of cloud formations and high-resolution processing demands posed significant challenges. The comparative analysis also highlighted notable deficiencies in the benchmark models. Specifically, Res2Net and ResNet were prone to over-segmentation, often dividing images into more segments than necessary. ResNeXt and DeepLabV3 struggled with capturing detailed edge information, essential for precise segmentation, while PVT had difficulties in correct shape delineation due to its limitations in integrating local contextual information. These findings underscore the need for further advancements in model design and training methodologies to address these challenges.
These results illuminate the nuanced performance landscape of cloud detection models and underscore the potential of our network to advance the field.
It is worth noting that the lack of accuracy when confronted with scenes in complex terrain may be due to the following reasons. Firstly, Remote sensing image quality is not high; due to the complexity and diversity of the terrain, coupled with the changing climate of snow-covered mountains and other places, there are often changes in light, more cloud cover, and other situations. Secondly, higher image similarity and greater difficulty in distinguishing specific features; for example, in the snow-covered mountain region, the color and texture characteristics of the surface covered by clouds and snow are extremely similar, which undoubtedly strengthens the difficulty of distinguishing between clouds and the surface. Lastly, low contrast; for example, on snow-covered mountains, due to the high reflectivity of the snow-and ice-covered surface, it contrasts with the surrounding rocks or vegetation. This low contrast makes it difficult to accurately distinguish clouds from snow-covered surfaces in images.
The following points can be considered regarding the direction of future research. Firstly, methods based on single-time images: threshold segmentation using features of multi-spectral bands. Reduce the effect of clouds by using the penetrating nature of infrared bands. Secondly, pre-processing such as atmospheric correction is carried out to achieve the elimination of atmospheric scattering effects and cloud cover, and ultimately improve the quality of remote sensing images. Lastly, data enhancement is a common method to extend the training dataset and balance the distribution of samples of different categories by using data enhancement techniques, improving the generalization and anti-interference ability of the model.
We employ a consistent evaluation protocol similar to the quantitative analysis for our ablation study. The outcomes are succinctly summarized in Table 4, which organizes the experimental results according to different model configurations. In this table, the rows represent various iterations of our model, distinguished by the presence or absence of specific modules, and the first three columns correspond to the components under scrutiny: CAB, CRA, and the choice of network backbone. The table uses absence indicators for the Res2Net backbone, while a checkmark denotes the adoption of the PVT as the backbone.
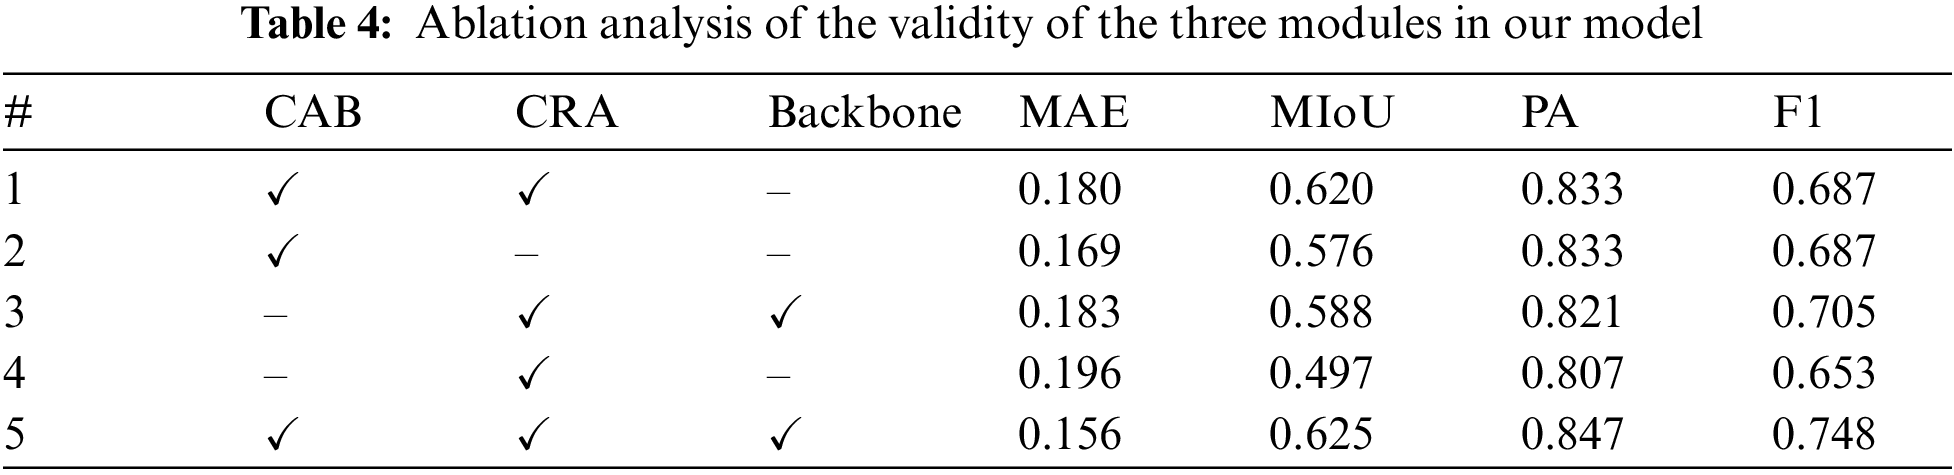
The experimental configurations range from a complete model with all three modules to pared-down versions where one or more modules have been omitted. Across all metrics assessed, the data underscore the significant role of the introduced modules in enhancing the network’s performance. This systematic removal and evaluation illustrate the integral function of each module, affirming their collective importance in achieving enhanced capabilities of our network.
To assess the efficacy of our modules, we systematically remove them from the comprehensive network. Table 4 depicts the outcomes, indicating various configurations of our model. The columns labeled CAB, CRA, and backbone specify the presence of these modules in the network. Specifically, CAB refers to the use of the CAB block, CRA denotes the iterative mechanism, and ‘backbone’ indicates the choice of network backbone, with the absence pointing to Res2Net and a checkmark to PVT.
Configurations range from complete, with all modules intact, to partial, with one or more modules removed. The rightmost columns, denoting different metrics, reflect the presence or absence of specific modules. The results suggest that each module contributes significantly to the performance metrics. The complete model configuration achieves the lowest MAE and the highest scores for MIoU, PA, and F1, underscoring the combined efficacy of all three modules in improving the model’s performance. Conversely, configurations lacking one or more modules generally show diminished performance, yet with some exceptions, indicating the importance of each component in the model’s architecture. Across all metrics, our findings consistently demonstrate the effectiveness of our modules in enhancing performance.
In this study, we propose a novel method that integrates the Pyramid Vision Transformer (PVT) with a cyclic refinement architecture, tailored specifically for cloud detection tasks. The conclusions are outlined below:
1) Our unique combination leverages the PVT’s capability to capture multi-scale features and enhances the resolution and quality of these features through the cyclic refinement architecture. This approach significantly improves the segmentation of details in cloud detection, overcoming common degradation issues. Testing on various datasets has demonstrated that our method substantially outperforms several existing advanced models in detection performance.
2) This innovative method contributes significantly to the field of cloud detection, both theoretically and methodologically. It showcases the potential of combining PVT with a cyclic refinement architecture, especially in terms of high-resolution feature extraction and detailed segmentation. Although this method has not been tested in other practical application scenarios yet, the theoretical and experimental results indicate a promising potential for future applications in cloud detection and related fields. Moreover, this work opens new avenues for future research, potentially fostering interdisciplinary innovation and development.
3) There are still some limitations in this study, such as reduced detection accuracy in complex terrains. Future research could focus on improving detection accuracy in challenging environments.
Acknowledgement: All authors are thankful for the useful and constructive comments from the editors and reviewers.
Funding Statement: This study was funded by the Chongqing Normal University Startup Foundation for PhD (22XLB021) and was also supported by the Open Research Project of the State Key Laboratory of Industrial Control Technology, Zhejiang University, China (No. ICT2023B40).
Author Contributions: Haotang Tan: Methodology, Data curation, Writing–review & editing. Song Sun: Conceptualization, Methodology, Writing–review & editing, Supervision. Xiyuan Shu: Writing–review & editing. Tian Cheng: Writing–review & editing. All authors reviewed the results and approved the final version of the manuscript.
Availability of Data and Materials: Data will be made available on request.
Conflicts of Interest: The authors declare that they have no conflicts of interest to report regarding the present study.
References
1. Y. Zhang, W. B. Rossow, A. A. Lacis, V. Oinas, and M. I. Mishchenko, “Calculation of radiative fluxes from the surface to top of atmosphere based on ISCCP and other global data sets: Refinements of the radiative transfer model and the input data,” J. Geophys. Res., vol. 109, no. D19, pp. 271, Oct. 2004. doi: 10.1029/2003JD004457. [Google Scholar] [CrossRef]
2. G. M. Foody, “Status of land cover classification accuracy assessment,” Remote Sens. Environ., vol. 80, no. 1, pp. 185–201, Apr. 2002. [Google Scholar]
3. D. Phiri and J. Morgenroth, “Developments in landsat land cover classification methods: A review,” Remote Sens., vol. 9, no. 9, pp. 967, Sep. 2017. doi: 10.3390/rs9090967. [Google Scholar] [CrossRef]
4. C. Atzberger, “Advances in remote sensing of agriculture: Context description, existing operational monitoring systems and major information needs,” Remote Sens., vol. 5, no. 8, pp. 4124, Aug. 2013. doi: 10.3390/rs5084124. [Google Scholar] [CrossRef]
5. S. Khanal, K. Kc, J. P. Fulton, S. Shearer, and E. Ozkan, “Remote sensing in agriculture—accomplishments, limitations, and opportunities,” Remote Sens., vol. 12, no. 22, pp. 3783, Nov. 2020. doi: 10.3390/rs12223783. [Google Scholar] [CrossRef]
6. T. Wellmann et al., “Remote sensing in urban planning: Contributions towards ecologically sound policies?” Landsc. Urban Plan., vol. 204, no. 7, pp. 103921, Dec. 2020. doi: 10.1016/j.landurbplan.2020.103921. [Google Scholar] [CrossRef]
7. Q. Y. Li, W. T. Lu, and J. Yang, “A hybrid thresholding algorithm for cloud detection on ground-based color images,” J. Atmos. Ocean. Technol., vol. 28, no. 10, pp. 1286–1296, Oct. 2011. doi: 10.1175/JTECH-D-11-00009.1. [Google Scholar] [CrossRef]
8. V. V. Salomonson and I. Appel, “Estimating fractional snow cover from MODIS using the normalized difference snow index,” Remote Sens. Environ., vol. 89, no. 3, pp. 351–360, Feb. 2004. [Google Scholar]
9. S. Huang, L. N. Tang, J. P. Hupy, Y. Wang, and G. F. Shao, “A commentary review on the use of normalized difference vegetation index (NDVI) in the era of popular remote sensing,” J. For. Res., vol. 32, no. 1, pp. 1–6, Feb. 2021. doi: 10.1007/s11676-020-01155-1. [Google Scholar] [CrossRef]
10. Z. Xie et al., “Boosting night-time scene parsing with learnable frequency,” IEEE Trans. Image Process., vol. 32, pp. 2386–2398, Apr. 2023. doi: 10.1109/TIP.2023.3267044. [Google Scholar] [PubMed] [CrossRef]
11. X. Tan, K. Xu, Y. Cao, Y. Zhang, L. Ma and R. W. H. Lau, “Night-time scene parsing with a large real dataset,” IEEE Trans. Image Process., vol. 30, pp. 9085–9098, Oct. 2021. doi: 10.1109/TIP.2021.3122004. [Google Scholar] [PubMed] [CrossRef]
12. P. Singh and M. K. Muchahari, “Solving multi-objective optimization problem of convolutional neural network using fast forward quantum optimization algorithm: Application in digital image classification,” Adv. Eng. Softw., vol. 176, no. 4, pp. 103370, Mar. 2023. doi: 10.1016/j.advengsoft.2022.103370. [Google Scholar] [CrossRef]
13. W. Wang et al., “Pyramid vision transformer: A versatile backbone for dense prediction without convolutions,” in Proc. IEEE/CVF Int. Conf. Comput. Vis., 2021, pp. 568–578. [Google Scholar]
14. Z. Xie, S. Wang, Q. Yu, X. Tan, and Y. Xie, “CSFwinformer: Cross-space-frequency window transformer for mirror detection,” IEEE Trans. Image Process., vol. 33, pp. 1853–1867, 2024. doi: 10.1109/TIP.2024.3372468. [Google Scholar] [PubMed] [CrossRef]
15. S. Foga et al., “Cloud detection algorithm comparison and validation for operational Landsat data products,” Remote Sens. Environ., vol. 194, pp. 379–390, 2017. [Google Scholar]
16. M. J. Hughes and D. J. Hayes, “Automated detection of cloud and cloud shadow in single-date Landsat imagery using neural networks and spatial post-processing,” Remote Sens., vol. 6, no. 6, pp. 4907–4926, 2014. doi: 10.3390/rs6064907. [Google Scholar] [CrossRef]
17. S. Mohajerani and P. Saeedi, “Cloud-Net: An end-to-end cloud detection algorithm for Landsat 8 imagery,” in IGARSS 2019-2019 IEEE Int. Geosci. Remote Sens. Symp., Yokohama, Japan, IEEE, 2019, pp. 1029–1032. [Google Scholar]
18. A. Hollstein, K. Segl, L. Guanter, M. Brell, and M. Enesco, “Ready-to-use methods for the detection of clouds, cirrus, snow, shadow, water and clear sky pixels in Sentinel-2 MSI images,” Remote Sens., vol. 8, no. 8, pp. 666, 2016. doi: 10.3390/rs8080666. [Google Scholar] [CrossRef]
19. L. Baetens and O. Hagolle, Sentinel-2 Reference Cloud Masks Generated by an Active Learning Method. Type: Dataset, 2018. [Google Scholar]
20. Z. Li, H. Shen, H. Li, G. Xia, P. Gamba, and L. Zhang, “Multi-feature combined cloud and cloud shadow detection in GaoFen-1 wide field of view imagery,” Remote Sens. Environ., vol. 191, pp. 342–358, 2017. doi: 10.1016/j.rse.2017.01.026. [Google Scholar] [CrossRef]
21. Q. He, X. Sun, Z. Yan, and K. Fu, “DABNet: Deformable contextual and boundary-weighted network for cloud detection in remote sensing images,” IEEE Trans. Geosci. Remote Sens., vol. 60, pp. 1–16, 2021. doi: 10.1109/TGRS.2020.3045474. [Google Scholar] [CrossRef]
22. Z. Li et al., “Deep learning based cloud detection for medium and high resolution remote sensing images of different sensors,” ISPRS J. Photogramm. Remote Sens., vol. 150, pp. 197–212, 2019. doi: 10.1016/j.isprsjprs.2019.02.017. [Google Scholar] [CrossRef]
23. Z. Zhu, S. Qiu, B. He, and C. Deng, “Cloud and cloud shadow detection for Landsat images: The fundamental basis for analyzing Landsat,” Remote Sens. Time Series Image Process., vol. 01, pp. 3–23, 2018. [Google Scholar]
24. Z. W. Li, H. F. Shen, Q. H. Weng, Y. Z. Zhang, P. Dou and L. P. Zhang, “Cloud and cloud shadow detection for optical satellite imagery: Features, algorithms, validation, and prospects,” ISPRS J. Photogramm. Remote Sens., vol. 188, pp. 89–108, Jun. 2022. doi: 10.1016/j.isprsjprs.2022.03.020. [Google Scholar] [CrossRef]
25. M. Wang and W. Shi, “Cloud masking for ocean color data processing in the coastal regions,” IEEE Trans. Geosci. Remote Sens., vol. 44, no. 11, pp. 3196, 2006. doi: 10.1109/TGRS.2006.876293. [Google Scholar] [CrossRef]
26. M. Derrien and H. Le Gléau, “MSG/SEVIRI cloud mask and type from SAFNWC,” Int. J. Remote Sens., vol. 26, no. 21, pp. 4707–4732, 2005. [Google Scholar]
27. Z. Zhu and C. E. Woodcock, “Object-based cloud and cloud shadow detection in Landsat imagery,” Int. J. Remote Sens., vol. 118, no. 24, pp. 83–94, 2012. doi: 10.1016/j.rse.2011.10.028. [Google Scholar] [CrossRef]
28. C. H. Lin, B. Y. Lin, K. Y. Lee, and Y. C. Chen, “Radiometric normalization and cloud detection of optical satellite images using invariant pixels,” ISPRS J. Photogramm. Remote Sens., vol. 106, no. D24, pp. 107–117, 2015. doi: 10.1016/j.isprsjprs.2015.05.003. [Google Scholar] [CrossRef]
29. J. H. Bian, A. N. Li, Q. N. Liu, and C. Q. Huang, “Cloud and snow discrimination for CCD images of HJ-1A/B constellation based on spectral signature and spatio-temporal context,” Remote Sens., vol. 8, no. 1, pp. 31, Jan. 2016. doi: 10.3390/rs8010031. [Google Scholar] [CrossRef]
30. N. Ghasemian and M. Akhoondzadeh, “Introducing two random forest based methods for cloud detection in remote sensing images,” Adv. Space Res., vol. 62, no. 2, pp. 288–303, 2018. doi: 10.1016/j.asr.2018.04.030. [Google Scholar] [CrossRef]
31. P. F. Li, L. M. Dong, H. C. Xiao, and M. L. Xu, “A cloud image detection method based on SVM vector machine,” Neurocomputing, vol. 169, no. 1, pp. 34–42, Dec. 2015. doi: 10.1016/j.neucom.2014.09.102. [Google Scholar] [CrossRef]
32. G. Mateo-García, L. Gómez-Chova, and G. Camps-Valls, “Convolutional neural networks for multispectral image cloud masking,” in 2017 IEEE Int. Geosci. Remote Sens. Symp. (IGARSS), Fort Worth, TX, USA, IEEE, 2017, pp. 2255–2258. [Google Scholar]
33. M. Yasir, J. H. Wan, S. W. Liu, S. Hui, M. M. Xu and M. Hossain, “Coupling of deep learning and remote sensing: A comprehensive systematic literature review,” Int. J. Remote Sens., vol. 44, no. 1, pp. 157–193, 2023. doi: 10.1080/01431161.2022.2161856. [Google Scholar] [CrossRef]
34. X. Tan et al., “Positive-negative receptive field reasoning for omni-supervised 3D segmentation,” IEEE Trans. Pattern Anal. Mach. Intell., vol. 45, no. 12, pp. 15328–15344, Dec. 2023. doi: 10.1109/TPAMI.2023.3319470. [Google Scholar] [PubMed] [CrossRef]
35. T. Sun, Z. Zhang, X. Tan, Y. Qu, and Y. Xie, “Image understands point cloud: Weakly supervised 3D semantic segmentation via association learning,” IEEE Trans. Image Process., vol. 33, pp. 1838–1852, 2024. [Google Scholar] [PubMed]
36. X. Li et al., “PromptAD: Learning prompts with only normal samples for few-shot anomaly detection,” IEEE Trans. Image Process., vol. 33, pp. 1838–1852, 2024. [Google Scholar]
37. P. Singh and G. Dhiman, “Uncertainty representation using fuzzy-entropy approach: Special application in remotely sensed high-resolution satellite images (RSHRSIs),” Appl. Soft Comput., vol. 72, no. 6, pp. 121–139, Nov. 2018. doi: 10.1016/j.asoc.2018.07.038. [Google Scholar] [CrossRef]
38. Y. Chen et al., “Boosting semi-supervised learning by exploiting all unlabeled data,” in Proc. IEEE/CVF Conf. Comput. Vis. Pattern Recognit., 2023, pp. 7548–7557. [Google Scholar]
39. S. Sun, B. Zhao, M. Mateen, X. Chen, and J. Wen, “Mask guided diverse face image synthesis,” Front. Comput. Sci., vol. 16, no. 163311, pp. 1947, Nov. 2021. doi: 10.1007/s11704-020-0400-7. [Google Scholar] [CrossRef]
40. Y. Liu et al., “A survey of visual transformers,” IEEE Trans. Neural Netw. Learn. Syst., pp. 1–21, Mar. 2023. doi: 10.1109/tnnls.2022.3227717. [Google Scholar] [PubMed] [CrossRef]
41. J. Devlin, M. W. Chang, K. Lee, and K. Toutanova, “BERT: Pre-training of deep bidirectional transformers for language understanding,” arXiv preprint arXiv:1810.04805, 2018. [Google Scholar]
42. Y. H. Liu et al., “RoBERTa: A robustly optimized BERT pretraining approach,” Inf. Syst. Res., Jul. 2019. doi: 10.48550/arXiv.1907.11692. [Google Scholar] [CrossRef]
43. T. Brown et al., “Language models are few-shot learners,” Adv. Neural. Inf. Process. Syst., vol. 33, pp. 1877–1901, 2020. [Google Scholar]
44. A. Dosovitskiy et al., “An image is worth 16 × 16 words: Transformers for image recognition at scale,” arXiv preprint arXiv:2010.11929, 2020. [Google Scholar]
45. N. Carion, F. Massa, G. Synnaeve, N. Usunier, A. Kirillov and S. Zagoruyko, “End-to-end object detection with transformers,” in European Conf. Comput. Vis., Glasgow, UK, Springer, 2020, pp. 213–229. [Google Scholar]
46. A. Radford et al., “Learning transferable visual models from natural language supervision,” in Int. Conf. Mach. Learn., PMLR, 2021, pp. 8748–8763. [Google Scholar]
47. H. Zhang et al., “Learning task-aware language-image representation for class-incremental object detection,” Proc. AAAI Conf. Art. Intell., vol. 38, no. 7, pp. 7096–7104, 2024. doi: 10.1609/aaai.v38i7.28537. [Google Scholar] [CrossRef]
48. G. Te, Y. Liu, W. Hu, H. Shi, and T. Mei, “Edge-aware graph representation learning and reasoning for face parsing,” in Comput. Vis. ECCV 2020: 16th European Conf. Proc. Part XII 16, 2020, Glasgow, UK, Springer, Aug. 23–28, 2020, pp. 258–274. [Google Scholar]
49. I. Loshchilov and F. Hutter, “Decoupled weight decay regularization,” arXiv preprint arXiv: 1711.05101, 2017. [Google Scholar]
50. S. H. Gao, M. M. Cheng, K. Zhao, X. Y. Zhang, M. H. Yang and P. Torr, “Res2Net: A new multi-scale backbone architecture,” IEEE Trans. Pattern Anal. Mach. Intell., vol. 43, no. 2, pp. 652–662, Feb. 2021. doi: 10.1109/TPAMI.2019.2938758. [Google Scholar] [PubMed] [CrossRef]
51. K. He, X. Zhang, S. Ren, and J. Sun, “Deep residual learning for image recognition,” in Proc. IEEE Conf. Comput. Vis. Pattern Recognit., Las Vegas, NV, USA, 2016, pp. 770–778. [Google Scholar]
52. S. Xie, R. Girshick, P. Dollár, Z. Tu, and K. He, “Aggregated residual transformations for deep neural networks,” in Proc. IEEE Conf. Comput. Vis. Pattern Recognit., Honolulu, HI, USA, 2017, pp. 1492–1500. [Google Scholar]
53. L. C. Chen, G. Papandreou, F. Schroff, and H. Adam, “Rethinking atrous convolution for semantic image segmentation,” arXiv preprint arXiv:1706.05587, 2017. [Google Scholar]
Cite This Article
 Copyright © 2024 The Author(s). Published by Tech Science Press.
This work is licensed under a Creative Commons Attribution 4.0 International License , which permits unrestricted use, distribution, and reproduction in any medium, provided the original work is properly cited.
 Downloads
 Citation Tools