
 Submit a Paper
 Propose a Special lssue
 Open Access
ARTICLE

Two Stages Segmentation Algorithm of Breast Tumor in DCE-MRI Based on Multi-Scale Feature and Boundary Attention Mechanism
1 School of Automation, Harbin University of Science and Technology, Harbin, 150080, China
2 Heilongjiang Provincial Key Laboratory of Complex Intelligent System and Integration, Harbin, 150080, China
3 School of Computer Engineering Technology, Guangdong Institute of Science and Technology, Zhuhai, 519090, China
* Corresponding Author: Bing Li. Email:
(This article belongs to the Special Issue: Deep Learning in Computer-Aided Diagnosis Based on Medical Image)
Computers, Materials & Continua 2024, 80(1), 1543-1561. https://doi.org/10.32604/cmc.2024.052009
Received 20 March 2024; Accepted 24 May 2024; Issue published 18 July 2024
 View Full Text
 Download PDF
Abstract
Nuclear magnetic resonance imaging of breasts often presents complex backgrounds. Breast tumors exhibit varying sizes, uneven intensity, and indistinct boundaries. These characteristics can lead to challenges such as low accuracy and incorrect segmentation during tumor segmentation. Thus, we propose a two-stage breast tumor segmentation method leveraging multi-scale features and boundary attention mechanisms. Initially, the breast region of interest is extracted to isolate the breast area from surrounding tissues and organs. Subsequently, we devise a fusion network incorporating multi-scale features and boundary attention mechanisms for breast tumor segmentation. We incorporate multi-scale parallel dilated convolution modules into the network, enhancing its capability to segment tumors of various sizes through multi-scale convolution and novel fusion techniques. Additionally, attention and boundary detection modules are included to augment the network’s capacity to locate tumors by capturing nonlocal dependencies in both spatial and channel domains. Furthermore, a hybrid loss function with boundary weight is employed to address sample class imbalance issues and enhance the network’s boundary maintenance capability through additional loss. The method was evaluated using breast data from 207 patients at Ruijin Hospital, resulting in a 6.64% increase in Dice similarity coefficient compared to the benchmark U-Net. Experimental results demonstrate the superiority of the method over other segmentation techniques, with fewer model parameters.Keywords
In 2022, breast cancer became the most diagnosed cancer among women in the United States, with 4.05 million cases [1]. This malignancy not only affects physical health but also imposes significant psychological stress globally. According to the National Cancer Center, female breast cancer represents 11.2% of global incidence and 9.2% of global mortality, placing China at the forefront of this challenge [2].
Among various diagnostic techniques, DCE-MRI stands out for its superior image quality without radiation exposure, utilizing the microvascular system in diseased and normal tissues. This contrasts with traditional methods such as molybdenum targets, ultrasound, and X-ray, which often provide lower resolution [3]. Therefore, the Chinese Anti-Cancer Association’s guidelines for the diagnosis and treatment of breast cancer put forward that MRI images should be used as a routine examination method for breast cancer imaging to find suspicious diseased areas in the breast [4].
The increasing prevalence of breast cancer necessitates that radiologists review a substantial volume of complex images daily, a task demanding intricate knowledge and susceptible to missed detections due to fatigue. Although some semi-automatic segmentation methods exist, their complexity restricts their clinical utility, highlighting the necessity for reliable, fully automated segmentation algorithms. These advancements are essential not only for clinical accuracy but also for the progression of scientific research. In particular, convolutional neural network (CNN)-based methods for breast tumor segmentation have minimized the requirement for manual intervention. Nevertheless, the intricate backgrounds in MRI images and the simplistic nature of numerous network architectures impede effective training and result in suboptimal segmentation accuracy [5].
This paper presents a two-stage deep neural network model that utilizes multi-scale features and a boundary attention mechanism for breast tumor region segmentation in DCE-MRI. This paper significantly advances the field in four critical aspects:
1) Two stages segmentation: Initially, the breast region of interest (BROI) is identified, followed by detailed segmentation using a multi-scale attention fusion network. This approach ensures precise segmentation from coarse to fine details, utilizing both the BROI and MRI images as dual inputs.
2) Multi-scale parallel dilated convolution fusion module (MSP-DC): Our model includes a fusion module that uses varied dilation rates to capture features at multiple scales, coupled with a unique feature fusion technique to handle tumors of different sizes more effectively.
3) Boundary-attention hybrid decoding module (BAHD): This module focuses on the tumor region, optimizing boundary delineation and enhancing feature relevance, thereby improving segmentation accuracy.
4) Mixed weight boundary loss function: Comprising Dice coefficients, binary cross-entropy loss, and additional boundary loss (BCELoss), this function addresses the challenges posed by irregular tumor shapes, class imbalance, and indistinct boundaries.
In recent years, limited methods have emerged for segmenting breast tumors in DCE-MRI. At present, the primary methods for segmenting breast tumors can be broadly categorized into five groups: the threshold-based method [6], the region-based method [7], the contour model-based method [8], the traditional machine learning method [9] and deep learning method [10], among which the latter two methods have obvious advantages in segmentation effect.
With the extensive utilization of machine learning in image segmentation tasks, Chen et al. [11] used fuzzy C-means to segment tumors, which requires manually drawing the region of interest as an initialization step. Maicas et al. [12] proposed a global breast mass segmentation method utilizing depth semantic segmentation, which firstly used a neural network to generate prior shapes, input the last figures into a random forest classifier, and finally generated breast masses. McClymont et al. [13] developed an automatic breast tumor segmentation method based on Mean Shift clustering and graph cuts on a multimodal breast MRI dataset. Arjmand et al. [14] achieved breast tumor segmentation by screening tumor features with high intensity characteristics and employing the K-means clustering method. These methods often overlook the potential heterogeneity between artificially engineered features and subsequent learning models by treating feature extraction and model training as separate tasks.
Deep learning algorithms have significantly progressed in recent years with improved algorithm computing power and data scale. Long et al. [15] introduced a fully convolutional network (FCN) capable of processing inputs of variable sizes and producing corresponding-sized outputs, achieving end-to-end segmentation tasks. Ronneberger et al. [16] expanded upon the FCN architecture by introducing the U-Net model. The contraction-expansion technique captures contextual information and achieves precise target localization, yielding favorable outcomes in medical image segmentation. Adoui et al. [17] applied networks derived from SegNet and U-Net for breast DCE-MRI image segmentation individually. However, the segmentation results exhibited low accuracy owing to the constraints of a limited dataset and a singular network structure. Zhang et al. [18] introduced a hierarchical learning method for breast tumor segmentation. First, the complete convolution network was employed to extract the breast region. Then, two other FCN models were trained to acquire and enhance the initial segmentation results. Still, this method could not effectively segment the tumors related to hematoma and minimal tumors.
In addition, in the research of segmentation methods in other fields of medical images, to improve the precision of pixel-level prediction, many researchers add attention mechanism [19], boundary detection [20], and multi-scale context information [21] to the network, thus enhancing the feature representation of pixel-level prediction. Valanarasu et al. [22] introduced UNeXt, a network incorporating a Convolutional Multilayer Perceptron (MLP). The model implements a tokenized MLP block for improved characterization and projection of convolutional features. Shao et al. [23] introduced multi-scale axial attention (MAC) and proposed MCANet, enhancing global information extraction by utilizing dual-cross attention between two parallel axial attentions. This method demonstrates promising results in brain lesion segmentation tasks, showing high accuracy and robustness. Those methods have improved the segmentation accuracy compared with other methods. Sun et al. [24] improved model segmentation performance by integrating transformer into the U-shaped neural network architecture. They employed an asymmetrical structure, combining local and global modules, to introduce a lightweight U-shaped cascade fusion network (LUCF-Net). This model demonstrated outstanding segmentation results on multi-organ datasets in CT format and MRI cardiac datasets. Ruan et al. [25] introduced the Vision Mamba U-Net (VM-UNet), a novel U-shaped architecture employing State Space Models for efficient medical image segmentation. Demonstrating strong performance on skin lesion segmentation datasets, this model lays the groundwork for enhancing the efficiency of future SSM-based systems. While previous studies have investigated the utilization of multi-scale features or attention mechanisms for medical image processing, especially in tumor segmentation, existing models often lack efficient integration of multi-scale contextual information and accurate boundary detection. This inadequacy frequently results in an increase in model parameters, rendering training and convergence more challenging. This paper introduces a multi-scale boundary attention fusion network designed for breast tumor segmentation. It enhances the network’s ability to extract features at different scales by employing a multi-scale parallel dilated convolution fusion module. Furthermore, the boundary attention mixing module enhances the network’s capability to preserve tumor boundaries, thereby facilitating precise segmentation of breast tumors.
This paper introduces a two-stage deep neural network utilizing multi-scale features and boundary attention mechanism to realize accurate segmentation of DCE-MRI breast tumors, as shown in Fig. 1. The original image undergoes preprocessing, and the resulting image is then fed into the Breast Segmentation Network (BSN). This network outputs the Region of Interest (ROI) that specifically targets the breast. Concurrently, both the Breast Region of Interest (BROI) and Magnetic Resonance Imaging (MRI) images serve as inputs to the Breast Tumor Segmentation Network (BTSN). This network employs a combination of multi-scale hole convolution and a boundary attention mechanism to achieve precise tumor segmentation.
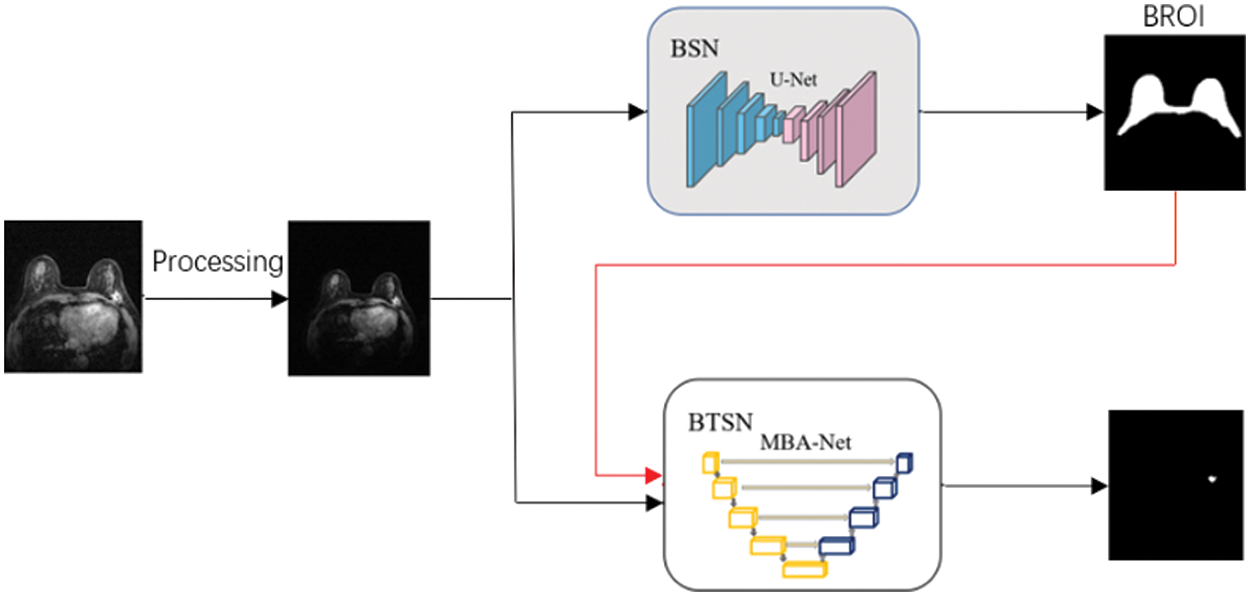
Figure 1: DCE-MRI breast tumor segmentation method
3.1 Breast Region of Interest Segmentation
The background of MRI imaging is complex, and there are tissues, such as the heart, chest wall, muscle, and fat, that seriously affect and interfere with the accurate automatic segmentation of breast tumors. Therefore, a rough breast region (BROI) is extracted, and the tissues and organs other than the breast region are removed, which is beneficial to accurately segmenting breast tumors in the next stage. U-Net [16] is used as the breast region segmentation network. MRI images are used as the network’s input, and the BROI size 512 × 512 is the output.
The shielding strategy of BROI is divided into hard shielding and soft shielding. The hard shielding strategy uses the BROI directly as the region of interest of the input image so that most tissues and organs can be removed directly, as shown in Fig. 2a. Qin et al. [26] used this masking strategy in the process of breast tumor segmentation. Another hard masking method uses BROI to remove the tumor information of non-breast regions from the breast tumor segmentation, which results in the post-processing stage, as shown in Fig. 2b. While these two hard shielding methods are effective in eliminating complex backgrounds, the inaccuracies in the Breast Region of Interest (BROI) and the presence of tumors at the breast’s boundary can result in the loss of tumor information along these edges. This can lead to irrecoverable errors in the segmentation process. This paper adopts a soft shielding strategy to realize BROI-guided tumor segmentation. BROI and MRI images form two channels as the network’s input, which removes complex backgrounds and organs while preserving the tumor details present in the original MRI image, as shown in Fig. 2c.
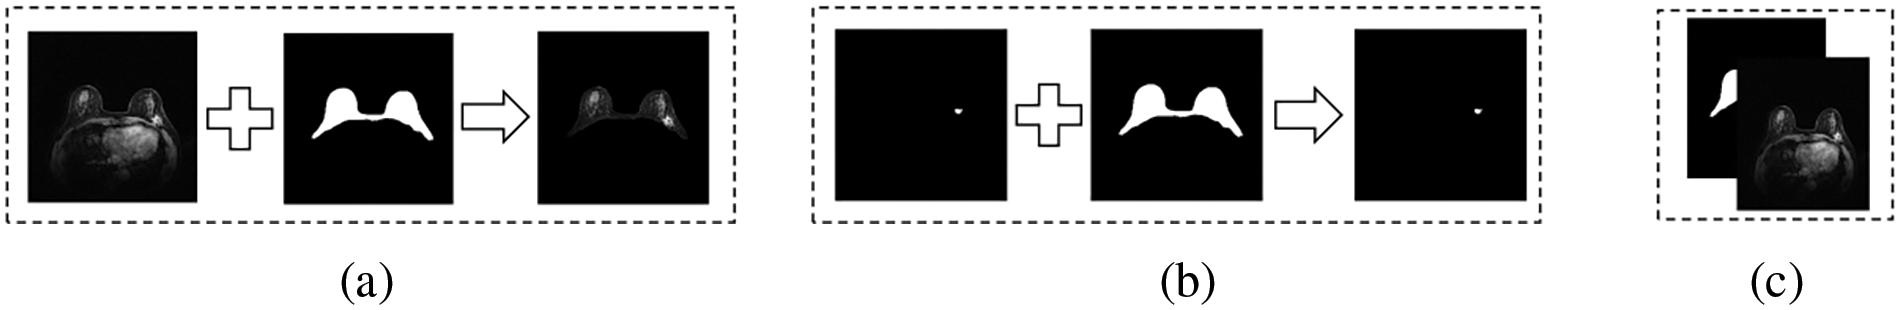
Figure 2: Shielding strategy of BROI
Although background and organs are excluded by BROI, there is still considerable confusing information within the breast area. Therefore, this paper introduces a multi-scale boundary attention fusion network (MBA-Net). As depicted in Fig. 3, the network utilizes an encoding-decoding architecture and transmits low-level feature information via skip connections. The network takes two channels composed of BROI and MRI images as input. The encoding phase comprises five feature extraction layers and four down-sampling layers. Each layer conducts feature extraction using multi-scale parallel dilated convolution (MSP-DC) and employs a step-by-step superposition method to fuse and transfer feature information. The decoding phase consists of five feature fusion layers and four up-sampling rounds. Each layer integrates the up-sampled feature map with the low-level feature map from the encoding phase, under the guidance of the dual-domain attention module. Moreover, the boundary detection module (BD) is utilized to identify the boundaries of the fused feature map, thereby generating an additional boundary loss for further refinement. The network decoder utilizes bilinear up-sampling to restore the resolution and channel count of the feature map. The network continuously updates using the boundary mixed loss function and generates the tumor segmentation map as output.
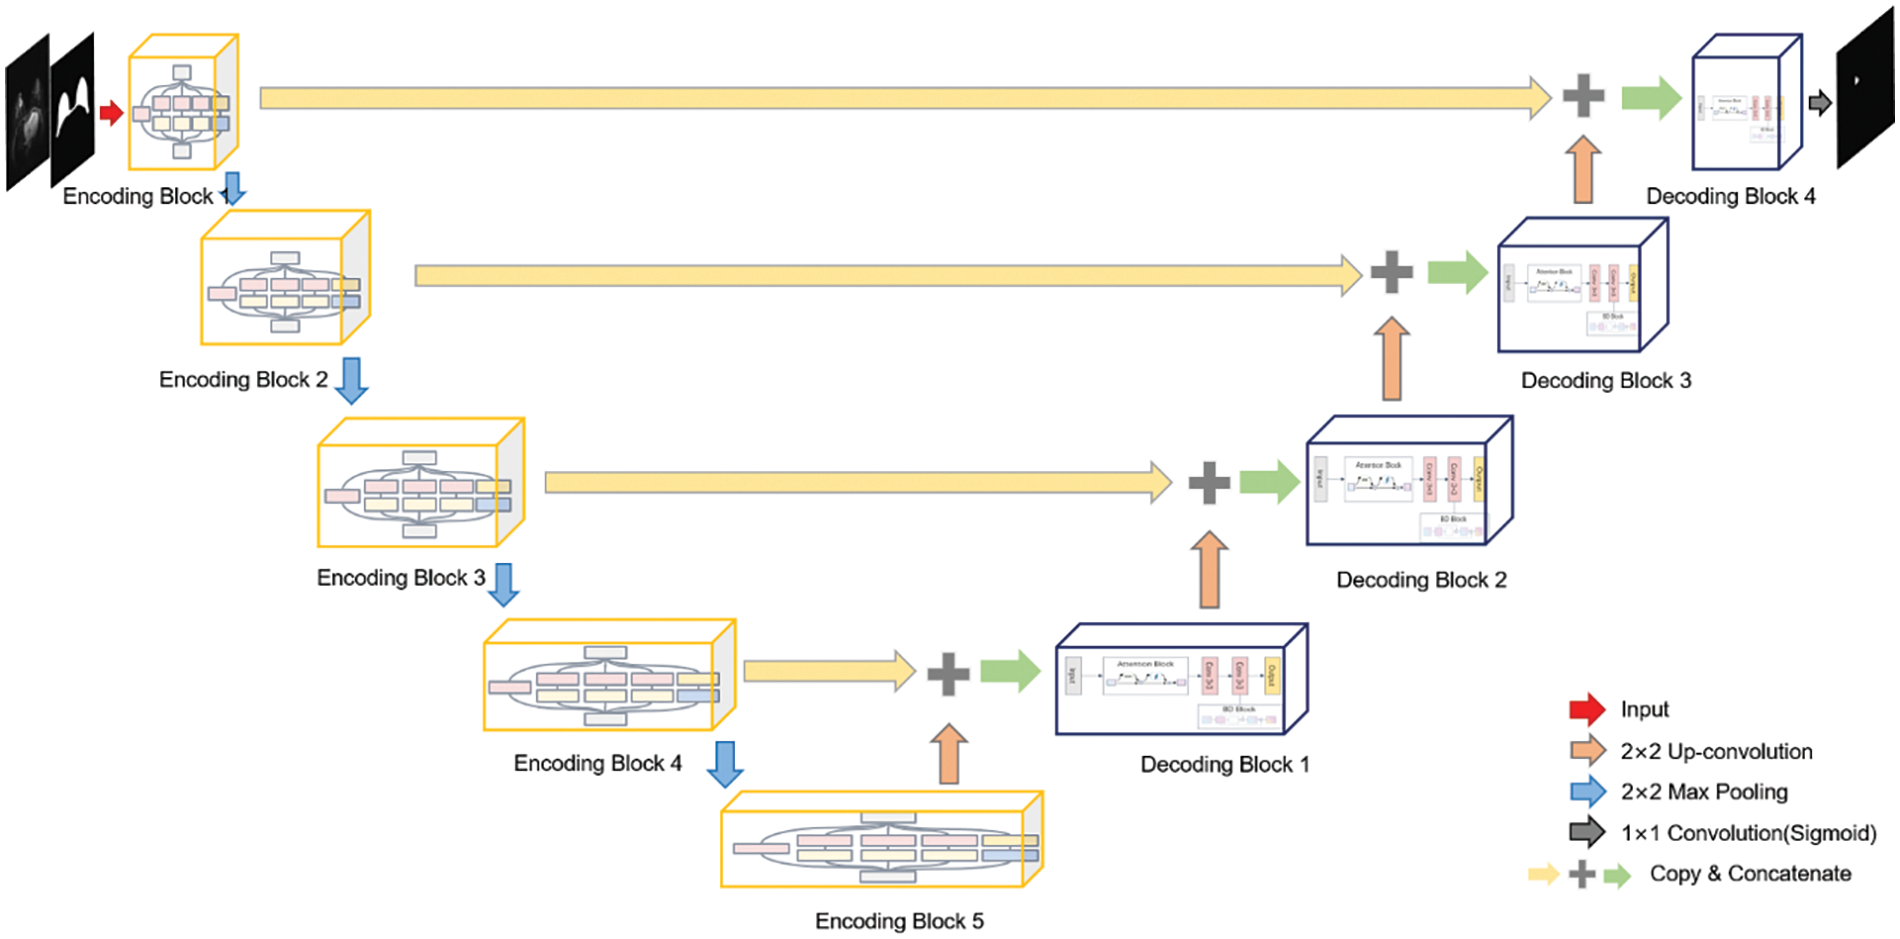
Figure 3: Structure diagram of breast tumor segmentation network
3.2.1 Multi-Scale Parallel Dilated Convolution Module
Multi-scale context information aids the network in extracting features from objects of varying sizes within the image. This paper introduces the multi-scale parallel dilated convolution module (MSP-DC) displayed in Fig. 4.
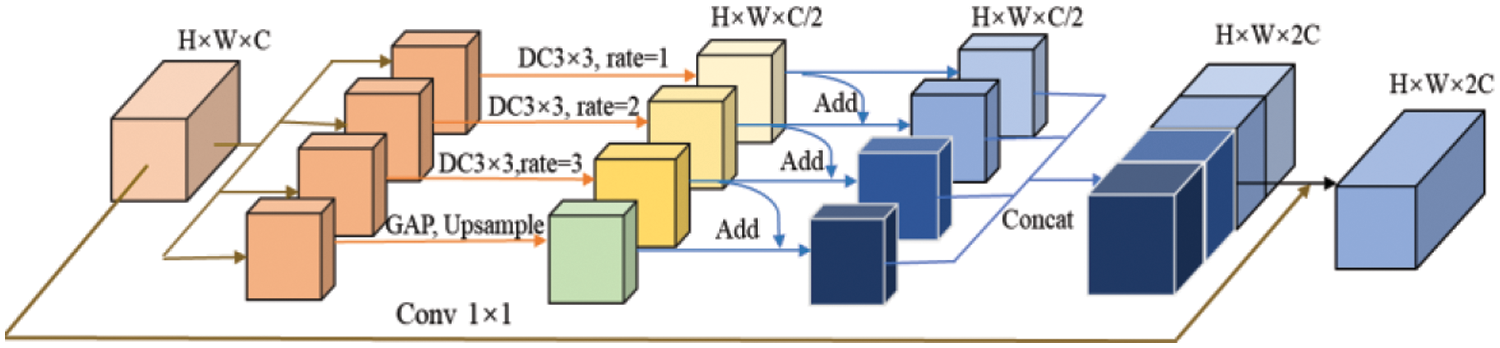
Figure 4: Multi-scale parallel dilated convolution module
The MSP-DC module also uses a convolution module with a kernel size of
where
This paper adds a fusion method of adding feature elements step by step before channel fusion. The features obtained from the dilated convolution, with a specified dilation rate, are summed pixel-wise towards the right. Finally, the global average pooling branch contains features extracted from dilated convolutional layers with different hole rates, thereby enhancing the convolutional layer’s ability to extract tumor features of different sizes. After the features are fused in this way, the features of each branch are
3.2.2 Boundary-Attention Hybrid Decoding Module
To effectively integrate the high-level features obtained from the up-sampling with the low-level features of the coding part, this paper proposes an attention-boundary detection hybrid decoding module, as shown in Fig. 5. The boundary-attention hybrid decoding module (BAHD) comprises dual-domain attention guidance (DAG), a
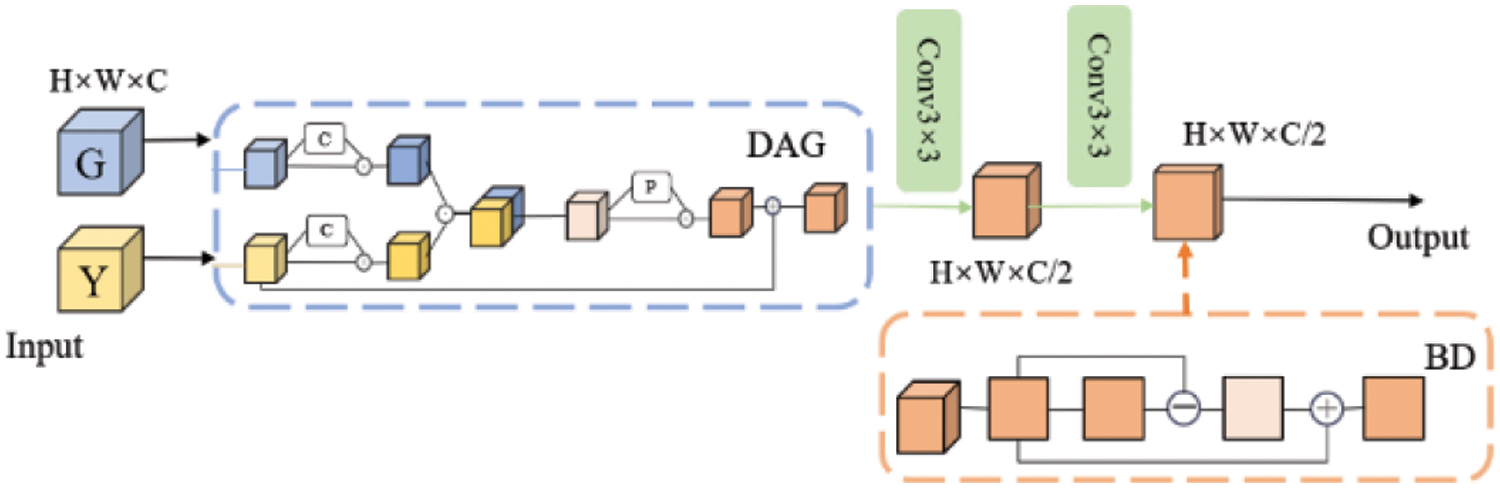
Figure 5: Boundary-attention hybrid decoding module
The dual-domain attention guidance module encompasses both channel attention [19] and spatial attention [19], illustrated in Fig. 6a. Spatial attention and channel attention are interconnected in series. The channel attention module depicted in Fig. 6b is formulated as follows:
where

Figure 6: Dual-domain attention structure diagram
The input feature map
The spatial attention module is shown in Fig. 6c, along with the following formula:
where
This module map is obtained from the output feature map of the channel attention module. The process begins with applying a global maximum pooling and average pooling based on the feature map’s channel dimensions, resulting in two
Due to the overlapping of tumors with dense breast tissue in the breast region, issues such as blurred boundaries and inaccurate segmentation may occur in the segmentation results. To enhance the ability to preserve tumor boundaries and better utilize the tumor edge and spatial cues in the output feature maps fused with low-level and high-level detail information at the decoding end, this paper designs a Boundary Detection (BD) unit. This unit performs
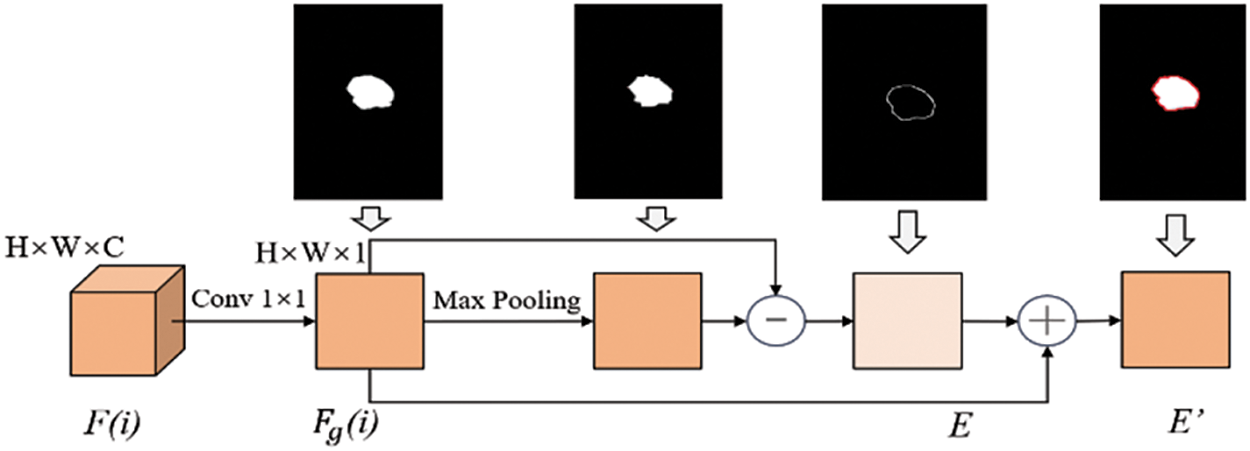
Figure 7: Structure diagram of boundary detection
3.2.3 Boundary Mixed Weight Loss Function
As shown in Fig. 5, we have added a boundary detection module at each layer of the network decoding end. Therefore, four boundary graphs and four segmentation results of breast tumors will be generated at the decoding end of the network. In addition, the network will also generate the final segmentation results of breast tumors. Therefore, the network adopts a mixed loss function involving the segmentation loss function and an extra boundary loss function as its overall loss function. The formula is as follows:
where
where
where
where
4 Experimental Results and Analysis
4.1 Data Set and Preprocessing
The DCE-MRI image data used in this experiment is a self-built clinical data set from Ruijin Hospital, affiliated with Shanghai Jiaotong University School of Medicine, with 207 cases. By default, the image defaults to the transverse direction, and the image size is
The server used in this study is equipped with Intel (R) Xeon (R) Silver 4216 CPU @ 2.10 GHz (2 CPU, 16 cores, 32 threads, 128 GB memory); the GPU is configured as GeForce RTX3070. Pytorch1.5 deep learning framework and Python3.6 programming language are used, and multiple GPUs are trained in parallel. In the experiment, the Adam optimizer is used for gradient descent, and the parameters are set as
To intuitively reflect the difference between our proposed network and the contrasting network, this paper will adopt the following classic medical image segmentation evaluation indicators: Dice Similarity Coefficient (DSC), Intersection of Union (IOU), Precision, Recall, Accuracy (ACC) and the distance index is Hausdorff Distance (HD).
4.3.2 Experimental Results and Analysis of Breast BROI Segmentation
At the initial stage of the model, U-Net is utilized to segment the breast region of interest, and the segmentation results are presented in Table 1. The Dice coefficient achieved on the test set is 0.9428, indicating the accurate extraction of the breast region of interest by the network. Additionally, Fig. 8 illustrates the specific results of BROI segmentation. The three rows depict the MRI images of three cases containing breast tumors, the labels of the BROI regions manually marked by professionals, and the BROI regions predicted by the U-Net network. The red area in Fig. 8 effectively covers the breast region of interest and extends to both ends of the chest, ensuring comprehensive coverage of the breast area and minimizing the risk of omission. Simultaneously, the model can accurately extract the BROI even when dealing with a small breast area.
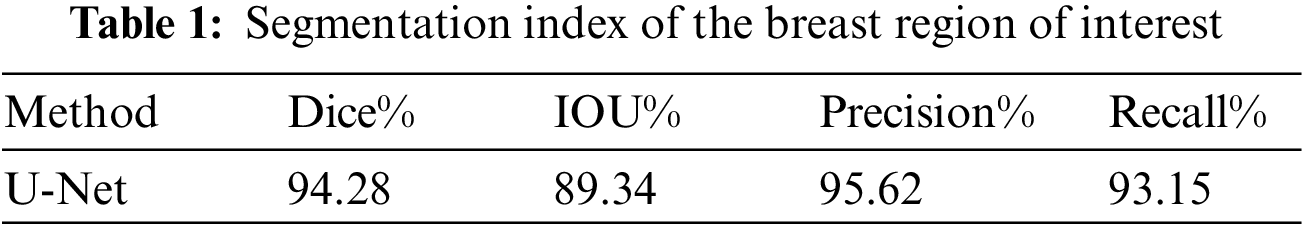

Figure 8: Segmentation results of the breast region of interest
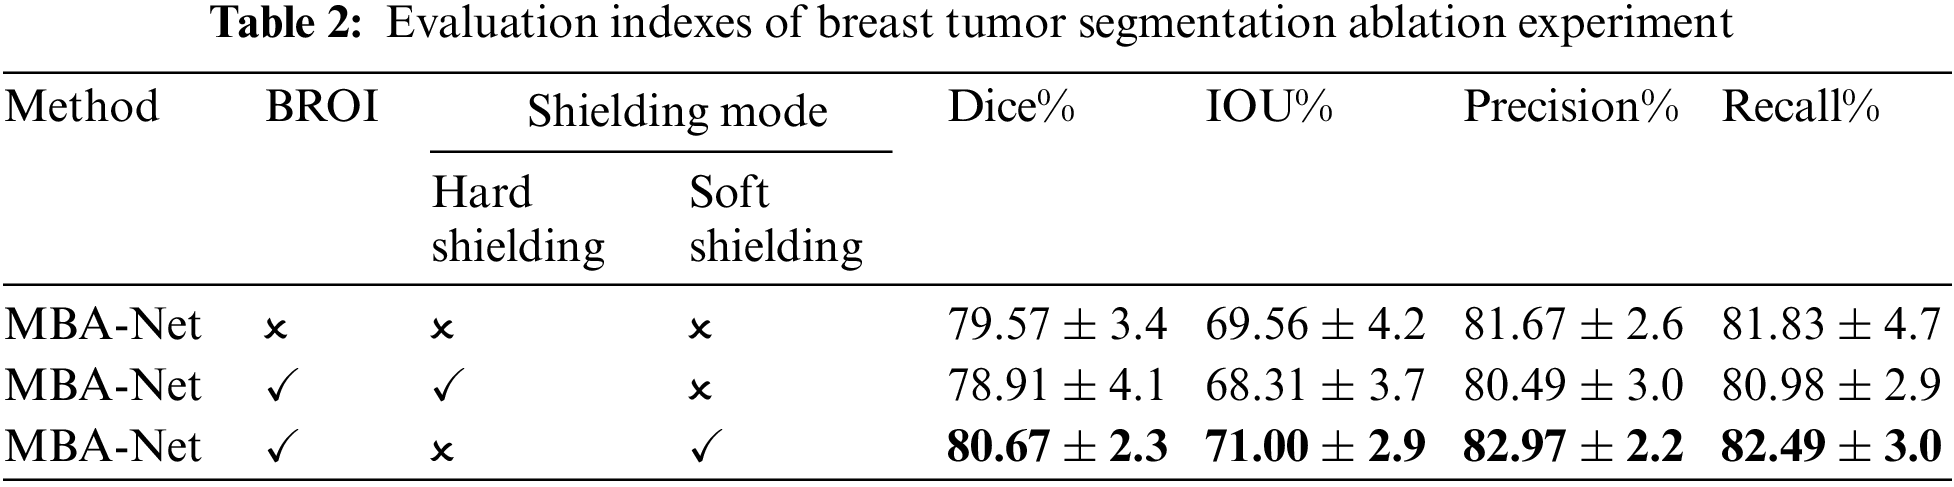
This paper validates the effectiveness of the adopted soft shielding method and the BROI-guided tumor segmentation strategy through experimental results, as presented in Table 2. The table reveals that when BROI is applied using a hard masking method, both the DSC and IoU of the tumor segmentation results exhibit a decrease, even lower than the network without utilizing BROI. Conversely, the segmentation results using the soft shielding strategy guided by BROI outperform other methods across all metrics, with significant improvements in precision and recall. This is because utilizing the BROI-guided soft shielding strategy to eliminate complex backgrounds and organs reduces the network’s sensitivity to high-intensity regions within the chest cavity. This enables the network to focus on the breast area while retaining all information in the tumor area of the input image. Moreover, it preserves the spatial position of the tumor within the entire image, enabling subsequent attention modules to enhance the network’s capability for global tumor localization by capturing long-range non-local dependencies in the spatial domain. The incorporation of BROI significantly reduces false positives and negatives, demonstrating the superiority of the two-stage network over single-stage segmentation networks in addressing class imbalance and poor image contrast. Furthermore, the coarse-to-fine segmentation strategy notably enhances the network’s performance in segmentation tasks.
4.3.3 Experimental Results and Analysis of Breast Tumor Segmentation and Ablation
An ablation experiment was conducted in this paper to validate the proposed model structure. The basic network framework for the ablation experiments was U-Net. It was utilized to individually evaluate the effectiveness of the multi-scale parallel dilated convolution module (MSP-DC), dual-domain attention guidance module (DAG), and the boundary detection module (BD). These modules were sequentially added to the basic network, and the evaluation metrics of the model are presented in Table 3. The segmentation result of an example is depicted in Fig. 9.
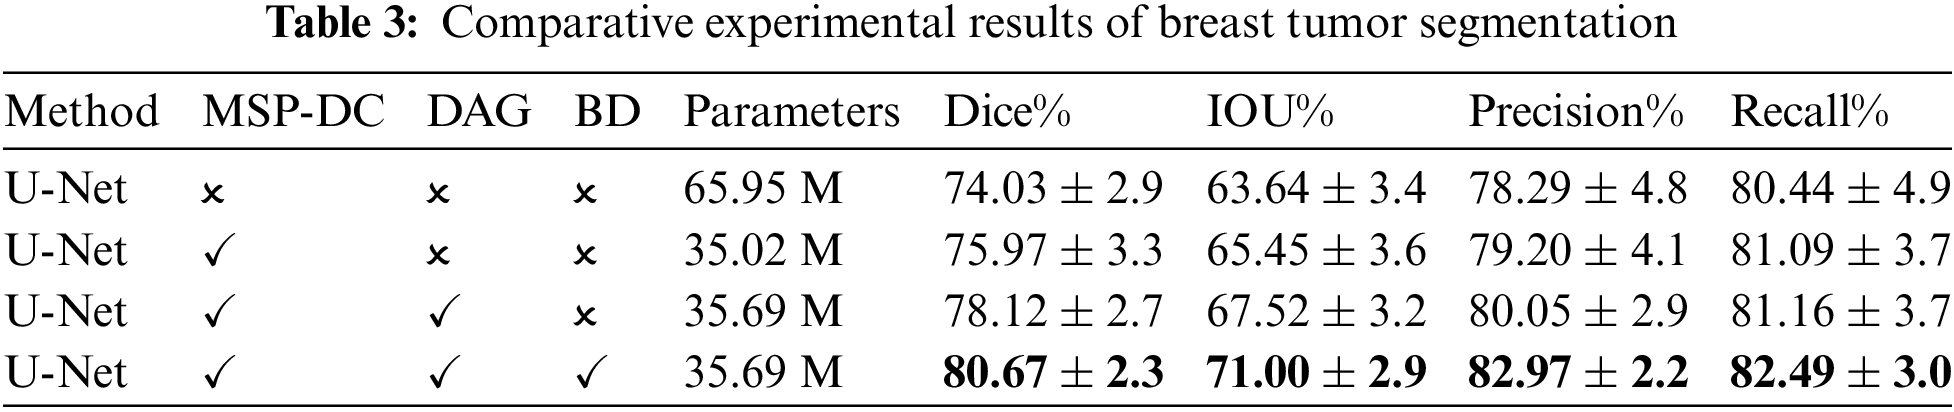

Figure 9: Experimental results of breast tumor segmentation ablation: (a) original drawing; (b) gold standard; (c) U-Net; (d) add MSP-DC module; (e) add DAG module; (f) add BD module
It can be seen from Table 3 that MSP-DC Block is added to the network, in which Dice rises from 0.7403 to 0.7597, and IOU rises from 0.6364 to 0.6545. Combined with the third column of the segmentation example Fig. 9, it can be found that adding the MSP-DC Block makes the segmented tumor area more accurate, especially for small tumors. The problem of over-segmentation is reduced. This is due to the multi-scale convolution layers in the MSP-DC module that enhance the model’s feature extraction capabilities at different scales by varying the size of the receptive fields. The features are then fused and transmitted through a progressively stacked fusion approach, thereby improving the network’s segmentation performance. Additionally, the incorporation of the MSP-DC Block reduces the model’s parameters by half, rendering the model lighter. After adding DAG Black to the network’s decoding section, as seen from Table 3, Dice and IOU increased by 0.0245 and 0.0207, respectively. Observing the fifth column of Fig. 9, the area of breast tumor segmentation results has increased, and at the same time, more tumor details have been obtained in local manifestations. This indicates that by incorporating the DAG attention mechanism, the network focuses on enhancing tumor features while suppressing non-tumor features, thereby improving the global localization and local detail of tumor segmentation results. After adding the boundary detection module and additional boundary loss, the structure is our final tumor segmentation model. As seen from Table 3, all the indexes have been improved, and the precision has increased by 0.0292. As shown in the sixth column of Fig. 9, the segmentation effect is closer to the gold standard after incorporating the BD module. This is because the network enhances its ability to extract local tumor edges and information by incorporating a boundary loss function, making the segmentation boundaries clearer and producing more precise and accurate segmentation results.
The loss and Dice curves of the ablation experimental model are shown in Fig. 10. After 40 iterations, the model’s loss and Dice curves tend to be stable. As can be seen from the graphs, The MBA-Net model has higher segmentation accuracy in both the training set and the verification set. Fig. 11 is a graph of the mixed loss function, including segmentation and boundary enhancement loss. From the figure, it can be seen that the segmentation loss and boundary loss gradually decrease and finally tend to be stable.
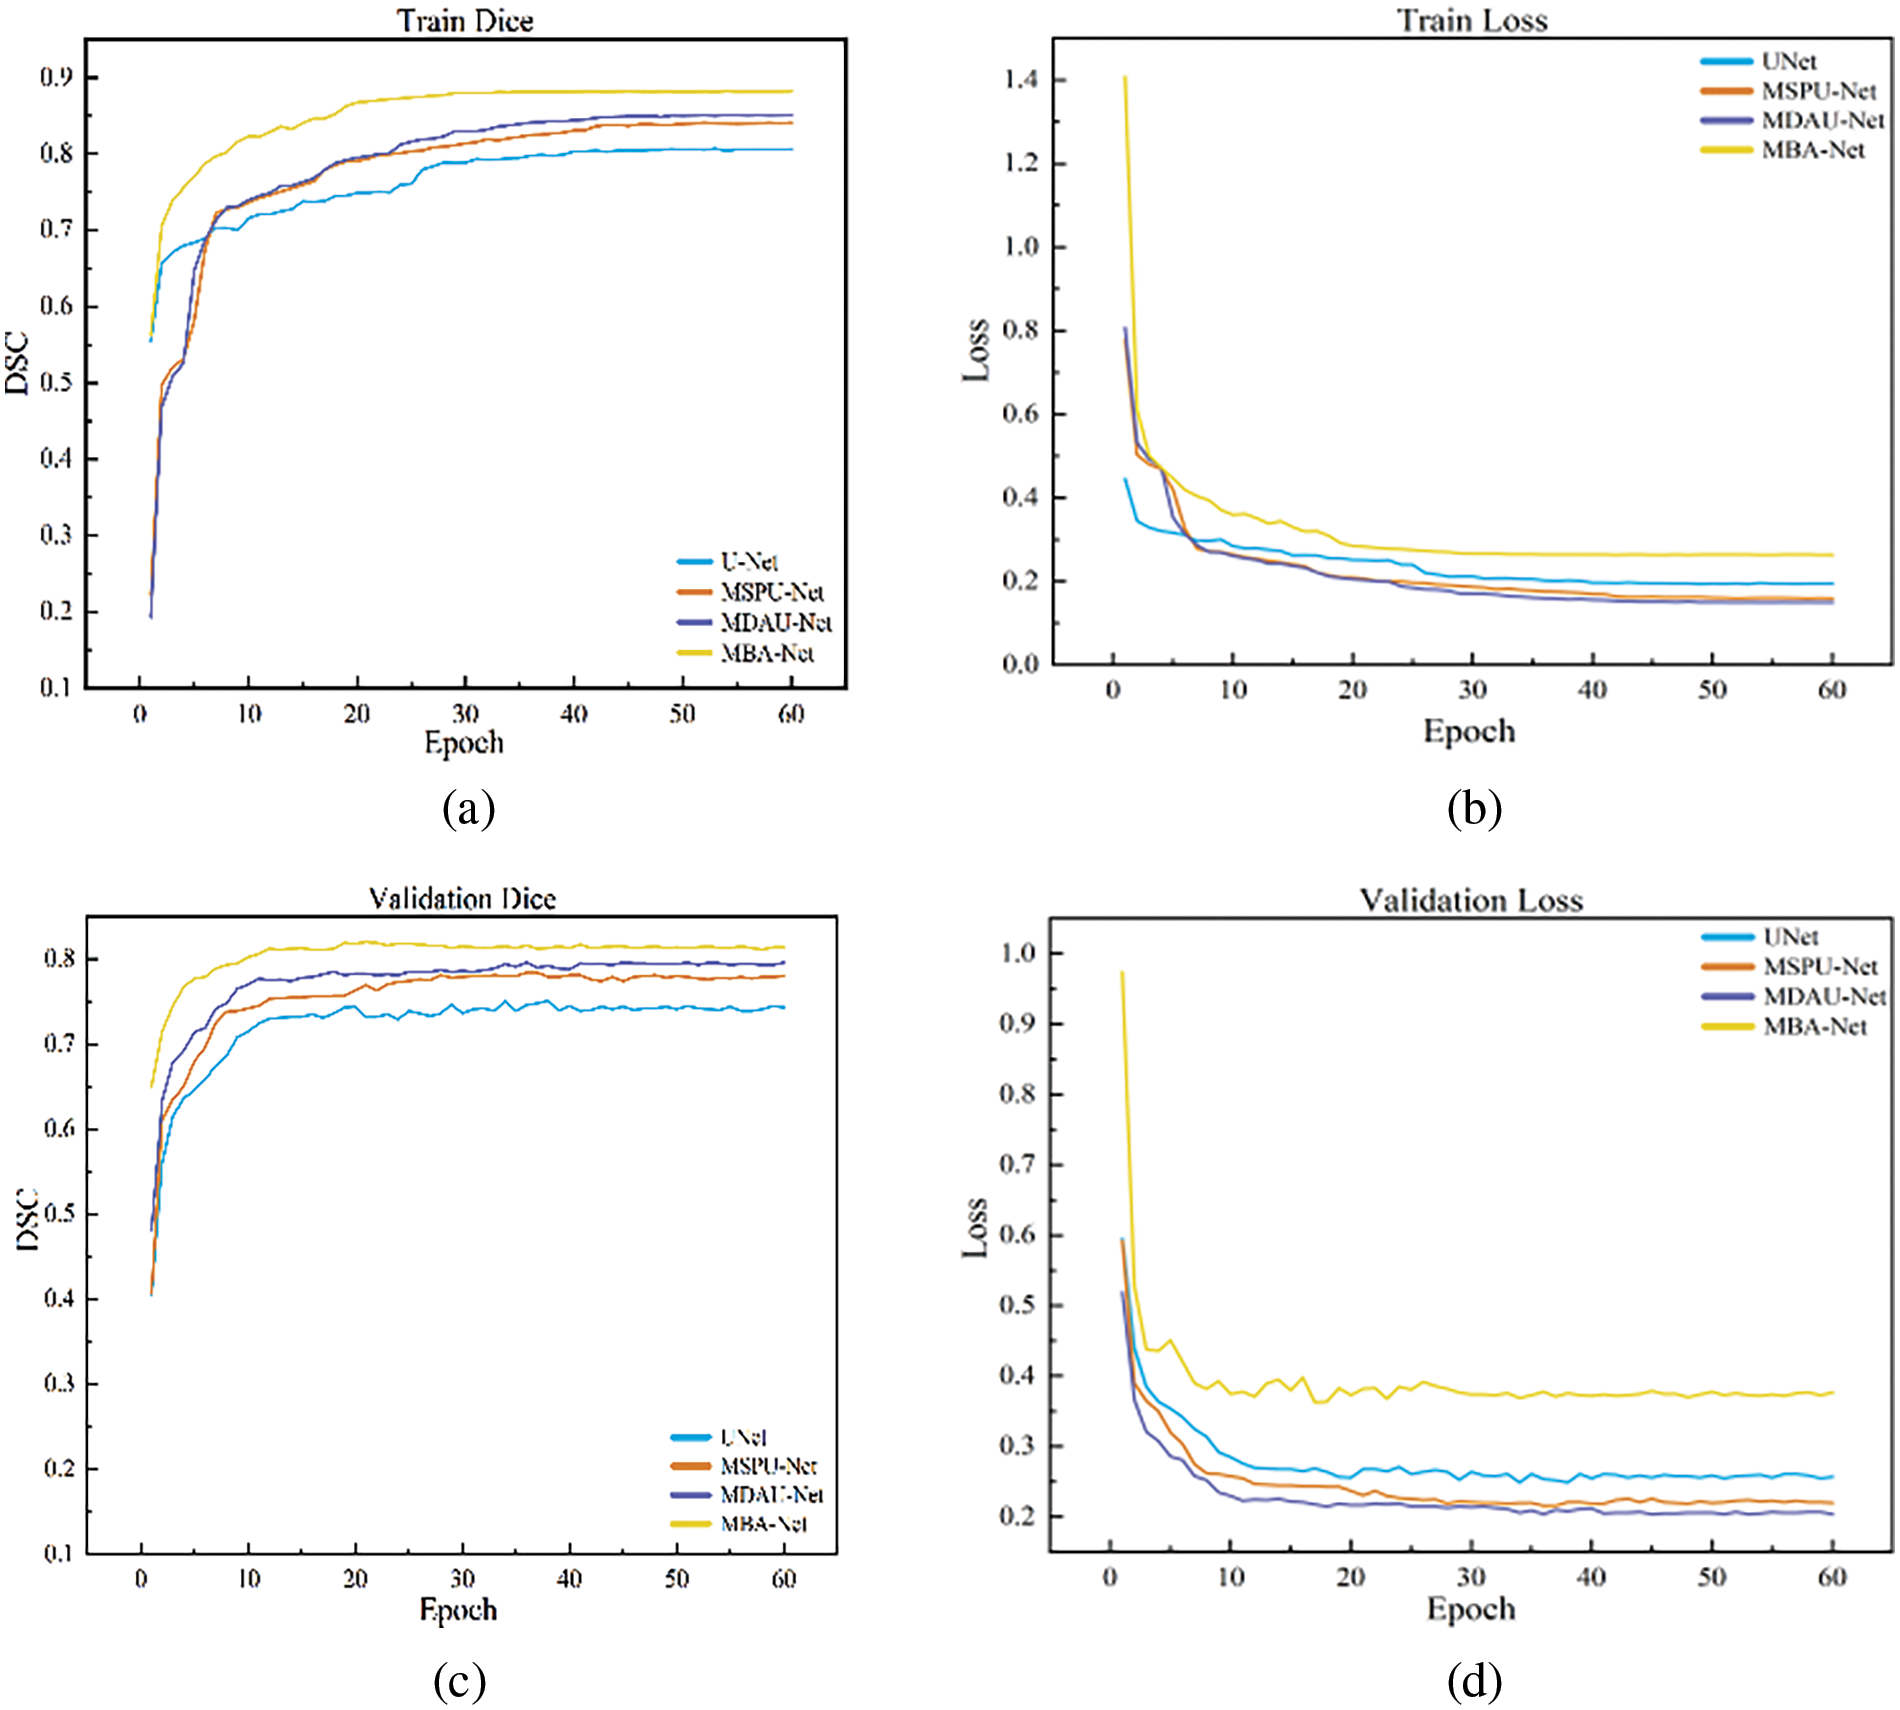
Figure 10: Graph of dice and loss of breast tumor segmentation ablation experiment: (a) train dice; (b) train loss; (c) val dice; (d) val loss
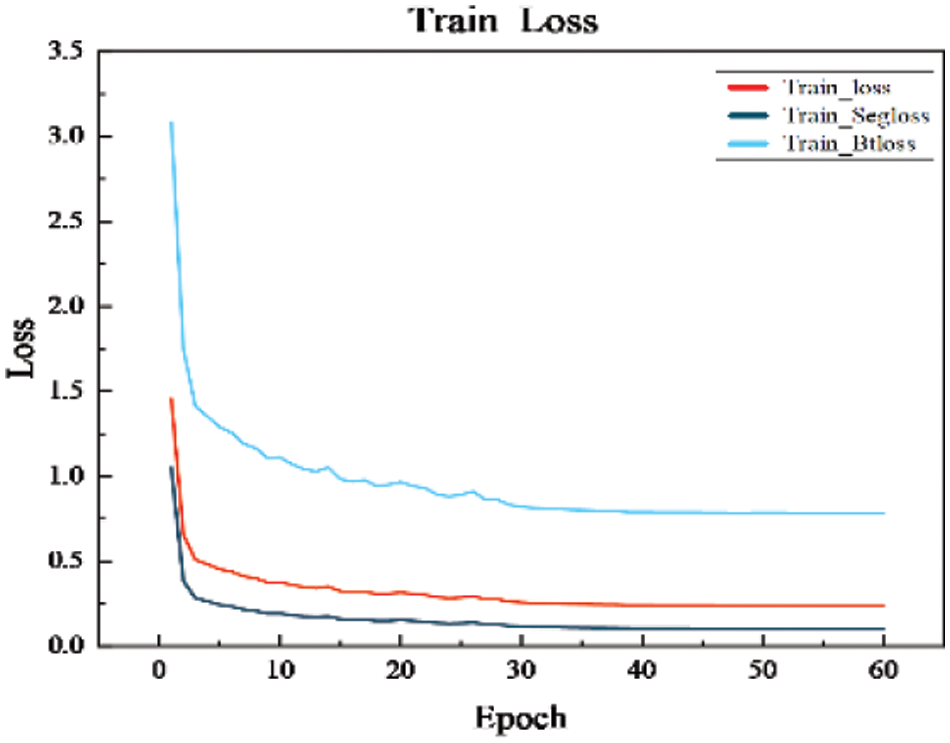
Figure 11: Graph of the mixed loss function
4.3.4 Comparative Experimental Results and Analysis of Different Networks
This paper conducts a comparative analysis of the proposed MBA-Net model against mainstream segmentation models such as U-Net, SegNet, U-Net++, Attention-Unet, Deeplab3+, and FPN, with detailed metrics for each model displayed in Table 4. On this dataset, the MBA-Net model outperformed all other models across all evaluation metrics. Significantly, in comparison to the benchmark U-Net, the MBA-Net model achieved a Dice score improvement of 0.0763 and an IOU increase of 0.0835, with the smallest average difference across all metrics. This underscores that the MBA-Net model is more stable than the baseline U-Net and demonstrates superior performance in breast tumor segmentation.
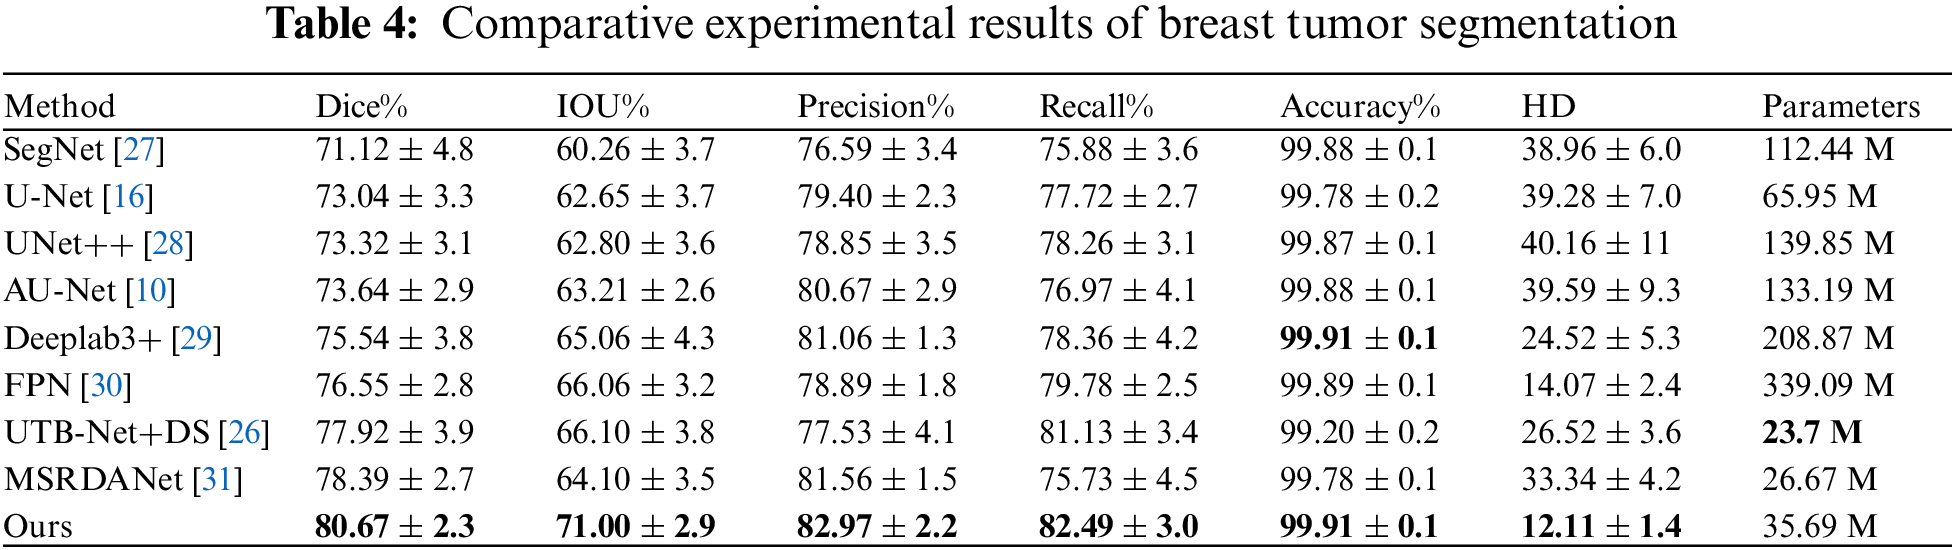
Fig. 12 depicts breast tumor instance segmentation diagrams of 6 cases using seven mainstream segmentation models. In column 1, false positives of non-mammary regions are observed in rows d, f, and g. However, this issue is less prominent in the segmentation results produced by our proposed model. This suggests that the BROI identified in the initial phase effectively reduces the network’s focus on areas beyond the breast, thereby mitigating the influence of surrounding chest tissues and organs on breast tumor detection. Consequently, this approach effectively mitigates the emergence of false positives outside the breast region, thereby enhancing the accuracy of tumor segmentation. For tumors of varying sizes, such as those depicted in the second and third columns of Fig. 12, the SegNet, U-Net, U-Net++, and Attention-Unet networks (corresponding to rows c, d, e, and f) fail to accurately locate the tumor position, especially when segmenting smaller tumors. In the case of larger tumors, these networks predict a small tumor area, resulting in a significant problem of missed segmentation. Incorporating multi-scale information into the network, the Deeplab3+ and FPN networks (corresponding to rows g and h) exhibit an increase in the segmented area for larger tumors. However, the tumor area remains incompletely segmented. Our model’s segmentation result closely aligns with the gold standard. This improvement arises from refining the information fusion mode while incorporating multi-scale data, enabling the network to accurately locate the tumor position globally and capture more detailed local information. This approach enhances the segmentation results, making them more comprehensive and precise.
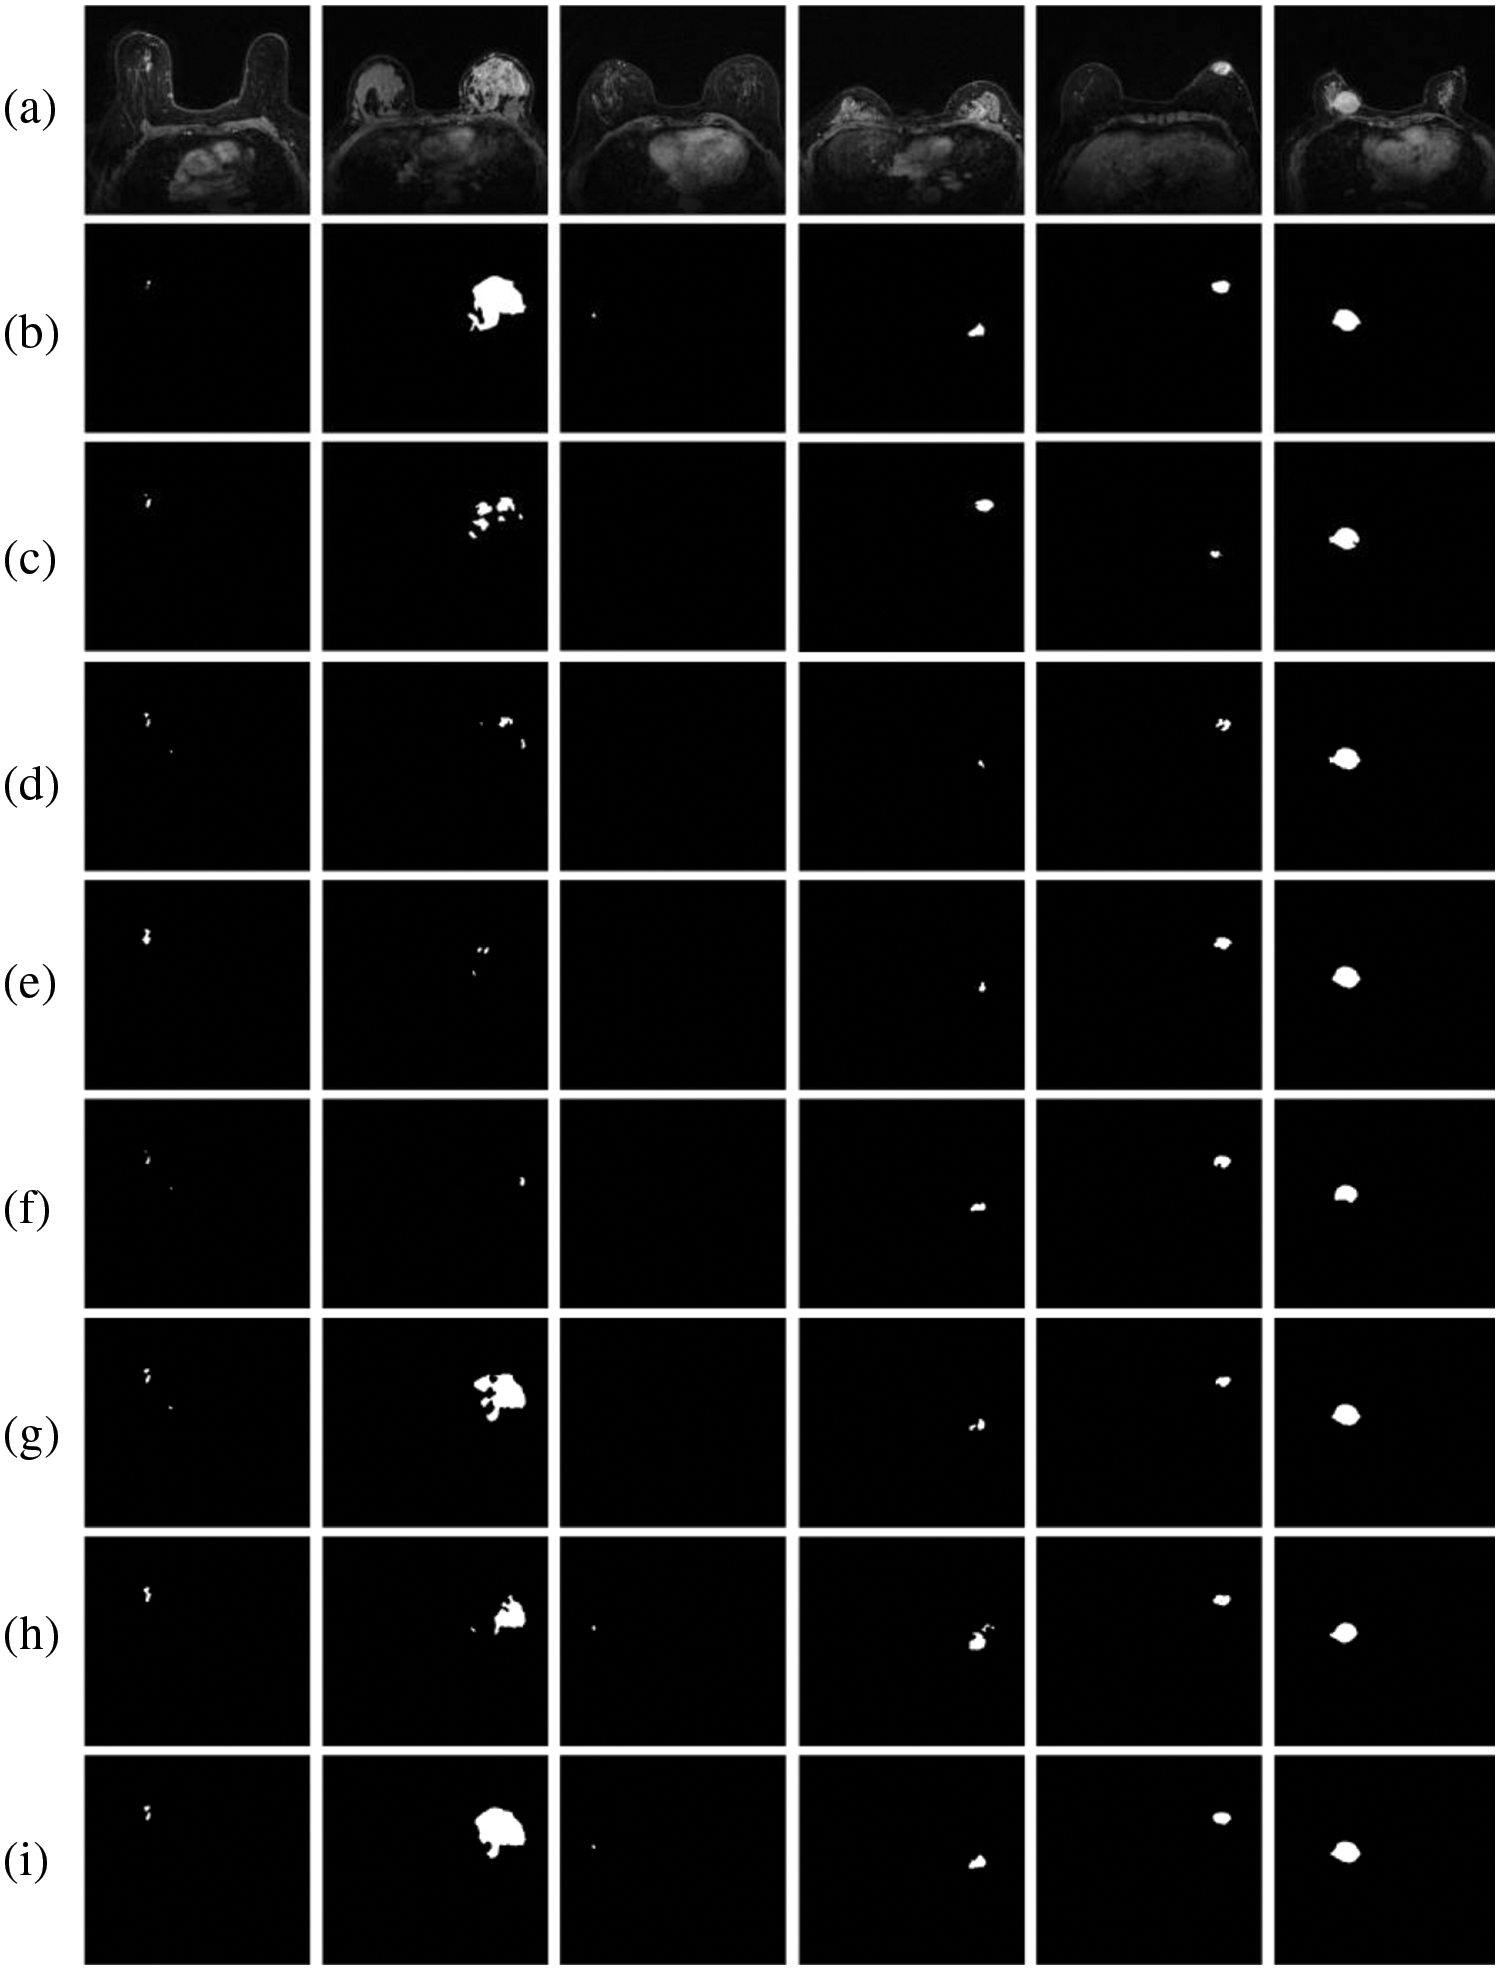
Figure 12: Comparison results between the MBA-Net model and the mainstream model: (a) original images; (b) GT images; (c) SegNet; (d) U-Net; (e) U-Net++; (f) Attention-Unet; (g) Deeplab3+ (h) FPN; (i) ours
Columns 3, 4, and 5 in Fig. 12 depict conventional tumor images. It is evident that, apart from the segmentation results of the MBA-Net model, the segmentation results of other networks exhibit issues such as rough boundaries, over-segmentation, and under-segmentation. For instance, the segmentation results of the FPN network in the h-row exhibit a significantly larger area than the gold standard, resulting in over-segmentation. The segmentation results of U-Net++ in the c row and Attention-Unet in the f row are incomplete and contain defects, resulting in low accuracy in tumor segmentation. However, the segmentation results of MBA-Net in the i-th row surpass those of other networks, exhibiting superior performance in terms of tumor shape and edge accuracy. Analyzing Fig. 9 of ablation experiment segmentation results and Fig. 12 of comparative experiment segmentation results, as evident from the results, the MBA-Net model exhibits exceptional performance in global tumor region localization, processing local detail information, and recognizing edge information, with segmentation precision superior to that of other network models. Furthermore, in the comparative experimental analysis, when confronted with breast tumors of varying shapes, high contrast, and blurred boundaries, MBA-Net models accurately segment breast tumors while preserving more image information, demonstrating the robustness and high accuracy of our MBA-Net model. This is attributed to the MSP-DC module we employ, which enhances the model’s capability to extract features at different scales by adjusting the size of the receptive field and fusing feature information through a progressively stacked approach. Moreover, the BAHD module enables the network to prioritize tumor features from both spatial and channel dimensions and enhances the boundary information of the tumor, thereby enhancing the network’s segmentation performance.
To tackle the challenge of automatic segmentation of DCE-MRI breast tumor images against complex backgrounds, this paper presents a two-stage deep neural network model that leverages multi-scale features and boundary attention mechanisms. Initially, the first stage of the U-Net network achieves rough segmentation of breast regions. Subsequently, guided by BROI, the MBA-Net model is introduced to achieve precise automatic segmentation of breast tumors. In the decoder, dual-domain attention and boundary detection modules are integrated, along with additional boundary loss in the network’s loss function. The experimental results demonstrate that our MBA-Net model has been rigorously tested against several leading segmentation networks and exhibits excellent performance, albeit on a limited dataset. Specifically, our experimental results show that MBA-Net achieves a Dice coefficient of 80.67%, demonstrating superior performance compared to other existing networks, and outperforms them in other evaluation metrics and instance segmentation effects. Moreover, our model accurately extracts smaller tumor regions, thereby enhancing overall segmentation performance. Furthermore, our experimental results also demonstrate that the MBA-Net model excels in global tumor region localization, processing local detail information, and recognizing edge information. Meanwhile, the model parameter count is only 35.69 M, indicating that despite achieving improved segmentation results, there is no significant increase in parameter count. Therefore, the comprehensive experimental results indicate that our proposed MBA-Net model demonstrates significant effectiveness and superiority in breast tumor segmentation tasks. Despite its success, further enhancements and a broader evaluation across multi-site datasets are required to confirm the effectiveness and adaptability of the network.
Future work will involve establishing a 3D model of breast tumor segmentation, further improving the accuracy of tumor segmentation, and laying a foundation for building an algorithm framework that integrates the automatic segmentation of breast tumors, classification of benign and malignant molecular subtypes, and prediction of recurrence risk.
Acknowledgement: The authors would like to thank the editors and reviewers for their valuable work and the supervisor and friends for their help and support during the research process.
Funding Statement: This research was funded by the National Natural Foundation of China under Grant No. 61172167 and the Science Fund Project of Heilongjiang Province (LH2020F035).
Author Contributions: The authors confirm their contribution to the paper as follows: study conception and design: Bing Li, Hongbin Fan; data collection: Bing Li, Xia Liu, Bo Wang; analysis and interpretation of results: Bing Li, Liangyu Wang, Hongbin Fan, Shoudi Tong; draft manuscript preparation: Liangyu Wang, Hongbin Fan. All authors reviewed the results and approved the final version of the manuscript.
Availability of Data and Materials: The data supporting the findings of this study can be obtained from the corresponding author upon request.
Conflicts of Interest: The authors declare that they have no conflicts of interest to report regarding the present study.
References
1. K. D. Miller et al., “Cancer treatment and survivorship statistics, 2022,” CA: A Cancer J. Clin., vol. 72, no. 5, pp. 409–436, 2022. [Google Scholar]
2. W. Chen et al., “Report of cancer incidence and mortality in China, 2014,” Chin. J. Oncol., vol. 40, no. 1, pp. 5–13, 2018. [Google Scholar]
3. G. Litjens et al., “A survey on deep learning in medical image analysis,” Med. Image Anal., vol. 42, no. 13, pp. 60–88, 2017. doi: 10.1016/j.media.2017.07.005. [Google Scholar] [CrossRef]
4. Chinese Anti-Cancer Association Breast Cancer Professional Committee, “Guidelines and norms for the diagnosis and treatment of breast cancer by the chinese anti-cancer association (2021 edition),” (in ChineseChin. J. Cancer, vol. 31, no. 10, pp. 954–1040, 2021. [Google Scholar]
5. L. Liu, J. Cheng, Q. Quan, F. X. Wu, Y. P. Wang and J. Wang, “A survey on U-shaped networks in medical image segmentations,” Neurocomputing, vol. 409, no. 2, pp. 244–258, 2020. doi: 10.1016/j.neucom.2020.05.070. [Google Scholar] [CrossRef]
6. L. Sun et al., “An image segmentation framework for extracting tumors from breast magnetic resonance images,” J. Innov. Opt. Health Sci., vol. 11, no. 4, pp. 1850014, 2018. doi: 10.1142/S1793545818500141. [Google Scholar] [CrossRef]
7. F. Bouchebbah and H. Slimani, “Levels propagation approach to image segmentation: Application to breast MR images,” J. Digit. Imaging, vol. 32, no. 3, pp. 433–449, 2019. doi: 10.1007/s10278-018-00171-2. [Google Scholar] [CrossRef]
8. R. Rasti, M. Teshnehlab, and S. L. Phung, “Breast cancer diagnosis in DCE-MRI using mixture ensemble of convolutional neural networks,” Pattern Recognit., vol. 72, no. 12, pp. 381–390, 2017. doi: 10.1016/j.patcog.2017.08.004. [Google Scholar] [CrossRef]
9. J. Xie, S. Jiang, W. Xie, and X. Gao, “An efficient global K-means clustering algorithm,” J. Comput., vol. 6, no. 2, pp. 271–279, 2011. doi: 10.4304/jcp.6.2.271-279. [Google Scholar] [CrossRef]
10. J. Schlemper et al., “Attention gated networks: Learning to leverage salient regions in medical images,” Med. Image Anal., vol. 53, no. 7639, pp. 197–207, 2019. doi: 10.1016/j.media.2019.01.012. [Google Scholar] [CrossRef]
11. W. Chen, M. L. Giger, and U. Bick, “A fuzzy c-means (FCM)-based approach for computerized segmentation of breast lesions in dynamic contrast-enhanced MR images,” Acad. Radiol., vol. 13, no. 1, pp. 63–72, 2006. doi: 10.1016/j.acra.2005.08.035. [Google Scholar] [CrossRef]
12. G. Maicas, G. Carneiro, and A. P. Bradley, “Globally optimal breast mass segmentation from DCE-MRI using deep semantic segmentation as shape prior,” in 2017 IEEE 14th Int. Symp. Biomed. Imaging (ISBI 2017), IEEE, 2017, pp. 305–309. [Google Scholar]
13. D. McClymont, A. Mehnert, A. Trakic, D. Kennedy, and S. Crozier, “Fully automatic lesion segmentation in breast MRI using mean-shift and graph-cuts on a region adjacency graph,” J. Magn. Reson. Imaging, vol. 39, no. 4, pp. 795–804, 2014. doi: 10.1002/jmri.24229. [Google Scholar] [CrossRef]
14. A. Arjmand, S. Meshgini, R. Afrouzian, and A. Farzamnia, “Breast tumor segmentation using K-means clustering and cuckoo search optimization,” in 2019 9th Int. Conf. Comput. Knowl. Eng. (ICCKE), Mashhad, Iran, IEEE, 2019, pp. 305–308. [Google Scholar]
15. J. Long, E. Shelhamer, and T. Darrell, “Fully convolutional networks for semantic segmentation,” in Proc. IEEE Conf. Comput. Vis. Pattern Recognit., Boston, MA, USA, 2015, pp. 3431–3440. [Google Scholar]
16. O. Ronneberger, P. Fischer, and T. Brox, “U-Net: Convolutional networks for biomedical image segmentation,” in Med. Image Comput. Comput.-Assist. Interv.–MICCAI 2015: 18th Int. Conf., Munich, Germany, Springer, 2015, pp. 234–241. [Google Scholar]
17. M. El Adoui, S. A. Mahmoudi, M. A. Larhmam, and M. Benjelloun, “MRI breast tumor segmentation using different encoder and decoder CNN architectures,” Computers, vol. 8, no. 3, pp. 52, 2019. doi: 10.3390/computers8030052. [Google Scholar] [CrossRef]
18. J. Zhang, A. Saha, Z. Zhu, and M. A. Mazurowski, “Hierarchical convolutional neural networks for segmentation of breast tumors in MRI with application to radiogenomics,” IEEE Trans. Med. Imaging, vol. 38, no. 2, pp. 435–447, 2018. doi: 10.1109/TMI.2018.2865671. [Google Scholar] [CrossRef]
19. S. Woo, J. Park, J. Y. Lee, and I. S. Kweon, “CBAM: Convolutional block attention module,” in Proc. Eur. Conf. Comput. Vis. (ECCV), Munich, Germany, 2018, pp. 3–19. [Google Scholar]
20. M. Feng, H. Lu, and E. Ding, “Attentive feedback network for boundary-aware salient object detection,” in Proc. IEEE/CVF Conf. Comput. Vis. Pattern Recognit., Boston, MA, USA, 2019, pp. 1623–1632. [Google Scholar]
21. C. Szegedy et al., “Going deeper with convolutions,” in Proc. IEEE Conf. Comput. Vis. Pattern Recognit., 2015, pp. 1–9. [Google Scholar]
22. J. M. J. Valanarasu and V. M. Patel, “UNeXt: MLP-based rapid medical image segmentation network,” in Int. Conf. Medical Image Comput. Comput.-Assist. Interv., Singapore, Springer, 2022, pp. 23–33. [Google Scholar]
23. H. Shao, Q. Zeng, Q. Hou, and J. Yang, “MCANet: Medical image segmentation with multi-scale cross-axis attention,” arXiv preprint arXiv:2312.08866, 2023. [Google Scholar]
24. S. Sun, Q. She, Y. Ma, R. Li, and Y. Zhang, “LUCF-Net: Lightweight U-shaped cascade fusion network for medical image segmentation,” arXiv preprint arXiv:2404.07473, 2024. [Google Scholar]
25. J. Ruan and S. Xiang, “VM-UNet: Vision mamba unet for medical image segmentation,” arXiv preprint arXiv:2402.02491, 2024. [Google Scholar]
26. C. Qin, Z. Song, J. Zeng, L. Tian, and F. Li, “Deep supervised breast cancer segmentation with joint multi-scale and attention-residual,” Opt. Precis. Eng., vol. 29, no. 4, pp. 877–895, 2021. doi: 10.37188/OPE.20212904.0877. [Google Scholar] [CrossRef]
27. V. Badrinarayanan, A. Kendall, and R. Cipolla, “SegNet: A deep convolutional encoder-decoder architecture for image segmentation,” IEEE Trans. Pattern Anal. Mach. Intell., vol. 39, no. 12, pp. 2481–2495, 2017. doi: 10.1109/TPAMI.2016.2644615. [Google Scholar] [CrossRef]
28. Z. Zhou, M. M. Rahman Siddiquee, N. Tajbakhsh, and J. Liang, “Unet++: A nested U-Net architecture for medical image segmentation,” in Deep Learn. Med. Image Anal. Multimodal Learn. Clinical Decis. Support: 4th Int. Workshop, DLMIA 2018, 8th Int. Workshop, Granada, Spain, Springer, 2018, pp. 3–11. [Google Scholar]
29. L. C. Chen, Y. Zhu, G. Papandreou, F. Schroff, and H. Adam, “Encoder-decoder with atrous separable convolution for semantic image segmentation,” in Proc. Eur. Conf. Comput. Vis. (ECCV), Munich, Germany, 2018, pp. 801–818. [Google Scholar]
30. T. Y. Lin, P. Dollár, R. Girshick, K. He, B. Hariharan and S. Belongie, “Feature pyramid networks for object detection,” in Proc. IEEE Conf. Comput. Vis. Pattern Recognit., Honolulu, HI, USA, 2017, pp. 2117–2125. [Google Scholar]
31. X. Liu, Z. Lv, B. Li, B. Wang, and D. Wang, “Segmentation algorithm of breast tumor in dynamic contrast-enhanced magnetic resonance imaging based on network with multi-scale residuals and dual-domain attention,” J. Electron. Inf. Technol., vol. 45, no. 5, pp. 1774–1785, 2023. [Google Scholar]
Cite This Article
 Copyright © 2024 The Author(s). Published by Tech Science Press.
This work is licensed under a Creative Commons Attribution 4.0 International License , which permits unrestricted use, distribution, and reproduction in any medium, provided the original work is properly cited.
 Downloads
 Citation Tools