
 Submit a Paper
 Propose a Special lssue
 Open Access
ARTICLE

Efficient Clustering Network Based on Matrix Factorization
1 School of Computer Science and Technology, Hainan University, Haikou, 570228, China
2 School of Cyberspace Security, Hainan University, Haikou, 570228, China
3 Hainan Blockchain Technology Engineering Research Center, Haikou, 570228, China
* Corresponding Author: Jimei Li. Email:
Computers, Materials & Continua 2024, 80(1), 281-298. https://doi.org/10.32604/cmc.2024.051816
Received 15 March 2024; Accepted 21 May 2024; Issue published 18 July 2024
 View Full Text
 Download PDF
Abstract
Contrastive learning is a significant research direction in the field of deep learning. However, existing data augmentation methods often lead to issues such as semantic drift in generated views while the complexity of model pre-training limits further improvement in the performance of existing methods. To address these challenges, we propose the Efficient Clustering Network based on Matrix Factorization (ECN-MF). Specifically, we design a batched low-rank Singular Value Decomposition (SVD) algorithm for data augmentation to eliminate redundant information and uncover major patterns of variation and key information in the data. Additionally, we design a Mutual Information-Enhanced Clustering Module (MI-ECM) to accelerate the training process by leveraging a simple architecture to bring samples from the same cluster closer while pushing samples from other clusters apart. Extensive experiments on six datasets demonstrate that ECN-MF exhibits more effective performance compared to state-of-the-art algorithms.Keywords
Due to the potent representation learning capabilities of graph data, Graph Neural Networks (GNNs) have successfully permeated various domains, encompassing node classification [1], graph classification [2], time series analysis, knowledge graphs, and clustering [3]. Within the diverse landscape of graph learning, deep graph clustering [4] emerges as a fundamental yet challenging unsupervised task, marking a recent focal point of research interest. The exploration of deep graph clustering methods encompasses various learning mechanisms. Generative methods leverage generative models to characterize the distribution of graph data, achieving effective clustering of graphs [5–9]. Adversarial methods [10,11] introduce the concept of adversarial training, enhancing clustering performance through the interplay between a generator and a discriminator. Contrastive methods [12–16], on the other hand, propel the development of deep graph clustering by learning the similarity and dissimilarity between samples. Our method falls into the category of multi-view [17] contrastive learning, aligning with the latter approach.
Existing methods generate augmented views of the same nodes through graph augmentation. However, existing studies [18,19] indicate: 1) Due to the inherent characteristics of contrastive learning, sensitivity to noise and incorrect labels can lead to semantic drift and indistinguishable positive samples when inappropriate data augmentation techniques such as edge removal, noise addition, diffusion [13], or masking are used. 2) Due to the computational cost of matrix factorization itself, existing methods still face limitations in handling large sparse datasets. 3) Model pre-training typically requires extensive data for optimal performance. Fine-tuning pre-trained models necessitates large-scale labeled data, which may not be suitable for tasks with limited annotated data. Moreover, due to differences between tasks, transferring pre-trained models to specific tasks can be more complex and challenging.
To address the aforementioned issues, we propose an Efficient Clustering Network based on Matrix Factorization (ECN-MF). The main idea behind this approach is to design a batched low-rank Singular Value Decomposition algorithm and a Mutual Information-Enhanced Clustering Guidance Module. This aims to extract crucial information from the data while better preserving the original information in the embedded data, reducing information loss, and improving the model’s generative capabilities. Specifically, in terms of data augmentation, we introduce a batched low-rank Singular Value Decomposition algorithm that decomposes the attribute matrix of large datasets into smaller modules. This allows better exploration of major variation patterns and important information in sparse and large datasets. In the network architecture, we employ a pseudo-siamese neural network with the same structure but without parameter sharing. This enables the model to better capture unique information from each view, thereby enhancing clustering performance. Additionally, we design a Mutual Information-Enhanced Clustering Guidance Module to ensure better preservation of original data information, reducing information loss, and enhancing the model’s generative capabilities. It brings samples from the same cluster closer while pushing samples from other clusters apart, further improving clustering performance. The main contributions of this work are summarized as follows:
1. We propose an Efficient Clustering Network based on Matrix Factorization (ECN-MF), which does not require pre-training, thus alleviating the challenges of model pre-training and complex model transfer.
2. We propose a batched low-rank Singular Value Decomposition (SVD) algorithm to address the resource-intensive nature of the SVD algorithm in large sparse datasets. This method not only avoids losing important information during data augmentation but also effectively extracts latent information from the data.
3. We designed a Mutual Information-Enhanced Clustering Module (MI-ECM). It enhances the discriminative capability of the network while ensuring better retention of the original data information in the embedded data.
4. Experimental results demonstrate that our proposed method outperforms existing methods in handling challenges such as large sparse datasets and model transfer complexity.
The remaining sections of this paper are organized as follows. Section 2 reviews relevant literature on matrix factorization and contrastive deep graph clustering. In Section 3, we provide detailed explanations of the symbols used, the batched low-rank Singular Value Decomposition algorithm, our network structure, and the Mutual Information-Enhanced Clustering Guidance Module. Section 4 presents the results of our method tested on five datasets. Finally, Section 5 concludes the paper.
Matrix factorization (decomposition) is the process of breaking down a matrix into the product of several matrices. This can involve techniques such as triangular factorization, full rank factorization, orthogonal triangle decomposition, Jordan decomposition, and Singular Value Decomposition. In our case, we primarily utilize Singular Value Decomposition to process data. Singular Value Decomposition allows for the representation of a relatively complex matrix as the product of smaller and simpler matrices. These smaller matrices describe the essential characteristics of the original matrix. Singular Value Decomposition is applicable to any matrix, making it adaptable to the features of current attribute information. It finds applications in various fields such as signal processing, statistics, natural language processing, and more. In recommendation systems, Singular Value Decomposition is widely applied in collaborative filtering and matrix completion algorithms. Through Singular Value Decomposition, a user-item rating matrix can be reduced to a low-dimensional latent factor matrix, extracting latent features of users and items for recommendation purposes.
Singular Value Decomposition has significant potential value in processing raw data. The singular values decrease exponentially with rank, with early singular values much larger than later ones, as shown in Fig. 1. By applying low-rank Singular Value Decomposition to the data, we can capture the essential features of the data, enhance data representation, and improve the performance of multi-view clustering. Based on this, we have optimized and improved the Singular Value Decomposition method to be suitable for large datasets, providing higher computational efficiency and scalability.

Figure 1: (a): Singular values exhibit exponential decay with rank, where the initial singular values are significantly larger than the subsequent ones. (b): All information of
2.2 Contrastive Deep Graph Clustering
In recent years, contrastive learning has achieved remarkable success in the fields of images [20–23] and graphics [24–26], inspiring extensive research on contrastive deep graph clustering methods [12–16]. The clustering performance of these methods is primarily influenced by three key factors: data augmentation, network architecture, and the handling of positive and negative sample pairs. Taking these factors into account, we summarize the distinctions between our proposed ECN-MF and other contrastive deep graph clustering methods.
Data augmentation techniques are pivotal in the realm of deep graph-contrastive clustering. Current methods, such as edge removal, diffusion, masking, and noise addition, introduce varying degrees of perturbation to the original data. While these approaches help mitigate over-smoothing during iterative training of graph neural networks, they carry the risk of losing crucial information. Inappropriate data augmentation may lead to semantic drift and indistinguishable positive samples, resulting in suboptimal clustering performance. For instance, reference [13] utilizes diffusion matrices as augmented graphs, while Self-supervised contrastive attributed graph clustering (SCAGC) perturbs graph structure by randomly adding or removing edges. Reference [15] and SCAGC enhance node attributes through attribute perturbation. However, reference [27] has highlighted the risk of semantic drift with improper data augmentation. To address this challenge, we propose a novel enhancement approach. Unlike existing methods, ECN-MF leverages batch low-rank Singular Value Decomposition methods to extract crucial attribute information, filter out noisy data, and construct two augmented views of the same node without compromising the original structure.
In terms of network architecture, SCAGC, reference [28] uses a shared Graph Convolutional Networks (GCNs) encoder to encode nodes. However, conventional GCNs encoders entangle transformation and aggregation operations during the training process, resulting in high time costs. To address this issue, we employ two separate Multilayer Perceptrons (MLPs) to encode the node attributes of the two views. These two MLPs have the same architecture but do not share parameters, ensuring that the node embeddings for the two views contain different semantic information.
2.2.3 Handling of Positive and Negative Sample Pairs
In contrastive methods, the handling of positive and negative sample pairs is crucial. Contrastive methods bring positive samples together while pushing negative samples apart. Therefore, the quality of positive and negative sample pairs significantly influences the performance of contrastive methods. Specifically, reference [13] generates negative samples by randomly shuffling features and designs the InfoMax loss to maximize cross-view mutual information. Reference [12] distinguishes between similar and dissimilar nodes using cross-entropy loss. Subsequently, SCAGC randomly selects samples from different clusters to improve the quality of negative samples. They also design a contrastive clustering loss to maximize the consistency between representations from the same cluster. Both references [14] and [16] utilize the infoNCE loss to attract positive sample pairs and separate negative sample pairs. While their approaches have shown effectiveness, they still depend on a well-pretrained model to choose high-quality positive and negative samples. To address this issue, we propose a MI-ECM to bring samples from the same cluster closer while pushing samples from different clusters apart, thereby enhancing the discriminative ability of sample pairs.
In this section, we introduce a novel Efficient Clustering Algorithm based on Matrix Factorization (ECN-MF). The aim is to enhance clustering performance by leveraging matrix factorization in a way that captures unique information from each view with-out disrupting the original structure. The overall framework of ECN-MF is illustrated in Fig. 2. In the following sections, we will provide a detailed explanation of the pro-posed ECN-MF.

Figure 2: Schematic diagram of the Efficient Clustering Network based on Matrix Factorization. The network consists of three main parts: the batched low-rank Singular Value Decomposition (SVD) on the left, the pseudo-siamese neural network in the middle, and the Mutual Information-Enhanced Clustering Guidance Module on the right. Here,
3.1 Notations and Problem Definition
In an undirected graph

3.2 Batch Low-Rank Singular Value Decomposition Algorithm
Recent studies have demonstrated the significant effectiveness of Singular Value Decomposition in handling sparse matrices and dimensionality reduction. Inspired by their success, we introduce the Singular Value Decomposition algorithm, treating attribute information as an independent preprocessing step before training. This approach allows for the effective extraction of latent and essential information from the data while filtering out noise present in the attributes. The method is as follows:
Specifically, given a matrix
Here,
Singular Value Decomposition can be applied to decompose any matrix, making it adaptable to the characteristics of current attribute information. We will rewrite Eq. (1) as follows:
Here,
To adapt to the Singular Value Decomposition in the case of large data, we partition the dataset
Here,
The objective of centralization is to set the mean of the data in each batch to zero. Assuming
Here,
Here, SVD represents the Singular Value Decomposition algorithm.
We concatenate all low-rank matrices
We perform a descending order sorting on
Next, we will obtain the corresponding vectors of
Finally, we reconstruct the low-rank attribute matrix
3.3 Pseudo-Siamese Neural Network
In this section, we embed the nodes of both the original and enhanced data into a latent space and design a pseudo-siamese neural network with an encoder that shares the same architecture but has non-shared learnable parameters.
Residual connections allow information to propagate between network layers, aiding in mitigating the vanishing gradient problem, accelerating the training process, and enhancing model performance. In this work, the representations learned by the
Here,
We denote the embeddings output by the last layer of GCNs as
3.4 Mutual Information-Enhanced Clustering Module
To minimize redundancy in embeddings and effectively preserve more discriminative features, we initially optimize the embeddings between cross-view samples using Mean Squared Error (MSE) loss. This ensures that the learned representations are not influenced by irrelevant information, thereby guaranteeing the quality of the latent space for subsequent clustering tasks. The formula is as follows:
Here,
Next, we merge the embeddings from the two views for each node as follows:
Here,
Finally, by inputting
where
Following the acquisition of the clustering probability distribution
Here,
Minimizing the KL divergence loss between the
In order to aggregate samples within the same cluster while simultaneously separating them from samples in other clusters, we choose to periodically update the top
Here,
We use the obtained pseudo-labels
Here,
In summary, the overall loss calculation for ECN-MF is as follows:
Here,
The detailed learning procedure of ECN-MF is shown in Algorithm 1.

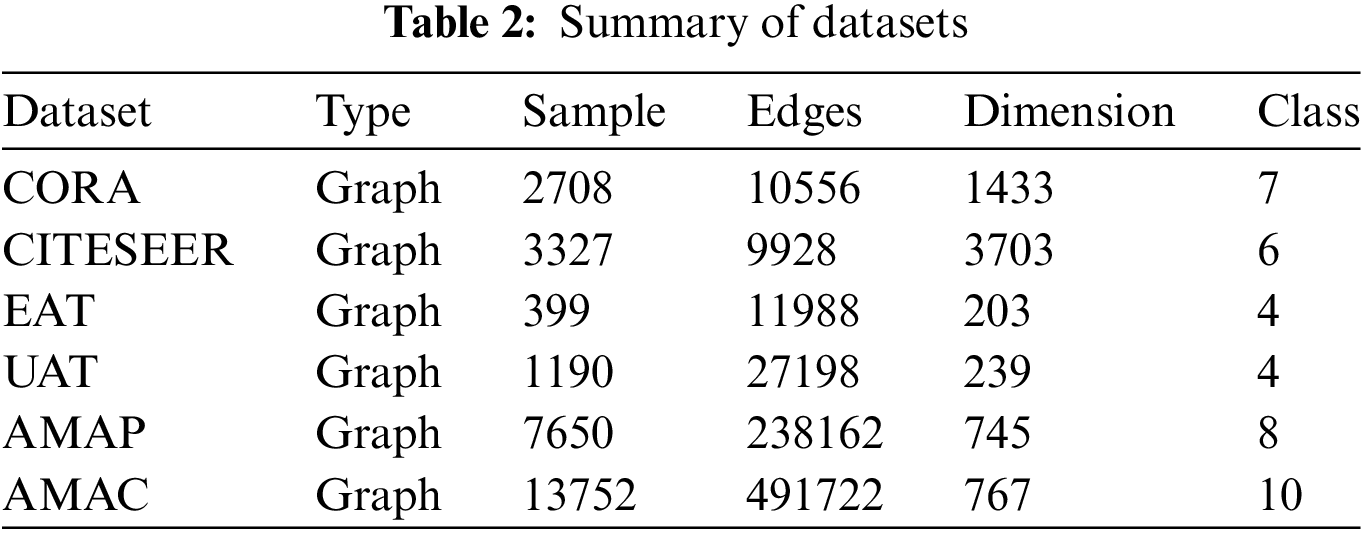
We proposed ECN-MF, which was evaluated on six datasets, including CORA [12] CITESEER [12], European Air Traffic (EAT) [30], United States Air Traffic (UAT) [30], Amazon Photo (AMAP), and Amazon Computer (AMAC). Table 2 provides a brief description of these datasets.
All experimental results were obtained on a high-performance server equipped with an NVIDIA 3090 GPU, 64 GB RAM, and the PyTorch deep learning platform.
Our network is trained by minimizing the loss in Eq. (19) using the Adam optimizer for 1000 iterations until convergence. After optimization, we directly apply Eqs. (13) and (14) to cluster the node embeddings of the two views and report the final convergence results for four metrics. Following all compared methods and to mitigate the adverse effects of randomness, we repeat the experiments 10 times and report the averages along with the corresponding standard deviations.
For the sake of fairness, regarding MCGC [14], we only executed their source code on the graph datasets listed in Table 2. For other baselines, we reproduced the results by adopting the source code with the original settings. In our proposed method, the learning rate of the optimizer is set to 1e-4 for CORA/CITESEER/EAT/AMAP/AMAC and 1e-3 for UAT. The rank
To validate the superiority of our ECN-MF compared to the baselines, we employed four widely used metrics to evaluate clustering performance, namely Accuracy (ACC), Normalized Mutual Information (NMI), Average Rand Index (ARI), and macro F1-score (F1) [31–33].
To demonstrate the superiority of our proposed ECN-MF, we compared ECN-MF with 13 base- lines. Specifically, a classification method, graphMAE2 [34], is considered. Five deep clustering methods, including AE [35], DEC [36] SSGC [37], SDCN [5], and SAGSC [38], utilize autoencoders for node encoding, followed by clustering on the learned embeddings. Two hard sample mining methods, GDCL [39], and ProGCL [40], are employed. Additionally, five deep graph clustering methods for comparison: MCGC [14], MVGRL [13], AFGRL [27], AutoSSL [41] and SCDGN [42], are incorporated. These methods are designed with contrastive strategies to enhance the discriminative capability of samples.
Table 3 reports the clustering performance of all compared methods on six benchmarks. From these results, we can derive four key observations: 1) Our ECN-MF outperforms other deep clustering methods, attributed to the benefits of contrastive learning in implicitly capturing supervisory information. 2) Compared to contrastive methods, our approach demonstrates superior performance, leveraging an information-enhanced clustering guidance module to better preserve the original data information in the embedded data. It ensures better retention of information and improves the discriminative capability of sample pairs by bringing samples from the same cluster closer and pushing away those from different clusters. 3) Our method achieves the best performance on CITESEER, showcasing the effectiveness of utilizing Singular Value Decomposition to capture latent important information of samples, particularly advantageous in handling sparse matrices. 4) Favorable results on AMAP and AMAC highlight the effectiveness of our batched low-rank singular value decomposition algorithm in handling large datasets. In summary, our method outperforms most others on six datasets with four metrics, validating the effectiveness of our proposed approach in addressing unreasonable data preprocessing and handling positive and negative sample pairs.

Firstly, we perform Singular Value Decomposition on attributes, and the time complexity of calculating the low-rank process to obtain the reconstructed attribute
In this section, we first experimentally validate the effectiveness of our proposed data augmentation method and periodic update strategy, as shown in Table 4. For simplicity, we denote the Batch low-rank Singular Value Decomposition as B and the periodic update as P. Note that in order to replace the B operation, we use a mask to generate different views of the same node, with a mask rate of 0.5. “(w/o)B & P” represents not using the batch low-rank Singular Value Decomposition operation and periodic update, while B + P indicates the usage of both. Table 4 displays the convergence results after running 1000 epochs. Based on the observed results, we conclude that the performance would degrade without B and P, indicating that these two strategies contribute significantly to the performance improvement.

In Fig. 3, we visualize the accuracy throughout the entire training process until convergence using a line chart. The graph demonstrates that our model exhibits robust performance. Overall, the experimental results validate the effectiveness of B and P.

Figure 3: Accuracy analysis of the proposed batched low-rank Singular Value Decomposition (B) and periodic update (P) on the five datasets is presented. The red line represents the use of batched low-rank Singular Value Decomposition operation and periodic updates, while the blue line represents the absence of batched low-rank Singular Value Decomposition operation and periodic updates. This comparative experiment demonstrates the effectiveness of our proposed method
In this section, we will analyze the hyperparameters
4.6.1 Analysis of Hyperparameter
Fig. 4 depicts the performance variation of ECN-MF across the range of

Figure 4: The trend chart of clustering accuracy with varying
4.6.2 Analysis of Hyperparameters
Fig. 5 illustrates the variation in clustering performance of ECN-MF on the CITESEER dataset across the range of
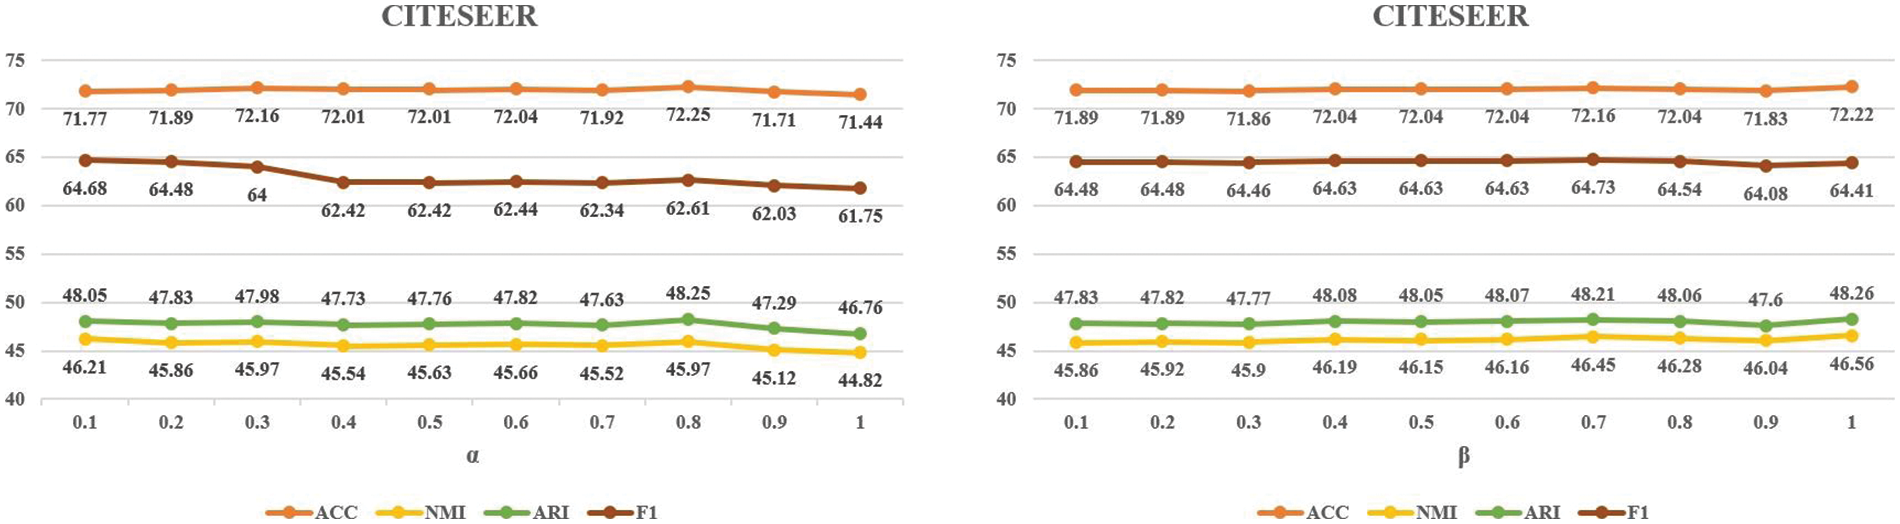
Figure 5: The trend chart of clustering accuracy with varying α and β on the CITESEER dataset, where the horizontal axis represents the values of
To visually showcase the superiority of ECN-MF, we employ the t-SNE algorithm (Maaten and Hinton 2008) to visualize the distribution of the learned clustering embeddings Z in a two-dimensional space. As shown in Fig. 6, ECN-MF can better reveal the intrinsic clustering structure among the data.
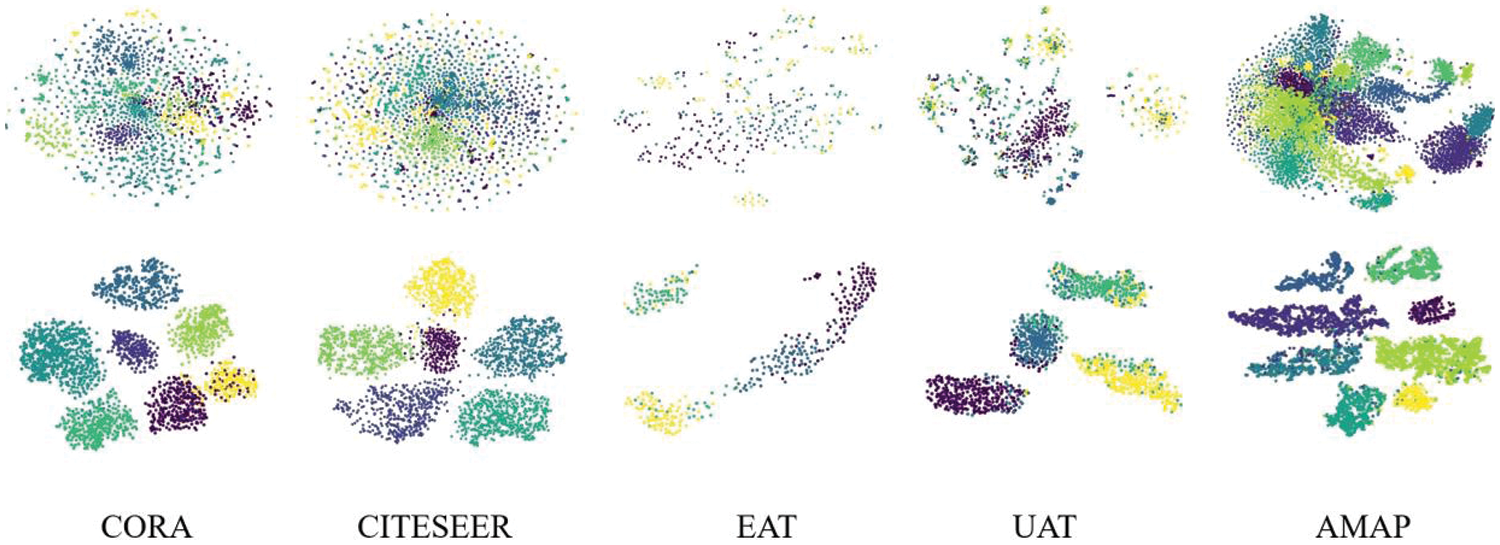
Figure 6: 2D visualization of the five datasets. The first row corresponds to the original data, while the second row corresponds to the distribution of ECN-MF. The visualization of partial samples reflects the effectiveness of our method
This paper introduces an Efficient Clustering Network based on Matrix Factorization (ECN-MF) to alleviate the negative impact of inappropriate data augmentation and enhance the quality of positive samples. By simplifying the network structure, introducing novel data augmentation methods, and designing a mutual information-enhanced clustering guidance module, ECN-MF improves its capability to handle sparse and large datasets. It brings samples from the same cluster closer while pushing samples from different clusters apart. The results of this study demonstrate the effectiveness and superiority of ECN-MF in addressing the challenges of preprocessing deep graph clustering tasks and handling positive and negative sample pairs. The paper uses hyperparameters to define the rank of the Singular Value Decomposition without special treatment of hard samples. In the future, we hope to explore new avenues of research, including: 1) employing adaptive rank selection for data, accommodating a broader range of datasets; 2) focusing more on challenging samples to enhance data mining and processing capabilities; 3) optimizing loss functions tailored for Singular Value Decomposition and challenging samples to improve clustering performance.
Acknowledgement: The authors would like to acknowledge the valuable feedback provided by the reviewers.
Funding Statement: This work was supported by the Key Research and Development Program of Hainan Province (Grant Nos. ZDYF2023GXJS163, ZDYF2024GXJS014), National Natural Science Foundation of China (NSFC) (Grant Nos. 62162022, 62162024), the Major Science and Technology Project of Hainan Province (Grant No. ZDKJ2020012), Hainan Provincial Natural Science Foundation of China (Grant No. 620MS021), Youth Foundation Project of Hainan Natural Science Foundation (621QN211), Innovative Research Project for Graduate Students in Hainan Province (Grant Nos. Qhys2023-96, Qhys2023-95).
Author Contributions: The authors confirm contribution to the paper as follows: study conception and design: J. Li; analysis and interpretation of results: J. Li, F. Zeng; draft manuscript preparation: J. Cheng, J. Li, F. Zeng; data collection: Z. Tao, Y. Yang. All authors reviewed the results and approved the final version of the manuscript.
Availability of Data and Materials: After the publication of the paper, the code will be made public on the author’s GitHub.
Conflicts of Interest: The authors declare that they have no conflicts of interest to report regarding the present study.
References
1. K. Berahmand, M. Mohammadi, R. Sheikhpour, Y. Li, and Y. Xu, “WSNMF: Weighted symmetric nonnegative matrix factorization for attributed graph clustering,” Neurocomputing, vol. 566, no. 2, pp. 127041, 2024. doi: 10.1016/j.neucom.2023.127041. [Google Scholar] [CrossRef]
2. K. Berahmand, Y. Li, and Y. Xu, “A deep semi-supervised community detection based on point-wise mutual information,” IEEE Trans. Comput. Soc. Syst., pp. 1–13, 2023. [Google Scholar]
3. E. Pan and Z. Kang, “Multi-view contrastive graph clustering,” Adv. Neural Inf. Process Syst., vol. 34, pp. 2148–2159, 2021. [Google Scholar]
4. C. Wang, S. Pan, R. Hu, G. D. Long, J. Jiang and C. Zhang, “Attributed graph clustering: A deep attentional embedding approach,” in Proc. Twenty-Eighth Int. Joint Conf. Artif. Intell., Macao, China, 2019, pp. 3670–3676. [Google Scholar]
5. D. Bo, X. Wang, C. Shi, M. Zhu, E. Lu and P. Cui, “Structural deep clustering network,” in Proc. web conf. 2020, Taipei, Taiwan, 2020, pp. 1400–1410. [Google Scholar]
6. W. Tu et al., “Deep fusion clustering network,” in Proc. AAAI Conf. Artif. Intell., Vancouver, Canada, 2021, vol. 35, pp. 9978–9987. doi: 10.1609/aaai.v35i11.17198. [Google Scholar] [CrossRef]
7. Z. Peng, H. Liu, Y. Jia, and J. Hou, “Attention-driven graph clustering network,” in Proc. 29th ACM Int. Conf. Multimed., Sichuan, China, 2021, pp. 935–943. [Google Scholar]
8. J. Park, M. Lee, H. J. Chang, K. Lee, and J. Y. Choi, “Symmetric graph convolutional autoencoder for unsupervised graph representation learning,” in Proc. IEEE/CVF Int. Conf. Comput. Vision, Paris, France, 2019, pp. 6519–6528. [Google Scholar]
9. J. Cheng, Q. Wang, Z. Tao, D. Xie, and Q. Gao, “Multi-view attribute graph convolution networks for clustering,” in Proc. Twenty-Ninth Int. Conf. Int. Joint Conf. Artif. Int., Yokohama, Japan, 2021, pp. 2973–2979. [Google Scholar]
10. S. Pan, R. Hu, S. Fung, G. Long, J. Jiang and C. Zhang, “Learning graph embedding with adversarial training methods,” IEEE Trans. Cybern., vol. 50, no. 6, pp. 2475–2487, 2019. doi: 10.1109/TCYB.2019.2932096. [Google Scholar] [PubMed] [CrossRef]
11. Z. Tao, H. Liu, J. Li, Z. Wang, and Y. Fu, “Adversarial graph embedding for ensemble clustering,” in Proc. 28th Int. Joint Conf. Artif. Intell., Macao, China, 2019, pp. 3562–3568. [Google Scholar]
12. G. Cui, J. Zhou, C. Yang, and Z. Liu, “Adaptive graph encoder for attributed graph embedding,” in Proc. 26th ACM SIGKDD Int. Conf. Knowl. Discov. Data Min., California, USA, 2020, pp. 976–985. [Google Scholar]
13. K. Hassani and A. H. Khasahmadi, “Contrastive multi-view representation learning on graphs,” in Int. Conf. Mach. Learn., Vienna, Austria, 2020, pp. 4116–4126. [Google Scholar]
14. W. Xia, S. Wang, M. Yang, Q. Gao, J. Han and X. Gao, “Multi-view graph embedding clustering network: Joint self-supervision and block diagonal representation,” Neural Netw., vol. 145, no. 11, pp. 1–9, 2022. doi: 10.1016/j.neunet.2021.10.006. [Google Scholar] [PubMed] [CrossRef]
15. Y. Liu et al., “Deep graph clustering via dual correlation reduction,” in Proc. AAAI Con. Artif. Intell., Vancouver, Canada, 2022, vol. 36, pp. 7603–7611. [Google Scholar]
16. L. Liu, Z. Kang, J. Ruan, and X. He, “Multilayer graph contrastive clustering network,” Inf. Sci., vol. 613, pp. 256–267, 2022. doi: 10.1016/j.ins.2022.09.042. [Google Scholar] [CrossRef]
17. Y. Yang and H. Wang, “Multi-view clustering: A survey, big data mining and analytics,” Big Data Min. Anal., vol. 1, no. 2, pp. 83–107, 2018. [Google Scholar]
18. X. Cai, C. Huang, L. Xia, and X. Ren, “LightGCL: Simple yet effective graph contrastive learning for recommendation,” in Eleventh Int. Conf. Learn. Rep., 2022, pp. 1–15. [Google Scholar]
19. G. A. Khan, J. Hu, T. Li, B. Diallo, and H. Wang, “Multi-view data clustering via non-negative matrix factorization with manifold regularization,” Int. J. Mach. Learn. Cybern., vol. 13, no. 3, pp. 1–13, 2022. doi: 10.1007/s13042-021-01307-7. [Google Scholar] [CrossRef]
20. T. Chen, S. Kornblith, M. Norouzi, and G. Hinton, “A simple framework for contrastive learning of visual representations,” in Int. Conf. Mach. Learn., Vienna, Austria, 2020, pp. 1597–1607. [Google Scholar]
21. J. Zbontar, L. Jing, I. Misra, Y. LeCun, and S. Deny, “Barlow twins: Self-supervised learning via redundancy reduction,” in Int. Conf. Mach. Learn., 2021, pp. 12310–12320. [Google Scholar]
22. H. Zhong et al., “Graph contrastive clustering,” in Proc. IEEE/CVF Int. Conf. Comput. Vis., 2021, pp. 9224–9233. [Google Scholar]
23. X. Yang, X. Hu, S. Zhou, X. Liu, and E. Zhu, “Interpolation-based contrastive learning for few-label semi-supervised learning,” IEEE Trans. Neural Netw. Learn. Syst., vol. 35, no. 2, pp. 2054–2065, 2022. doi: 10.1109/TNNLS.2022.3186512. [Google Scholar] [PubMed] [CrossRef]
24. Y. You, T. Chen, Y. Sui, T. Chen, Z. Wang and Y. Shen, “Graph contrastive learning with augmentations,” Adv. Neural Inf. Process Syst., vol. 33, pp. 5812–5823, 2020. [Google Scholar]
25. J. Xia, L. Wu, J. Chen, B. Hu, and S. Z. Li, “SimGRACE: A simple framework for graph contrastive learning without data augmentation,” in Proc. ACM Web Conf. 2022, Barcelona, Spain, 2022, pp. 1070–1079. [Google Scholar]
26. P. Bielak, T. Kajdanowicz, and N. V. Chawla, “Graph barlow twins: A self-supervised representation learning framework for graphs,” Knowl. Based Syst., vol. 256, no. 4, pp. 109631, 2022. doi: 10.1016/j.knosys.2022.109631. [Google Scholar] [CrossRef]
27. N. Lee, J. Lee, and C. Park, “Augmentation-free self-supervised learning on graphs,” Proc. AAAI Conf. Artif. Intell., vol. 36, no. 7, pp. 7372–7380, 2022. doi: 10.1609/aaai.v36i7.20700. [Google Scholar] [CrossRef]
28. L. Gong, S. Zhou, W. Tu, and X. Liu, “Attributed graph clustering with dual redundancy reduction,” in IJCAI, 2022, pp. 1–7. [Google Scholar]
29. V. Nair and G. E. Hinton, “Rectified linear units improve restricted boltzmann machines,” in Proc. 27th Int. Conf. Mach. Learn. (ICML-10), Haifa, Israel, 2010, pp. 807–814. [Google Scholar]
30. N. Mrabah, M. Bouguessa, M. F. Touati, and R. Ksantini, “Rethinking graph auto-encoder models for attributed graph clustering,” IEEE Trans. Knowl. Data Eng., pp. 1–31, 2022. [Google Scholar]
31. S. Zhou, et al., “Multiple kernel clustering with neighbor-kernel subspace segmentation,” IEEE Trans. Neural Netw. Learn. Syst., vol. 31, no. 4, pp. 1351–1362, 2019. doi: 10.1109/TNNLS.2019.2919900. [Google Scholar] [PubMed] [CrossRef]
32. S. Wang et al., “Fast parameter-free multi-view subspace clustering with consensus anchor guidance,” IEEE Trans. Image Process., vol. 31, no. 4, pp. 556–568, 2021. doi: 10.1109/TIP.2021.3131941. [Google Scholar] [PubMed] [CrossRef]
33. S. Wang, X. Liu, L. Liu, S. Zhou, and E. Zhu, “Late fusion multiple kernel clustering with proxy graph refinement,” IEEE Trans. Neural Netw. Learn. Syst., vol. 34, no. 8, pp. 4359–4370, 2021. [Google Scholar]
34. Z. Hou et al., “GraphMAE2: A decoding-enhanced masked self-supervised graph learner,” in Proc. ACM Web Conf. 2023, Austin, Texas, USA, 2023, pp. 737–746. [Google Scholar]
35. B. Yang, X. Fu, N. D. Sidiropoulos, and M. Hong, “Towards K-means-friendly spaces: Simultaneous deep learning and clustering,” in Int. Conf. Mach. Learn., Sydney, Australia, 2017, pp. 3861–3870. [Google Scholar]
36. J. Xie, R. Girshick, and A. Farhadi, “Unsupervised deep embedding for clustering analysis,” in Int. Conf. Mach. Learn., New York, USA, 2016, pp. 478–487. [Google Scholar]
37. H. Zhu and P. Koniusz, “Simple spectral graph convolution,” in Int. Conf. Learn. Rep., 2020, pp. 1–15. [Google Scholar]
38. C. Fettal, L. Labiod, and M. Nadif, “Scalable attributed-graph subspace clustering,” Proc. AAAI Conf. Artif. Intell., vol. 37, no. 6, pp. 1–9, 2023. doi: 10.1609/aaai.v37i6.25918. [Google Scholar] [CrossRef]
39. H. Zhao, X. Yang, Z. Wang, E. Yang, and C. Deng, “Graph debiased contrastive learning with joint representation clustering,” in Proc. Thirtieth Int. Joint Conf. Artif. Intell., 2021, pp. 3434–3440. [Google Scholar]
40. J. Xia, L. Wu, G. Wang, J. Chen, and S. Li, “ProGCL: Rethinking hard negative mining in graph contrastive learning,” in Int. Conf. Mach. Learn., Maryland, USA, 2022, pp. 24332–24346. [Google Scholar]
41. W. Jin, X. Liu, X. Zhao, Y. Ma, N. Shah and J. Tang, “Automated self-supervised learning for graphs,” in 10th Int. Conf. Learn. Rep. (ICLR 2022), 2022. [Google Scholar]
42. Y. Ma and K. Zhan, “Self-contrastive graph diffusion network,” in Proc. 31st ACM Int. Conf. Multimed., Ottawa, Canada, 2023, pp. 3857–3865. [Google Scholar]
Cite This Article
 Copyright © 2024 The Author(s). Published by Tech Science Press.
This work is licensed under a Creative Commons Attribution 4.0 International License , which permits unrestricted use, distribution, and reproduction in any medium, provided the original work is properly cited.
 Downloads
 Citation Tools