
 Submit a Paper
 Propose a Special lssue
 Open Access
ARTICLE

MUS Model: A Deep Learning-Based Architecture for IoT Intrusion Detection
1 College of Information Engineering, University of Engineering of the Chinese People’s Armed Police Force (PAP), Xi’an, 710000, China
2 College of Missile Engineering, Rocket Force Engineering University, Xi’an, 710000, China
* Corresponding Author: Yu Yang. Email:
Computers, Materials & Continua 2024, 80(1), 875-896. https://doi.org/10.32604/cmc.2024.051685
Received 12 March 2024; Accepted 16 May 2024; Issue published 18 July 2024
 View Full Text
 Download PDF
Abstract
In the face of the effective popularity of the Internet of Things (IoT), but the frequent occurrence of cybersecurity incidents, various cybersecurity protection means have been proposed and applied. Among them, Intrusion Detection System (IDS) has been proven to be stable and efficient. However, traditional intrusion detection methods have shortcomings such as low detection accuracy and inability to effectively identify malicious attacks. To address the above problems, this paper fully considers the superiority of deep learning models in processing high-dimensional data, and reasonable data type conversion methods can extract deep features and detect classification using advanced computer vision techniques to improve classification accuracy. The Markov Transform Field (MTF) method is used to convert 1D network traffic data into 2D images, and then the converted 2D images are filtered by Unsharp Masking to enhance the image details by sharpening; to further improve the accuracy of data classification and detection, unlike using the existing high-performance baseline image classification models, a soft-voting integrated model, which integrates three deep learning models, MobileNet, VGGNet and ResNet, to finally obtain an effective IoT intrusion detection architecture: the MUS model. Four types of experiments are conducted on the publicly available intrusion detection dataset CICIDS2018 and the IoT network traffic dataset N_BaIoT, and the results demonstrate that the accuracy of attack traffic detection is greatly improved, which is not only applicable to the IoT intrusion detection environment, but also to different types of attacks and different network environments, which confirms the effectiveness of the work done.Keywords
With the development of the Internet, computer technology [1] has penetrated into all aspects of human production and life. From food, clothing, housing and transport to mobile payments, from smart homes to drones, especially the emergence and popularity of IoT [2] has created a new situation of interconnecting everything, becoming an indispensable bridge connecting the digital world and the physical world. It collects, analyses and utilizes heterogeneous data through the interconnectivity of different devices to achieve seamless communication between systems, platforms and humans, thus assisting in the generation of smarter decisions (Fig. 1).
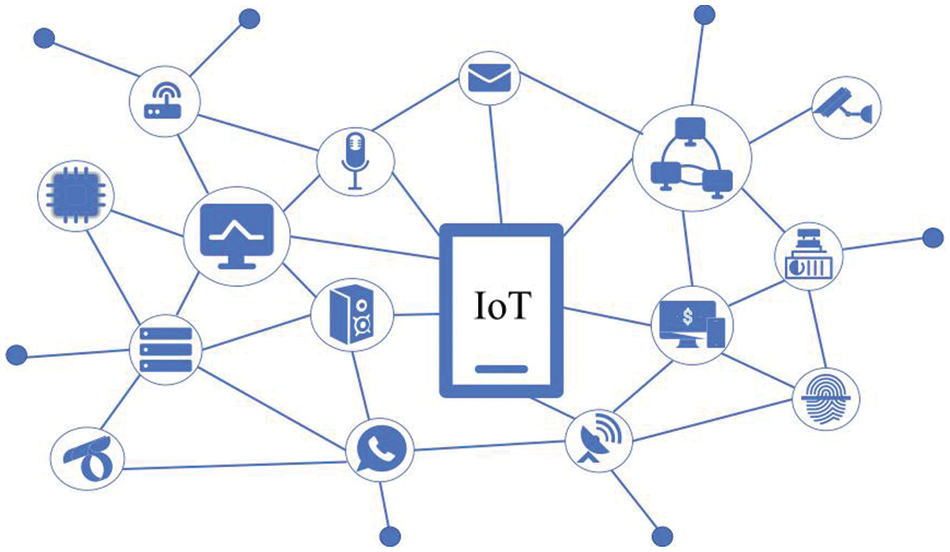
Figure 1: Examples of IoT components
However, due to the diversity and differences between smart devices belonging to IoT, and the layered, seamless, and unstable nature of the network structure, security is facing serious challenges, which are highlighted by the frequent occurrence of malicious attacks, which are harmful. On 20 October 2023, genetic testing provider 23 and Me suffered from a crash attack that led to the leakage of 6.9 million users’ data, which was described as the “the worst medical data breach”; on 8 November 2023, ICBC Financial Services LLC (ICBCFS), a wholly-owned US subsidiary of the Industrial and Commercial Bank of China (ICBC), was hit by a LockBit ransomware [3] attack that was launched using the Citrix Bleed vulnerability that was not patched in time attack, resulting in partial system disruption and affecting normal business. The occurrence of the above security incidents is not coincidental, the “2022 Annual Cyberspace Mapping Report” shows that the number of exposed smart connected devices such as cameras, routers, VoIP phones, etc., in 2022 have all exceeded 2 million units, which has a very high risk of information leakage, and this has directly led to the development and expansion of the market for IoT security industry [4] (Fig. 2).
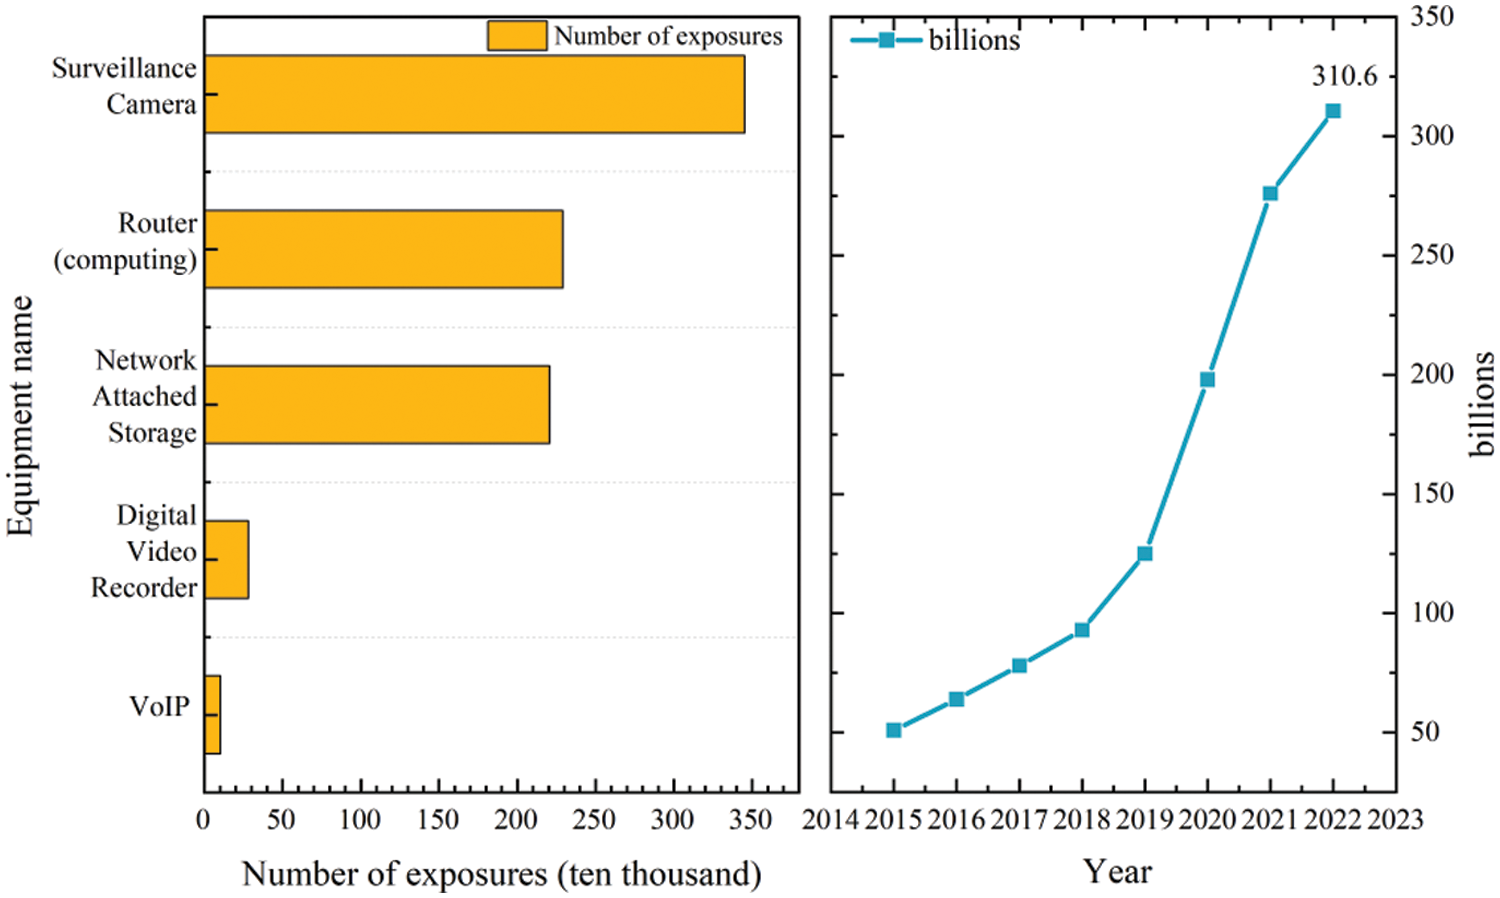
Figure 2: IoT security industry market trend chart
In the face of severe IoT network security problems, a complete IoT network security system [5] has been proposed (Fig. 3).
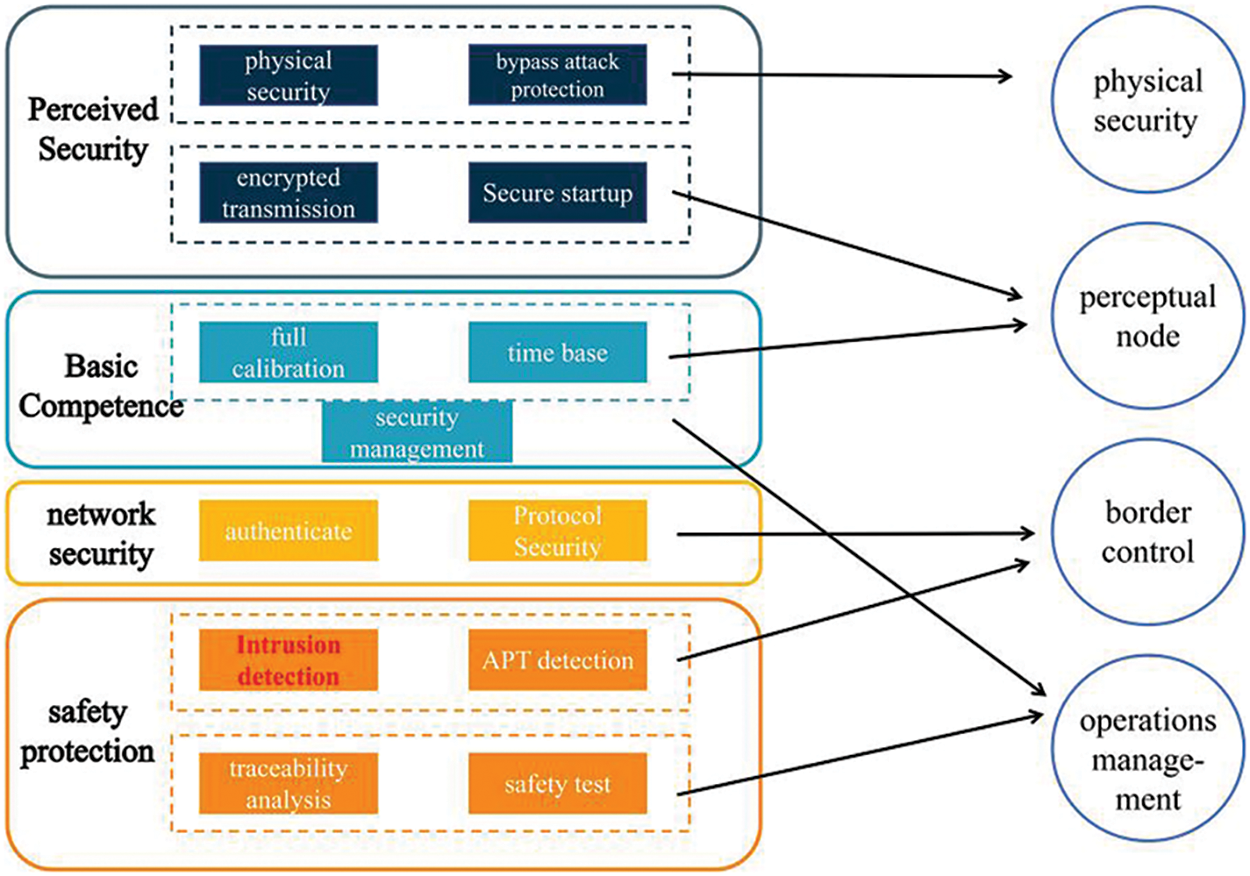
Figure 3: Internet of things network security system architecture
In order to achieve the solidity of the system and give full play to the system’s role, this paper starts the research from the bottom structure-security protection [6]. However, traditional network security protection means, such as data encryption [7], traceability analysis, firewall [8], access control [9], anti-virus wall, user authorization [10], etc., belong to the negative means of passive defence, and it is difficult to provide comprehensive security protection. Therefore, the active means of protection-intrusion detection technology urgently needs to be used, which focuses on the internal data, external data and misuse of active detection and early warning, to provide decision-making basis for operations and maintenance personnel. Although the current research for intrusion detection [11] technology is being carried out one after another, machine learning, deep learning and other artificial intelligence technology to make the detection performance greatly improved. However, it is far from enough for the network anomaly traffic detection which requires very high accuracy and costly false alarms, with the following problems:
(1) Directly using low-dimensional deep learning models to learn, train and test one-dimensional network traffic data, ignoring the superiority of deep learning in extracting complex features;
(2) Lacking the necessary and efficient feature extraction and further processing of network traffic data after simple preprocessing, which substantially affects the detection accuracy;
(3) Directly using baseline machine learning or deep learning models to detect and classify network traffic, which is highly dependent on the quality and diversity of the training dataset, with low model robustness and detection accuracy.
In order to further improve the detection accuracy of the IoT intrusion detection framework, this paper conducts research on the above issues, with the following main contributions:
(1) The MTF method is proposed to convert one-dimensional network traffic data into two-dimensional images, using Recurrent Neural Networks (RNN) instead of frequency counts to estimate the transfer probability, automatically learning the complex relationship between different states, accurately capturing the key features of the data, and having a stronger semantic understanding capability;
(2) Adopt Unsharp Masking filter to sharpen the converted 2D image, so as to enhance the image details and lay a good foundation for the next step of image classification and detection;
(3) Propose to construct an image classification model using the soft voting integration method to improve the detection accuracy, select three efficient baseline deep learning models for image classification: MobileNet, VGGNet, and ResNet, perform soft voting integration, and use the merged integrated model AVR Model to detect the image, which greatly improves the detection accuracy;
(4) Construct a MUS intrusion detection framework for IoT using MTF method and deep learning models. Three types of experiments are conducted on two datasets: N_BaIoT, and CICIDS2018, respectively, and the results prove that the detection accuracy of the proposed framework is substantially improved and is effective on IoT.
The line structure of this paper is as follows: Section 2 is the related work, including an overview comparison of research on intrusion detection techniques, data processing and integration methods; Section 3 is the methodology, including a detailed description of the MTF method, the improved Unsharp Masking filtering method, and the baseline image classification model soft-voting integration method, which ultimately constitutes the intrusion detection framework, MUS; and Section 4 is the implementation of the experiments. It includes a description of the dataset, experimental environment, setup conditions and process to demonstrate the effectiveness of the work done; Section 5 is the conclusion and outlook, which aims to summarize this paper and look forward to the future, providing a reference basis for researchers in related fields.
2.1 Intrusion Detection Systems (IDS)
Since Anderson first proposed the concept of intrusion detection in 1980 [12], the research of intrusion detection technology has become a hot spot in the field of network security protection, and the related researches have emerged and developed rapidly. Especially after Hinton et al. [13] proposed deep neural networks in 2006, along with the arithmetic power improvement of hardware devices and the surge of data volume, machine learning and deep learning algorithms have been widely used in the field of intrusion detection and achieved good results. Farooq et al. in their research [14] proposed a fusion intrusion detection framework based on machine learning, IDS-FMLT, for a heterogeneous network composed of heterogeneous networks composed of different source networks, and experiments proved that the detection accuracy of this framework on the training and validation sets can reach 96.73% and 95.18%, respectively, which significantly improves the detection accuracy; Qazi et al. in their research [15] proposed an intrusion detection based on convolutional neural network (CNN) and recurrent neural network (RNN) for the problem of difficulty in acquiring and analyzing the local features of the data, and proposed a convolutional neural network (CNN) and recurrent neural network (RNN) based intrusion detection system HDLNIDS, and achieved an average accuracy of up to 98.90% on the public dataset CICIDS2018; In their research [16], Xie et al. proposed an anomaly detection method based on Multi-Granularity Neighbourhood Residual Network (MGNRN) for the problem of difficult to obtain sample features comprehensively in the time series data, which was proved by experiments to significantly improve the detection accuracy on the task scenarios, especially on F1-Score, and provide a high-value method for the difficulty of deep feature extraction in time series. Yin et al. in their research [17] constructed an intrusion detection framework based on virtual fusion data for the IoT security problem, fused machine learning and deep convolutional neural network algorithm (DCNN), and proposed a new loss function with full consideration of user privacy protection, and the detection accuracy is up to 96.5% on the NSL-KDD dataset. The above studies make full use of the advantages of deep learning in feature analysis and learning, and they all achieve good detection results. However, they neglect the potential and effectiveness of deep learning models in extracting high-dimensional features, and all of them directly detect and classify one-dimensional network traffic, which cannot fully exploit the superiority of deep learning algorithms in terms of detection accuracy. Therefore, due to the above considerations, this paper adopts the MTF method, which converts one-dimensional network traffic into two-dimensional images, and combines the classical filtering method and the efficient image classification model to obtain higher detection accuracy and improve the level of IoT network security protection.
Data processing usually refers to numerical, normalization, feature extraction, feature dimensionality reduction and other operations on the collected data to clean the “dirty” data into “clean” data, laying the foundation for subsequent detection and classification. However, the arrival of the big data era has led to a surge in the amount of heterogeneous data from multiple sources, and the traditional simple data processing is no longer sufficient to effectively detect malicious traffic attacks. Therefore, a number of studies have made special processing of 1D network traffic before detection and classification, such as converting data types, feature engineering processing, etc. Terzi in their research [18] emphasised the superiority of the visual interpretation capability of deep learning algorithms and used the Gram’s Angle Field method (GAF) to convert 1D data to 2D images and classify the images using CNN, with a detection accuracy of up to 1.0% on the CICIDS2017. The detection accuracy on the dataset is up to 99.33%; Baldini et al. in their research [19] used Grey Level Co-occurrence Matrix (GLCM) and 2D Dispersion Entropy to convert 1D data into 2D grey scale maps, and later used the detection bias of machine learning algorithms to achieve an Error Rate (ER) of as low as 0.16% on the CICIDS2017 dataset; Siddiqi et al. in their research [20] proposed improved DeepInsight-based approach and Kernel Principal Component Analysis (KPCA) method to convert one-dimensional data into two-dimensional images, and after data augmentation, a deep learning classifier was used to classify the images on CSE-CIC-IDS 2018 and other three types of datasets experimentally proved to have high detection accuracy. All of the above studies convert one-dimensional network traffic into two-dimensional images for detection and classification, which not only allows the data to present more features and diversity, which is conducive to the model to better capture different types of network traffic behaviours; they also make use of the mature image processing techniques in the fields of computer vision and deep learning to better learn and train the model, and further improve the detection accuracy of malicious traffic. However, they only focus on image conversion using traditional data processing methods, while ignoring the way and accuracy of feature extraction, and the effective data information is not retained, converted and utilised on a large scale. Therefore, in this paper, we adopt the MTF method for image conversion, which can maximise the retention of sequence information, reduce the data dimensions, enhance local features, and help the deep learning model to better capture the key details related to intrusion.
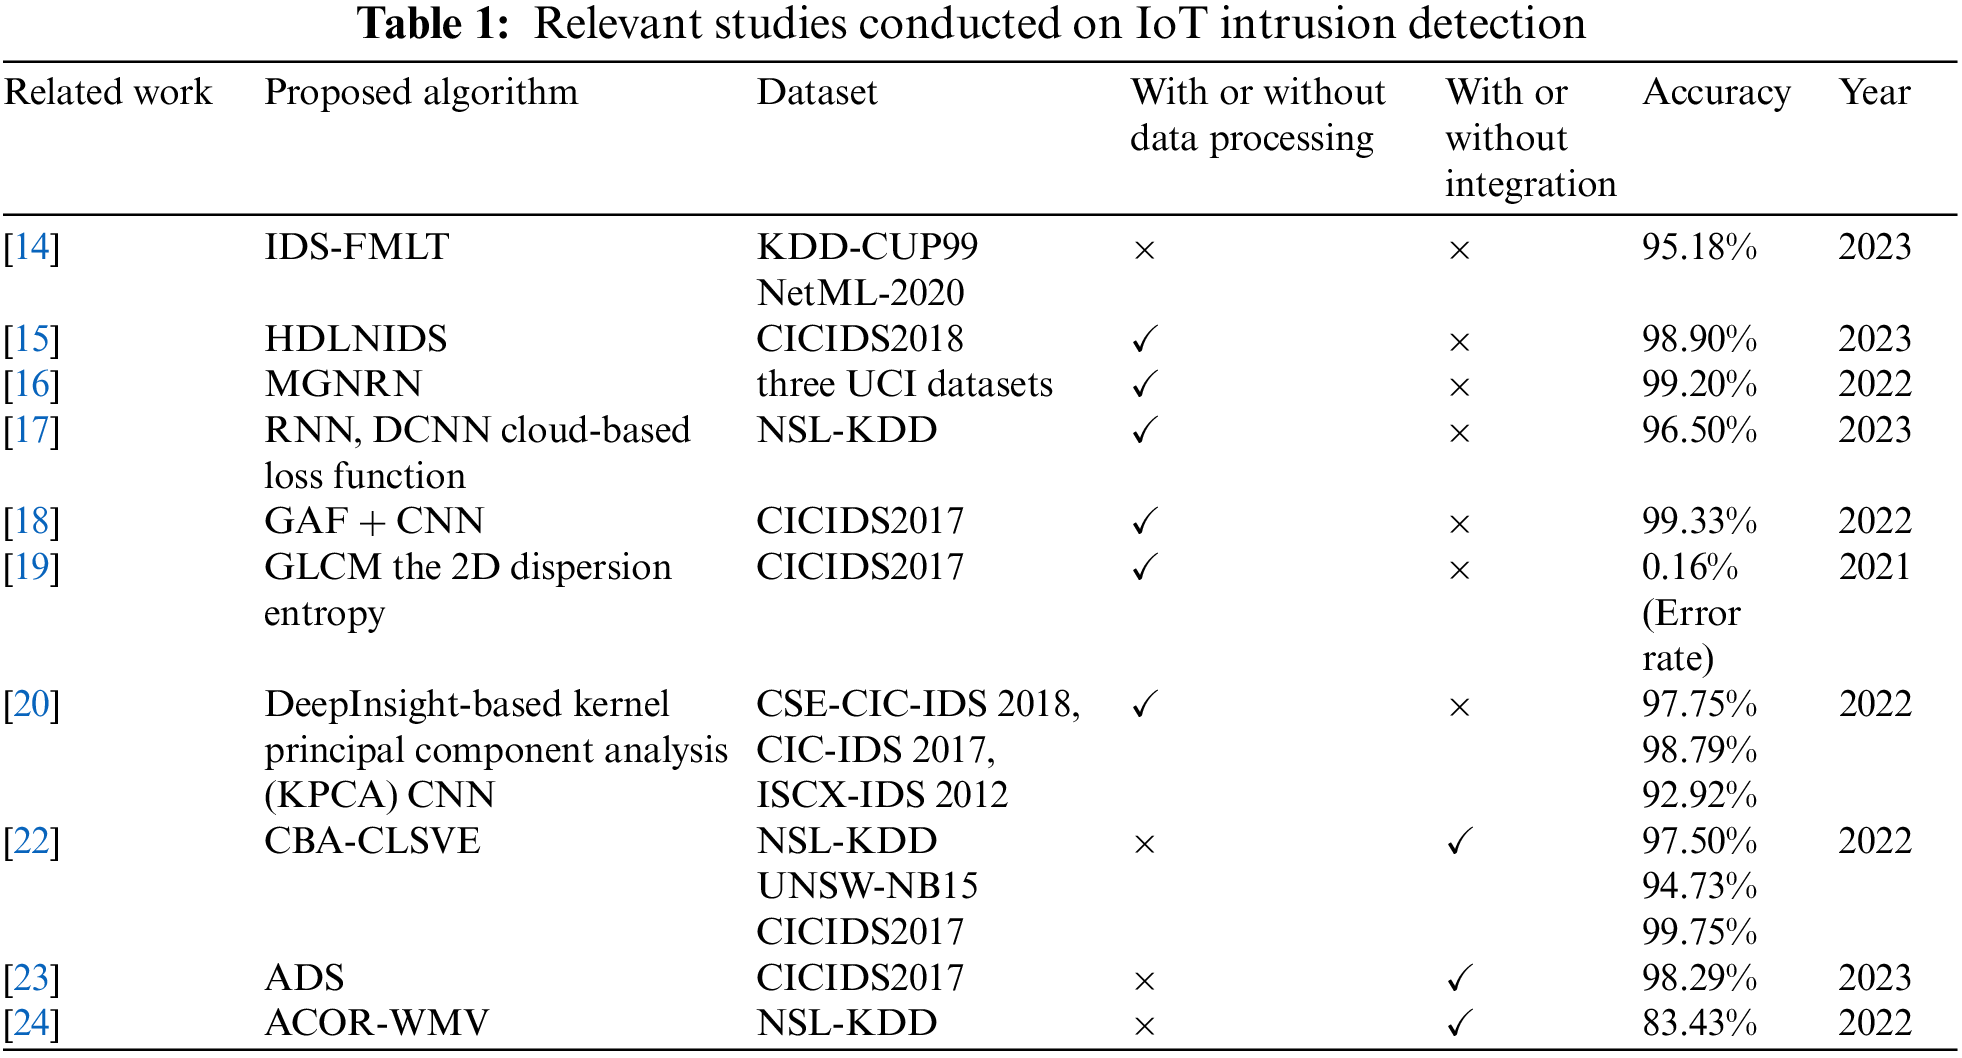
Ensemble Learning (EL) [21] is a learning method that accomplishes a learning task by combining multiple underlying learners. It uses a set of complementary learners for prediction, combining their outputs appropriately to improve the generalisation ability of the model, reduce the risk of overfitting, and in some cases produce better performance than the individual learners, and is now widely used in the field of intrusion detection. In their research [22], Shen et al. constructed a class-level soft-voting integration scheme (CBA-CLSVE) combining Chaos Bat Algorithm (CBA) with Support Vector Machines (SVM), K Nearest Neighbours (KNN), and Decision Trees (DTs) as the base learners, and experimentally proved the scheme to be effective on NSL-KDD, UNSW-NB15, and CICIDS2017 datasets; Alshede et al. in their research [23] developed a Random Forest (RF) and Convolutional Neural Network (CNN) based integrated voting method, and experimentally achieved up to 98.29% accuracy on the CICIDS2017 dataset, which is a significant increase in accuracy compared to other baseline models; Albashish et al. proposed a heterogeneous integrated classifier combining multiple baseline machine learning models and weighted majority voting in their research [24], and performed five classifications on the NSL-KDD dataset, and experimentally proved that the overall classification accuracy has been significantly improved. As shown in Table 1, the above study proves that integrated learning can effectively improve the detection accuracy of baseline deep learning models in intrusion detection, especially the soft voting integration method. Therefore, in this paper, on the basis of selecting three types of high-performing baseline image classification models: MobileNet, VGGNet and ResNet, we adjust the parameters and construct a soft-voting integration framework to improve the classification accuracy of abnormal traffic.
In order to give full play to the superiority of deep learning models in high-dimensional data learning and testing, and to further improve the accuracy of anomalous traffic detection and classification, it is different from the traditional research in which one-dimensional network traffic data are directly subjected to feature learning, training and classification. In this paper, we focus on the application of deep learning models on 2D images, using MTF method to convert 1D network traffic data into 2D images, and then using Unsharp Masking filter to sharpen the image to enhance the details, and finally constructing a soft-voting integration framework consisting of three types of baseline image classification models, namely MobileNet, VGGNet, and ResNet. The processed images are inputted into the integrated intrusion detection framework with high detection accuracy to obtain accurate classification of benign and abnormal traffic (Fig. 4).
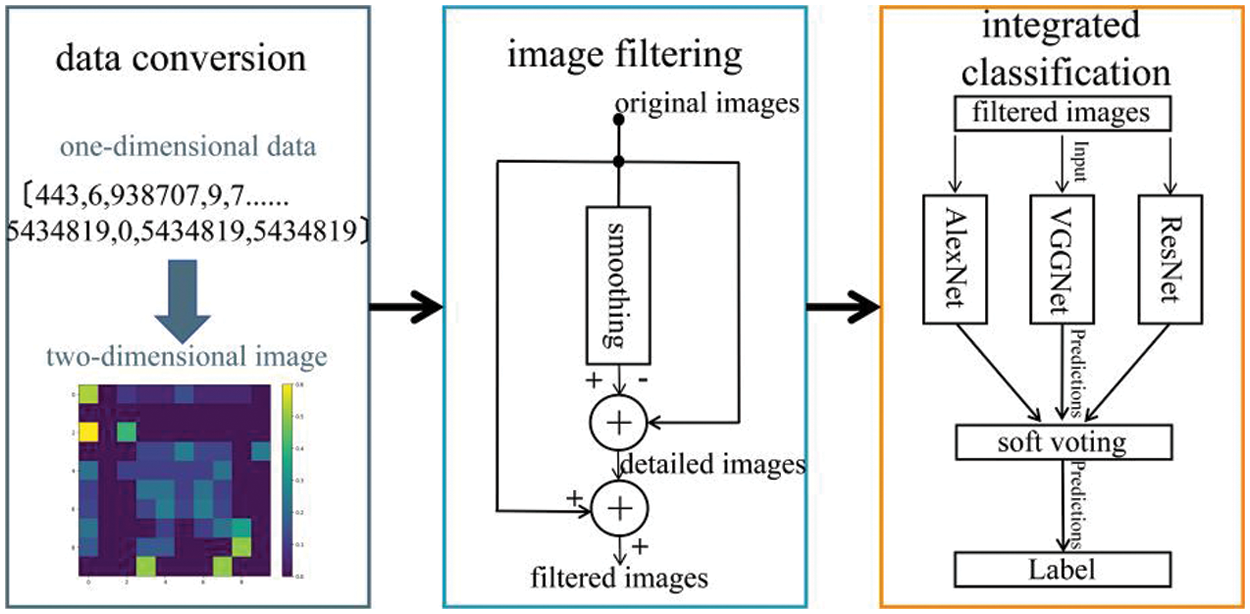
Figure 4: Intrusion detection integration framework
3.1 MTF [25]—for Data Type Conversions
MTF is a data type conversion method based on Markov stochastic process, belongs to the first step in the constructed intrusion detection framework for data type conversion, which regards the one-dimensional time series to be converted as a set of data conforming to the Markov stochastic process, i.e., the current state is related to the previous state only, and is not related to other previous states. Based on the above theory a Markov matrix can be constructed to expand the time series into a Markov transfer field, thus realizing the conversion of data types.
Taking a set of benign network traffic in the CICIDS2018 dataset as an example, the process can be briefly described as follows: the first step is to divide the one-dimensional time series X = {x1, x2,..., xn} into Q bins Q = {q1, q2,..., qn}, which serves to discretize the data; at the same time, the time series data can also be mapped into the Q quantile bins, which facilitates the subsequent transformation into Markov matrices; the second step is to construct the Markov transfer matrix W (Eq. (1)).
where wij denotes the frequency of transfer of data from quartile box i to quartile box j. In this case, frequency counts or frequency statistics are usually used to estimate the transfer probability. For example, using maximum likelihood estimation or frequency statistics, the transfer probability is estimated based on the number or frequency of transfers between states occurring in the historical data. Based on these estimates, the number of occurrences of neighbouring sub-sequences in the actual data is counted and normalized to a probability value, which represents the likelihood of transferring from one state to another, thus estimating the transfer probability between neighbouring sub-intervals (Eq. (2)).
where p(i,j) denotes the probability of transferring state i to state j in the data; count(i,j) denotes the frequency or number of transfers from state i to state j, which can be obtained by updating the number of (i,j) in real time on the transfer count matrix C initialized with N * N (N is the number of states); similarly, count(i,k) denotes the number of transfers from each state i to the other states, denoting the the total number of transfers from state i to any state; the transfer probability p(i,j) can be obtained by dividing the number of transfers in the specified state interval count(i,j) by the total number of transfers from the specified state to any state.
The third step is to construct the Markov transfer field M (Eq. (3)), which achieves the purpose of representing the spatial distribution of transfer probabilities by arranging each transfer probability in the Markov transfer matrix W along the time order. Finally, the matrix elements are mapped to 2D matrix pixel values, and the transformed 2D image is obtained by displaying the transfer probabilities between different states and visualizing the transfer patterns and correlations in the data (Fig. 5).
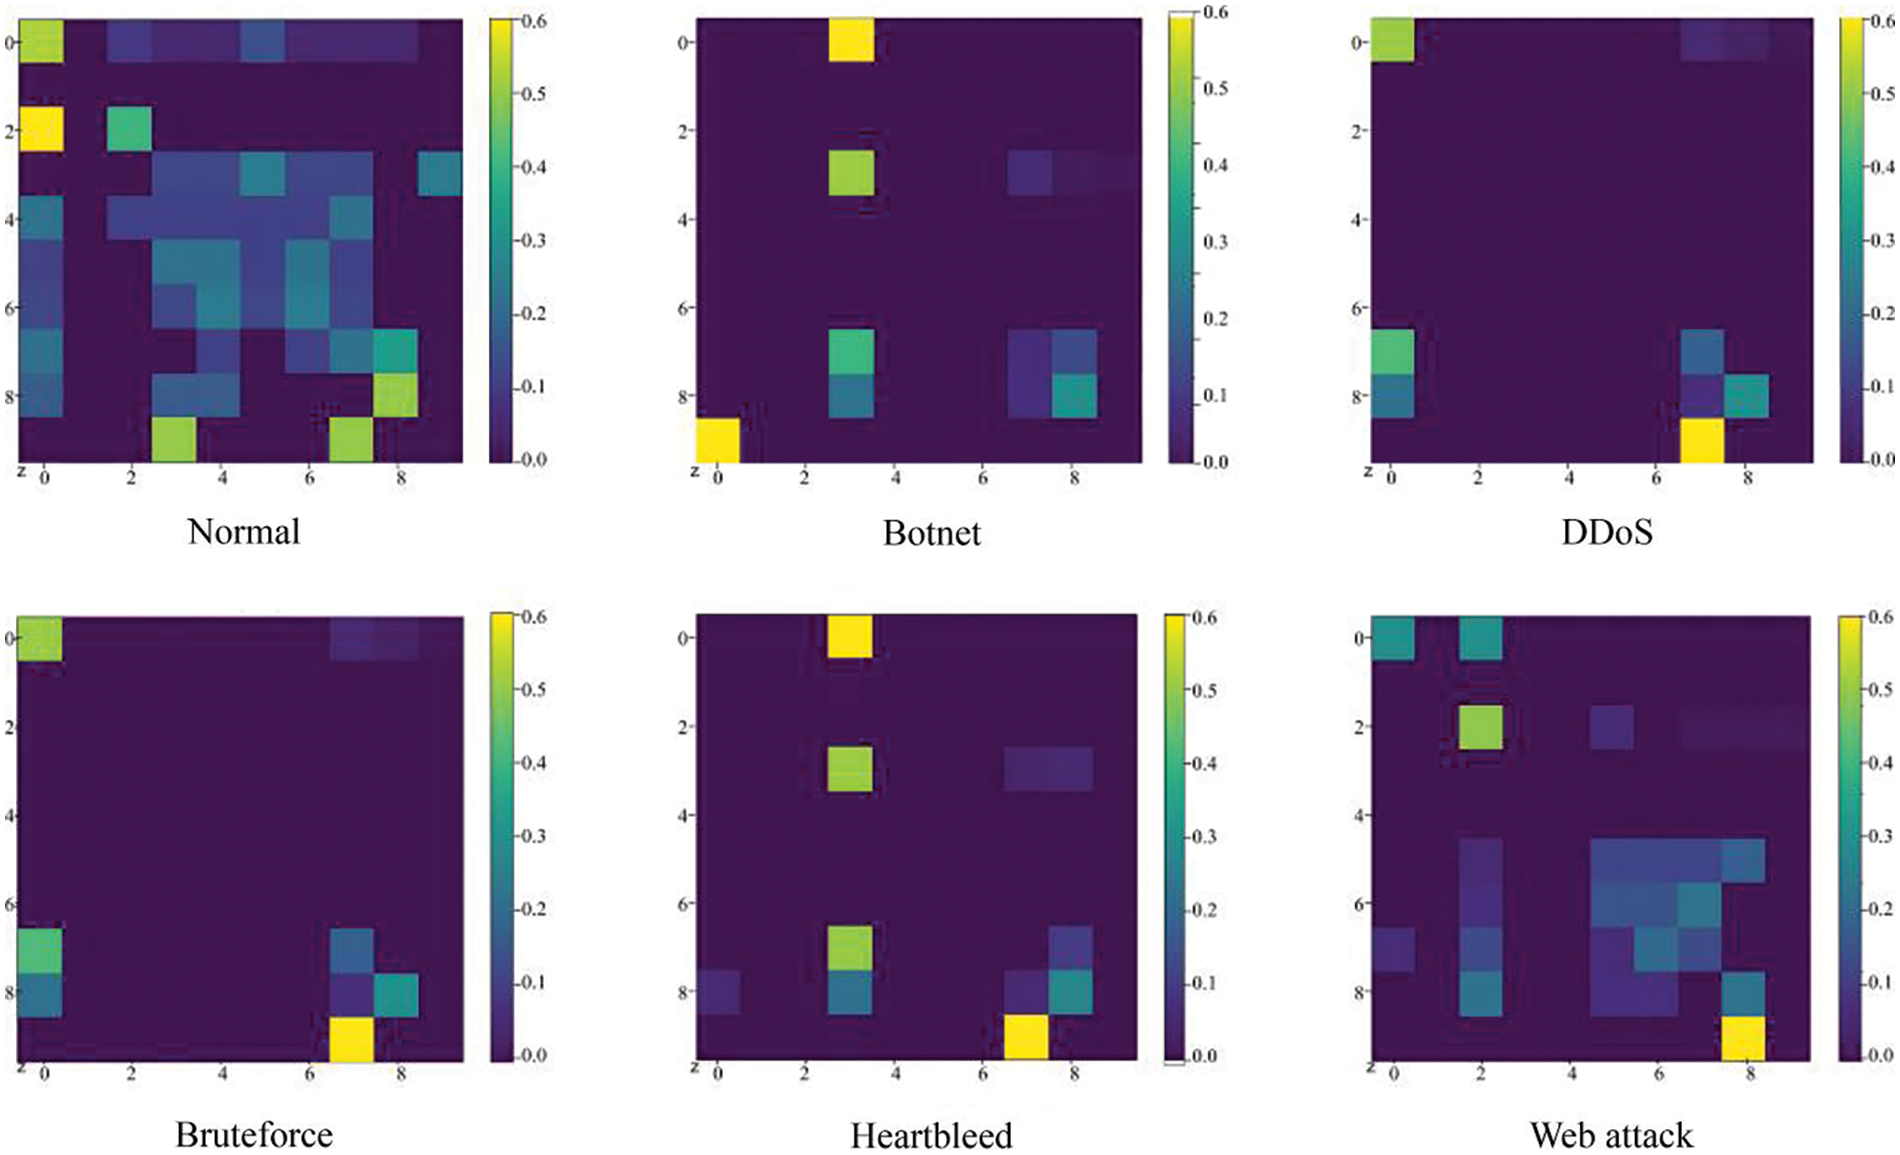
Figure 5: 2D image after MTF conversion
3.2 Unsharp Masking [26]–for Image Feature Processing
The Unsharp Masking method is an effective image sharpening method, belonging to the second step in the constructed intrusion detection framework for image feature processing, which serves to sharpen the image edge details by enhancing the high-frequency details of the image, and strengthens the deep-level feature expression and learning. It mainly consists of three steps: constructing a blurred image, generating an image with high-frequency details, and enhancing image details (Fig. 6).
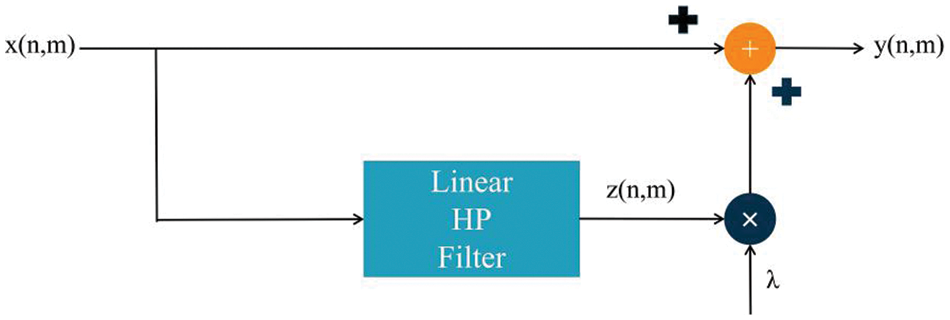
Figure 6: Unsharp Masking schematic diagram
Specifically, the original image x(n,m) (n,m represents the pixel coordinates of the image) is first filtered out the high-frequency details by a low-pass filter (e.g., Gaussian filter) to generate a blurred image that does not contain the high-frequency details; then the original image is subtracted from the blurred image to generate the high-frequency detail image z(n,m); and finally the original image is added to the high-frequency detail image by the enhancement factor λ to get the output image y(n,m) (Eq. (4)), which is enhanced with details and sharpened with edges. Finally, the original image is added to the high-frequency detail image by the enhancement factor λ to obtain the output image y(n,m) after detail enhancement and edge sharpening (Eq. (4)).
Meanwhile, in the traditional USM algorithm, z(n,m) can be generally obtained by Eq. (5).
The 2D image converted by the MTF method can be filtered by Unsharp Masking to obtain a high-quality image with sharpened edge details (Fig. 7), which is convenient for the next step of the image classification model to carry out deep feature learning and achieve high-precision anomalous traffic detection and classification.
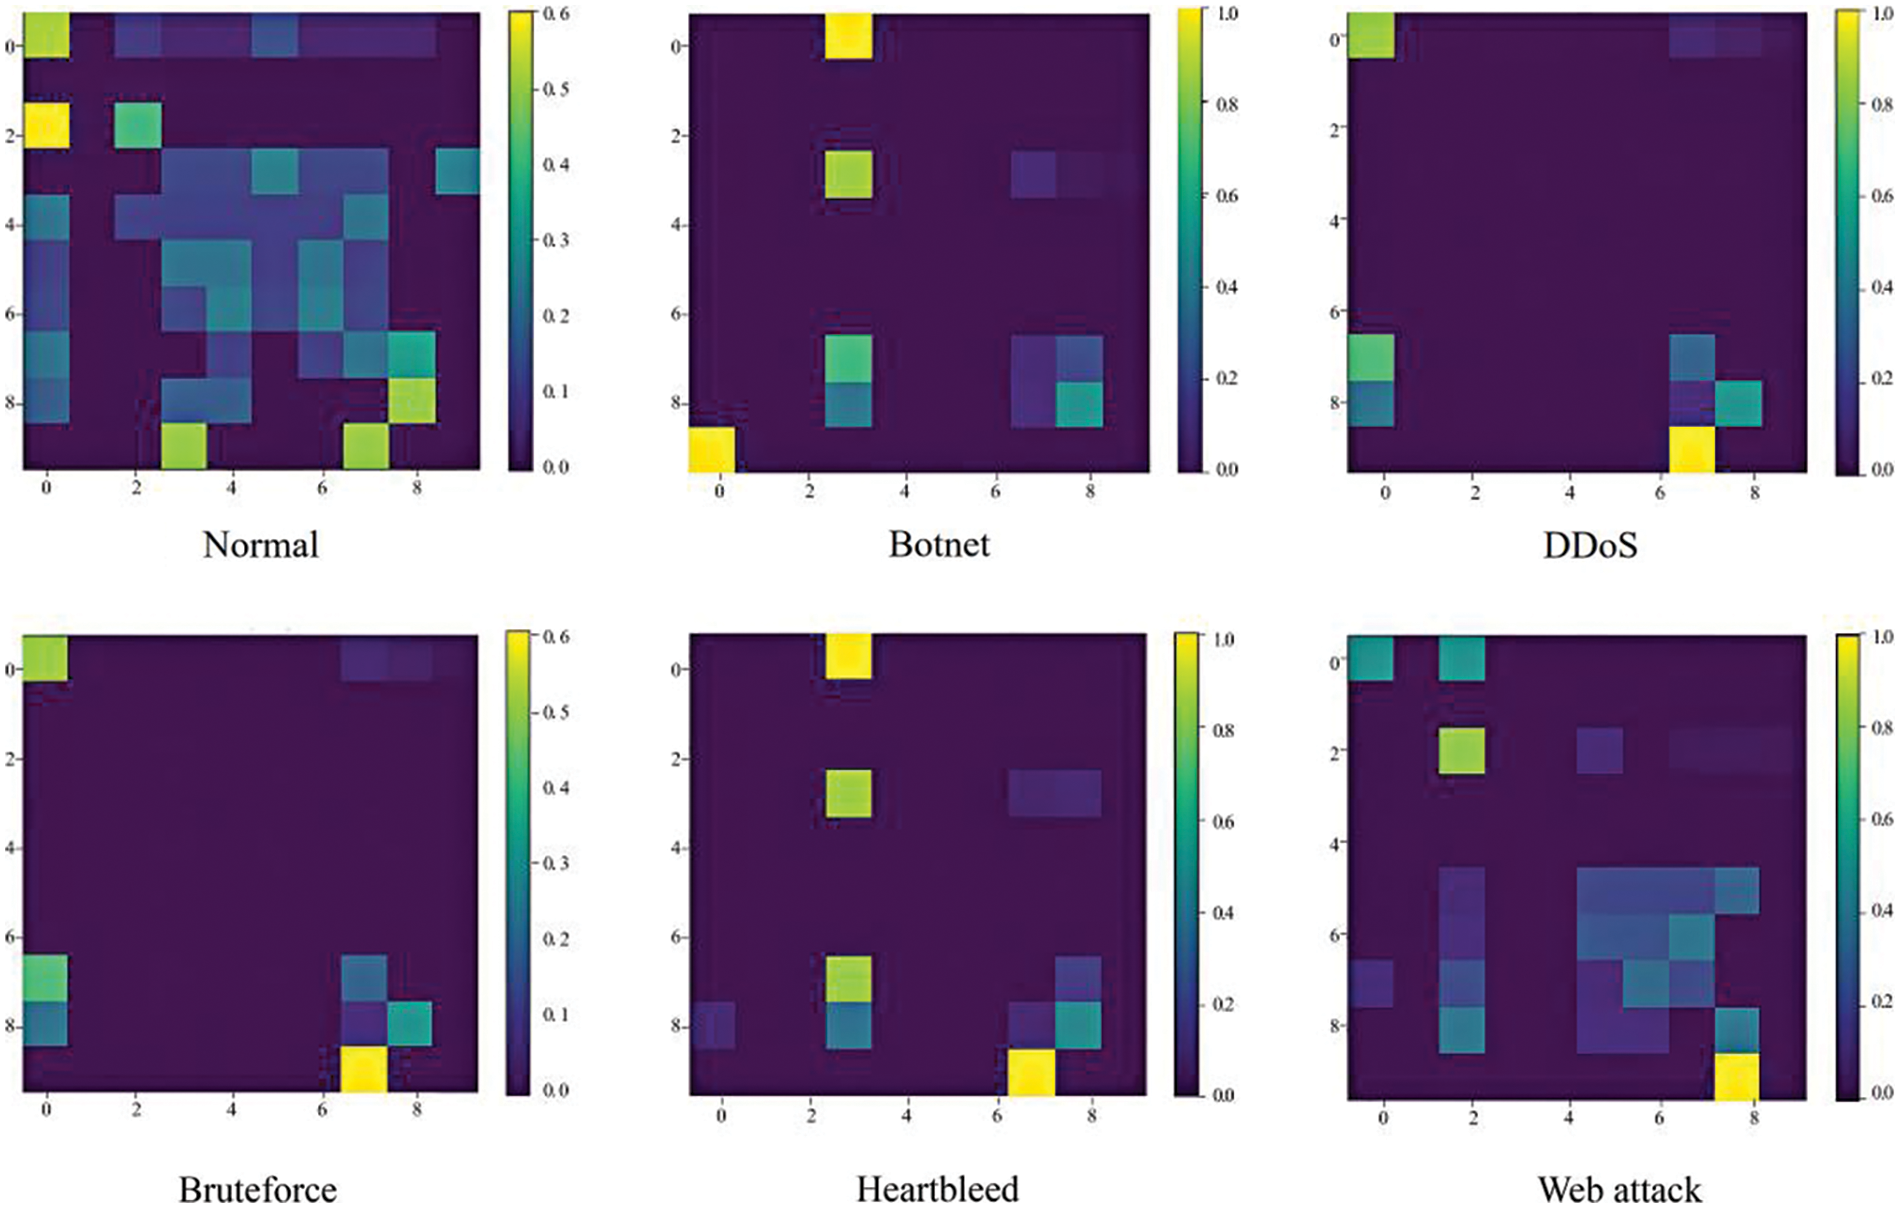
Figure 7: 2D image after Unsharp Masking
3.3 Soft Voting Integration—for Image Detection Classification
When using a single image classification model, the classification accuracy and effectiveness may be far inferior to an integrated model built from multiple baseline models, even though the parameters are tuned appropriately. In particular, soft-voting integration methods make decisions by weighted averaging or voting the predictions of multiple models: for a multi-category classification problem, the probabilities of each model on each category are weighted averaged or weighted summed to obtain the final category prediction. It is usually possible to improve the performance of the integrated models, make full use of the advantages of each model, reduce the risk of overfitting, and give higher weights to the predictions with higher confidence, thus improving the overall accuracy and robustness. Therefore, in this paper, we select three baseline image classification models with large differences, MobileNet, VGGNet and ResNet, and integrate them using a soft-voting method to form a final integrated model, AVR Model, belongs to the third step in the constructed intrusion detection framework for image detection classification, to improve the detection accuracy.
3.3.1 Three Types of Baseline Models—MobileNet, VGGNet and ResNet
VGGNet was proposed by Simonyan et al. in 2014 [27], which consists of sixteen convolutional layers and three fully-connected layers with a pooling layer between every two convolutional layers; multiple small 3 * 3 convolutional kernels are also stacked to increase the depth of the network to obtain deeper features, and its main feature is that the structure is simple and clear and easy to build; ResNet was proposed by Shafiq et al. in 2015 [28], which introduces residual connections to skip the multilayer structure in the network to mitigate the phenomenon of gradient vanishing, each residual block has multiple convolutional and normalisation layers and is connected by constant mapping, the main feature is that the residual connections are used to effectively mitigate the phenomenon of gradient vanishing. MobileNet belongs to a kind of lightweight model, which was proposed by Google in 2017 of [29], MobileNet replaces the standard convolution in VGGNet with depth-separable convolution, and adds a point-by-point convolution layer using ReLU activation function behind some of the layers, the main feature is to reduce the model size and computation as much as possible while maintaining higher accuracy, and with depth-separable convolution as the core feature, it achieves a good performance in the design of lightweight models [3]. All the above three types of baseline models have achieved good performance in the field of image classification, and their respective characteristics are different and differ. Therefore, in this paper, we adjust to the appropriate model parameters to integrate them with soft voting.
3.3.2 Soft Voting Integration Model—AVR Model
AVR Model improves detection accuracy by integrating three classes of baseline models MobileNet, VGGNet and ResNet. Using the soft-voting integration method, the classification results of the three models are weighted and combined to finally form the most credible and unified classification results (Algorithm 1). The integration process can be represented by Eq. (6).
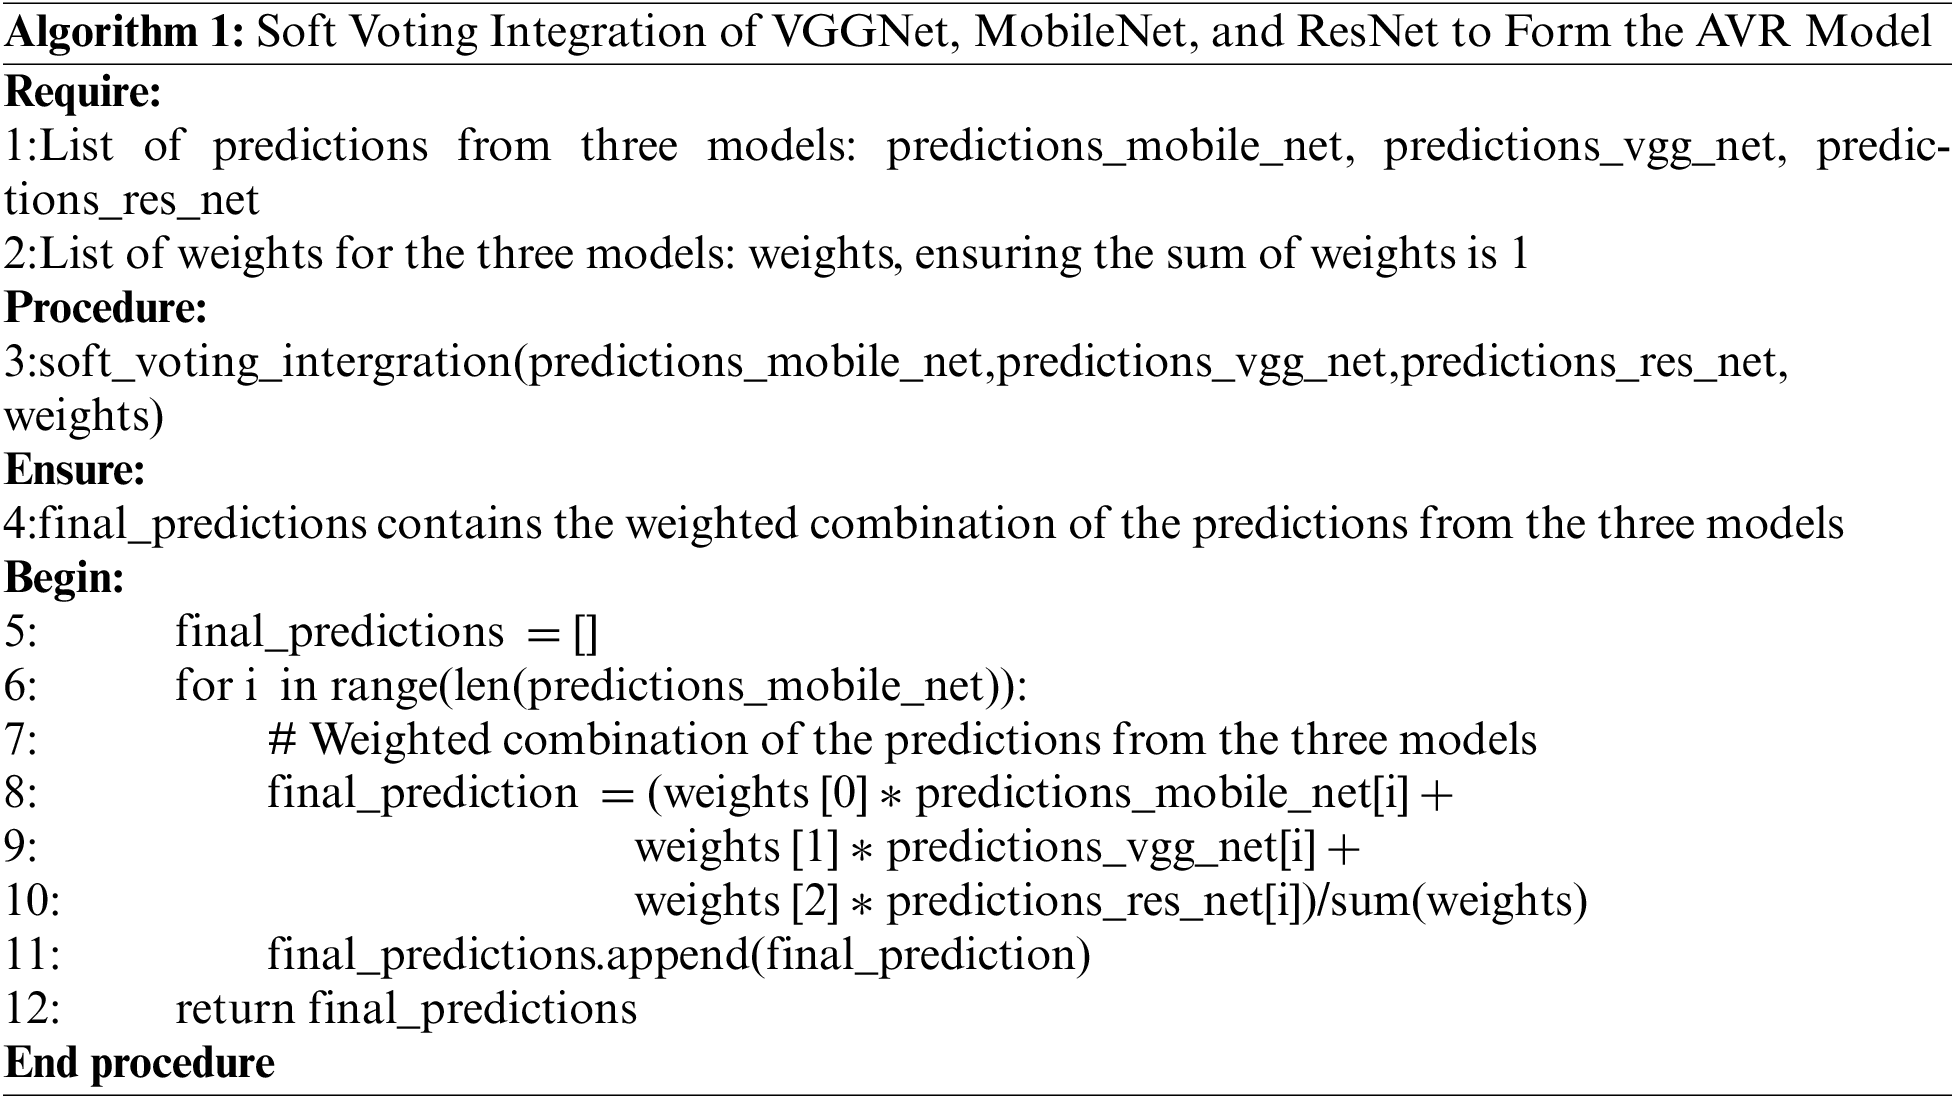
where SV represents the soft-voting integrated prediction function of the three component models MobileNet, VGGNet & ResNet. AVR Model architecture is shown in Fig. 8.
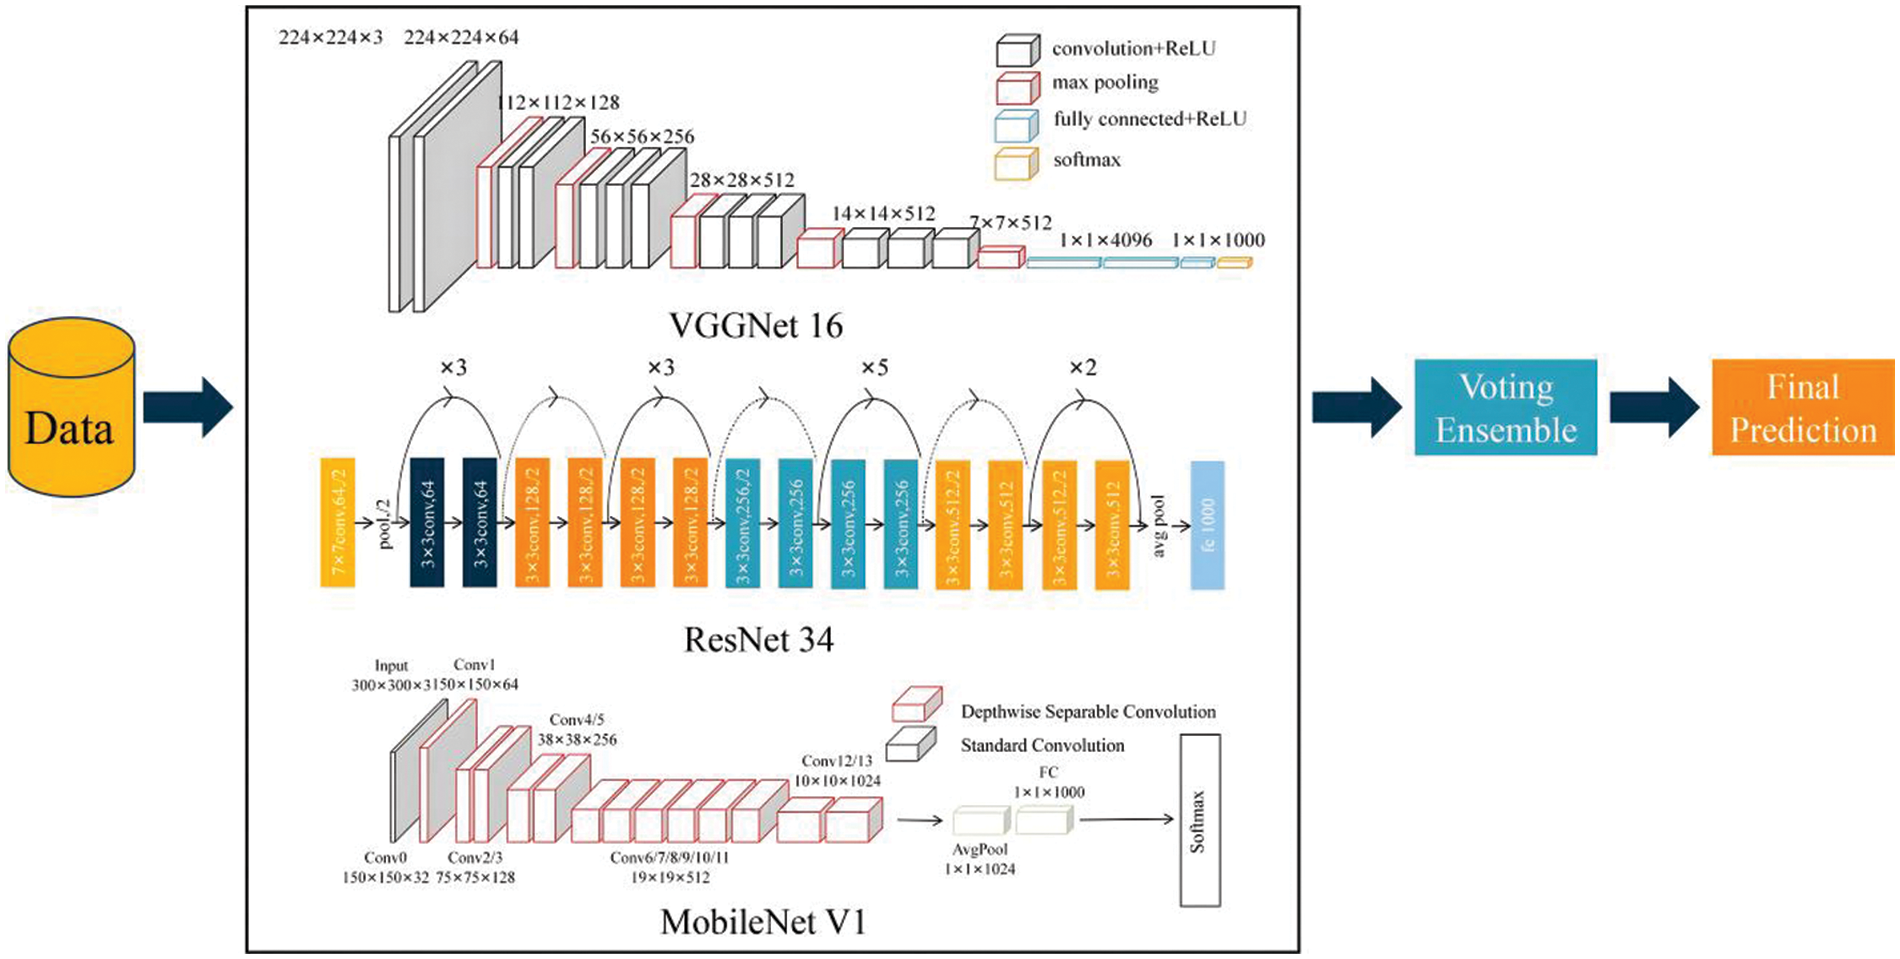
Figure 8: AVR Model framework structure diagram
The focus of this chapter is to describe the conditions, details and process of the experimental implementation in order to confirm the effectiveness of the methods involved with the construction of the intrusion detection framework. Based on various evaluation metrics, the performance of the methodological models is evaluated in all aspects to illustrate the limitations and advantages of the models to provide a feasible and high performance approach for the field of intrusion detection.
4.1 Introduction to the Data Set
Considering the necessity of comparing with other related work in the field of intrusion detection and the applicability of the application scenario as IoT, this paper selects two publicly available datasets: the dataset CICIDS2018, which is widely used by researchers, to facilitate comparative experiments with other models; and the dataset N_BaIoT, which contains data on networking of smart devices in the Internet of Things (IoT), in order to validate the fit with IoT environments.
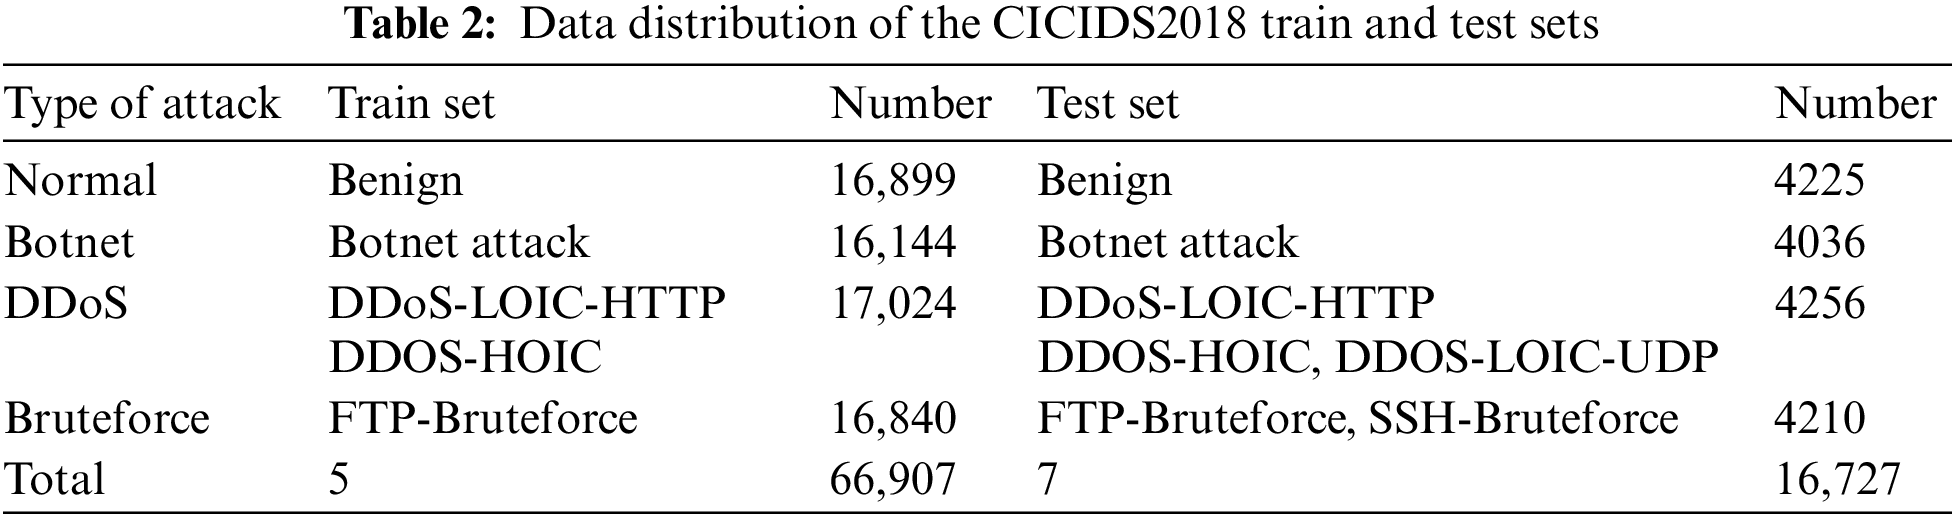
CICIDS2018 dataset was collected by the Canadian Institute for Cybersecurity Research in 2018 and contains seven types of attack scenarios: brute force, heartbleed leaks, botnets, DoS, DDoS, web attacks, and internal penetration, collected from five departments, 420 machines, and 30 servers using the CICFlowMeters-V3 traffic capture software. Compared to the NSL-KDD, KDDCUP99 dataset, the temporal dimension is more novel and contains the latest cyberattack diversity and capacity. However, CICIDS2018 contains 16,232,943 data, including 59,721 null data, and there are also incomplete and repetitive data, the massive data will increase the training model overhead, and the meaningless data will reduce the model efficiency. Therefore, data preprocessing is carried out, data cleaning is performed, null data, error data, incomplete data and duplicate data are deleted, and three major types of attack data and one type of normal data are extracted according to the difficulty of each type of attack in the original data, forming a new training set and test set (Table 2).
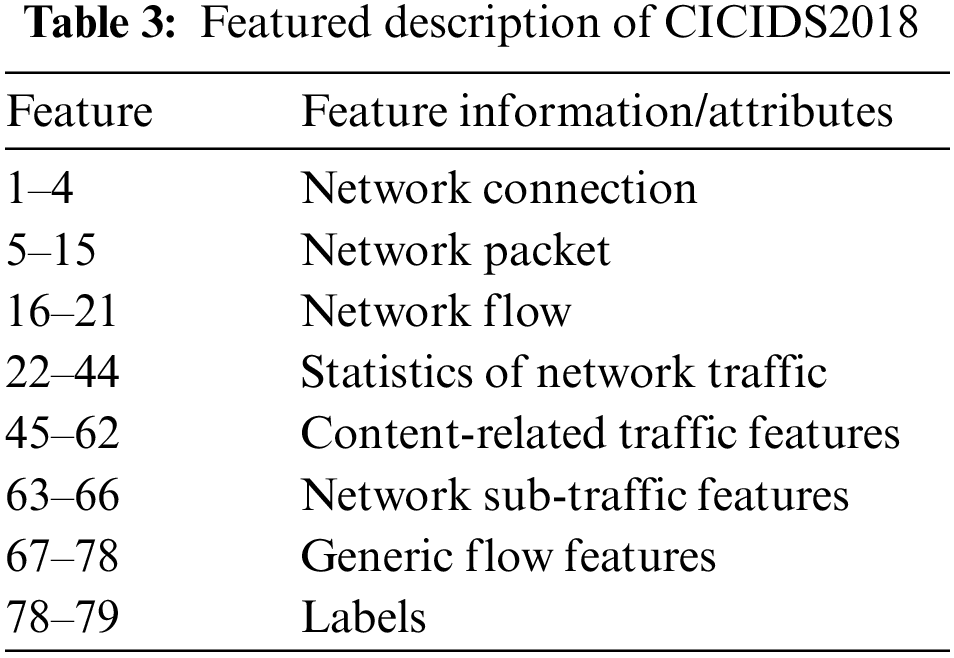
CICIDS2018 contains a total of 83 features and 1 tag class, deleting the “Timestamp” feature because Timestamp records the time of the attack, which has no practical significance and reference value for the detection of network attacks in all-weather hours; deleting the “Flow ID”, “Src IP”, “Src Port”, and “Dst IP” because these four features only appear in the flow of one day, and most of the flow data does not contain these features; using the remaining 78 features for the training of the intrusion detection model, as shown in Table 3.
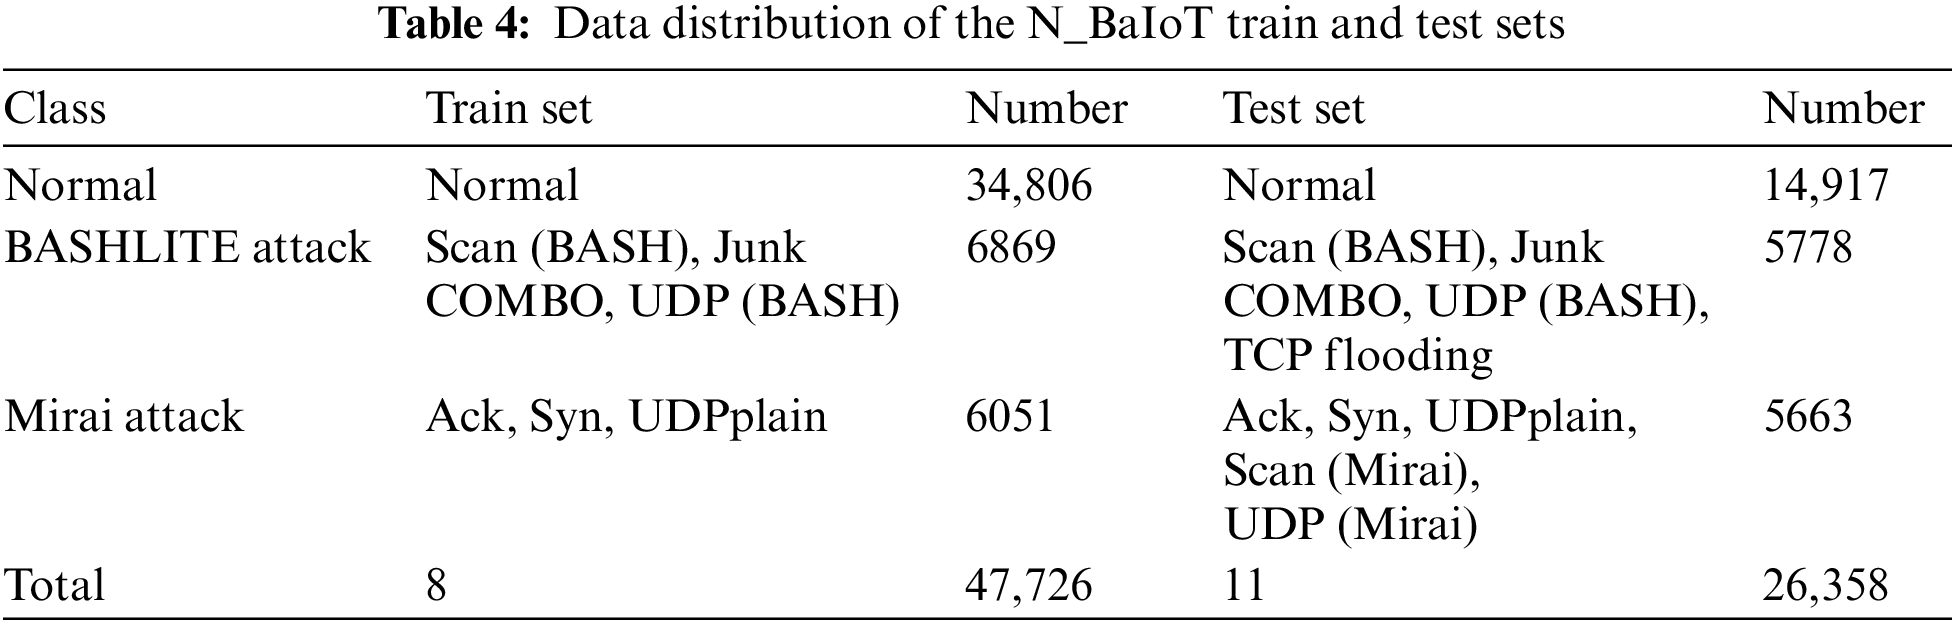
N_BaIoT dataset contains malicious attack traffic collected from nine IoT devices involving two types of botnet attacks, Mirai and BASHLITE, which can be subdivided into 10 categories of attacks, and are specifically designed to launch botnet attacks against IoT environments. N_BaIoT contains a total of 7,062,606 instance data, and in order to improve the model training efficiency and reduce unnecessary arithmetic consumption, the training set and test set are divided according to Table 4. In addition, its 115 features are appropriately filtered and cleaned for input into the intrusion detection framework.
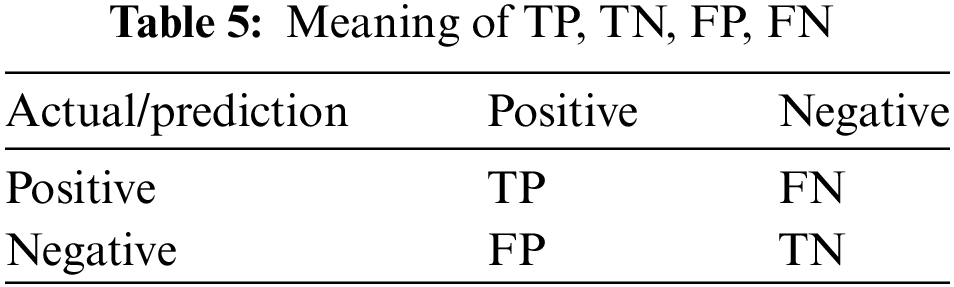
In order to facilitate comparison and validation with other related work in the field of intrusion detection, this paper selects four common types of evaluation metrics: accuracy, precision, recall and F1-Score, where accuracy is used to measure the proportion of samples correctly predicted by the model, precision is used to measure the reliability of the model in making positive class predictions, recall is used to measure the ability of the model to predict positive samples, and F1-Score is a combined consideration of precision and recall, and is the reconciled average of the two. Recall are considered together and are the reconciled mean of the two, which is used to measure the balanced performance of the model.
The meanings of the sub-indicators TP, TN, FP and FN are shown in Table 5.
4.3 Experimental Implementation
To validate the effectiveness of the proposed method and the constructed framework in this paper, three types of experiments are mainly conducted on two datasets, CICIDS2018 and N_BaIoT: (1) ablation experiments are conducted on the MTF used for data type conversion and compared with other type conversion methods to validate the effectiveness of the MTF on the conversion of one-dimensional data to two-dimensional images; (2) ablation experiments on AVR Model, a soft-voting integration model for image detection and classification, and compare its detection performance with individual baseline models VGGNet, ResNet and MobileNet on task scenarios to validate the utility of the integration approach for image classification; (3) comparative evaluation experiments on MUS Model, an entire intrusion detection framework, compared with SVM, DT, RNN, CNN four classes of machines with deep learning baseline models to illustrate the value of the work done.
4.3.1 Evaluation of MTF Methods for Data Type Conversion
Since the images generated in this paper are mainly used for the detection of the image classification module, no metrics specifically for assessing image quality are used; instead, different data conversion methods are combined and compared with the baseline image classification model, CNN, so as to illustrate the effectiveness of the MTF method in the whole intrusion detection framework using classification assessment metrics. Firstly, this paper selects unprocessed one-dimensional data as the input source and compares the detection performance of MTF on CNN to illustrate the necessity and importance of data type conversion; meanwhile, classical data type conversion methods such as GAF, STFT and recursive map are set as the control group to illustrate that it is more effective and practical to adopt the MTF method in the intrusion detection framework constructed in this paper.
As can be seen from Fig. 9, the MTF method in the constructed framework achieves higher detection accuracy on both the CICIDS2018 and N_BaIoT datasets compared to the control group, which can be explained in two ways: firstly, compared to the one-dimensional data processing methods that do not use image conversion methods, the STFT, Recurrence Plot, GAF, and MTF methods that convert the one-dimensional network traffic data into 2D images for detection and classification, all of which achieve a high accuracy rate, due to the fact that the conversion of data types can learn deep features, and 2D images are more capable of capturing spatio-temporal features; it facilitates the use of advanced computer vision and image processing techniques to enhance the pattern recognition ability, which leads to effective training and classification, and embodies the superiority of the idea; secondly, in comparison with STFT, Recurrence Plot, GAF and other image transformation methods, the MTF method achieves the best performance on both the CICIDS2018 and N_BaIoT datasets, which is due to the fact that the MTF can extract features at multiple scales, thus capturing patterns and features at different scales in the dataset, which helps to characterise the data in a more comprehensive way and facilitates subsequent detection classification. It is also worth noting that the experimental results show that all the four types of methods outperform the dataset N_BaIoT on the dataset CICIDS2018, indicating that the adopted frameworks are more effective in representing the characteristics of the CICIDS2018 dataset, which is not only applicable to the widely used IoT, but also applicable to different scenarios and attack types.
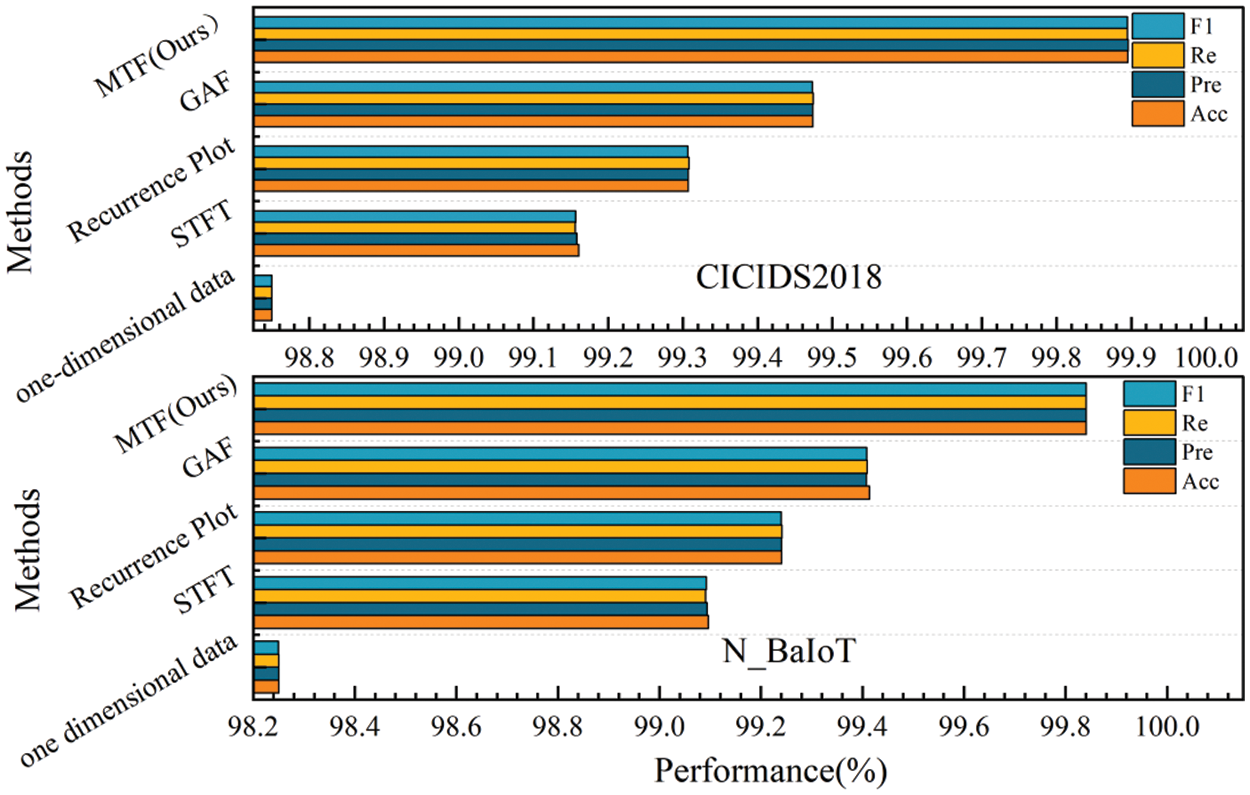
Figure 9: Experimental diagram of MTF evaluation
In order to comprehensively evaluate the effectiveness of the constructed integrated model AVR Model, it is compared with three single baseline models, VGGNet, ResNet and MobileNet, in the classification task of two types of datasets, and the experimental results of the four evaluation metrics are as follows:
As can be seen from Fig. 10, AVR Model outperforms the single baseline model in all four categories of evaluation metrics on both types of datasets. This is due to the fact that AVR Model has the characteristic of diversity integration, which is able to gather the advantages of the three models and make up for their shortcomings; in addition, it is able to reduce the risk of overfitting, synthesise the feature representations of each baseline model, and reduce the stochasticity. Specifically, AVR Model significantly outperforms all the single baseline models in terms of overall classification accuracy, which indicates that the integrated model is able to combine the advantages of the different models and handle complex classification tasks more efficiently; the precision rate of AVR Model also exhibits high performance, which suggests that there are fewer misclassifications in determining the positive class of samples; and lastly, the significant improvement in the F1-Scores further proves that AVR Model is superior in maintaining a balance between precision rate and recall balance of AVR Model. Taking the above experimental results together, it can be seen that AVR Model outperforms the single baseline model in all the evaluation metrics, proving its effectiveness and efficiency in dealing with complex classification tasks. This is due to its ability to integrate the features of multiple models, thus compensating for the deficiencies of a single model and improving the overall performance.
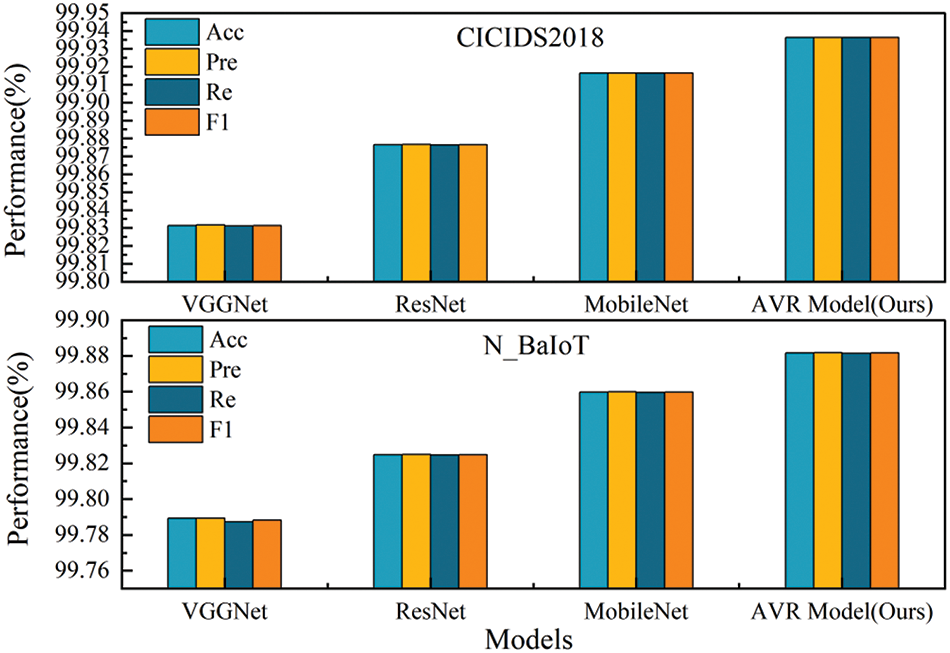
Figure 10: Experimental diagram of AVR Model evaluation
The above two types of ablation experiments illustrate the effectiveness of the modules in the intrusion detection framework, however, the role of the independent modules does not indicate the performance of the overall framework. Therefore, in order to evaluate the superiority of the intrusion detection framework MUS in the field of IoT security, comparative experiments with classical machine learning models SVM, DT and deep learning models RNN, CNN are conducted on two types of datasets, CICIDS2018 and N_BaIoT, and evaluated with four types of metrics.
As can be seen from Fig. 11, the constructed MUS intrusion detection framework achieves the highest detection accuracy on the CICIDS2018 dataset, indicating that MUS can identify intrusions more accurately in complex network traffic data; MUS likewise performs best on the N_BaIoT dataset, which contains a large amount of data from IoT devices,. It further shows that MUS has strong detection capability in IoT environment. Taken together, the above experimental results show that the MUS framework demonstrates better performance than traditional machine learning models and deep learning models on both types of datasets, this is due to the fact that the MUS framework contains three modules of data conversion, image processing and detection and classification, which are able to convert one-dimensional data into two-dimensional images, mine deep-seated features with the help of advanced computer vision and image processing techniques, and use the soft-voting integration model AVR to combine the advantages of the three types of baseline models for accurate detection, which further proves the superiority of the MUS framework in the field of IoT security, and its efficient detection capability can help better identify and defend against a variety of cyber-attacks.
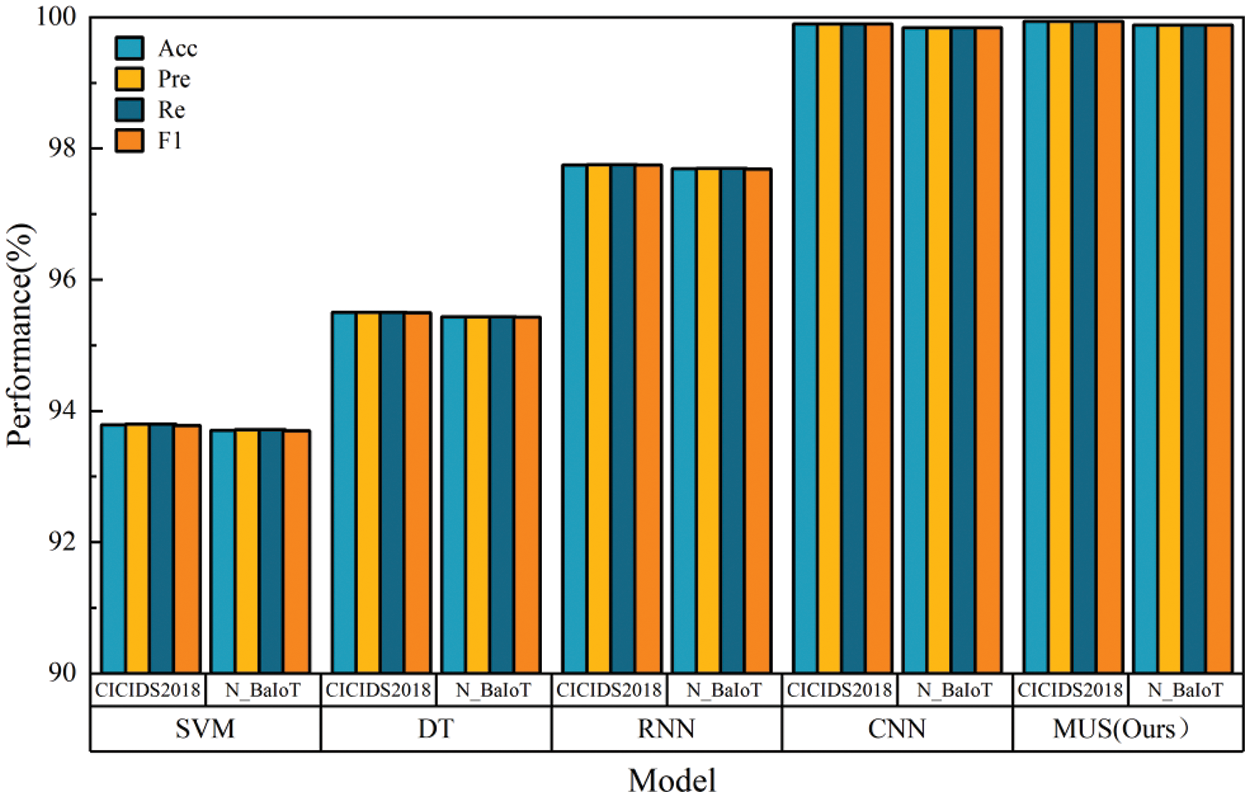
Figure 11: Experimental diagram of MUS model evaluation
4.3.4 Tests of Model Variability
The Friedman test is a non-parametric test to determine whether multiple algorithms have the same performance. The Nemenyi follow-up test, on the other hand, further determines whether the difference between the mean ordinal values of two algorithms exceeds the critical value domain on the basis of the Friedman test to identify significant differences in algorithm performance. In order to compare whether there is any difference between the intrusion detection framework MUS constructed in this paper and the baseline machine learning and deep learning models, the experiments implemented in Section 4.3 are used as the research object to launch the model difference test.
The original hypothesis of the Friedman test is that the overall median is equal for all samples, and the alternative hypothesis is that the overall median is different for at least one sample. In performing the Friedman test, the data in each sample are first ranked, and then the rank order of each observation is calculated; and then the ranks in each sample are summed to obtain the rank sum of the sample. Finally, a statistical test is performed using the computed rank sum, and the distribution of the test statistic approximates a chi-square distribution with k − 1 degrees of freedom, where k is the number of samples, N is the number of datasets, and ri denotes the average ordinal value of the ith algorithm.
The F-distribution
As a result of these calculations, the Friedman test rejected the original hypothesis, indicating that at least one of the models differed significantly in performance on at least one of the metrics. Therefore, a Nemenyi follow-up test was conducted. The Nemenyi test calculates the critical value domain for the difference in mean ordinal values.
where
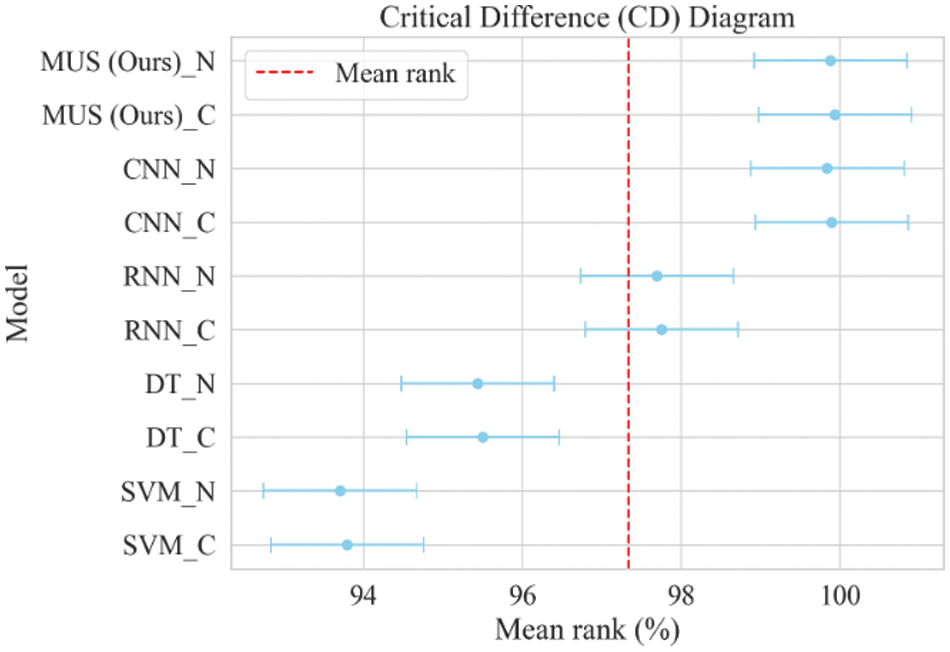
Figure 12: Critical difference (CD) diagram
This is due to the fact that the three baseline models of the soft voting integration model in MUS: VGGNet, ResNet and MobileNet all belong to the classical convolutional model and therefore do not differ much from CNN, but in terms of the four types of performance metrics, have a significant enhancement, which illustrates the validity and practicability of the constructed framework MUS.
From the four types of experimental parts mentioned above, it can be concluded that each module of the constructed part plays a corresponding role and contributes to the effectiveness of the overall framework in IoT intrusion detection. Among them, the data type conversion module consisting of the MTF method for converting 1D network traffic data into 2D images has higher evaluation indexes in all four categories than the direct processing of 1D data and the baseline image classification method, which illustrates the necessity of data type conversion and the applicability of the adopted MTF method; the detection and classification model AVR, which is obtained by integrating the three image classification baseline models of VGGNet, ResNet, and MobileNet by the soft polling The detection and classification model AVR Model obtained from the soft-vote integration of VGGNet, ResNet, and MobileNet has higher detection accuracy compared with the above three baseline models, which illustrates the effectiveness of the soft-vote integration method; finally, the IoT intrusion detection framework MUS constructed by the research institute has the best performance in the four types of evaluation indexes compared with commonly used machine learning and deep learning models, which further illustrates the excellent performance of the constructed framework AVR Model performance; the experimental performance on two types of datasets, CICIDS2018 and N_BaIoT, fully proves that MUS is not only suitable for IoT intrusion detection environments, but also for different attack types and network environments.
However, the experimental setup is limited in some aspects and needs to be further improved. First, in terms of dataset selection bias, the division of training and testing sets in CICIDS2018 and N_BaIoT is random, which cannot cover each traffic data of each attack type, and there exists one-sidedness; in addition, although the dataset used in the experiments has covered the real network environments and the specific IoT environments, it is not possible for them to cover all possible intrusion scenarios and network environments, and the model’s ability to generalise in unknown environment, the generalisation ability of the model in unknown environments needs to be further verified. Second, the four categories of indicators used in the experimental evaluation are commonly used in the field of intrusion detection, which can illustrate the high-performance performance of the constructed framework on the IoT intrusion detection task scenarios; however, it gives the same weight to the prediction performance of all categories, which does not take into account the requirements of practical applications, and needs to be explored and improved in the next step.
In order to fully improve the performance of the IoT intrusion detection model, considering the superiority of deep learning models in learning and training high-dimensional data, this paper constructs an IoT intrusion detection framework, MUS Model, based on MTF, Unsharp Masking, and soft-voting integration models, and conducts three types of experiments on two datasets to prove that each module of the constructed framework MUS is necessary and all contribute to the final performance improvement, and that the overall framework is applicable not only to IoT intrusion detection environments, but also to different attack types and network environments. This fully demonstrates the following conclusions: (1) after converting 1D network traffic data into 2D images, it is effective to detect and classify them using advanced computer vision techniques, which shows that the data type conversion can fully leverage the visual feature extraction techniques to improve the detection performance to a certain extent; (2) processing the converted data images is necessary to facilitate learning to extract the deeper features and optimise the detection performance; (3) the soft-voting integration method can combine the advantages of different baseline models and reduce the risk of overfitting, which provides a reference for the subsequent improvement of intrusion detection performance under different task scenarios.
However, this paper only focuses on the enhancement of intrusion detection performance in the IoT domain without considering the resource constraints. In the future, IoT security domain, with the explosive growth of the number of devices and the increasing complexity of the network environment, the intrusion detection system not only needs to have high-precision detection capability to accurately identify and defend against a variety of threats, but also must have fast inference speed and lightweight model design to adapt to resource-constrained IoT devices and to ensure real-time security requirements. To achieve this goal, the following methods are proposed for refinement: model compression and pruning, knowledge refinement, quantification, hardware-specific optimisation, joint-learning distributed training, etc.; through the combined use of the above methods, both the performance and efficiency of the IoT intrusion detection model can be improved, and its feasibility and practicability can be ensured in resource-constrained environments, so that the growing IoT ecosystem can be better protected from security threats.
Acknowledgement: The authors would like to thank the support and help from the People’s Armed Police Force of China Engineering University, College of Information Engineering Subject Group, which funded this work under the All-Army Military Theory Research Project, Armed Police Force Military Theory Research Project.
Funding Statement: The authors would like to thank the support and help from the People’s Armed Police Force of China Engineering University, College of Information Engineering Subject Group, which funded this work under the All-Army Military Theory Research Project, Armed Police Force Military Theory Research Project (WJJY22JL0498).
Author Contributions: The authors confirm contribution to the paper as follows: conceptualization, methodology, Yu Yan; formal analysis, investigation, Yu Yan, Shen Fang; writing—original draft preparation, Yu Yan, Minna Gao; writing—review and editing, Yu Yan, Yu Yang; supervision, resources, funding acquisition, Yu Yang, Yiding Chen. All authors reviewed the results and approved the final version of the manuscript.
Availability of Data and Materials: Data available on request from the authors. The data that support the findings of this study are available from the corresponding author, Yu Yang, upon reasonable request.
Conflicts of Interest: The authors declare that they have no conflicts of interest to report regarding the present study.
References
1. M. Leo, G. Medioni, M. Trivedi, T. Kanade, and G. Farinella, “Computer vision for assistive technologies,” Comput. Vis. Image Underst., vol. 154, no. 1, pp. 1–15, Jan. 2017. doi: 10.1016/j.cviu.2016.09.001. [Google Scholar] [CrossRef]
2. S. Madakam, R. Ramaswamy, and S. Tripathi, “Internet of things (IoTA literature review,” J. Comput. Commun., vol. 3, no. 5, pp. 164–173, 2015. doi: 10.4236/jcc.2015.35021. [Google Scholar] [CrossRef]
3. E. Eliando and Y. Purnomo, “LockBit 2.0 ransomware: Analysis of infection, persistence, prevention mechanism,” CogITo Smart J., vol. 8, no. 1, pp. 232–243, 2022. doi: 10.31154/cogito.v8i1.356.232-243. [Google Scholar] [CrossRef]
4. H. Zahan, M. W. Al Azad, I. Ali, and S. Mastorakis, “IoT-AD: A framework to detect anomalies among interconnected IoT devices,” IEEE Internet Things J., vol. 11, no. 1, pp. 478–489, Jun. 2023. doi: 10.1109/JIOT.2023.3285714. [Google Scholar] [CrossRef]
5. Y. Khan, M. B. Su’ud, M. M. Alam, S. F. Ahmad, N. A. Salim and N. Khan, “Architectural threats to security and privacy: A challenge for internet of things (IoT) applications,” Electronics, vol. 12, no. 1, pp. 88, Dec. 2022. doi: 10.3390/electronics12010088. [Google Scholar] [CrossRef]
6. J. Li, X. Qi, Y. He, and L. Liu, “SDN candidate and protection path selection for link failure protection in hybrid SDNs,” Reliab. Eng. Syst. Saf., vol. 244, no. 109893, Apr. 2024. doi: 10.1016/j.ress.2023.109893. [Google Scholar] [CrossRef]
7. M. J. Huang, Y. T. Liu, B. Yang, Y. Q. Zhao, and M. R. Zhang, “Efficient revocable attribute-based encryption with data integrity and key escrow-free,” Information, vol. 15, no. 1, pp. 32, Jan. 2024. doi: 10.3390/info15010032. [Google Scholar] [CrossRef]
8. S. Ioannidis, A. Keromytis, S. Bellovin, and J. Smith, “Implementing a distributed firewall,” in Proc. 7th ACM Conf. Comput. Commun. Secur., Athens, Greece, 2000, pp. 190–199. [Google Scholar]
9. P. Samarati and S. C. de Vimercati, “Access control: Policies, models, and mechanisms,” in Int. Sch. Found. Secur. Anal. Des., Berlin, Heidelberg, Springer Berlin Heidelberg, 2000, pp. 137–196. doi: 10.1007/3-540-45608-2_3. [Google Scholar] [CrossRef]
10. M. Polenov, V. Guzik, and V. Lukyanov, “Using virtualization technology for the user authorization system,” in Software Engineering Trends and Techniques in Intelligent Systems, Apr. 2017, vol. 575, pp. 192–200. doi: 10.1007/978-3-319-57141-6_20. [Google Scholar] [CrossRef]
11. Y. Yan, Y. Yang, F. Shen, M. N. Gao, and Y. H. Gu, “GDE model: A variable intrusion detection model for few-shot attack,” J. King Saud Univ.—Comput. Inf. Sci., vol. 35, no. 10, pp. 101796, Dec. 2023. doi: 10.1016/j.jksuci.2023.101796. [Google Scholar] [CrossRef]
12. J. P. Anderson, “Computer security threat monitoring and surveillance,“ in Technical Report. Fort Washington, Pennsylvania: James P Anderson Co., vol. 215, pp. 646–4706, 1980. [Google Scholar]
13. G. E. Hinton and R. R. Salakhutdinov, “Reducing the dimensionality of data with neural networks,” Science, vol. 313, no. 5786, pp. 504–507, Jul. 2006. doi: 10.1126/science.112764. [Google Scholar] [CrossRef]
14. M. S. Farooq, S. Abbas, K. Sultan, MA. Atta-ur-Rahman, MA. Khan and A. Mosavi, “A fused machine learning approach for intrusion detection system,” Comput. Mater. Contin., vol. 74, no. 2, pp. 2607–2623, Apr. 2023. doi: 10.32604/cmc.2023.032617. [Google Scholar] [CrossRef]
15. E. U. H. Qazi, M. H. Faheem, T. Zia, “HDLNIDS: Hybrid deep-learning-based network intrusion detection system,” Appl. Sci., vol. 13, no. 8, pp. 4921, Apr. 2023. doi: 10.3390/app13084921. [Google Scholar] [CrossRef]
16. H. Xie, C. Hao, J. Li, M. Li, P. Luo and J. Zhu, “Anomaly detection for time series data based on multi-granularity neighbor residual network,” Int. J. Cogn. Comput. Eng., vol. 3, no. 3, pp. 180–187, Jun. 2022. doi: 10.1016/j.ijcce.2022.10.001. [Google Scholar] [CrossRef]
17. J. Yin et al., “Internet of things intrusion detection system based on convolutional neural network,” Comput. Mater. Contin., vol. 75, no. 1, pp. 2119–2135, Mar. 2023. doi: 10.32604/cmc.2023.035077. [Google Scholar] [CrossRef]
18. D. S. Terzi, “Gramian angular field transformation-based intrusion detection,” Comput. Sci., vol. 23, no. 4, pp. 571–585, Dec. 2022. doi: 10.7494/csci.2022.23.4.4406. [Google Scholar] [CrossRef]
19. G. Baldini, J. L. Hernandez Ramos, and I. Amerini, “Intrusion detection based on gray-level co-occurrence matrix and 2D dispersion entropy,” Appl. Sci., vol. 11, no. 2, pp. 5567, Jun. 2021. doi: 10.3390/app11125567. [Google Scholar] [CrossRef]
20. M. A. Siddiqi and W. Pak, “Tier-based optimization for synthesized network intrusion detection system,” IEEE Access, vol. 10, no. 13, pp. 108530–108544, Oct. 2022. doi: 10.1109/ACCESS.2022.3213937. [Google Scholar] [CrossRef]
21. G. I. Webb and Z. Zheng, “Multistrategy ensemble learning: Reducing error by combining ensemble learning techniques,” IEEE Trans. Knowl. Data Eng., vol. 16, no. 8, pp. 980–991, Aug. 2004. doi: 10.1109/TKDE.2004.29. [Google Scholar] [CrossRef]
22. Y. Shen, K. Zheng, Y. Yang, S. Liu, and M. Huang, “CBA-CLSVE: A class-level soft-voting ensemble based on the chaos bat algorithm for intrusion detection,” Appl. Sci., vol. 12, pp. 21, Nov. 2022. doi: 10.3390/app122111298. [Google Scholar] [CrossRef]
23. H. Alshede, L. Nassef, N. Alowidi, and E. Fadel, “Ensemble voting-based anomaly detection for a smart grid communication infrastructure,” Intell. Auto. Soft Comput., vol. 36, no. 3, pp. 3257–3278, Jun. 2023. doi: 10.32604/iasc.2023.035874. [Google Scholar] [CrossRef]
24. D. Albashish and A. Aburomman, “Weighted heterogeneous ensemble for the classification of intrusion detection using ant colony optimization for continuous search spaces,” Soft Comput., vol. 27, no. 8, pp. 4779–4793, Nov. 2022. doi: 10.1007/s00500-022-07612-9. [Google Scholar] [CrossRef]
25. L. Liu and Z. Wang, “Encoding temporal markov dynamics in graph for time series visualization,” arXiv preprint arXiv:1610.07273. [Google Scholar]
26. Z. Gui and Y. Liu, “An image sharpening algorithm based on fuzzy logic,” Optik, vol. 122, no. 8, pp. 697–702, Jan. 2011. doi: 10.1016/j.ijleo.2010.05.010. [Google Scholar] [CrossRef]
27. K. Simonyan and A. Zisserman, “Very deep convolutional networks for large-scale image recognition,” arXiv preprint arXiv:1409.1556. [Google Scholar]
28. M. Shafiq and Z. Q. Gu, “Deep residual learning for image recognition: A survey,” Appl. Sci., vol. 12, no. 18, pp. 8972, Sep. 2022. doi: 10.3390/app12188972. [Google Scholar] [CrossRef]
29. A. G. Howard et al., “MobileNets: Efficient convolutional neural networks for mobile vision applications,” arXiv preprint arXiv:1704.04861. [Google Scholar]
Cite This Article
 Copyright © 2024 The Author(s). Published by Tech Science Press.
This work is licensed under a Creative Commons Attribution 4.0 International License , which permits unrestricted use, distribution, and reproduction in any medium, provided the original work is properly cited.
 Downloads
 Citation Tools