
 Submit a Paper
 Propose a Special lssue
 Open Access
ARTICLE

Personalized Lower Limb Gait Reconstruction Modeling Based on RFA-ProMP
College of Electrical Engineering, Guizhou University, Guiyang, 550025, China
* Corresponding Author: Zhiqin He. Email:
(This article belongs to the Special Issue: Intelligent Manufacturing, Robotics and Control Engineering)
Computers, Materials & Continua 2024, 80(1), 1441-1456. https://doi.org/10.32604/cmc.2024.051551
Received 08 March 2024; Accepted 07 June 2024; Issue published 18 July 2024
 View Full Text
 Download PDF
Abstract
Personalized gait curves are generated to enhance patient adaptability to gait trajectories used for passive training in the early stage of rehabilitation for hemiplegic patients. The article utilizes the random forest algorithm to construct a gait parameter model, which maps the relationship between parameters such as height, weight, age, gender, and gait speed, achieving prediction of key points on the gait curve. To enhance prediction accuracy, an attention mechanism is introduced into the algorithm to focus more on the main features. Meanwhile, to ensure high similarity between the reconstructed gait curve and the normal one, probabilistic motion primitives (ProMP) are used to learn the probability distribution of normal gait data and construct a gait trajectory model. Finally, using the specified step speed as input, select a reference gait trajectory from the learned trajectory, and reconstruct the curve of the reference trajectory using the gait key points predicted by the parameter model to obtain the final curve. Simulation results demonstrate that the method proposed in this paper achieves 98% and 96% curve correlations when generating personalized lower limb gait curves for different patients, respectively, indicating its suitability for such tasks.Keywords
According to statistics, the number of hemiplegic patients resulting from stroke and other diseases is increasing annually. Without timely treatment, patients may permanently lose leg motor function and experience issues such as muscle atrophy, joint stiffness, and cardiopulmonary problems. Simultaneously, patients may experience significant psychological trauma, pessimism, depression, and other emotions, severely impacting their overall well-being. Clinical studies demonstrate that precise and timely rehabilitation training can enhance coordinated movement in joints and muscle groups, restoring muscle strength and walking function in patients. Researches [1–3] have demonstrated that employing lower limb rehabilitation equipment in training aids in the restoration of the patient’s motor abilities. Research [4] notes that during the initial phase of rehabilitation training, patients are passively guided by the rehabilitation robot, impacting the rehabilitation outcome as the robot’s passive training reference trajectory plays a crucial role. In research [5], the development of a personalized training reference trajectory is divided into two components: the gait parameter model (GPM) and the gait trajectory model (GTM).
Researches [6,7] indicated a strong correlation between human gait trajectory and speed. Additionally, parameters like height, weight, age, gender, and BMI have a significant impact on gait. In GPM, it is essential to establish the relationship between body parameters and gait, predicting key gait characteristics. In prior studies [8], gait reference trajectories at various speeds were successfully predicted using Long Short-Term Memory Neural Networks (LSTM) and Convolutional Neural Networks (CNN). In the study by [9], an SAE-LSTM network was employed to predict gait based on nine information variables, including acceleration, angular velocity, thigh, calf, and foot motion angles, as well as three plantar pressure variables. The model achieved an average accuracy of 93%. In their work [10], CNN-LSTM was utilized to predict the gait of patients for assessing the severity of Parkinson’s disease, achieving favorable classification and identification accuracies. In the research [11], gait prediction was performed using plantar pressure data with a transformer neural network. The prediction error was smaller compared to other methods, but the transformer network showed a tendency to overfit small datasets. Research employed a random forest regression model (RF) to generate personalized gait trajectories based on anthropometric features. However, the dataset lacked the crucial parameter of gait speed, limiting the applicability of the generated gait profiles in rehabilitation training. In their research [12], a method for personalized gait pattern generation based on recurrent neural networks (RNNs) was introduced. RNNs were employed to establish a mapping from body parameters and gait parameters to gait patterns, yielding improved prediction results. However, the “black-bo” nature of RNNs hindered the understanding of the potential relationship between body parameters and gait patterns.
GPM constructs a model that correlates human body parameters with gait, enabling the prediction of key gait points based on input parameters. In GTM, the output of GPM serves as input, enabling personalized reconstruction of gait curves to enhance patient adaptability. In research [13], the internal dynamics of gait were modeled as a second-order Markov process evolving in a low-dimensional potential space using Gaussian regression. Motion was generated by directly mapping the potential space dynamics to joint trajectories through predicted features, reducing the mean-square error of the generated gait pattern. However, this method still introduces a large reconstruction error in gait curves and does not support step length adjustment. In [14], a polynomial fitting approach is utilized to generate joint angles, but it necessitates specifying optimal values for angular acceleration and angular velocity of the joint angles. In the study by [15], the Gaussian regression algorithm is employed for joint angle generation, also learning the probability distribution of the joint angle trajectory. In [16], dynamic motion primitives are used to adjust trajectories based on walking profiles from a normal gait database through a set of Gaussian kernels, displaying statistical learning. However, the method does not consider the impact of body characteristics on gait. Based on the aforementioned research on personalized gait trajectory generation, it is evident that many gait parameter modeling methods neglect the consideration of body parameters, particularly the crucial feature of gait speed. This results in the prediction of gait characteristics that fail to meet personalization needs. Additionally, in gait trajectory modeling methods, many approaches do not account for the learning and generalization of normal gait curves. The prehabilitation period of passive training tasks tends to be homogeneous, emphasizing the importance of ensuring the generated similarity between gait and normal gait.
This study focuses on rehabilitation training for hemiplegic patients, introducing RF with attention mechanism (RF-Attention, RFA) and combining it with probabilistic motion primitives to propose the RFA-ProMP algorithm for personalized gait trajectory generation. To ensure the learning and generalization performance of the algorithm on normal gait trajectories, the study employed ProMP to construct probabilistic trajectory models based on different gait speeds in the human gait database. Since many existing methods have not considered the impact of gait speed on gait, this paper characterizes the characteristics of hip and knee joint trajectories using gait key points. RF is employed to map the nonlinear relationship between human parameters, gait speed, and gait trajectory, enabling the prediction of gait key points based on input parameters. The predicted gait key points will serve as inputs to the trajectory model for reconstructing the gait reference trajectory.
The main contributions of this article are as follows:
1) A gait parameter model was constructed, using gender, age, height, weight, BMI, and gait speed as input parameters to predict the key point angles of the gait trajectory. This model can reflect individual differences and achieve personalized prediction of gait key points.
2) A gait trajectory model was constructed. By learning normal gait data, a reference gait trajectory library based on gait speed was obtained. A reference trajectory was selected based on the specified gait speed. The predicted gait key points were used to effectively reconstruct the trajectory while maintaining similarity with the reference trajectory.
Research [17] demonstrated that the Random Forest algorithm excels in processing numerous features and can rank them based on importance. Given the necessity to extract as many features as possible in constructing gait parameter models, the random forest algorithm is well-suited for establishing the mapping relationship between human parameters and gait trajectory key points. In studying the internal relationship between human parameters and gait, emphasis is placed on highly important features. The attention mechanism focuses on relevant areas of input data and assigns different attention weights based on the importance of input features. Therefore, the attention mechanism is integrated into random forests to enhance the accuracy of mapping relationship construction.
Personalizing the passive training trajectory according to the specific patient's situation is crucial, aiming for a reconstructed trajectory highly similar to the patient's trajectory during normal movement. Researches [18–21] have demonstrated that probabilistic motion primitives can learn probability distributions of trajectories from normal gait databases and reconstruct them using learned reference trajectories. The obtained trajectories exhibit high similarity to the original ones and possess flexibility and adjustability, making them adaptable to personalized requirements.
2.1 Modeling of Gait Parameters
The random forest algorithm utilizes a multitude of decision trees as its base learners. During the training phase, bootstrap sampling is employed on the gait dataset with dropout, enabling the training of multiple individual decision trees. During the prediction phase, the random forest calculates the arithmetic mean of the output results from each decision tree to derive the final prediction result. In this study, model inputs included age, gender, height, weight, BMI, and walking speed. During the prediction process of each gait feature, each decision tree established using bootstrap contains a subset of data not used in its construction, referred to as Out of Bag (OOB) data. In predicting each gait feature, for each decision tree, the OOB data was used for prediction to obtain the error
The mathematical modeling equations for the RFA model are as follows:
The formula for MDA is as follows:
The feature attention weights are calculated as follows:
Update Eq. (1) to obtain the RFA model:
During the prediction process, RFA assigns different attention weights to different features based on the importance of the input data, and predicts the final gait key point angle through the model.
2.2 Modeling of Gait Trajectory
To understand the normal gait pattern, considering a series of normal gait sample trajectories
The computed weight vector is assumed to be normally distributed, i.e.,
Thus, the gait trajectory distribution can be obtained from
For the established probabilistic trajectory model, we update the trajectory by adding the expected points of gait characteristics
The new mean and variance are calculated as follows:
During gait trajectory reconstruction, a fundamental trajectory is chosen from the normal gait probability trajectory model according to gait speed. The predicted expected gait point is then inputted, and the probability trajectory model is iteratively updated using formulas (12)–(14).
2.3 Algorithmic Implementation
The study aimed to predict individualized lower extremity gait patterns for passive rehabilitation training. It utilized the patient's physical attributes and specified gait speed. The prediction focused on a single cycle of lower limb gait, as prehabilitation training involves repetitive cycles. The gait parameter model in this study incorporated six parameters: height (H), weight (W), sex (S), age (A), BMI, and gait speed (V). The algorithm implementation involved five steps.
1) Construct a gait parameter model by RFA, and predict to get the angle of m gait key points
2) A set of joint demonstration trajectories
3) Calculate
4) Updating the probabilistic trajectory model.
5) Repeat 3) and 4) to obtain the final trajectory model and the passive training trajectory with fixed sequence length:
The steps of the algorithm implementation can be demonstrated by Fig. 1.
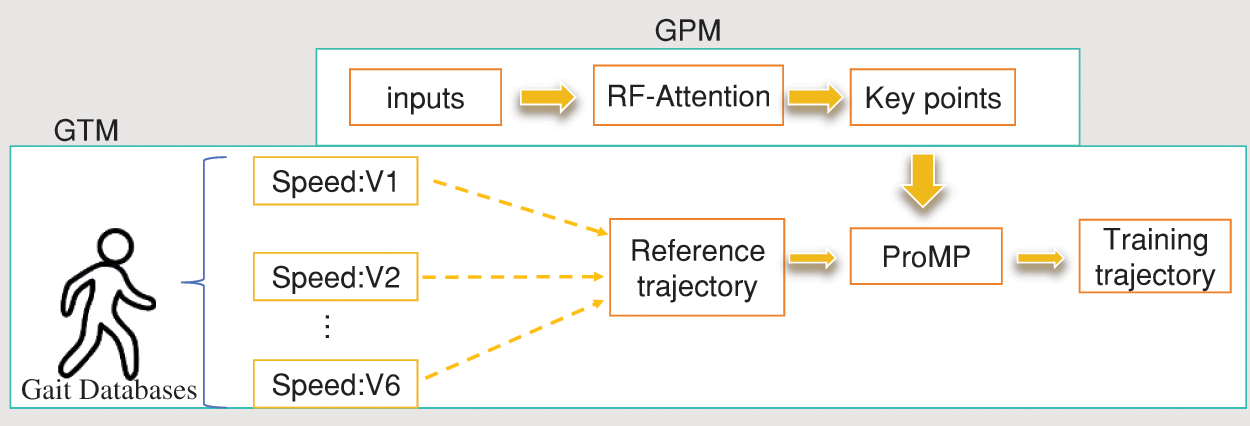
Figure 1: Algorithmic implementation process
This study was conducted under Windows 10 with the device configuration of CPU: Intel(R) Core(TM) i7-8750H CPU @ 2.20 GHz; RAM: 8 GB; GPU: NVIDIA GeForce GTX 1050 Ti; Experimental environment: python 3.6, tensorflow 1.9, keras 2.0.
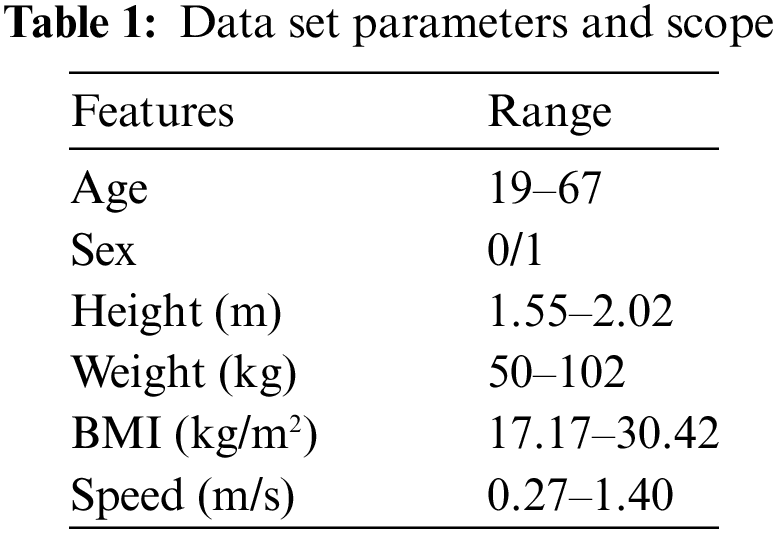
Since this study aimed to establish the relationship between body characteristic parameters and gait, the dataset must include body parameters, pace, and gait information. The experimental data used in this study included physical parameters such as height, weight, gender and age of 52 volunteers. The data set contains the hip and knee joint data of volunteers walking at different gait speeds, which meets the data requirements of this experiment. The acquired gait curve was filtered and smoothed using a Butterworth low-pass filter with a cutoff frequency of 6 Hz. Each gait curve is then resampled as a discrete point. Table 1 displays the physical parameters and gait speed ranges. Following the requirements for low speed and stability in passive rehabilitation training, gait data with speeds ranging from 0.27 to 1.39 m/s (1 to 5 km/h) in the dataset were selected, resulting in a total of 940 sample sets. All data underwent normalization, and the algorithms were evaluated using a leave-one-out cross-validation method.
Formula (2) is used to obtain the importance evaluation ranking of variables for the knee and hip joints in Fig. 2a,b. The figure clearly indicates that gait speed has the most substantial impact on the gait trajectory among the collected parameters. Therefore, this study divided the training set into six gait intervals, each with a 0.2 m/s interval based on the distribution of gait speeds in the dataset. The gait data from these corresponding intervals were then chosen as the basis for demonstrating trajectories for the ProMP, considering the specified gait speeds.
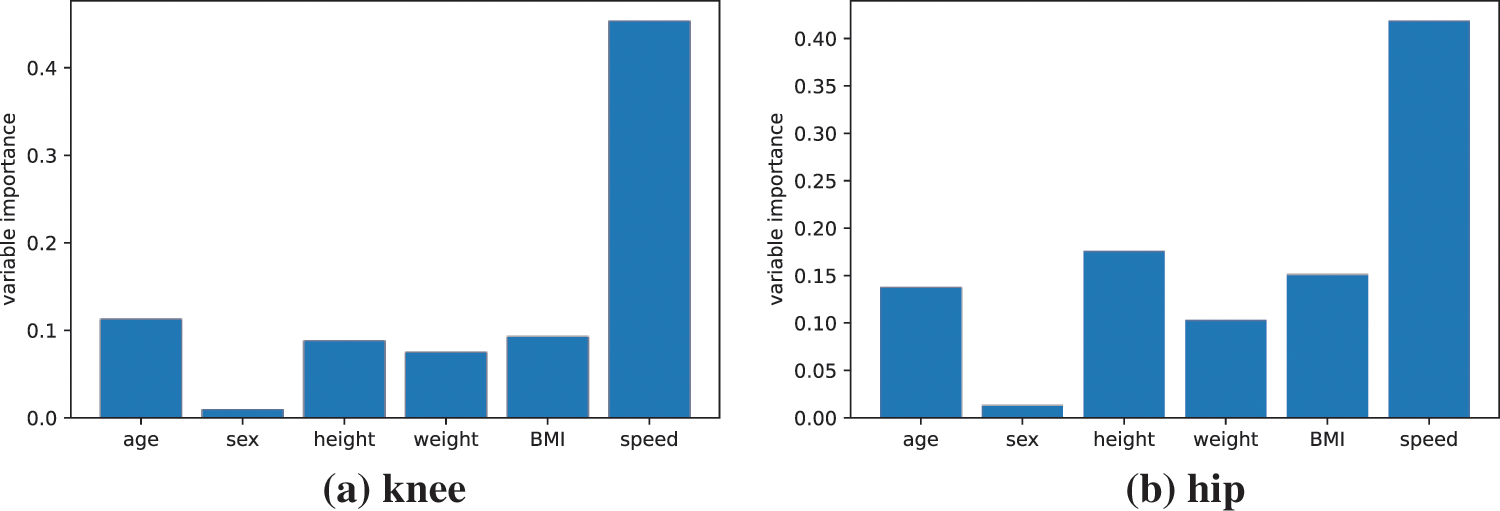
Figure 2: Assessment of the importance of variables in the hip and knee joints
The performance of the algorithm is mainly assessed by the consistency of the generated gait curve with the actual gait curve, and if the generated gait curve is closer to the actual curve, it is considered to be more feasible to be used for rehabilitation training. We introduced Mean Absolute Error (MAE) to evaluate the error between the trajectory
The study constructs gait models based on various walking speeds in the dataset. Fig. 3 illustrates the learning process of a series of hip joint trajectories and the curve update following the addition of gait prediction key points. Fig. 3a displays the trajectory sets of various patients within the same gait interval. The thick solid lines represent the learned reference trajectories in the figure, while Fig. 3b depicts the reconstructed curve by selecting a reference trajectory according to the specified gait speed and utilizing gait key points as input. The gait curves of subjects 15 and 16 were utilized in this study as examples for reconstructing the knee and hip joint curves.
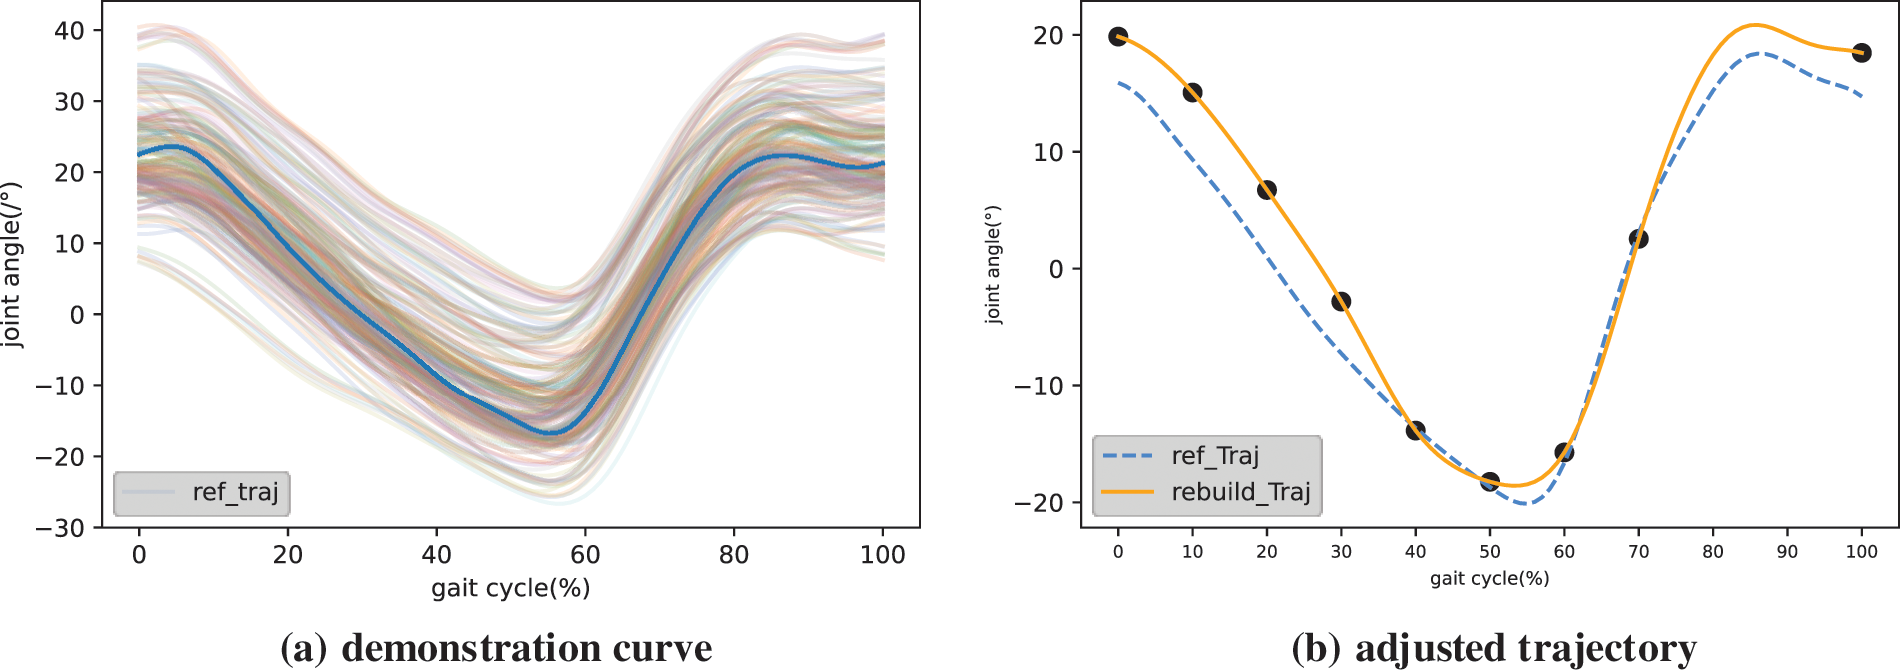
Figure 3: Illustration of trajectory and adjusted trajectory
This study chooses gait key points uniformly distributed within the range of
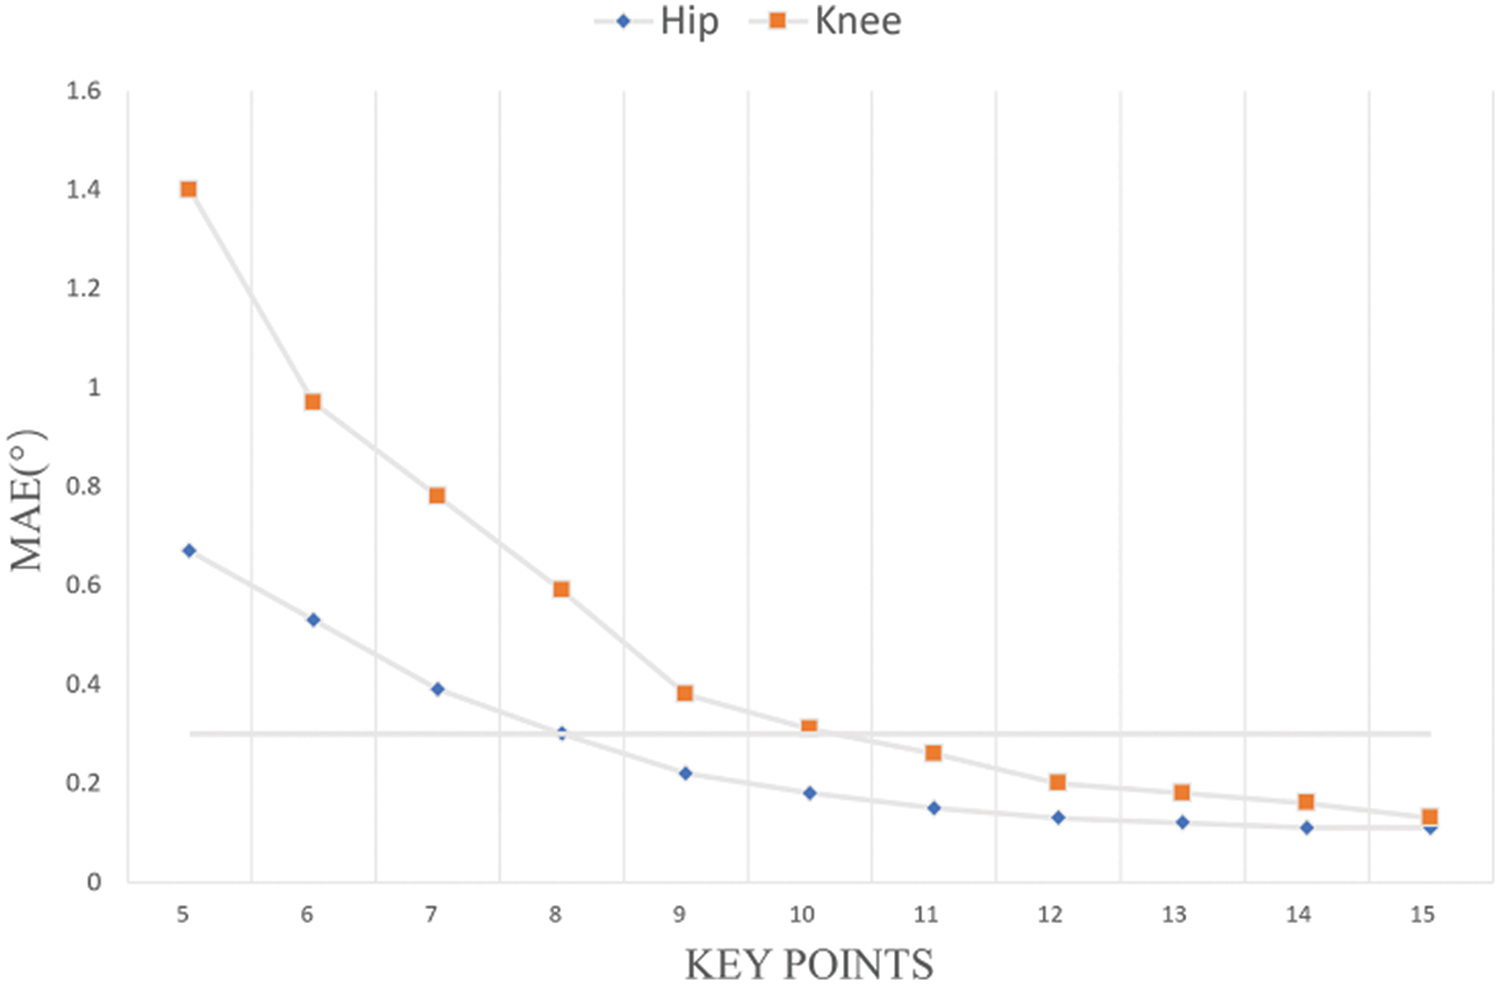
Figure 4: The impact of the number of gait key points on the curve MAE
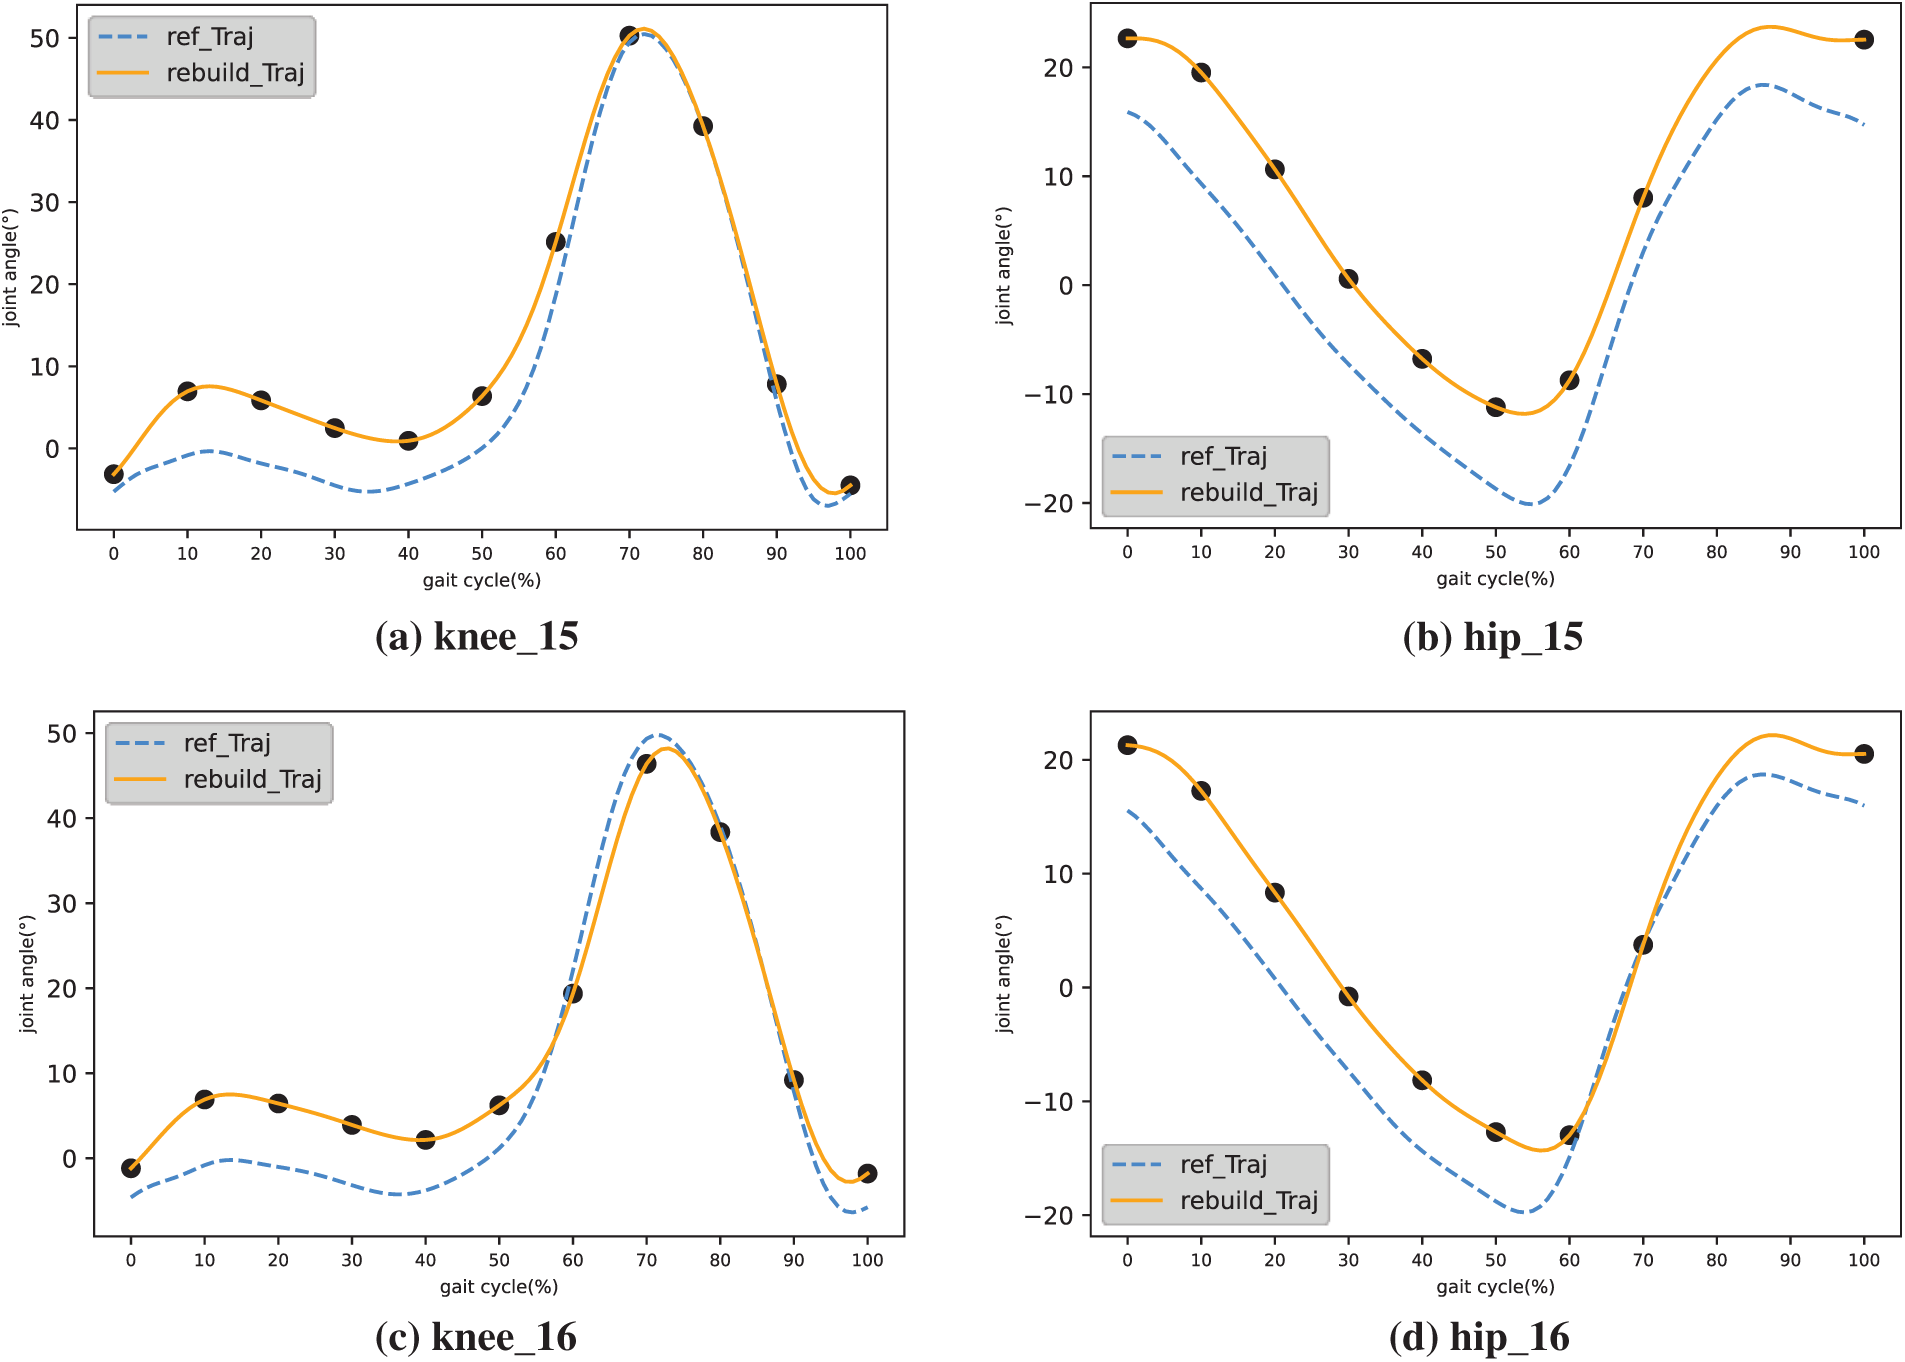
Figure 5: Hip and knee reconfiguration trajectories
Figs. 6 and 7 display the curves of the hip and knee joints of the same patient across all walking speeds. It can be observed that there is a slight difference in gait trajectory within a certain range of intervals. To reduce the learning time of ProMP, this study divides the gait curve of the training set based on gait speed into intervals of 0.2 m/s. Six intervals yield the gait curves: 0.26–0.47, 0.46–0.67, 0.66–0.87, 0.86–1.07, 1.06–1.27, and 1.26–1.39. The gait trajectory of each interval serves as the basis for the demonstration trajectory. Figs. 8 and 9 depict the demonstration trajectories of the hip and knee joints in five gait intervals, respectively.
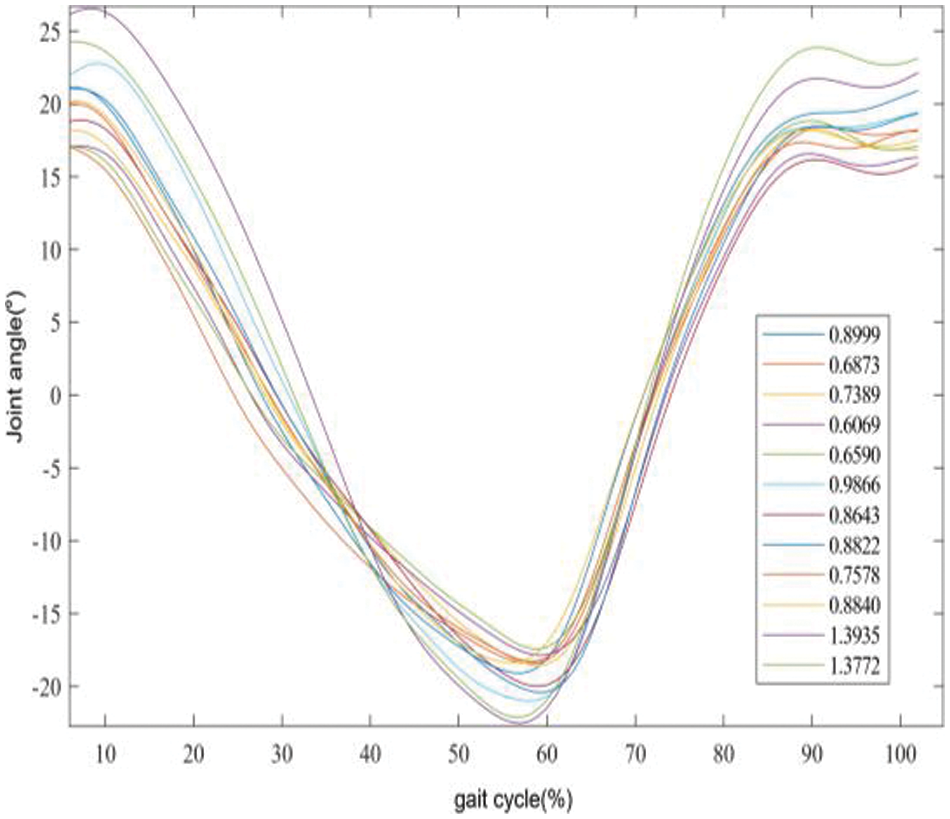
Figure 6: All hip joint walking speed curves of a single patient, with the legend indicating the walking speed in meters per second
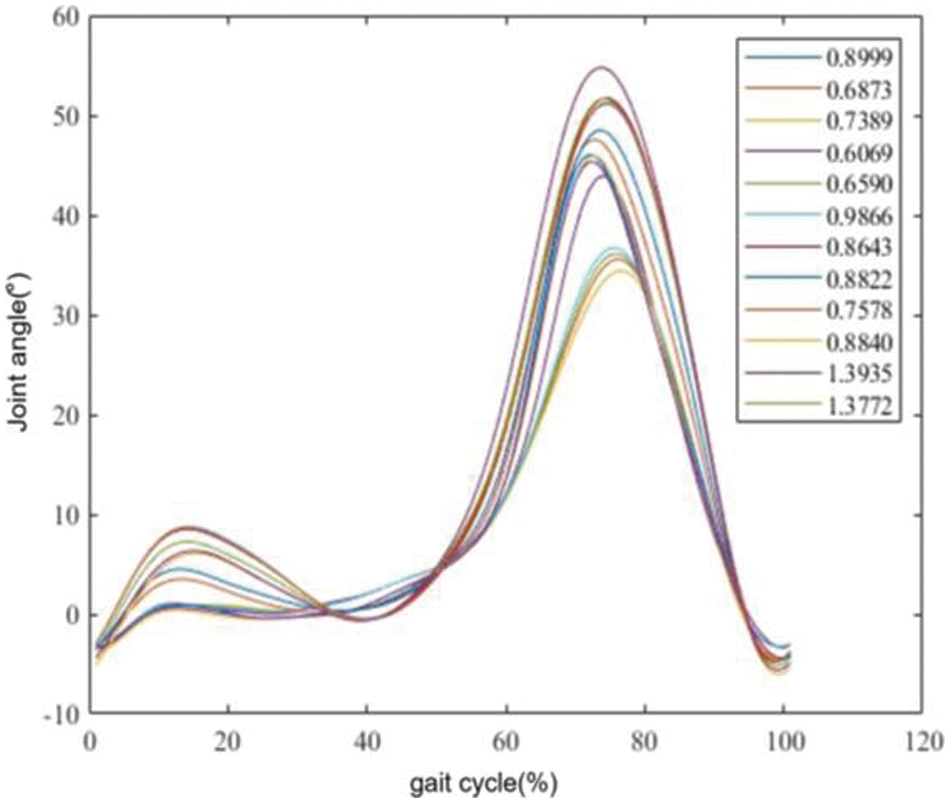
Figure 7: All knee joint walking speed curves of a single patient, with the legend indicating the walking speed in meters per second
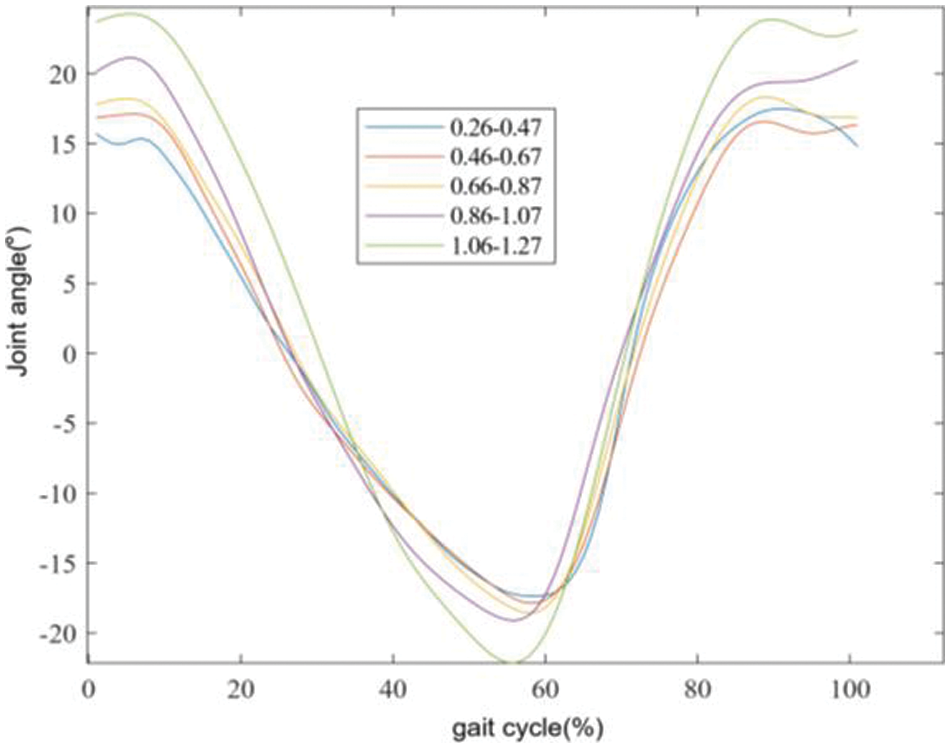
Figure 8: Hip joint reference trajectories for the same patient in five gait intervals, with legends representing different gait intervals
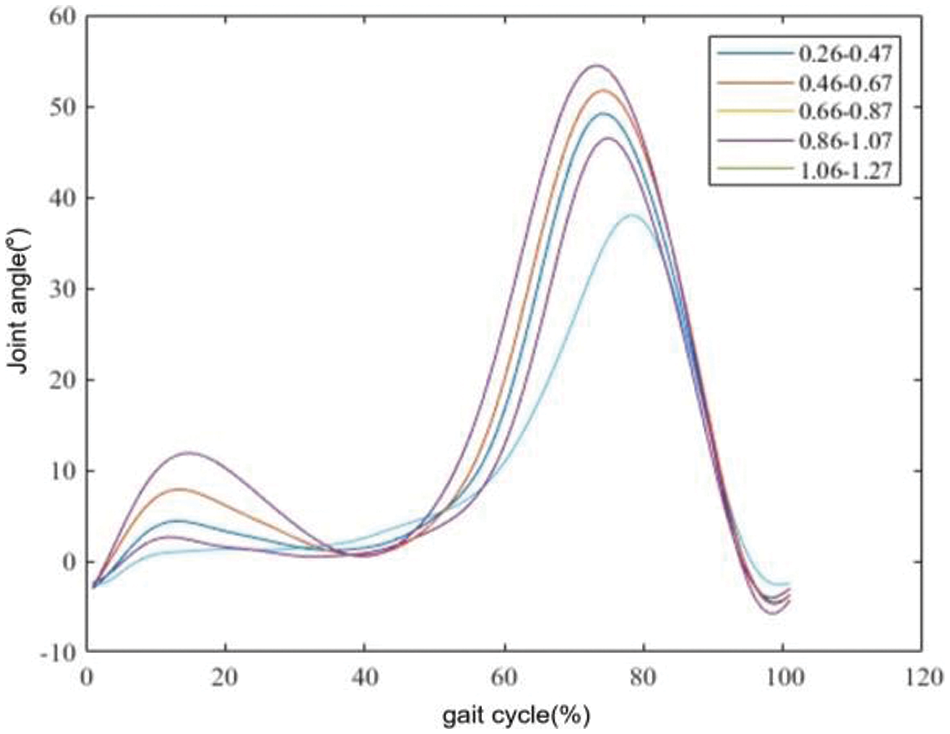
Figure 9: Knee joint reference trajectories for the same patient in five gait intervals, with legends representing different gait intervals
As hip and knee joint angle data can be treated as time series, LSTM and CNN-LSTM demonstrate strong performance in time series prediction. Thus, this article introduces LSTM and CNN-LSTM as comparative algorithms, contrasting them with the RF algorithm proposed herein. Figs. 10 and 11 show the comparison results of the reconstructed curves of the four algorithms. Fig. 10a presents the comparison result of the hip joint for subject 15, Fig. 10b shows the hip joint comparison for subject 16, Fig. 11a displays the comparison result of the knee joint for subject 15, and Fig. 11b shows the knee joint comparison for subject 16. Additionally, to demonstrate the effectiveness of our proposed algorithm, we compared it with the GPPM algorithm cited in research [22], known for its strong performance in gait pattern prediction. Figs. 12 and 13 display the comparison results. Table 2 lists the algorithmic results.
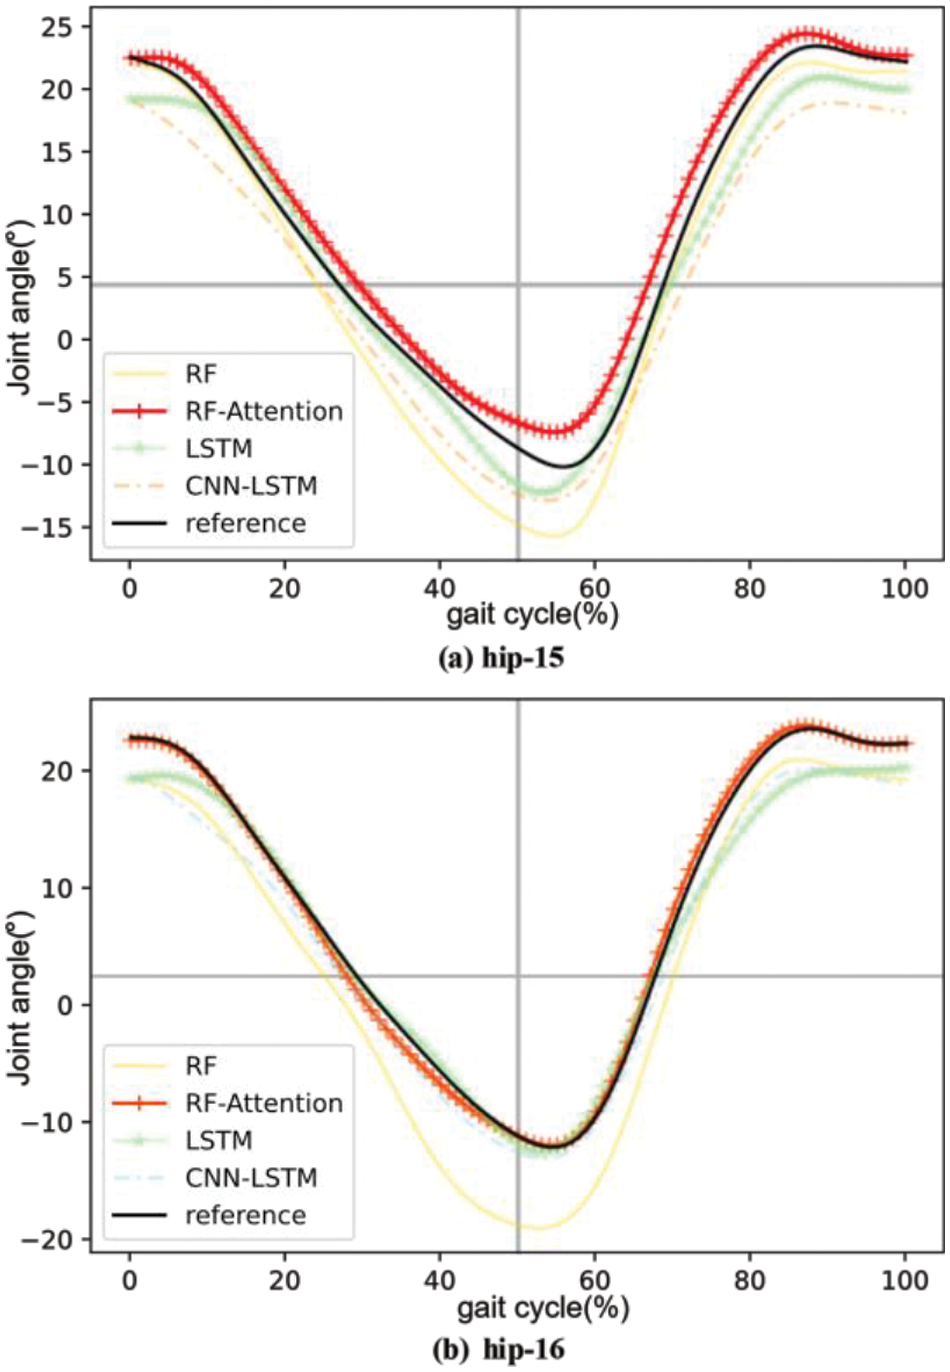
Figure 10: Comparison of hip joint reconstruction trajectories between subjects 15 and 16 under different algorithms
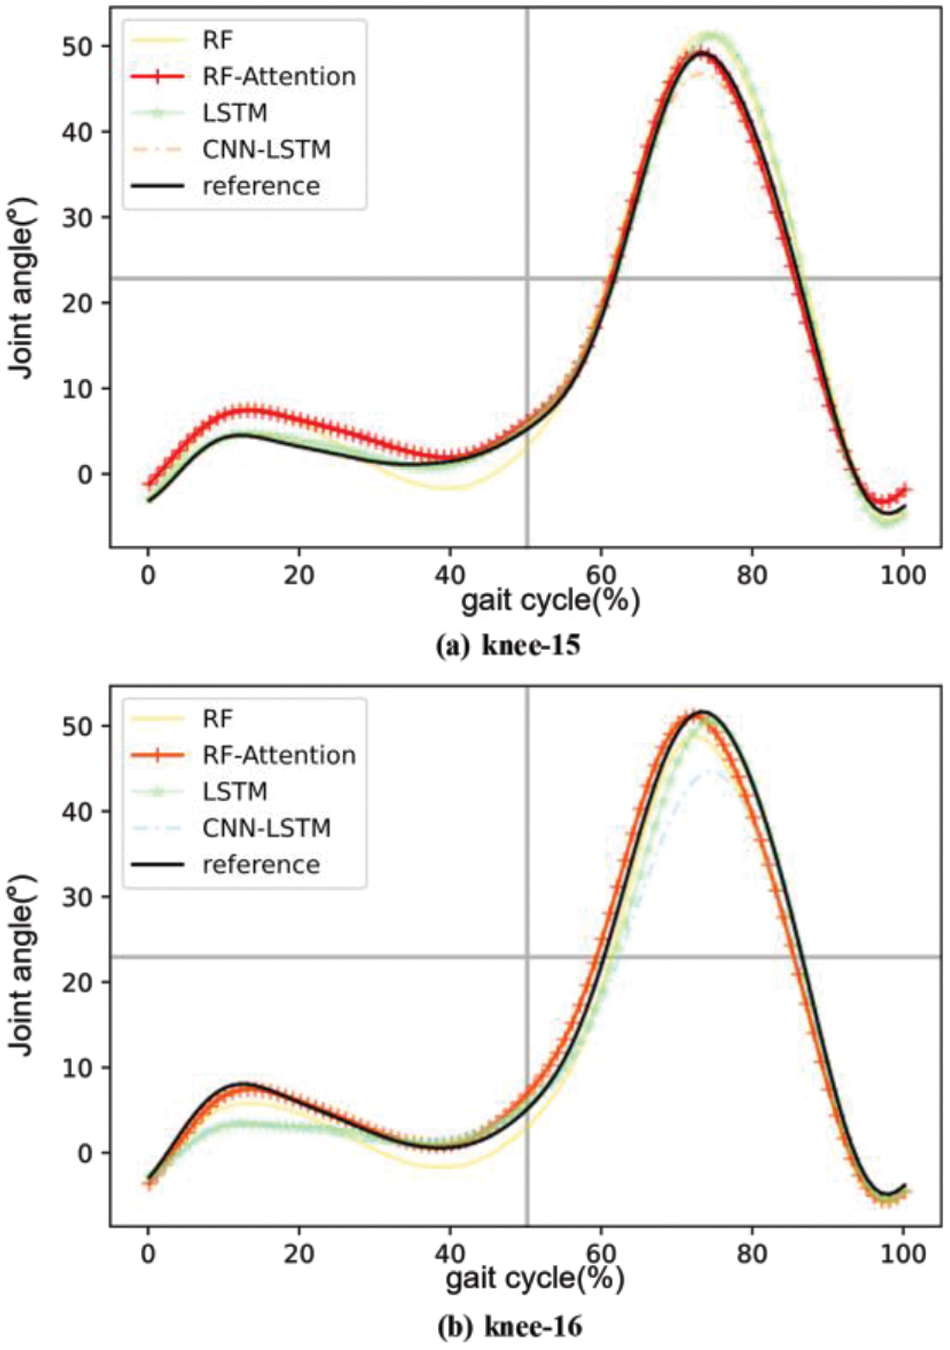
Figure 11: Comparison of knee joint reconstruction trajectories between subjects 15 and 16 under different algorithms
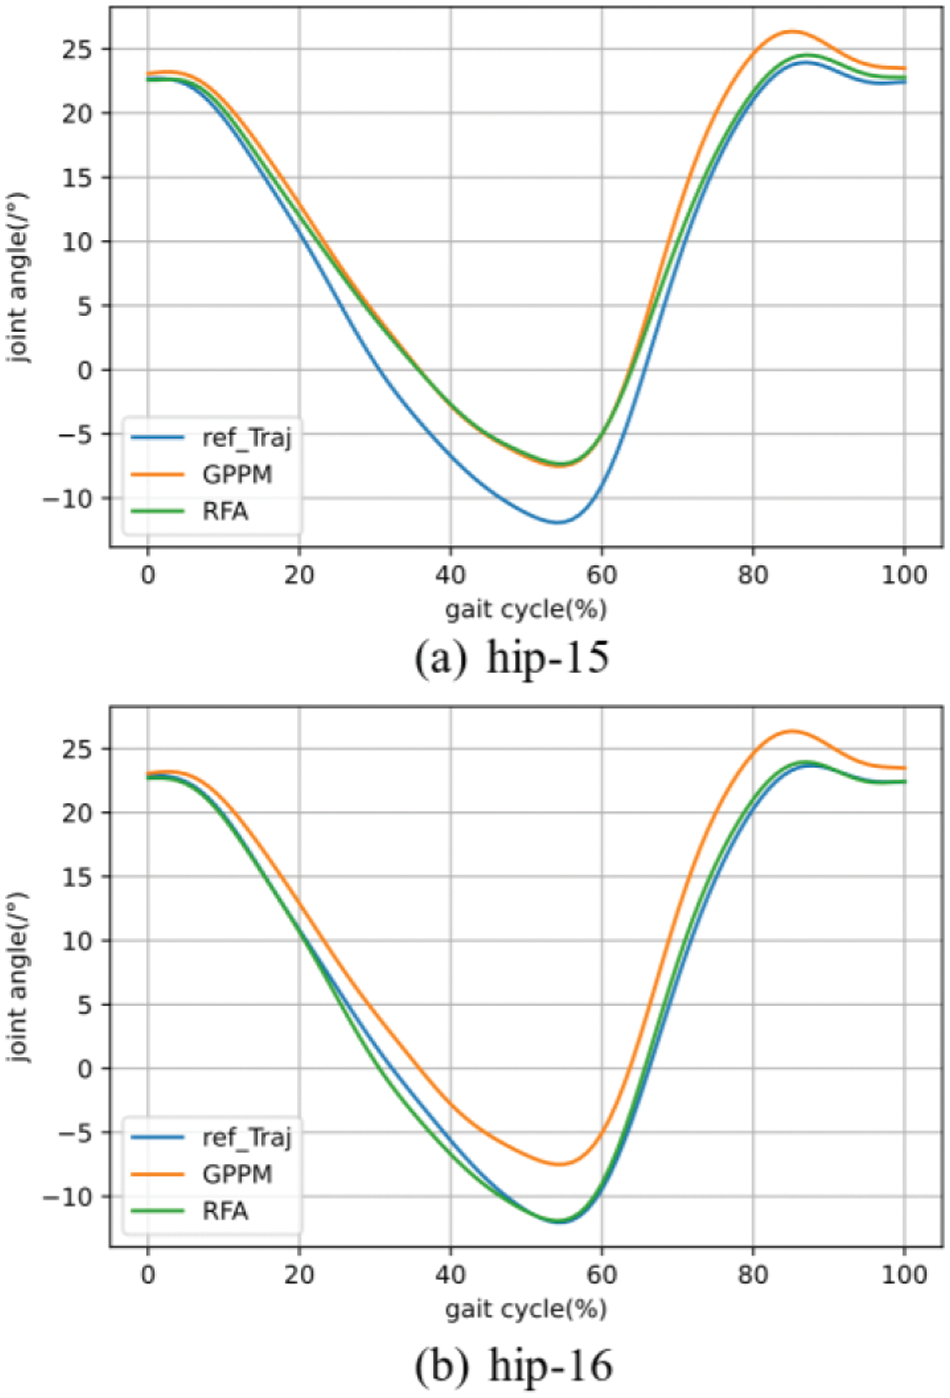
Figure 12: Comparison of hip joint reconstruction curves between the algorithm in this article and GPPM
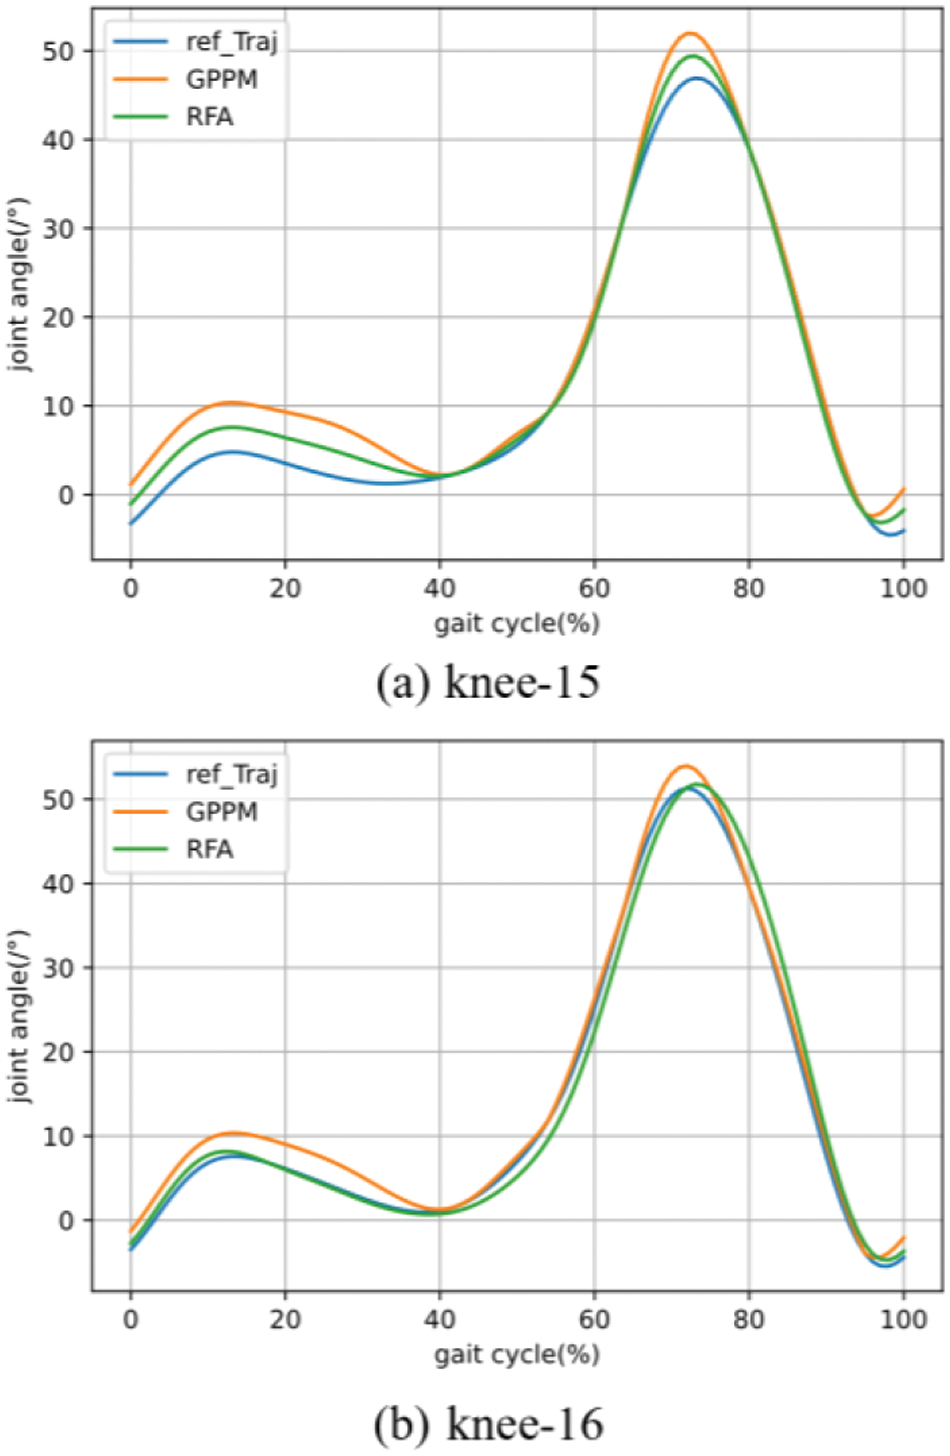
Figure 13: Comparison of knee joint reconstruction curves between the algorithm in this article and GPPM
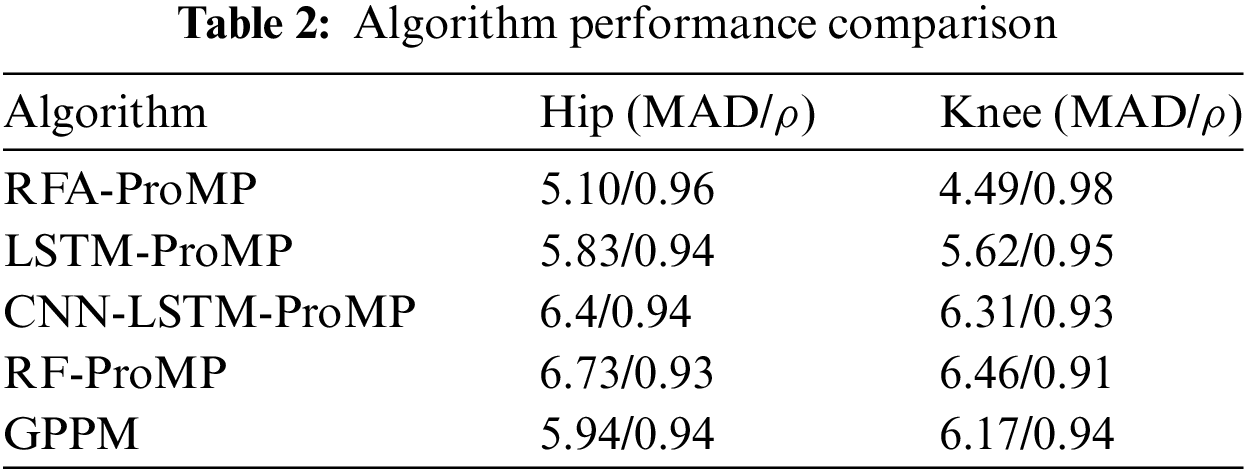
From the curves, it is evident that the reconstruction probability curve for gait prediction using RFA ProMP closely aligns with the reference curve. Calculations reveal that for the hip joint, the reconstruction curve obtained via RFA ProMP is 3.2% higher than RF ProMP, 2.1% higher than LSTM ProMP, 2.1% higher than CNN-LSTM ProMP, and 2.1% higher than GPPM. The mean absolute deviation (MAD) is 24.2% lower than RF ProMP, 12.5% lower than LSTM ProMP, 15.6% lower than CNN-LSTM ProMP, and 14.1% lower than GPPM. For the knee joint, the reconstruction curve obtained via RFA ProMP is 7.7% higher than RF ProMP, 3.2% higher than LSTM ProMP, 5.4% higher than CNN-LSTM ProMP, and 4.3% higher than GPPM. The average MAD is 30.5% lower than RF ProMP, 20.1% lower than LSTM ProMP, 28.8% lower than CNN-LSTM ProMP, and 27.2% lower than GPPM.
From the data results, it can be seen that the curve reconstruction of the hip joint is better than that of the knee joint. This is because the hip joint has a more stable motion mode compared to the knee joint during motion, allowing the algorithm to extract features of the hip joint more accurately.
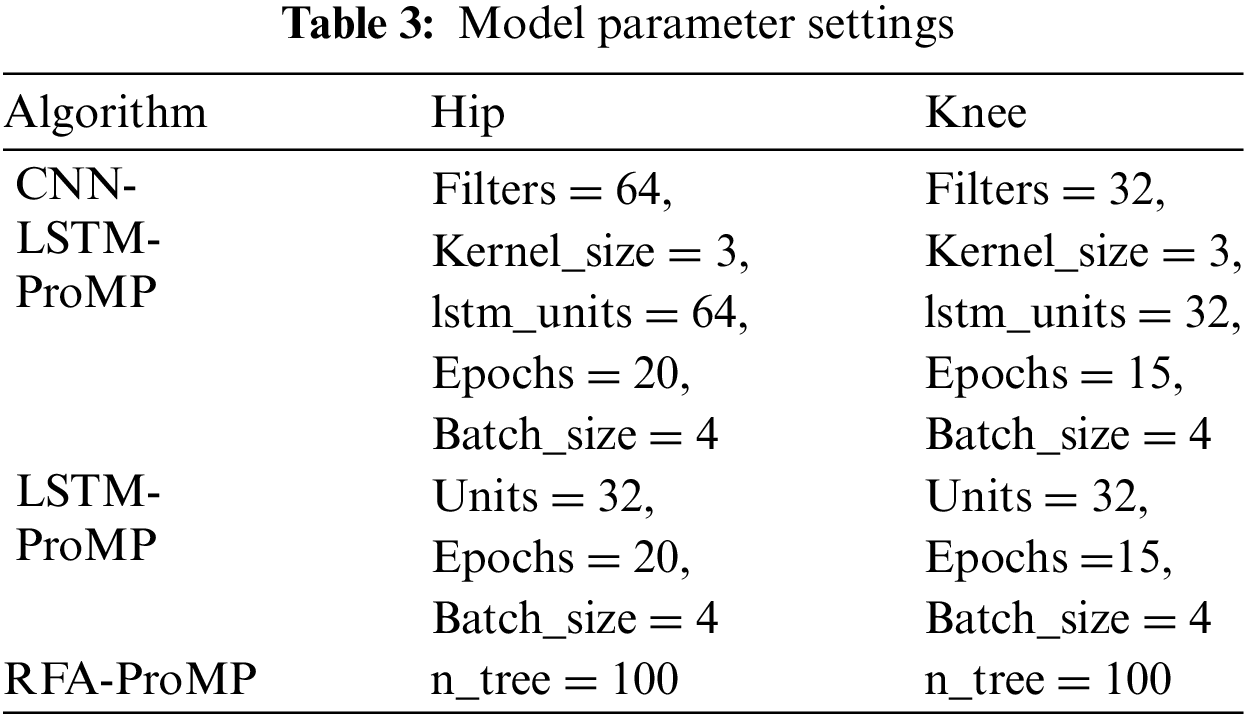
By trial and error, the optimal parameter table for each model in the experiment is obtained in Table 3 based on the optimal
Personalized gait trajectories based on human characteristics are necessary in passive rehabilitation training as the degree of adaptation between the training trajectory and the patient significantly influences the rehabilitation outcome. In the parametric model, the neural network requires iteration, leading to higher computational resource demands and an increase in the algorithm's running time cost. Additionally, the tuning process for the neural network is more cumbersome. Therefore, from the perspective of model complexity and tuning process, the algorithm proposed in this paper is superior to LSTM and CNN-LSTM.
LSTM excels in long time series prediction, capturing the data’s long-term dependencies. However, for passive training gait in rehabilitation, where the gait pattern remains constant for every walking cycle once determined, it can be treated as a static dataset. In contrast, for static data requiring feature selection, LSTM, designed for long time series prediction, is not as effective as CNN-LSTM. Nevertheless, both of them are outperformed by Random Forest. Despite the latter’s weak predictive performance, combining feature weighting with the attention mechanism noticeably enhances prediction accuracy. As trajectory fitting relies on predicted points, RFA’s assurance of key point prediction accuracy directly extends to the accuracy of reconstructed curves.
In trajectory modeling, many scholars employ interpolation methods for trajectory fitting, which, however, lacks the learning of normal gait patterns. This paper utilizes ProMP to fit the gait trajectory. ProMP can reconstruct the gait trajectory using gait key points learned from normal gait, thereby reducing reconstruction errors. This method meets the requirement that rehabilitation training gait should be similar to, yet different from, normal gait. The reference curves generated for various gait speeds reveal that, for the same patient, the gait curves exhibit high similarity. With different gait speeds, the most noticeable difference lies in the variation of the peak value. For the hip joint, besides the change in peak size, there is an adjustment of the starting and ending values. Therefore, based on these results, it can be inferred that rehabilitation practitioners, for the same patient, can adjust rehabilitation strategies by modifying peak values, as well as the starting and ending values, of the gait curves.
This study aims to offer personalized gait training reconstruction trajectories for rehabilitating hemiplegic patients. The RFA algorithm is employed in this article to predict the patient's gait key point angles and choose the reference curve from the normal gait database based on gait speed. A probabilistic trajectory model was established via ProMP, facilitating the learning of normal gait patterns and the reconstruction of the reference curve based on key points. Compared to RF-ProMP, LSTM-ProMP, CNN-LSTM-ProMP, and GPPM algorithms, our method demonstrates superiority, suggesting its applicability in personalized gait trajectory generation and offering potential support and applications in the field of rehabilitation medicine.
However, there is still room for improvement in this study. Future work will consider introducing more parameters such as leg length, crotch width, etc., and these improvements will further enhance the performance of the algorithm and make it more applicable to the field of rehabilitation medicine.
Acknowledgement: The authors acknowledge and extend their appreciation to the Lower Limb Rehabilitation Exoskeleton Research Team of Guizhou University for their support in this study.
Funding Statement: This study was supported by Guizhou Provincial Department of Science and Technology (Guizhou Science and Technology Cooperation Support [2021] General 442), Guizhou Provincial Department of Science and Technology (Guizhou Science and Technology Cooperation Support [2023] General 179), Guizhou Provincial Department of Science and Technology (Guizhou Science and Technology Cooperation Support [2023] General 096).
Author Contributions: Zhiqin He conceived of the presented idea. Chunhong Zeng and Kang Lu developed the theory and performed the computations. Qinmu Wu verified the methods. All authors reviewed the results and approved the final version of the manuscript.
Availability of Data and Materials: The data that support the findings of this study are available from the corresponding author, Zhiqin He, upon reasonable request.
Conflicts of Interest: The authors declare they have no conflicts of interest to report regarding the present study.
References
1. J. Li, C. R. Lan, P. Liang, M. Y. Zhong, X. L. Shi and Y. L. Lv, “Research on interactive force acquisition and active-passive mode determination of rehabilitation robot,” Measurement, vol. 220, pp. 113340, 2023. doi: 10.1016/j.measurement.2023.113340. [Google Scholar] [CrossRef]
2. D. H. Zhao, T. Q. Zhang, H. D. Liu, J. Y. Yang, and H. Yokoi, “Gait rehabilitation training robot: A motion-intention recognition approach with safety and convenience,” Robot. Auton. Syst., vol. 158, pp. 104260, 2022. doi: 10.1016/j.robot.2022.104260. [Google Scholar] [CrossRef]
3. C. Mcdonald, C. Fingleton, S. Murphy, and O. Lennon, “Stroke survivor perceptions of using an exoskeleton during acute gait rehabilitation,” Sci. Rep. vol. 12, pp. 1–9, 2022. [Google Scholar]
4. S. H. Lee, J. Kim, B. Lim, H. J. Lee, and Y. H. Kim, “Exercise with a wearable hip-assist robot improved physical function and walking efficiency in older adults,” Sci. Rep., vol. 13, pp. 7269, 2023. doi: 10.1038/s41598-023-32335-8. [Google Scholar] [PubMed] [CrossRef]
5. C. B. Zou, R. Huang, H. Cheng, and J. Qiu, “Learning gait models with varying walking speeds,” IEEE Robot. Autom. Lett., vol. 6, no. 1, pp. 183–190, 2021. doi: 10.1109/LRA.2020.3006818. [Google Scholar] [CrossRef]
6. S. X. Ren et al., “Personalized gait trajectory generation based on anthropometric features using Random Forest,” J. Ambient Intell. Hum. Comput., vol. 14, pp. 15597–15608, 2019. [Google Scholar]
7. X. Y. Hu, F. Shen, Z. Zhao, X. D. Qu, and J. Ye, “An individualized gait pattern prediction model based on the least absolute shrinkage and selection operator regression,” J. Biomech., vol. 112, pp. 110052, 2020. doi: 10.1016/j.jbiomech.2020.110052. [Google Scholar] [PubMed] [CrossRef]
8. V. B. Semwal, R. Jain, P. Maheshwari, and S. Khatwani, “Gait reference trajectory generation at different walking speeds using LSTM and CNN,” Multimed. Tools Appl., vol. 82, pp. 21, 2023. doi: 10.1007/s11042-023-14733-2. [Google Scholar] [CrossRef]
9. C. Q. Chen, L. Jiang, and H. Wang, “A gait prediction method for lower limb exoskeleton based on SAE and LSTM,” (in ChineseComput. Eng. Appl., vol. 55, no. 12, pp. 110–116+154, 2019. [Google Scholar]
10. B. Vidya and P. Sasikumar, “Parkinson’s disease diagnosis and stage prediction based on gait signal analysis using EMD and CNN-LSTM network,” Eng. Appl. Artif. Intell., vol. 114, pp. 105099, 2022. doi: 10.1016/j.engappai.2022.105099. [Google Scholar] [CrossRef]
11. J. L. Ren, A. H. Wang, H. Y. Li, X. B. Yue, and L. Meng, “A transformer-based neural network for gait prediction in lower limb exoskeleton robots using plantar force,” Sensors, vol. 23, pp. 14, 2023. [Google Scholar]
12. Z. K. Zhou, B. H. Liang, G. W. Huang, B. Liu, J. J. Nong and L. H. Xie, “Individualized gait generationfor rehabilitation robots based on recurrent neural networks,” IEEE Trans. Neural Syst. Rehabil. Eng.: Publ. IEEE Eng. Med. Biol. Soc., vol. 29, pp. 273–281, 2021. doi: 10.1109/TNSRE.7333. [Google Scholar] [CrossRef]
13. J. Hong, C. Chun, S. J. Kim, and F. C. Park, “Gaussian process trajectory learning and synthesis of individualized gait motions,” IEEE Trans. Neural Syst. Rehabil. Eng, Publ. IEEE Eng. Med. Biol. Soc., vol. 27, pp. 6, 2019. [Google Scholar]
14. B. Koopman, E. H. H. V. Aeesldonk, and H. V. D. Kooij, “Speed-dependent reference joint trajectory generation for robotic gait support,” J. Biomech., vol. 47, no. 6, pp. 1447–1458, 2014. doi: 10.1016/j.jbiomech.2014.01.037. [Google Scholar] [PubMed] [CrossRef]
15. Y. Yun, H. C. Kin, S. Y. Shin, J. Lee, A. D. Deshpande and C. Kim, “Statisticl method for prediction of gait kinematics with gaussian process regression,” J. Biomech., vol. 47, no. 1, pp. 186–192, 2014. doi: 10.1016/j.jbiomech.2013.09.032. [Google Scholar] [PubMed] [CrossRef]
16. L. Luo et al., “Trajectory generation and control of a lower limb exoskeleton for gait assistance,” J. Intell. Robot. Syst., vol. 106, pp. 3, 2022. [Google Scholar]
17. V. U. Lev and V. K. Andrei, “Attention-based random forest and contamination model,” Neural Netw., Official J. Int. Neural Netw. Soc., vol. 154, pp. 346–359 2022. [Google Scholar]
18. J. Q. Wang, Y. Z. Gao, D. M. Wu, and W. Dong, “Probabilistic movement primitive based motion learning for a lower limb exoskeleton with black-box optimization,” Front. Inf. Technol. Electron. Eng., vol. 24, no. 1, pp. 104–116, 2023. doi: 10.1631/FITEE.2200065. [Google Scholar] [CrossRef]
19. Y. L. Huang, D. Xu, and M. Tan, “A review of imitative learning for robot motion trajectories,” J. Automat., vol. 48, no. 2, pp. 315–334, 2022. [Google Scholar]
20. J. Q. Wang, D. M. Wu, Y. Z. Gao, and W. Dong, “Interaction learning control with movement primitives for lower limb exoskeleton,” Front. Neurorobot., vol. 16, pp. 1086578, 2022. doi: 10.3389/fnbot.2022.1086578. [Google Scholar] [PubMed] [CrossRef]
21. Z. C. Yan, W. H. Wang, L. Sun, and X. B. Yu, “Probabilistic motion prediction and skill learning for human-to-cobot dual-arm handover control,” IEEE Trans. Neural Netw. Learn. Syst., vol. 35, no. 1, pp. 1192–1204, 2024. doi: 10.1109/TNNLS.2022.3182973. [Google Scholar] [PubMed] [CrossRef]
22. T. P. Luu, K. H. Low, X. D. Qu, H. B. Lim, and K. H. Hoon, “An individual-specific gait pattern prediction model based on generalized regression neural networks,” Gait Posture, vol. 39, no. 1, pp. 443–448, 2014. doi: 10.1016/j.gaitpost.2013.08.028. [Google Scholar] [PubMed] [CrossRef]
Cite This Article
 Copyright © 2024 The Author(s). Published by Tech Science Press.
This work is licensed under a Creative Commons Attribution 4.0 International License , which permits unrestricted use, distribution, and reproduction in any medium, provided the original work is properly cited.
 Downloads
 Citation Tools