
 Submit a Paper
 Propose a Special lssue
 Open Access
ARTICLE

Enhancing Tea Leaf Disease Identification with Lightweight MobileNetV2
1 College of Big Data and Information Engineering, Guizhou University, Guiyang, 550025, China
2 Power Semiconductor Device Reliability Engineering Center of the Ministry of Education, Guiyang, 550025, China
3 State Key Laboratory of Public Big Data, Guizhou University, Guiyang, 550025, China
4 The Mushroom Research Centre, Guizhou University, Guiyang, 550025, China
5 The Engineering Research Center of Southwest Bio-Pharmaceutical Resources, Ministry of Education, Guizhou University, Guiyang, 550025, China
* Corresponding Author: Benliang Xie. Email:
Computers, Materials & Continua 2024, 80(1), 679-694. https://doi.org/10.32604/cmc.2024.051526
Received 07 March 2024; Accepted 16 May 2024; Issue published 18 July 2024
 View Full Text
 Download PDF
Abstract
Diseases in tea trees can result in significant losses in both the quality and quantity of tea production. Regular monitoring can help to prevent the occurrence of large-scale diseases in tea plantations. However, existing methods face challenges such as a high number of parameters and low recognition accuracy, which hinders their application in tea plantation monitoring equipment. This paper presents a lightweight I-MobileNetV2 model for identifying diseases in tea leaves, to address these challenges. The proposed method first embeds a Coordinate Attention (CA) module into the original MobileNetV2 network, enabling the model to locate disease regions accurately. Secondly, a Multi-branch Parallel Convolution (MPC) module is employed to extract disease features across multiple scales, improving the model’s adaptability to different disease scales. Finally, the AutoML for Model Compression (AMC) is used to compress the model and reduce computational complexity. Experimental results indicate that our proposed algorithm attains an average accuracy of 96.12% on our self-built tea leaf disease dataset, surpassing the original MobileNetV2 by 1.91%. Furthermore, the number of model parameters have been reduced by 40%, making it more suitable for practical application in tea plantation environments.Keywords
As the world’s largest tea-producing and consuming country, China holds a significant position in the national economy due to its thriving tea industry. The growth of this industry is beneficial for improving the income level of tea farmers and is an effective way to help them escape poverty. Tea leaf diseases can significantly reduce both the yield and quality of tea during its planting and growth stages, leading to economic losses for farmers in the industry. Among them, the reduction in production caused by diseases such as the tea algal leaf spot, tea bud blight, and tea leaf blight accounts for approximately 20% [1]. Therefore, the rapid and accurate identification of tea leaf diseases and guidance for tea farmers to use pesticides correctly, are of great significance for improving tea yield and reducing tea production losses.
China is known to host approximately 130 species of tea tree diseases, with more than 40 common diseases, among which leaf diseases account for a large proportion. Currently, tea leaf diseases are primarily identified through manual recognition methods, which is often suboptimal [2]. Firstly, there are many species of tea leaf diseases, and some have similar symptoms, which can easily lead to misjudgments due to human subjective factors. Secondly, manual identification of tea leaf diseases is both time-consuming and labor-intensive, requiring prior knowledge about tea leaf diseases and a long time to identify tea leaf diseases. Therefore, for the actual tea plantation environment, the manual identification of tea leaf diseases is impractical.
To enhance the prevention and control of tea leaf diseases in plantations, this study employs deep learning methods for the identification of various tea leaf diseases. The research findings can assist tea farmers in making informed decisions regarding pesticide selection and usage, thereby enabling effective prevention and control of multiple diseases. The key contributions of this study include:
(1) To address the issue of a single background in existing tea leaf disease identification methods, we collected 2544 images of 5 types of tea leaf diseases and healthy leaves in tea plantations. These images were then subjected to pre-processing techniques such as image resizing and data augmentation, we obtained a tea leaf disease identification dataset that includes complex backgrounds.
(2) We introduced the CA module to enhance the network’s focus on tea leaf disease targets, reducing the impact of the complex background of tea leaf disease images on the identification results, ultimately improving the network’s identification accuracy. In addition, we used four comparative experiments to determine the embedding position of the coordinate attention mechanism, achieving the best effect.
(3) By using our self-designed MPC module, we expanded the receptive field of the network, enhancing the network’s perception of global features, thus improving the network’s identification accuracy and generalization ability.
(4) We utilized the AMC technology to compress the model, reducing the amount of model parameters, and improving computational efficiency. We also compared it with two other pruning methods to validate the effectiveness of the method we used.
In this subsection, we reviewed and summarized various research literature on tea leaf disease identification. During the early research stages, many scholars researched tea leaf disease recognition using machine learning. Sun et al. [3] proposed a method that combines Simple Linear Iterative Cluster (SLIC) with Support Vector Machine (SVM) to accurately extract the saliency map of tea leaf disease from complex backgrounds. Zou et al. [4] proposed a tea leaf disease recognition method that utilizes spectral reflectance and machine learning techniques. The approach consists of a feature selector, a decision tree, and a tea leaf disease recognizer, utilizing a random forest. By using the decision tree, relevant features are selected, and redundant features are eliminated. The proposed method enables more effective feature selection and learning from high-dimensional data, leading to the non-destructive and efficient identification of various tea leaf diseases. Hossain et al. [5] developed an image processing system utilizing SVM as a classifier, enabling rapid and precise identification of two prevalent tea leaf diseases in Bangladesh.
With the continuous development of deep learning, methods based on deep neural networks have achieved remarkable performance in many computer vision tasks [6,7]. Some scholars have applied deep neural network technology to the field of tea leaf disease recognition. It has been widely applied and achieved remarkable results in tea leaf disease recognition. Pandian et al. [8] proposed a Deep Convolutional Neural Network (DCNN) based on inverted residual and linear bottleneck layers to diagnose the tea grey blight disease, which can effectively identify the disease. Prabu et al. [9] developed a real-time disease prediction system for tea leaf diseases using Convolutional Neural Network (CNN) on the Platform-as-a-Service (PaaS) cloud. The system can be accessed via a hyperlink deployed by the model using a smartphone. It allows users to capture images of tea leaf diseases using their smartphone’s camera and upload them to the cloud, where the cloud system automatically predicts and displays the disease on the mobile screen. Datta et al. [10] proposed a deep CNN for accurately detecting 5 types of tea leaf diseases and healthy leaves. The proposed model achieved an impressive accuracy of 96.56% in identifying the specific disease.
Hu et al. [11] proposed a low-shot learning approach for tea leaf disease recognition. Their method involved segmenting disease spots on tea leaves using support vector machines to remove background interference. Additionally, an improved Conditional Deep Convolutional Generative Adversarial Network (C-DCGAN) was employed to address the limited training sample issue. Finally, the VGG16 model was trained to classify tea leaf diseases. Hu et al. [12] improved the CIFAR10-quick model by adding a multi-scale feature extraction module. This enhancement helped the model automatically extract various tea leaf disease image features. They also utilized depth-wise separable convolution to reduce model parameters and accelerate computation. Consequently, their approach achieved better average identification accuracy. Chen et al. [13] proposed a CNNs model called LeafNet for automatically extracting tea leaf disease features from images. The recognition accuracy for the 7 types of tea leaf diseases reached as high as 90.16%.
Mukhopadhyay et al. [14] proposed a method for detecting disease spots in tea leaves using a Non-dominated Sorting Genetic Algorithm (NSGA-II) based image clustering approach. They further employed Principal Component Analysis (PCA) and multi-class SVM to reduce features and identify tea leaf diseases, achieving a recognition accuracy of 83% for 5 types of tea leaf diseases. Nath et al. [15] designed a tea leaf disease identification model based on automatic learning, which combines a CNN architecture using deep separable convolutions and residual networks with SVM. It achieves a recognition accuracy of 99.28% for healthy tea leaves and 3 types tea leaf disease images. Lin et al. [16] proposed an improved tea leaf disease detection model (TSBA-YOLO). The model first enhances the ability to obtain global information on tea leaf diseases using self-attention mechanisms. Secondly, it improves the multi-scale feature fusion of tea leaf diseases using Bidirectional Feature Pyramid Network (BiFPN) feature fusion networks and Adaptive Space Feature Fusion (ASFF) technology to enhance the model’s resistance to complex backgrounds. Then, the Shuffle Attention mechanism is introduced to address the difficulty of identifying small size tea leaf diseases. Finally, the use of SIoU further improves the accuracy of regression. The detection accuracy of two common tea leaf diseases reached 85.35%.
Although CNN has shown promising results in tea leaf disease recognition, there is still scope for improvement, particularly in detecting diseases with small lesions and complex backgrounds. Moreover, the above models have problems, such as large model parameters, which are not conducive to deployment on mobile devices. To address these issues, we have made improvements to the MobileNetV2 model to build a lightweight, high-accuracy tea leaf disease recognition model, providing strong support for the intelligent development of the tea industry.
The tea leaf disease images collected in this article are from the Yangai Tea Plantation in Huaxi District, Guiyang City, Guizhou Province (106°27′–106°52′ E, 26°11′–26°34′ N). The images were taken by an OPPO Reno Ace mobile phone, with each image measuring 3000 pixels × 4000 pixels. The shooting date is in mid to late April of 2022 when the temperature rises, and tea leaf diseases become more prominent. The shooting time is from 10 am to 5 pm when the sunlight is sufficient, and the images are clearer. To accurately depict the real growth environment of tea leaf diseases in the natural environment, tea leaf diseases were collected under different backgrounds, weather conditions, and light conditions were collected. During the shooting, the phone was positioned 10–20 cm away from the tea leaves, and a total of 2544 disease images in JPG format. Among them, there are 521 images of healthy leaf, 390 images of tea leaf blight, 384 images of tea algal spot, 420 images of tea rea scab, 395 images of tea bud blight, and 434 images of tea grey blight. Examples of healthy leaf images and tea leaf disease images are shown in Fig. 1.

Figure 1: Tea leaf disease data set presentation
To enhance the classification accuracy and robustness of the tea leaf disease recognition model while minimizing overfitting risks, we used four offline data augmentation techniques to expand the existing dataset. These techniques include brightness adjustment, chromaticity adjustment, rotation, and adding Gaussian noise. The augmented dataset was then divided into training and testing sets in a 7:3 ratio, as shown in Table 1, which served as the experimental dataset.

The MobileNetV2 network, proposed by Google in 2018, is a lightweight convolutional neural network [17]. Compared with MobileNetV1 [18], it has higher accuracy and lower model parameter quantity. The backbone network of MobileNetV2 consists of 17 Bottlenecks, a 3 × 3 standard convolution, and an average pooling layer, as shown in Fig. 2. Here, the Bottleneck is the inverted residual block with linear activation function, ‘s’ is the step size of the first bottleneck layer in Bottleneck, and ‘×n’ denotes how many times it is repeated.

Figure 2: The overall structure of MobileNetV2
MobileNetV2 continues the approach of reducing model parameters using depthwise separable convolution from MobileNetV1 and introduces two improvements: inverted residuals and linear bottlenecks. The traditional residual block first reduces and then increases the feature channel dimension. In contrast, the inverted residual block first expands the feature channel dimension, extracts feature information from each channel and then reduces it. This method compensates for the problem of reduced feature information caused by depth-wise separable convolution and ensures the feature extraction ability of the model. In addition, the Rectified Linear Unit (ReLU) activation function can cause a lot of loss of low-dimensional feature information. MobileNetV2 replaces the last convolutional layer of the inverted residual structure with a linear activation function, thereby reducing the loss of low-dimensional feature information and ensuring the recognition performance of the network. The Bottleneck network structure (i.e., the inverted residual block structure with a linear activation function) is shown in Fig. 3.

Figure 3: Bottleneck network structure
3.3 Coordinate Attention Module
The attention mechanism, inspired by human attention, enables networks to focus on key information selectively, reduce attention to other information, even filter out irrelevant information, and improve the efficiency and accuracy of task processing. Therefore, it has been widely applied in computer vision tasks. Among them, the Squeeze-and-Excitation Networks (SENet) is widely used due to its simplicity and efficiency. However, the SENet overlooks the importance of positional information. Subsequent improved attention mechanisms, such as Bottleneck Attention Module (BAM) and Convolutional Block Attention Module (CBAM) utilize convolutional operations to obtain spatial attention and local positional information, but they disconnect the relationship between positional and channel information. The CA module can simultaneously capture spatial position and channel information, enabling the model to locate and identify objects of interest more accurately [19]. Since the disease spots on tea leaves are relatively small and the background occupies a large proportion, it can easily affect the model’s recognition results. Therefore, this paper introduces the CA module to adaptively allocate weights within the feature map, thereby improving the model’s recognition accuracy. The structure of the CA module is shown in Fig. 4.

Figure 4: Coordinate attention mechanism
The CA module consists of two steps: information embedding and attention generation. Specifically, for the input feature map X, pooling convolutional kernels of sizes (H, 1) and (1, W) are used to encode each channel, aiming to capture long-range dependency along one spatial direction while preserving precise positional information along the other spatial direction. The calculation is as follows:
In the equations,
In Eq. (3), [.,.] indicates the spatial concatenation operation, δ means the non-linear activation function, and
In the equations,
To fully exploit the effectiveness of the coordinate attention, this study embeds the CA module into different positions of the MobileNetV2 stride-1 inverted residual structure to explore its performance at different positions, as shown in Fig. 5. According to the accuracy and F1-scores obtained from the comparison experiment of the CA module embedding in Section 4.4, this experiment chooses the CA_Last embedding method to embed the CA module.

Figure 5: CA modules with different embedding positions
3.4 Multi-Branch Parallel Convolution
The standard MobileNetV2 network uses fixed 3 × 3 convolution kernels, which have limited receptive fields and can only capture local information of lesions, failing to capture rich detail and contextual information. Enlarging the receptive field can capture more multi-scale contextual information. Considering that dilated convolution does not increase additional parameters while enlarging the receptive field, different receptive fields can be obtained by setting the dilation rate of the dilated convolution [20]. The calculation formula for the receptive field size of a dilated convolution with dilation rate r and kernel size k × k is:
Therefore, this paper designs a MPC module combining the advantages of dilated convolution to replace the inverted residual block with a stride of 2 in MobileNetV2. The MPC module, while retaining the original residual structure, adds two feature extraction branches, as shown in Fig. 6.

Figure 6: Multi-branch parallel convolution block
Firstly, the input undergoes a 1 × 1 point convolution, then two dilated convolutions with dilation rates of 2 and 3 are used in parallel to extract multi-scale features . Secondly, considering that dilated convolution may not extract features from the dilated parts, 3 × 3 and 5 × 5 depth convolutions are added after the branches with dilation rates of 2 and 3, respectively, to extract features from the dilated parts. Finally, each branch is processed with a 1 × 1 point convolution, and the features are fused. Batch normalization and ReLU6 activation function are used after each convolution in the figure to accelerate model convergence and alleviate gradient disappearance.
Model pruning is a model compression technique that mainly involves removing channels and layers with minimal impact on network performance to achieve an optimal balance between model size and recognition performance. Traditional model compression relies on human expertise, requiring domain experts to manually adjust the search for the optimal configuration, making the process tedious and time-consuming. However, the AMC technology for the Model Compression algorithm can fully automate model pruning and achieve excellent pruning results [21]. To enhance the efficiency of model pruning, this paper uses the AMC technology to lighten the original model. Fig. 7 shows the algorithm framework of AMC.
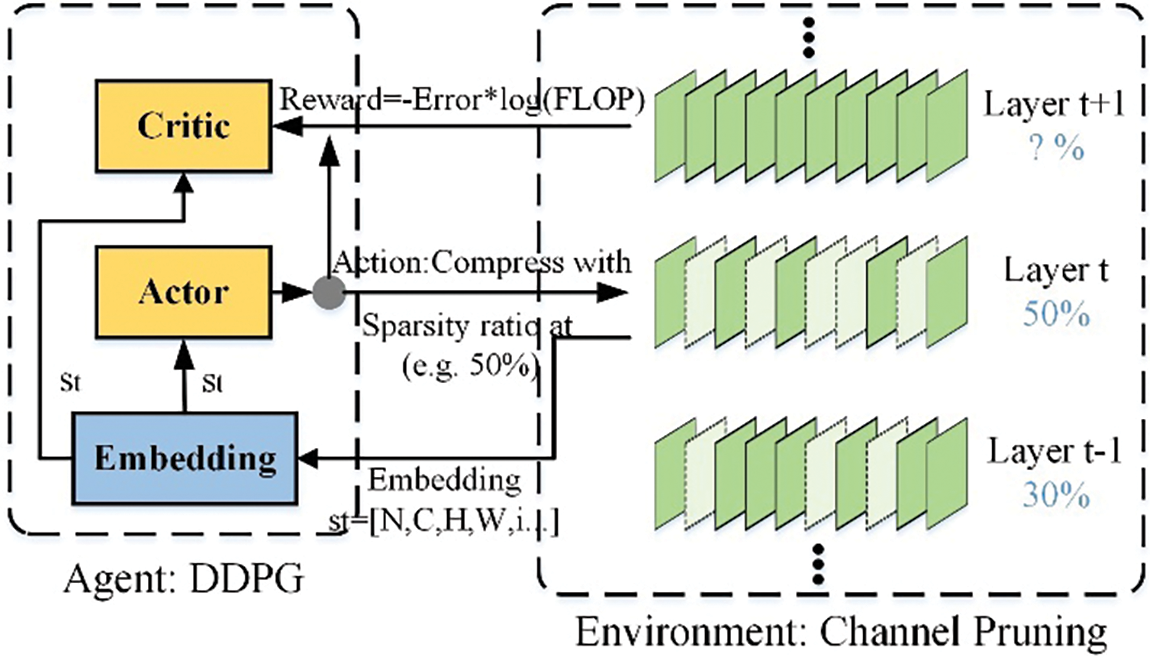
Figure 7: AMC algorithm framework
The AMC algorithm consists of two parts: Agent and Environment. The Agent part uses the Deep Deterministic Policy Gradient (DDPG) algorithm, composed of three parts: Embedding, Actor, and Critic. The pruning algorithm follows the steps below:
(1) The agent receives the encoded state of the layer
(2) Pruning operations are performed based on the sparsity ratio obtained from the previous step.
(3) Repeat steps 1 and 2 until the pruning strategy search for all layers is completed.
(4) The pruned model is evaluated for accuracy on the validation set, and the results are returned to the agent.
After completing the above steps, the model undergoes fine-tuning, where it is retrained to restore the accuracy of the pruned model.
The experiment was developed using Python language and based on PyTorch 1.8.0 deep learning framework. The CPU was Intel(R) Core (TM) i5-11400F, and the operating system was Windows 10. NVIDIA GeForce RTX 3060 GPU with 8 GB memory was used for accelerated training. The input disease images were cropped to 224 × 224, and the Adam optimizer was employed to update gradients with an initial learning rate of 0.001. Each processing batch had a size of 16, and the model was iterated for 200 epochs.
There are various methods to evaluate the model’s performance, and this study primarily focuses on Accuracy, Precision, Recall, F1-score, and the associated issues with deploying the model on mobile devices. The following six evaluation methods were used to assess the model performance:
In Eqs. (8)–(11), TP stands for true positive, TP indicates true negative, FP is false positive, and FN is false negative of the predicted class.
The model parameter count, also known as params, refers to the number of parameters in the model. It not only directly determines the size of the model file but also affects the amount of computer memory used during model inference, which can be limited in resource-constrained mobile platforms. The computational complexity of the model can be quantified in terms of Floating Point Operations (FLOPs), where a lower FLOPs value indicates a smaller computational load, faster execution speed, and shorter disease detection time.
4.3 Performance Comparison of Embedded CA Module
To verify the excellence of the CA module embedding method used in this paper, a comparative experiment of the four embedding methods in Fig. 5 of Section 3.3 was designed. The experimental results on the tea leaf disease dataset are shown in Table 2.

The data presented in Table 2 shows that the CA-First embedding method improved the accuracy by 0.3% and the F1-score by 0.58% compared to the baseline model. For the CA-Second embedding method, its accuracy was 0.71% higher than the baseline model, while its F1-score was 0.64% higher. However, for the CA-Third embedding method, after embedding the CA module, its accuracy was 0.33% lower than the baseline model, and the F1-score was only 0.06% higher than the baseline model. For the CA-Last embedding method, its accuracy and F1-score were 1.33% and 1.15% higher than the baseline model. Overall, introducing the CA module after the last 1 × 1 pointwise convolution in the MobileNetV2 inverted residual module can strengthen the connection between channels and compress the number of channels. Therefore, this experiment adopted the CA-Last embedding method to embed the CA module.
4.4 Comparison of Pruning Results
To assess the effectiveness of the AMC pruning method on MobileNetV2, comparative experiments were conducted with two other excellent model pruning methods. The pruning effects of the three pruning methods are shown in Table 3.

Table 3 reveals that while Molchanov et al.’s approach maintains higher accuracy, the model still has many parameters and FLOPs. On the other hand, the method of Liu et al. has a similar number of parameters and FLOPs as the pruning method discussed in this paper, but it experiences a notable decrease in accuracy. After using the AMC pruning method, the model’s parameters are reduced by about 62%, computation is decreased by 57%, and the accuracy only drops by 1.06%. Overall, the pruning method used in this paper has a higher compression rate and recognition accuracy, rendering it more suitable for deployment on edge devices.
To verify the impact of each improvement of this network on model performance, the ablation experiments were conducted based on the original MobileNetV2 network. The ablation experiments mainly included embedding the coordinate attention mechanism, introducing a Multi-branch Parallel Convolution module, and using an automated pruning strategy in the base network to design comparison experiments. The experimental results are shown in Table 4.

Based on the experimental data presented in Table 4, it is evident that after embedding the CA module, the models’ parameters only increased by 0.04 M, while the accuracy improved by 1.33%. This indicates that embedding the CA module weakened irrelevant information, strengthened the representation of disease information, and enhanced network performance. In addition, after adding the MPC module, the accuracy increased by 1.58%, while the number of model parameters increased by 2.05 M. This suggests that the fusion of features from three branches obtained multi-level feature information at different scales, thereby improving the feature representation capability, but also resulting in many parameters. Finally, using automated model pruning to compress the models resulted in a 1.06% decrease in accuracy, but it greatly simplified the model complexity. After pruning, the number of model parameters was approximately 1/3 of the original model’s parameters. Therefore, it can be seen that the various improvements added in this article have a positive impact on the model, and the model’s performance after incorporating all three improvements is better than that of using a single or two improvements.
During the training iteration process, the accuracy and loss value curves of the original and improved models are shown in Fig. 8. The figure demonstrates that the enhanced I-MobileNetV2 model achieves not only superior recognition accuracy but also quicker convergence, thereby exhibiting an overall better performance.
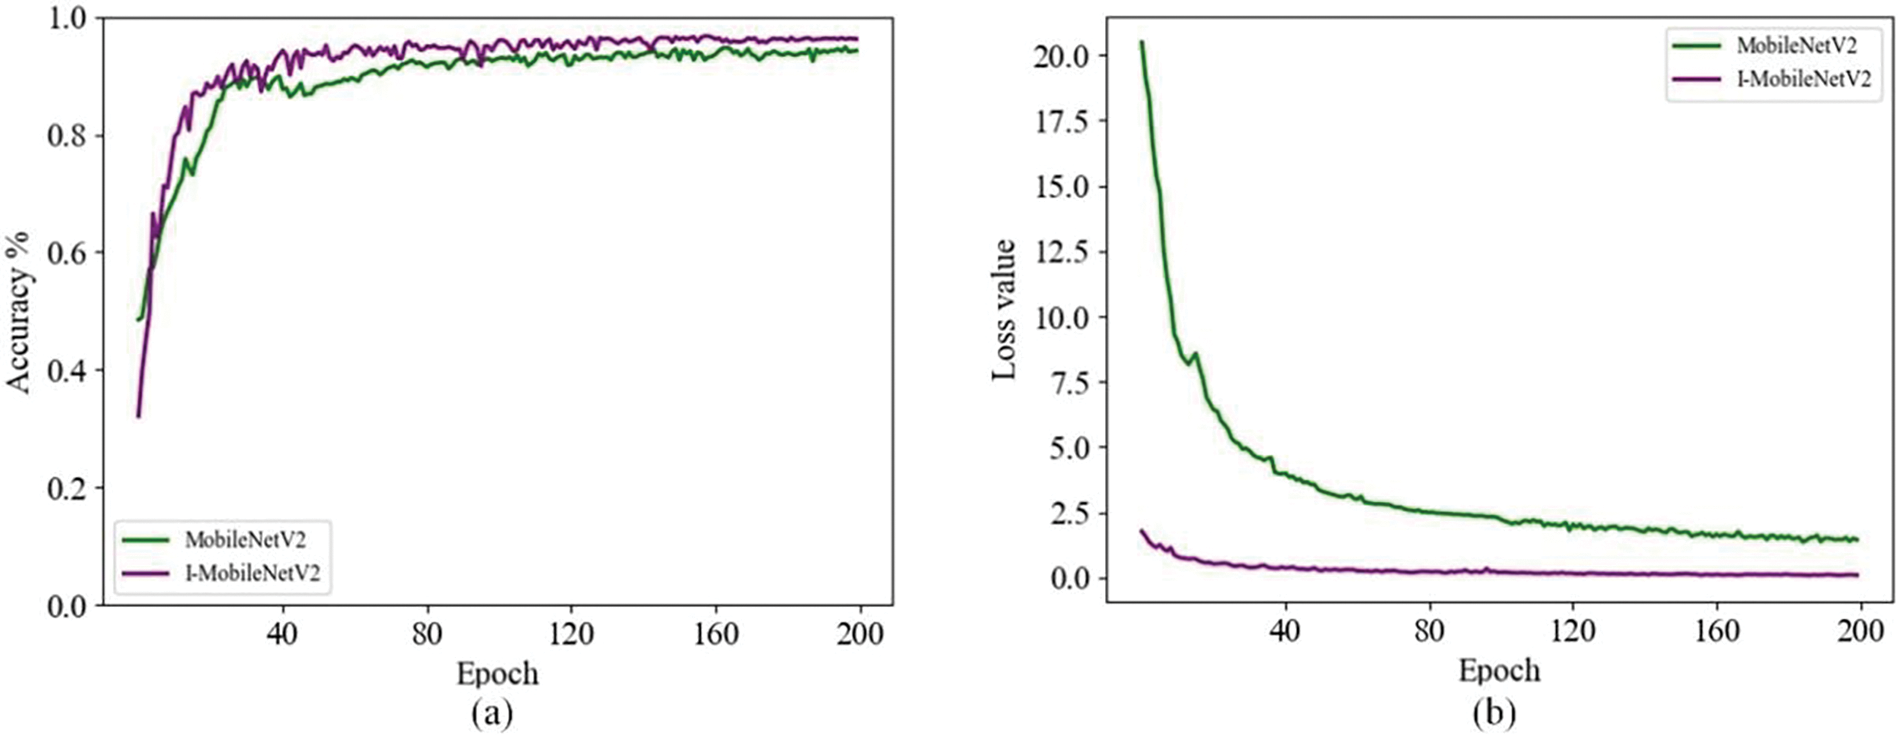
Figure 8: Accuracy and loss value change curves of the original and improved models
In addition, the confusion matrix contains the number of correctly and incorrectly predicted samples in the test set, which can help us visually evaluate the classification accuracy of each category. To analyze the differences in the improved model’s recognition performance for different categories of tea leaf diseases, we plotted the confusion matrix of the I-MobileNetV2 model on the testing set, as shown in Fig. 9.

Figure 9: The confusion matrix of the test set
From Fig. 9, it can be seen that the confusion matrix displays the recognition accuracy and misclassification of each class in the testing set, with high misidentification rates for tea bud blight and tea leaf blight. In the late stages of tea bud blight, the spots are large and similar in color to those of tea leaf blight, thus making misclassification easy. Although a few disease samples were misclassified among similar samples, the recognition effect was not ideal. Overall, the improved model could correctly identify most disease samples, and misclassifications and omissions only occurred in a minimal number of samples, getting a high overall recognition accuracy.
To validate the effectiveness of the proposed algorithm on the tea leaf disease dataset, experimentation was conducted using 8 popular convolutional neural networks. Table 5 provides a performance comparison of training VGG16 [24], GoogLeNet [25], ResNet18 [26], ShuffleNetV2 [27], EfficientNet_B0 [28], GhostNet [29], RepVGG [30], FasterNet_T0 [31] and the I-MobileNetV2 on the tea leaf disease dataset.

From Table 5, it can be seen that I-MobileNetV2 has the highest Precision and F1-score, with the third highest recognize accuracy. It has a relatively less number of parameters and FLOPs. Compared to RepVGG_A0, the I-MobileNetV2 model’s performance is slightly lower in recognition accuracy by 0.62%, but it outperforms RepVGG_A0 in terms of F1-score, parameter, and FLOPs. ShuffleNetV2 has a higher Recall score than I-MobileNetV2 model, and its parameter and FLOPs are also lower, but its recognize accuracy is 0.69% lower than the I-MobileNetV2 and its parameter and FLOPs are comparable. Overall, the I-MobileNetV2 has a competitive advantage. Additionally, in terms of model lightweight property, and FLOPs, the GhostNet model is more competitive. However, considering overall recognize accuracy and other evaluation metrics, the improved model remains the best.
In summary, the improved model not only enhances recognition accuracy but also significantly reduces the number of parameters and FLOPs, this provides suitable conditions for real-time deployment. The comprehensive performance is superior compared to the above seven mainstream models.
This article focuses on identifying tea leaf diseases in natural environment, selecting healthy tea leaves and five common diseases as experimental objects. Considering the complexity of tea leaf disease backgrounds and difficulty identifying small lesions, we improved the lightweight network MobileNetV2, effectively solving these issues. The improved model first embedded a CA module to reduce background noise and other interference, making the network more focused on the disease information. Secondly, a MPC module was added to enhance the model’s ability to extract features of different scales. Finally, an automated model pruning algorithm was used to make the model lightweight and easy to deploy on edge devices. As a result of these improvements, the recognition accuracy of the improved network increased by 1.91%, and the parameter quantity was reduced by about 40% compared to the original model. The experimental results show that the enhanced network balanced between recognition accuracy and model parameter quantity on the tea leaf disease dataset. Compared with popular neural networks, the enhanced network has a better recognition effect on tea leaf diseases and fewer model parameters, which can meet the needs of multi-class tea leaf disease identification in natural environment and bring hope for deploying the model to field devices.
In the future, we will further improve the model and plan to deploy it on mobile devices for practical application in tea production processes. At the same time, we will collect more tea leaf disease categories and image data in natural environment, striving to build a larger-scale dataset.
Acknowledgement: Thanks for the computing support of the State Key Laboratory of Public Big Data, Guizhou University.
Funding Statement: This work was supported by National Key Research and Development Program (No. 2016YFD0201305-07), Guizhou Provincial Basic Research Program (Natural Science) (No. ZK [2023]060), Open Fund Project in Semiconductor Power Device Reliability Engineering Center of Ministry of Education (No. ERCMEKFJJ2019-06).
Author Contributions: The authors confirm contribution to the paper as follows: study conception and design: Zhilin Li, Yuxin Li; data collection: Chunyu Yan, Peng Yan, Xiutong Li, Mei Yu; analysis and interpretation of results: Zhilin Li, Benliang Xie, Tingchi Wen; draft manuscript preparation: Zhilin Li. All authors reviewed the results and approved the final version of the manuscript.
Availability of Data and Materials: The data that support the findings of this study are available from the corresponding author, upon reasonable request.
Conflicts of Interest: The authors declare that they have no conflicts of interest to report regarding the present study.
References
1. W. Bao, T. Fan, G. Hu, D. Liang, and H. Li, “Detection and identification of tea leaf diseases based on AX-RetinaNet,” Sci. Rep., vol. 12, no. 1, pp. 2183, Feb. 2022. doi: 10.1038/s41598-022-06181-z. [Google Scholar] [PubMed] [CrossRef]
2. M. J. A. Soeb et al., “Tea leaf disease detection and identification based on YOLOv7 (YOLO-T),” Sci. Rep., vol. 13, no. 1, pp. 6078, Apr. 2022. doi: 10.1038/s41598-023-33270-4. [Google Scholar] [PubMed] [CrossRef]
3. Y. Sun, Z. Jiang, L. Zhang, W. Dong, and Y. Rao, “SLIC_SVM based leaf diseases saliency map extraction of tea plant,” Comput. Electron. Agric., vol. 157, no. 2, pp. 102–109, Dec. 2019. doi: 10.1016/j.compag.2018.12.042. [Google Scholar] [CrossRef]
4. X. Zou, Q. Ren, H. Cao, Y. Qian, and S. Zhang, “Identification of tea leaf diseases based on spectral reflectance and machine learning,” J. Inf. Process. Syst., vol. 6, no. 2, pp. 435–446, 2020. doi: 10.3745/JIPS.02.0133. [Google Scholar] [CrossRef]
5. S. Hossain, R. M. Mou, M. M. Hasan, S. Chakraborty, and M. A. Razzak, “Recognition and detection of tea leaf’s diseases using support vector machine,” presented at the 2018 IEEE. Inter. Colloq. Signal Proces. Appl., Penang, Malaysia, Mar. 2018, pp. 150–154. doi: 10.1109/CSPA.2018.8368703. [Google Scholar] [CrossRef]
6. W. Lin, J. Chu, L. Leng, J. Miao, and L. Wang, “Feature disentanglement in one-stage object detection,” Pattern Recogn., vol. 145, pp. 109878, Jun. 2024. doi: 10.1016/j.patcog.2023.109878. [Google Scholar] [CrossRef]
7. Y. Zhang, J. Chu, L. Leng, and J. Miao, “Mask-refined R-CNN: A network for refining object details in instance segmentation,” Sensors, vol. 20, no. 4, pp. 1010, Feb. 2020. doi: 10.3390/s20041010. [Google Scholar] [PubMed] [CrossRef]
8. J. A. Pandian, S. N. Nisha, K. Kanchanadevi, A. K. Pandey, and S. K. Rima, “Grey blight disease detection on tea leaves using improved deep convolutional neural network,” Comput. Intell. Neurosci., vol. 2023, pp. 7876302, Jan. 2023. doi: 10.1155/2023/7876302. [Google Scholar] [PubMed] [CrossRef]
9. S. Prabu, B. R. T. Bapu, S. Sridhar, and V. Nagaraju, “Tea plant leaf disease identification using hybrid filter and support vector machine classifier technique,” in Recent Advances in Internet of Things and Machine Learning, 1st ed. Berlin, German: Springer, Feb. 2022, vol. 215, pp. 117–128 doi: 10.1007/978-981-16-5685-9_58. [Google Scholar] [CrossRef]
10. S. Datta and N. Gupta, “A novel approach for the detection of tea leaf disease using deep neural network,” Procedia Comput. Sci., vol. 218, no. 6, pp. 2273–2286, Jan. 2023. doi: 10.1016/j.procs.2023.01.203. [Google Scholar] [CrossRef]
11. G. Hu, H. Wu, Y. Zhang, and M. Wan, “A low shot learning method for tea leaf’s disease identification,” Comput. Electron. Agric., vol. 163, no. 4, pp. 104852, Aug. 2019. doi: 10.1016/j.compag.2019.104852. [Google Scholar] [CrossRef]
12. G. Hu, X. Yang, Y. Zhang, and M. Wan, “Identification of tea leaf diseases by using an improved deep convolutional neural network,” Sustain. Comput. Infor. Sys., vol. 24, no. 5, pp. 100353, Dec. 2019. doi: 10.1016/j.suscom.2019.100353. [Google Scholar] [CrossRef]
13. J. Chen, Q. Liu, and L. Gao, “Visual tea leaf disease recognition using a convolutional neural network model,” Symmetry, vol. 11, no. 3, pp. 343, Mar. 2019. doi: 10.3390/sym11030343. [Google Scholar] [CrossRef]
14. S. Mukhopadhyay, M. Paul, R. Pal, and D. De, “Tea leaf disease detection using multi-objective image segmentation,” Multimed. Tools Appl., vol. 80, no. 1, pp. 753–771, Jan. 2021. doi: 10.1007/s11042-020-09567-1. [Google Scholar] [CrossRef]
15. M. Nath, P. Mitra, and D. Kumar, “A novel residual learning-based deep learning model integrated with attention mechanism and SVM for identifying tea plant diseases,” Int. J. Comput. Appl., vol. 45, no. 6, pp. 471–484, Jul. 2023. doi: 10.1080/1206212X.2023.2235750. [Google Scholar] [CrossRef]
16. J. Lin, D. Bai, R. Xu, and H. Lin, “TSBA-YOLO: An improved tea leaf diseases detection model based on attention mechanisms and feature fusion,” Forests, vol. 14, no. 3, pp. 619, Mar. 2020. doi: 10.3390/f14030619. [Google Scholar] [CrossRef]
17. M. Sandler, A. Howard, M. Zhu, A. Zhmoginov, and L. C. Chen, “MobileNetV2: Inverted residuals and linear bottlenecks,” presented at the 2018 IEEE/CVF Conf. Comput. Vis. Pattern Recog., Salt Lake City, UT, USA, Jun. 2018, pp. 4510–4520. doi: 10.48550/arXiv.1801.04381. [Google Scholar] [CrossRef]
18. A. G. Howard et al., “MobileNets: Efficient convolutional neural networks for mobile vision applications,” arXiv preprint arXiv:1704.04861,2017. doi: 10.48550/arXiv.1704.04861. [Google Scholar] [CrossRef]
19. Q. Hou, D. Zhou, and J. Feng, “Coordinate attention for efficient mobile network design,” presented at the 2021 IEEE/CVF Conf. Comput. Vis. Pattern Recog., Nashville, TN, USA, Jun. 2021, pp. 13713–13722. doi: 10.48550/arXiv.2103.02907. [Google Scholar] [CrossRef]
20. F. Yu and V. Koltun, “Multi-scale context aggregation by dilated convolutions,” arXiv preprint arXiv:1511.07122,2015. doi: 10.48550/arXiv.1511.07122. [Google Scholar] [CrossRef]
21. Y. He, J. Lin, Z. Liu, H. Wang, L. Li and S. Han, “AMC: AutoML for model compression and acceleration on mobile devices,” presented at the 2018 Eur. Conf. Comput. Vis., Munich, BY, Germany, Sep. 2018, pp. 784–800. doi: 10.48550/arXiv.1802.03494. [Google Scholar] [CrossRef]
22. P. Molchanov, S. Tyree, T. Karras, T. Aila, and J. Kautz, “Pruning convolutional neural networks for resource efficient inference,” arXiv preprint arXiv:1611.06440, 2016. doi: 10.48550/arXiv.1611.06440. [Google Scholar] [CrossRef]
23. Z. Liu, J. Li, Z. Shen, C. Zhang, S. Yan, and C. Zhang, “Learning efficient convolutional networks through network slimming,” presented at the 2017 IEEE Conf. Comput. Vis. Pattern Recog., Honolulu, HI, USA, Jul. 2017, pp. 2736–2744. doi: 10.48550/arXiv.1708.06519. [Google Scholar] [CrossRef]
24. K. Simonyan and A. Zisserman, “Very deep convolutional networks for large-scale image recognition,” arXiv preprint arXiv:1409.1556, 2014. doi: 10.48550/arXiv.1409.1556. [Google Scholar] [CrossRef]
25. C. Szegedy et al., “Going deeper with convolutions,” presented at the 2015 IEEE Conf. Comput. Vis. Pattern Recog., Boston, MA, USA, Jun. 2015, pp. 1–9. doi: 10.1109/CVPR.2015.7298594. [Google Scholar] [CrossRef]
26. K. He, X. Zhang, S. Ren, and J. Sun, “Deep residual learning for image recognition,” presented at the 2016 IEEE Conf. Comput. Vis. Pattern Recog., Las Vegas, NV, USA, Jun. 2016, pp. 770–778. doi: 10.1109/CVPR.2016.90. [Google Scholar] [CrossRef]
27. N. Ma, X. Zhang, H. T. Zheng, and S. Jian, “ShuffleNet V2: Practical guidelines for efficient cnn architecture design,” presented at the 2018 Eur. Conf. Comput. Vis., Munich, BY, Germany, Sep. 2018, pp. 116–131. doi: 10.48550/arXiv.1807.11164. [Google Scholar] [CrossRef]
28. M. Tan and Q. Le, “EfficientNet: Rethinking model scaling for convolutional neural networks,” presented at the 2019 Int. Conf. Mach. Learn, Los Angeles, CA, USA, Jun. 2019, pp. 6105–6114. doi: 10.48550/arXiv.1905.11946. [Google Scholar] [CrossRef]
29. K. Han, Y. Wang, Q. Tian, J. Guo, C. Xu and C. Xu, “GhostNet: More features from cheap operations,” presented at the 2020 IEEE/CVF Conf. Comput. Vis. Pattern Recog., Seattle, WA, USA, Jun. 2020, pp. 1580–1589. doi: 10.48550/arXiv.1911.11907. [Google Scholar] [CrossRef]
30. X. Ding, X. Zhang, N. Ma, J. Han, G. Ding and J. Sun, “RepVGG: Making VGG-style ConvNets great again,” presented at the 2021 IEEE/CVF Conf. Comput. Vis. Pattern Recog., Nashville, TN, USA, Jun. 2021, pp. 13733–13742. doi: 10.48550/arXiv.2101.03697. [Google Scholar] [CrossRef]
31. J. R. Chen et al., “Don’t walk: Chasing higher FLOPS for faster neural networks,” presented at the 2023 IEEE/CVF Conf. Comput Vis. Pattern Recog., Vancouver, BC, Canada, Jun. 2023, pp. 12021–12031. doi: 10.1109/CVPR52729.2023.01157. [Google Scholar] [CrossRef]
Cite This Article
 Copyright © 2024 The Author(s). Published by Tech Science Press.
This work is licensed under a Creative Commons Attribution 4.0 International License , which permits unrestricted use, distribution, and reproduction in any medium, provided the original work is properly cited.
 Downloads
 Citation Tools