
 Submit a Paper
 Propose a Special lssue
 Open Access
ARTICLE

Pulmonary Edema and Pleural Effusion Detection Using EfficientNet-V1-B4 Architecture and AdamW Optimizer from Chest X-Rays Images
1 Faculty of Information Technology, Al-Hussein Bin Talal University, Ma’an, 71111, Jordan
2 College of Information and Communications Technology (ICT), Tafila Technical University, Tafila, 66110, Jordan
3 IOTISTIC Solutions Company, Amman, 11185, Jordan
* Corresponding Author: Malek Zakarya Alksasbeh. Email:
(This article belongs to the Special Issue: Deep Learning in Computer-Aided Diagnosis Based on Medical Image)
Computers, Materials & Continua 2024, 80(1), 1055-1073. https://doi.org/10.32604/cmc.2024.051420
Received 05 March 2024; Accepted 31 May 2024; Issue published 18 July 2024
 View Full Text
 Download PDF
Abstract
This paper presents a novel multiclass system designed to detect pleural effusion and pulmonary edema on chest X-ray images, addressing the critical need for early detection in healthcare. A new comprehensive dataset was formed by combining 28,309 samples from the ChestX-ray14, PadChest, and CheXpert databases, with 10,287, 6022, and 12,000 samples representing Pleural Effusion, Pulmonary Edema, and Normal cases, respectively. Consequently, the preprocessing step involves applying the Contrast Limited Adaptive Histogram Equalization (CLAHE) method to boost the local contrast of the X-ray samples, then resizing the images to 380 × 380 dimensions, followed by using the data augmentation technique. The classification task employs a deep learning model based on the EfficientNet-V1-B4 architecture and is trained using the AdamW optimizer. The proposed multiclass system achieved an accuracy (ACC) of 98.3%, recall of 98.3%, precision of 98.7%, and F1-score of 98.7%. Moreover, the robustness of the model was revealed by the Receiver Operating Characteristic (ROC) analysis, which demonstrated an Area Under the Curve (AUC) of 1.00 for edema and normal cases and 0.99 for effusion. The experimental results demonstrate the superiority of the proposed multi-class system, which has the potential to assist clinicians in timely and accurate diagnosis, leading to improved patient outcomes. Notably, ablation-CAM visualization at the last convolutional layer portrayed further enhanced diagnostic capabilities with heat maps on X-ray images, which will aid clinicians in interpreting and localizing abnormalities more effectively.Keywords
Detecting pulmonary edema and pleural effusion using chest X-rays is crucial for the diagnosis of diseases [1,2]. Pulmonary edema occurs due to fluid buildup in the lungs’ alveoli [3]. Conversely, pleural effusion is a disorder indicated by the abnormal fluid buildup in the membranes surrounding the lungs [4]. Fig. 1a depicts pulmonary edema [5] and Fig. 1b shows pleural effusion [6].
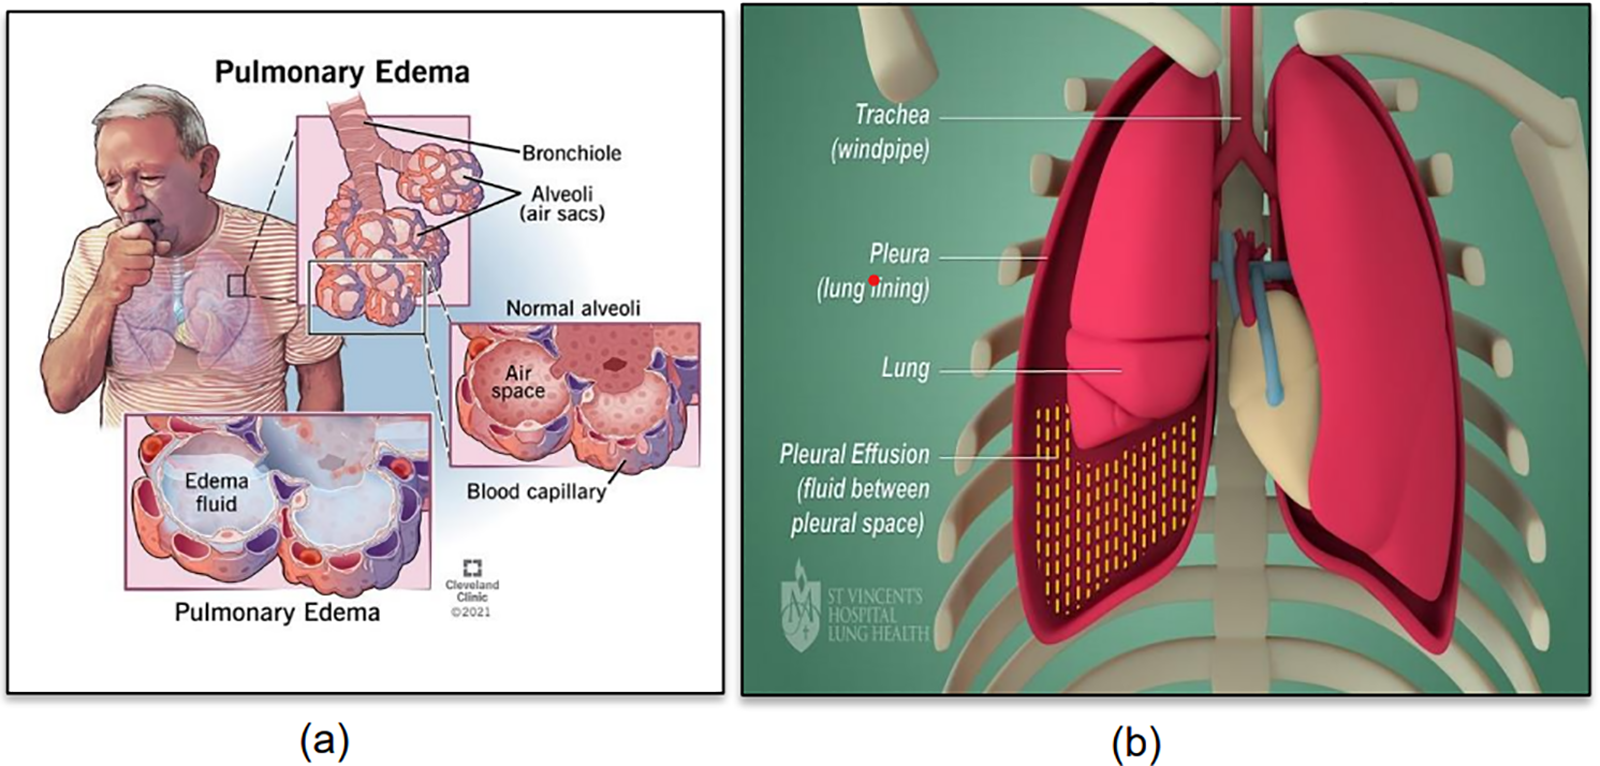
Figure 1: (a) Pulmonary edema (Reprinted from reference [5]); (b) Pleural effusion (Reprinted from reference [6])
In this context, it is crucial to classify whether the fluid is located inside the lung tissue and air sacs (pulmonary edema) or within the pleural space (pleural effusion) [7,8]. Therefore, diagnostic imaging techniques, such as X-rays, are paramount in identifying the presence and extent of these medical conditions, enabling healthcare practitioners to make timely and precise diagnoses [9]. Overall, the complexity in detecting pulmonary edema and pleural effusion underscores the need for a multidisciplinary approach involving clinicians, radiologists, and other specialists to ensure accurate diagnosis and appropriate management.
Additionally, the distinction between pulmonary edema and pleural effusion using chest X-rays will lead to identification the underlying causes of fluid accumulation in the chest. It will also help medical professionals suggest the appropriate management of these disorders and an appropriate treatment approach. For instance, detection of pulmonary edema might indicate congestive heart failure or pneumonia, necessitating specific therapeutic interventions [10]. Conversely, the detection of pleural effusion would require different treatment strategies involving drainage through thoracentesis and chest tube [11].
Likewise, accurately classifying the location of the fluid helps in determining the precise underlying causes, ensuring that patients receive the most effective and tailored care to improve their overall health outcomes [8,12].
Deep learning techniques have demonstrated remarkable advancements in the domain of medical image analysis, particularly in disease detection and diagnosis [13–15]. Deep Convolutional Neural Networks (CNNs) have proven exceptional capabilities in extracting intricate features from complex images, making them an ideal candidate for the detection of pulmonary edema and pleural effusion [16–18].
EfficientNet is a family of CNNs that excel at achieving high accuracy and is computationally efficient [19]. EfficientNet was developed to scale the depth, width, and resolution of the model using a compound coefficient to optimize performance [20]. This approach has led to state-of-the-art results on the task of image classification for various applications while minimizing computational demands [21]. In particular, the EfficientNet-V1-B4 architecture is known for its exceptional efficiency in terms of the model size and computational resources. It achieves superior performance with fewer parameters compared to traditional architectures, making it well-suited for resource-constrained environments commonly encountered in medical settings. This efficiency translates to faster inference times and reduced computational costs, facilitating the real-time or near-real-time analysis of medical images for timely diagnosis and intervention. Coupled with the AdamW optimizer, which integrates the advantages of the Adam optimizer with weight decay techniques, detection algorithms can achieve superior convergence rates and model generalization. AdamW is an extension of the Adam optimizer commonly used for training neural networks [22]. It directly incorporates weight decay into its formulation improving generalization by preventing excessive weight growth. This modification helps control model complexity and enhances training stability.
Accordingly, by introducing EfficientNet-V1-B4 Architecture and AdamW in medical imaging analysis, healthcare professionals can expect improved diagnostic accuracy, faster processing times, and enhanced decision-making capabilities, ultimately leading to better patient outcomes and more effective treatment plans.
The contributions of this study are as follows:
1. A multi-class medical diagnosis system was developed to describe the accumulation of fluid in the lungs from perspective of image processing. Thus, the system categorizes three patterns using chest X-ray images including pleural effusion, pulmonary edema, and normal cases.
2. The utilization of the EfficientNet-V1-B4 architecture associated with the AdamW optimizer in the context of pulmonary edema and pleural effusion detection from chest X-ray images represents a novel application and exploration of deep learning models for medical image analysis.
3. The localization of pleural effusion and pulmonary edema diseases is accomplished by utilizing the ablation-CAM technique and is graphically presented using heatmap data visualization.
By automating this classification process, medical professionals can save valuable time by achieving early diagnosis while ensuring more accurate diagnoses. The remainder of this paper is organized as follows. The related work is presented in Section 2. Section 3 describes the research methodology. The empirical results are analyzed and discussed in Section 4. The conclusions of this research and future work are presented in Section 5.
Fluid accumulation in the lungs is a life-threatening medical emergency that requires timely diagnosis and intervention and is known as pulmonary edema. Traditional methods for detecting pulmonary edema in medical imaging have limitations, leading to the demand for more accurate and efficient approaches. The promising results of artificial intelligence in various medical fields, including the detection of pulmonary edema, have encouraged the development of advanced methodologies. One major challenge hindering the advancement of CNNs in medical image analysis is the necessity of constructing ground-truth data based on specialists’ opinions.
Deep CNNs have been applied in research [23–27] to classify different types of radiographs, such as X-rays, CT scans, and ultrasounds. CNNs are used to diagnose various diseases, such as pulmonary edema, pulmonary effusion, pneumonia, COVID-19, and pneumothorax. Despite demonstrating promise for radiographic interpretation, these early studies generally lacked the level of specificity and granularity required for practical diagnostic utility.
Based on the expansion of using Artificial Intelligence (AI) in detecting diseases, Wang et al. [28] compared several deep learning techniques for diagnosing pulmonary edema and estimating the severity of the case, and the dataset used was MIMIC-CXR for images and reports [29]. According to previous studies [30,31], there are approximately 77% accuracy among radiologists and 59% accuracy among ED physicians. Edema severity was classified in 3058 cases as mild, 1414 moderate cases, and severe in 296 cases.
2.1 Related Studies on CNN-Based Detection of Pulmonary Edema
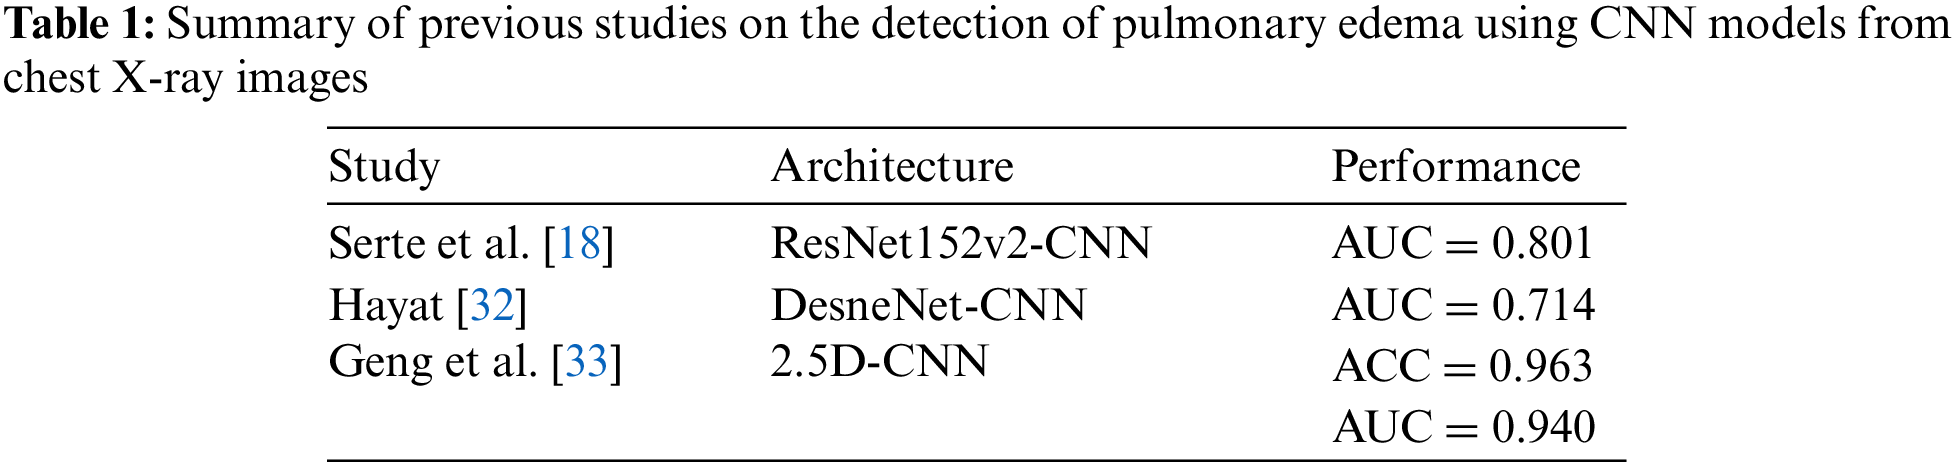
Serte et al. [18] studied pulmonary edema disease as a result of heart failure depending on chest radiographs. Researchers constructed a dataset of 27,748 front-chest radiographs over nearly six years. The collected images were in the range of 1.4–4.7 k in height and width with 80% training set, 10% validation, and a test group of 10%. Training was carried out in two stages (pipelines) to train a branched CNN based on ResNet152v2 architecture. The goal is to cooperatively predict B-type Natriuretic Peptide (BNP) or BNPP (BNP precursor) cases. With a preset learning rate of 1e-5 and a patch size of 16, Adam’s optimizer was used to train all CNNs. The region of attention was determined using a heatmap. Another factor that is considered is the blur sensitivity. Consequently, the trained models attained an AUC of 0.801 for the detection of pulmonary edema.
In [32], a 2.5D CNN model was developed to detect multiple diseases, such as: atelectasis, pneumonia, edema, and nodules. The study investigated 5000 CT images that contained 156 edema cases, 225 pneumonia cases, and other cases. The research split the image set for each disease into training, validation, and test sets. The model achieved accuracies of 0.963, 0.818, 0.878, and 0.784, for edema, atelectasis, pneumonia, and nodule, respectively. Moreover, AUC of 0.940, 0.891, 0.869, and 0.784 were obtained for categorizing edema, atelectasis, pneumonia, and nodule diseases, respectively.
In [33], a 2.5D CNN model was developed to detect multiple diseases, that are: atelectasis, pneumonia, edema, and nodules. The study investigated 5000 CT images that contained 156 edema cases, 225 pneumonia cases, and other cases. The research split the image set for each disease into training, validation, and test sets. As a result, the model achieved an accuracy of 0.963, 0.818, 0.878, and 0.784, for edema, atelectasis, pneumonia, and nodule, respectively. Moreover, The AUC of 0.940, 0.891, 0.869, and 0.784 were attained for categorizing edema, atelectasis, pneumonia, and nodule diseases, respectively. As shown in Table 1, a summary of previous studies on the detection of pulmonary edema using CNN models from chest X-ray images is provided.
2.2 Related Studies on CNN-Based Detection of Pleural Effusion
Previous studies in the domain of pleural effusion detection have explored various approaches and architectures to improve the accuracy and efficiency of diagnostic systems. With the aim of automating Lung Ultrasound (LUS) image evaluation for pleural effusion detection, Hammon et al. [30] employed a deep-learning model that was constructed based on the Regularized Spatial Transformer Network (Reg-STN) architecture to perform binary classification of pleural effusion in clinical LUS imaging. The dataset, obtained from the Royal Melbourne Hospital, consisted of 623 videos containing 99,209 2D LUS images obtained from examinations of 70 patients using a phased array transducer. This model was trained using weakly supervised and supervised methodologies utilizing a video-based labeling approach, resulting in an accuracy of 91.1%, and a frame-based labeling approach, resulting in an accuracy of 92.4%. Notably, the reference was proficient clinicians who assessed the interpretation of images.
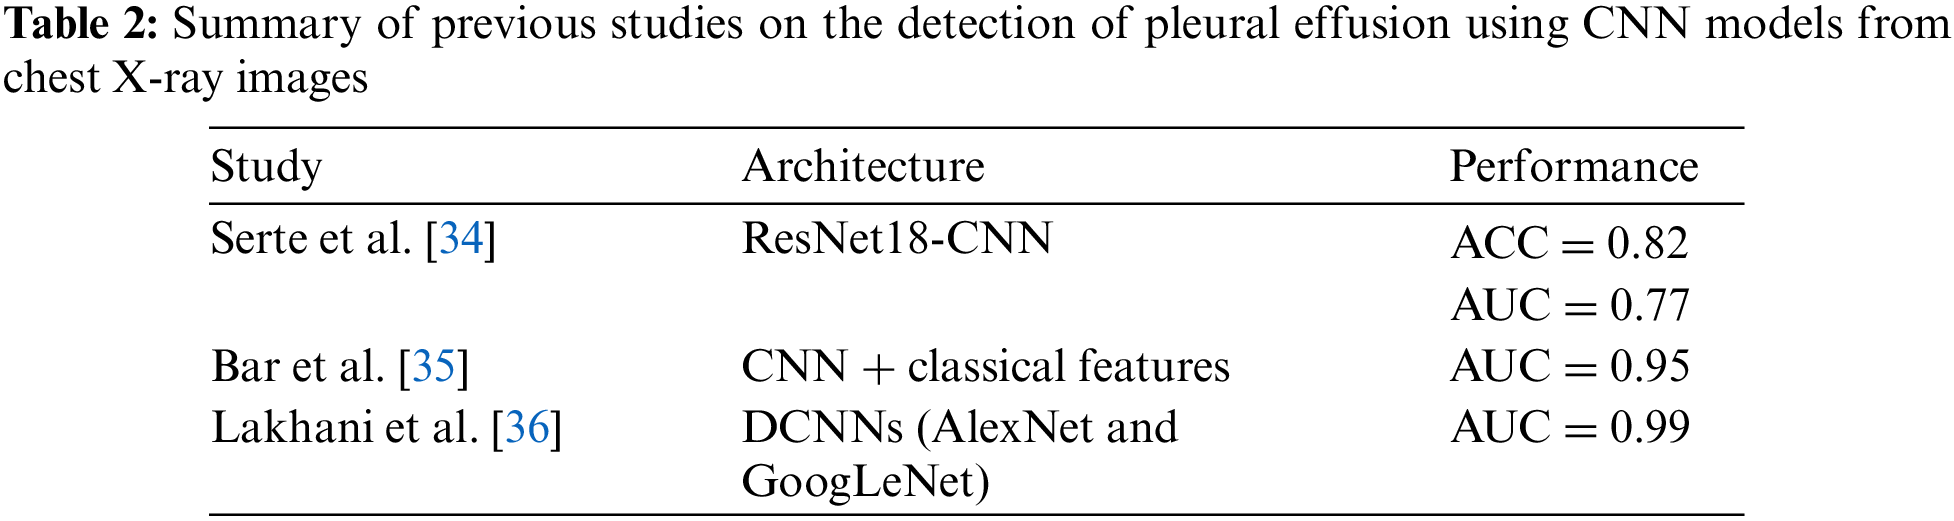
Researchers in [34] applied a deep learning model based on the ResNet18 architecture to the chest radiography images. The model was applied to identify pleural effusion arising from three types of respiratory disorders, namely tuberculosis, COVID-19, and pneumonia. Hence, the developed system can detect these three diseases once they occur at an early stage before evolving into pleural effusion. Three experiments were conducted for binary classification. Consequently, the performance in terms of accuracy for early detection of pleural effusion disease from tuberculosis, COVID-19, and pneumonia was 99%, 100%, and 75%, respectively. In contrast, a multiclass experiment was applied, which included the following categories: tuberculosis, COVID-19, pleural effusion, bacterial pneumonia, and viral pneumonia. Thus, the best result was obtained for bacterial pneumonia detection, with an accuracy of 83% and an AUC of 81%. Furthermore, the multiclass system detected pleural effusion with an accuracy of 82% and AUC of 77%.
In a study by Bar et al. [35], the identification of various pathologies, such as right pleural effusion, from chest radiographs was investigated. Their analysis utilized a CNN trained on non-medical data, achieving an AUC of 0.95. Lakhani et al. [36] explored deep-learning approaches for tuberculosis detection on chest radiographs containing pleural effusion, miliary patterns, and cavitation, and achieved an impressive AUC of 0.99. As shown in Table 2, a summary of previous studies on the detection of pleural effusion using CNN models from chest X-ray images is provided.
As essential as it is in practice, this study developed an AI system to detect fluid buildup in the lungs by categorizing three patterns using chest X-ray images including pleural effusion disease, pulmonary edema disease, and normal cases as illustrated in Fig. 2. The proposed computer vision-based medical classification system encompassed various stages including Data Preprocessing, Build and Training Model (learning), and Model Output (testing). Fig. 2 illustrates the research methodology. From this perspective, chest X-ray images will pass through a preprocessing stage before being fed into the training model. Furthermore, the output of the system includes class activation mapping and the category to which each test image belongs.
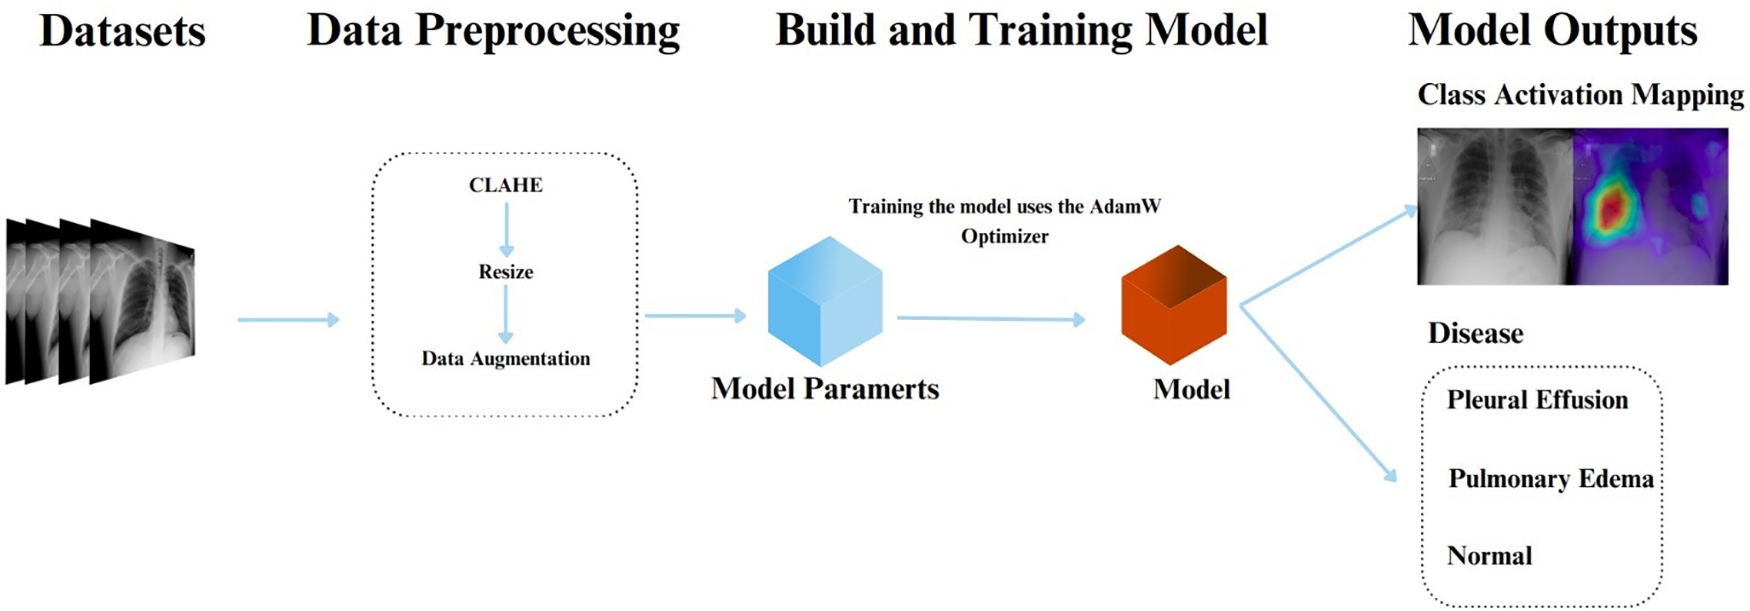
Figure 2: The research methodology
With the aim of conducting a classification task to reveal the presence or absence of pleural effusion and pulmonary edema disorders in the lungs using X-ray images, a new dataset of 28,309 samples was formed by combining several public datasets, including ChestX-ray14 [37], PadChest [38], and CheXpert [39]. The new dataset under consideration was distributed among three classes as follows: approximately 10,287 samples depicting pleural effusion, about 6022 samples representing pulmonary edema, and 12,000 samples exhibiting normal cases.
During this stage, a stratified split of the medical image dataset was conducted, with 85% allocated to the training set and 15% to the test set. Thus, the training and test sets are independent. This stratification was aimed at maintaining a consistent distribution of classes across both the training and test sets. Particularly, pixel normalization was excluded from the preprocessing steps, as empirical evidence suggests its unnecessary approach in certain medical image classification tasks [40].
To achieve the computer vision classification goal, the image data should be handled properly before reaching the input layer of the model. For the application at hand, a dedicated pipeline was employed on the image data by conducting three sequential steps, as illustrated in Fig. 3. First, enhancing the contrast of the chest X-ray images was enhanced using the CLAHE approach. Second, all images were resized to 380 × 380 pixels. Lastly, multiple data augmentation techniques were employed.
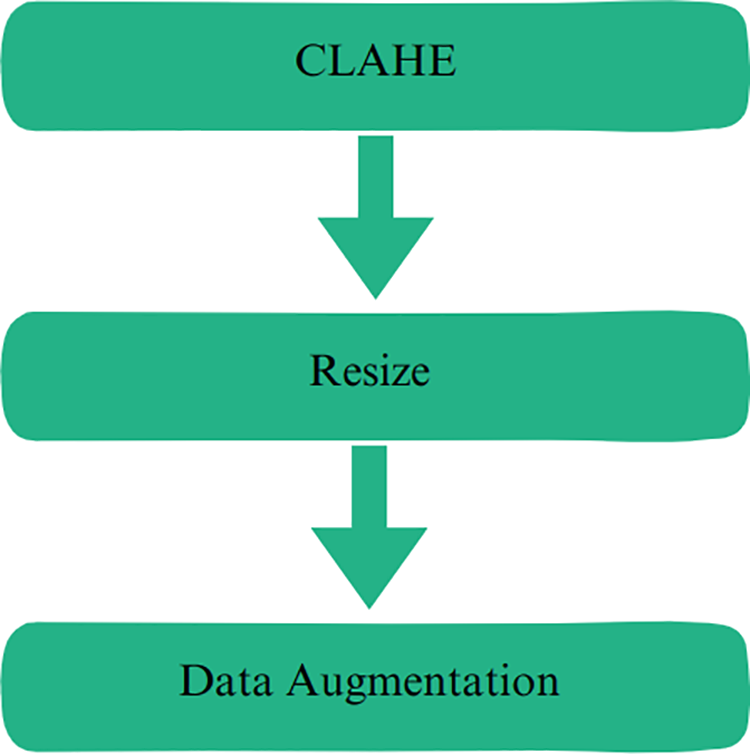
Figure 3: Preprocessing steps
The CLAHE technique has been used in various image processing applications because of its capability to enhance image contrast by partitioning the image into small blocks and equalizing the histogram of each block. This method also mitigates contrast amplification within each block, thus minimizing noise amplification [41]. It serves to improve image contrast, facilitates better visibility and interpretation, and is adept at enhancing image details [42]. Fig. 4a shows the original X-ray image selected from the data under consideration. Conversely, Fig. 4b illustrates the enhanced X-ray image after employing the CLAHE technique, which demonstrates the contrast improvement compared to the original X-ray image proving the effectiveness of applying CLAHE in rendering certain lung details more discriminant.
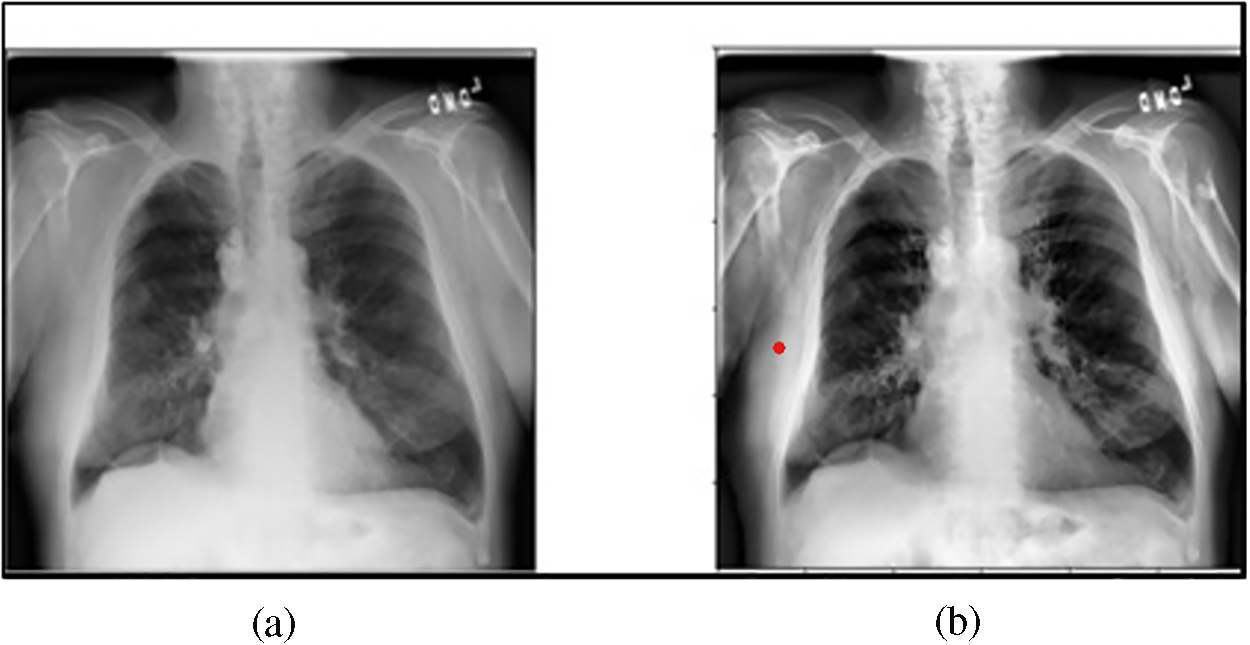
Figure 4: (a) The original X-ray image; (b) The enhanced X-ray image after employing CLAHE
Determining the image size for training CNN is important when considering the trade-offs between accuracy, speed, and memory requirements [43]. Larger image sizes typically exhibt better accuracy, but they also require more computation and memory [44]. Additionally, the benefits of using larger images tend to diminish as the size increases [45].
CNNs frequently downsample the dimensions of an input image, resulting in an irregular final size [46]. To avoid this, it is advisable to employ a square image size during the training phase [47]. In our approach, we resized all images to 380 × 380 pixels, maintaining the original aspect ratio and implementing zero-padding as needed.
To improve the performance of the deep learning model and promote its capacity for generalization, a data-augmentation approach was employed. Data augmentation involves integrating subtly modified versions of current data or generating synthetic data based on existing samples, thereby expanding the effective dataset size. For this purpose, a total of six augmentation methods were adopted, including: CutMix [48], MixUp [49], CenterCrop, RandomChannelShift [50], RandomGaussianBlur [51], and Random Brightness [50] transformations during the training process, aiming to improve the robustness of the model.
Attaining superior performance for image categorization necessitates not only creating a superb architecture but also selecting an appropriate optimizer that can significantly minimize the loss function. Thus, this study presents a deep learning model that was constructed based on the EfficientNet-V1-B4 architecture along with the AdamW optimizer that was utilized for training this model.
3.3.1 EfficientNet-V1-B4 Architecture
The EfficientNet-V1 architecture was introduced by Tan and Le in 2019 [20] in which a novel compound scaling approach was proposed. In this view, the EfficientNet-V1 model uses R to uniformly scale all the dimensions of the network including the width, depth, and resolution. Thus, the scaling method of the model is mathematically described as follows [20]:
where the coefficients
Therefore, it can be straightforward to increase the dimensions of the network by (R) if there is a need to use
Furthermore, there are eight variations of EfficientNet-V1, referred to as EfficientNet-V1-B0 through EfficientNet-V1-B7. This study employs EfficientNet-V1-B4. Fig. 5 depicts the details of the EfficientNet-V1-B4 architecture considered in this study. The architecture of EfficientNet-V1-B4 is segmented into seven blocks, called Mobile Inverted Bottleneck Convolution (MBConv), which are the elementary building blocks of EfficientNet-V1-B4, followed by a fully connected layer. For a particular stage
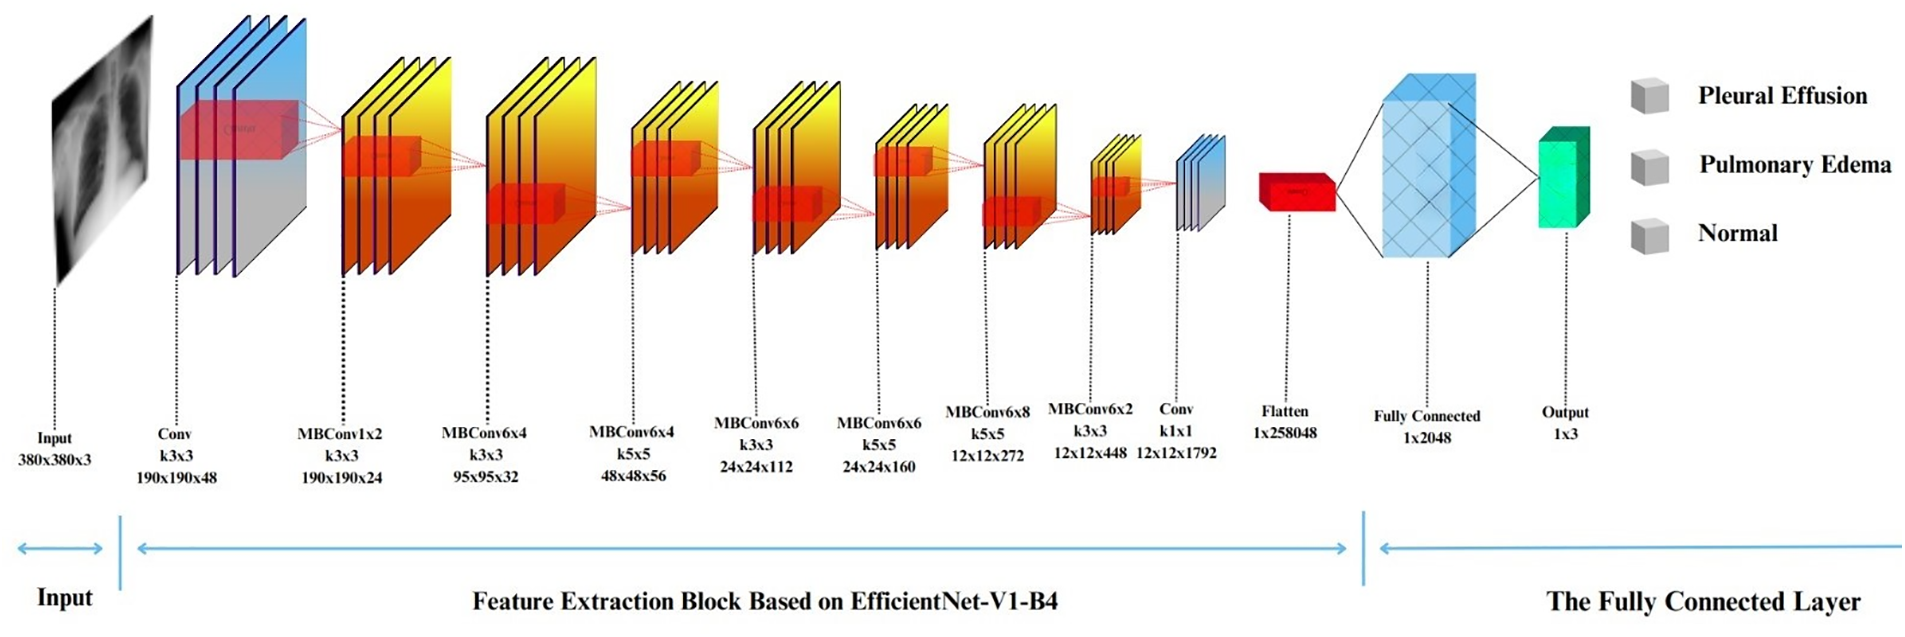
Figure 5: The EfficientNet-V1-B4 architecture
Lastly, the input resolution
In this study, the optimal performance was pursued by fine-tuning the pre-trained weights of EfficientNet-V1-B4 using Noisy Student data. Subsequently, a fully connected layer with three neurons was used to represent the class scores (i.e., the output layer).
Furthermore, the MBConvX blocks utilize the Swish activation function and squeeze-and-excitation (SE) optimization which enables the efficient extraction of high-quality features, and minimize computational complexity while maximizing accuracy. Additionally, MBConv’s lightweight design extracts informative features from early stages, while SE dynamically refines them, resulting in sharper detections and improved accuracy compared to traditional Convolutional Neural Networks. Fig. 6a illustrates MBConv1, while Fig. 6b presents MBConv6, both representing distinct design points in the EfficientNet-V1-B4 architecture. MBConv1 emphasizes early feature extraction with minimal computational cost, making it particularly well-suited for the initial stages of the network. By contrast, MBConv6 concentrates on advanced feature refinement, achieving heightened accuracy although with a modest increase in complexity. The deliberate utilization of MBConvX variants in this manner enables EfficientNet-V1-B4 to achieve a balance between efficiency and accuracy.
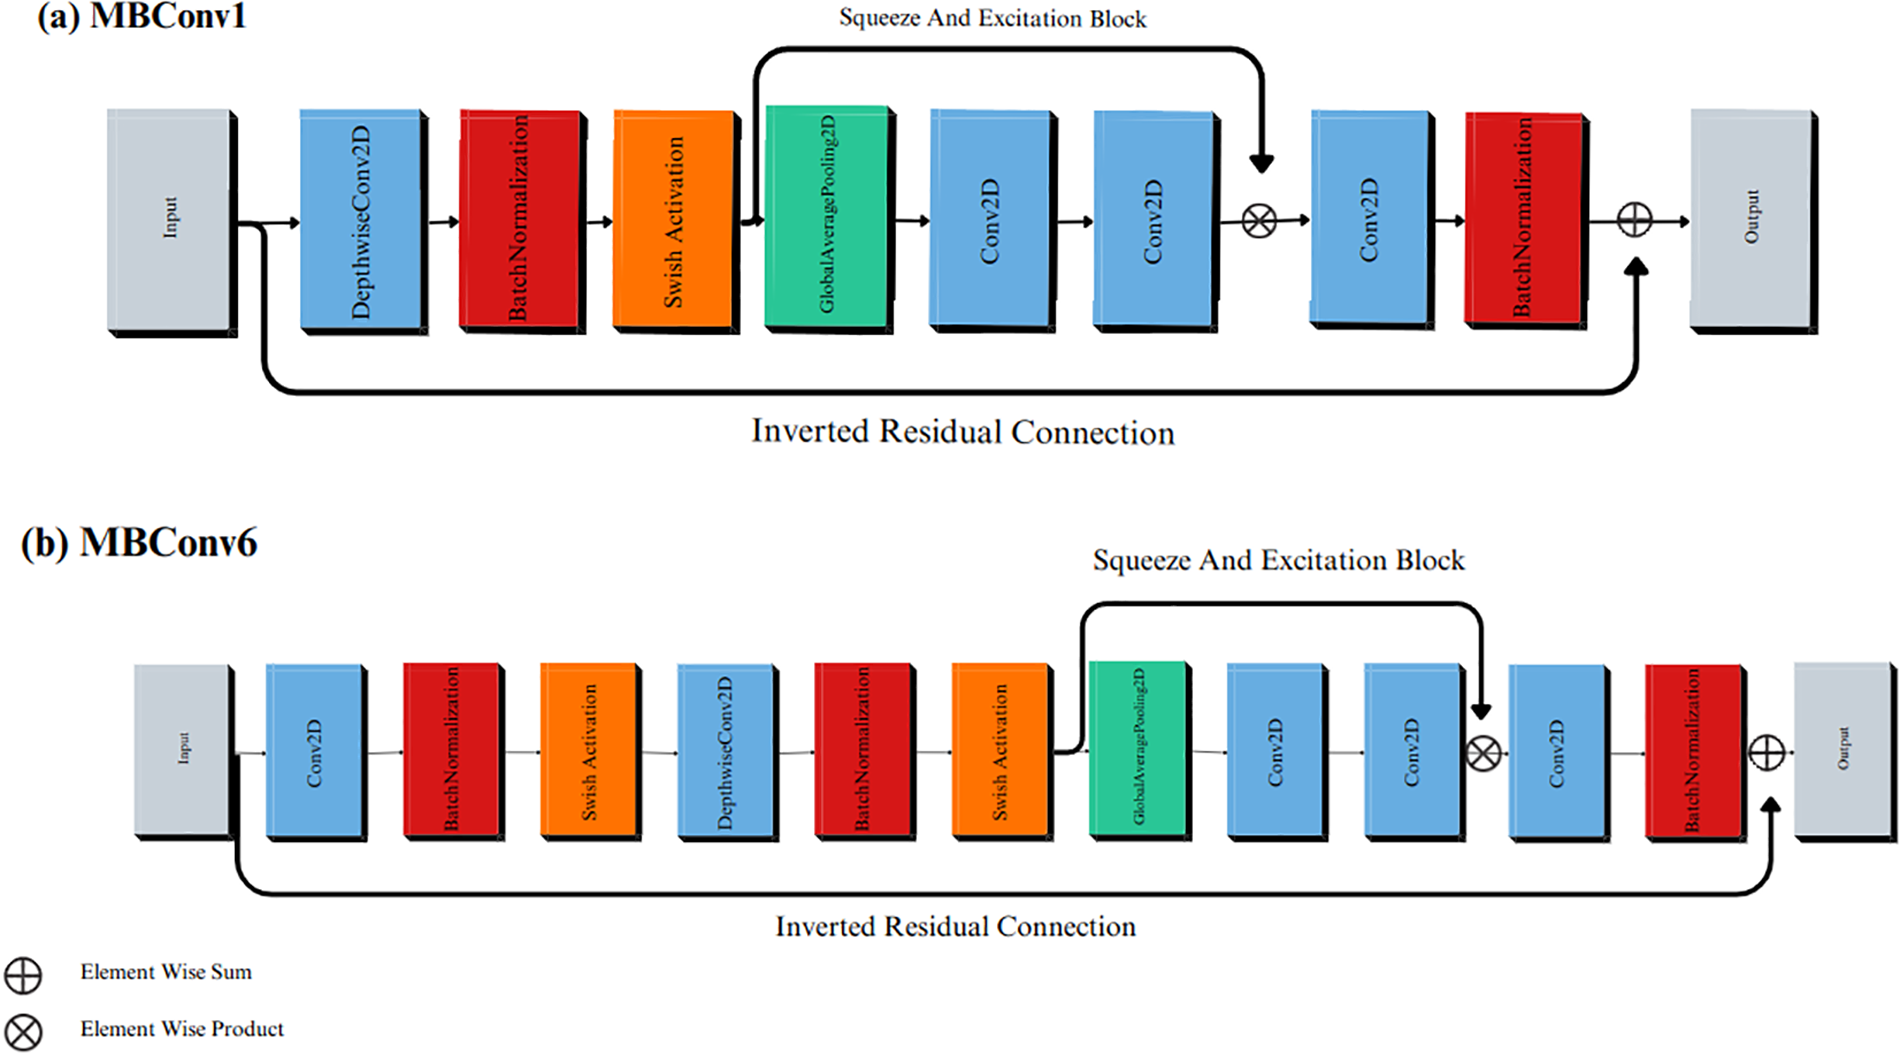
Figure 6: The MBConv blocks in the EfficientNet-V1-B4 architecture. (a) MBConv1; (b) MBConv6
An AdamW optimizer was used to train the model. The AdamW optimizer is an extension of the Adam optimizer with the addition of a weight decay regularization approach [22]. Furthermore, weight decay serves as a method to mitigate overfitting by imposing penalties on substantial weights.
Accordingly, the Adam optimizer exhibited comparatively reduced efficiency in weight regularization when compared to alternative optimizers, such as SGD with momentum. However, AdamW disentangles the weight decay from the adaptive estimation of the first and second moments of the gradients. This decoupling empowers AdamW to enhance the weight regularization more efficiently without compromising the speed of convergence.
In this section, the experimental settings, and results for the dataset under consideration are illustrated. The performance of the classification model was evaluated based on complexity and different metrics including accuracy (A), precision (P), recall (R), and F1-score. Finally, Ablation-based Class Activation Mapping (Ablation CAM) was employed to provide meaningful and interpretable explanations of the results.
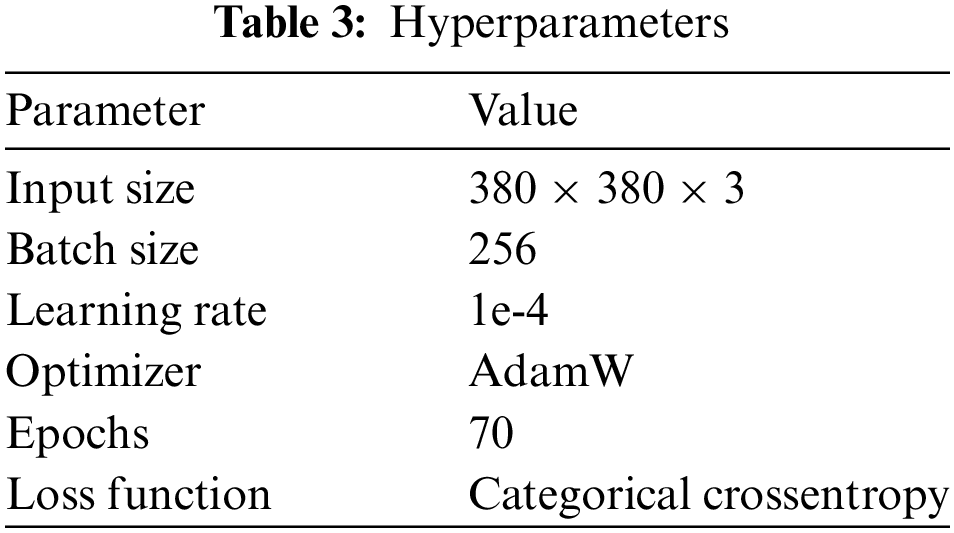
In this study, TPU 3-8 was utilized to train the network. Subsequently, the training and testing phases occurred within the same environment, employing the Keras deep learning framework and Python 3.8 as the programming language. Network training involved the utilization of the hyperparameters outlined in Table 3.
The computational complexity of a CNN is an important consideration for its practical deployment and can be analyzed along two dimensions which are spatial and temporal [52]. The spatial complexity (SC) indicates the storage requirements (i.e., disk space) of a trained CNN model, including both its parameters and intermediate feature maps. The temporal complexity (TC) reflects the computational cost, commonly measured in floating-point operations per second (FLOPS), required for the CNN to make predictions. For the proposed CNN model evaluated in this study, we obtained SC of 243 MB and TC of 4.51 GigaFLOPS. These values can be used to assess the resource requirements and inference speed of a model in real-world applications.
4.3 Classification Performance Evaluation
The performance evaluation of the proposed model on the test set relies on the utilization of a confusion matrix. The accurate determination of this matrix requires knowledge of the true values associated with the validation data. As illustrated in Fig. 7, the confusion matrix was implemented to evaluate the performance of the model. In this view, multiple measures were computed including P, R, A, and F-1, utilizing the predetermined methods described in previous research [53]. The formulations for these evaluation measures are detailed in Eqs. (2) through (5).
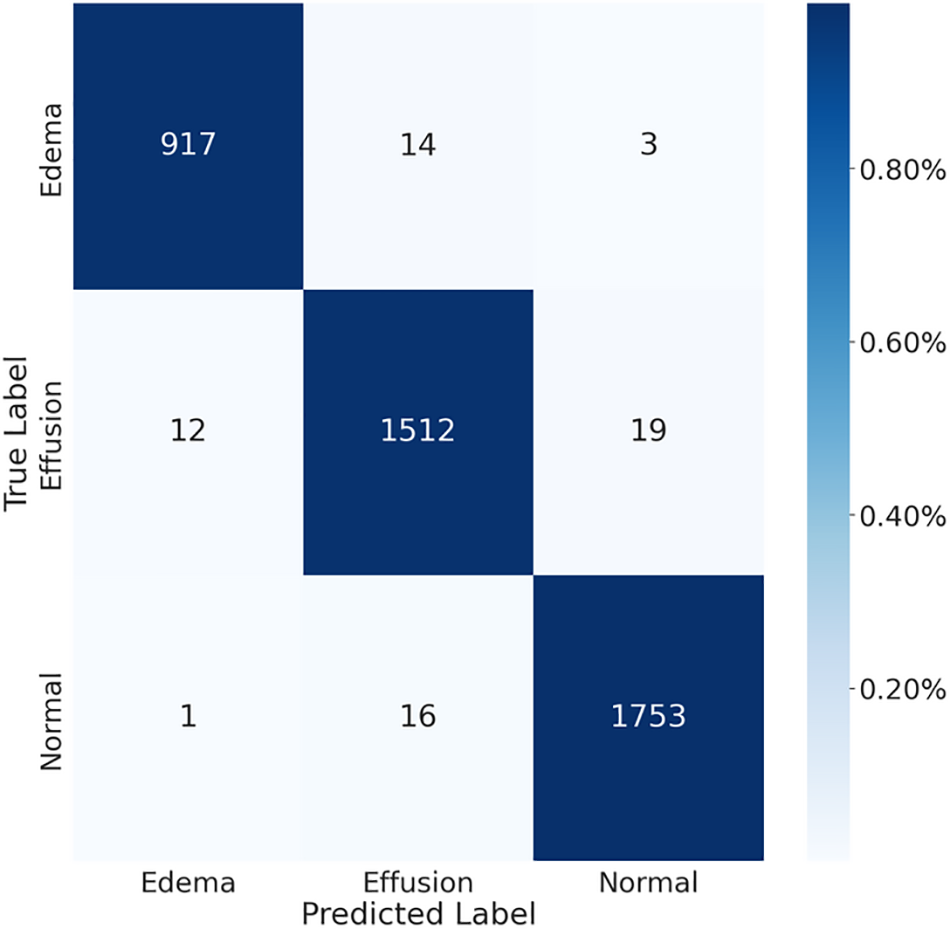
Figure 7: The confusion matrix for chest X-ray images
Specifically, the TP represents True Positives, denoting correctly identified positive instances. TN represents True Negatives, signifying correctly identified negative instances. FP represents False Positives, indicating instances incorrectly identified as positives. FN represents False Negatives, representing instances incorrectly identified as negatives.
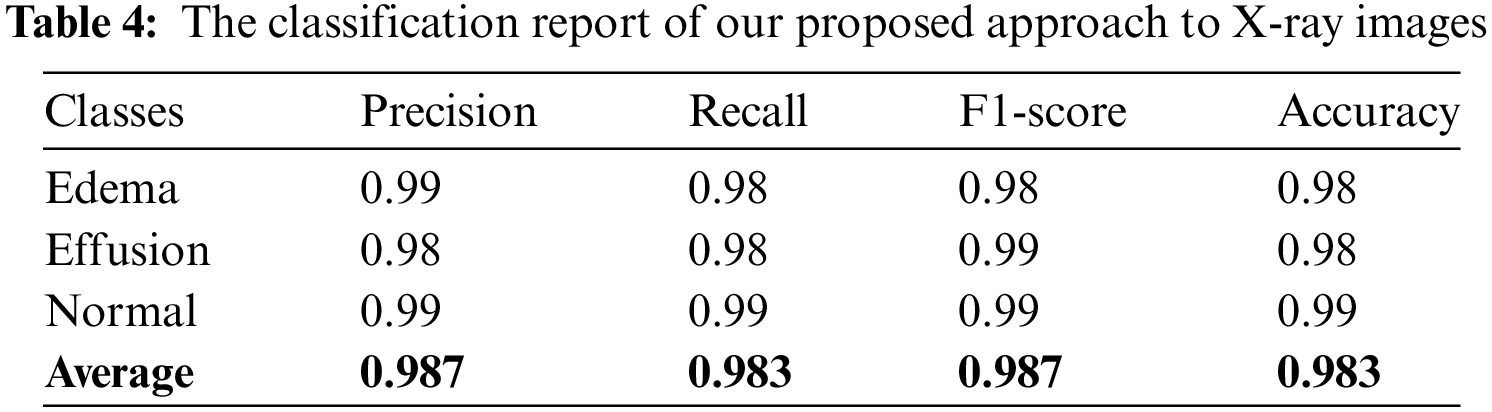
The results of the calculation of the aforementioned matrices are presented in Table 4, which shows that the developed system classifies pleural effusion, pulmonary edema, and normal patterns with a high classification rate compared with previous studies as shown in Tables 1 and 2. According to this viewpoint, the average achieved accuracy was approximately 0.983, the average accomplished precision was approximately 0.987, the attained average recall value was roughly 0.983, and the average F-1 was score approximately 0.987. These findings confirm that the classification system is precise and robust in identifying pleural effusion and pulmonary edema disorders using X-ray images.
Finally, we confirmed a comprehensive evaluation of the model’s performance across various sensitivity and specificity thresholds. The ROC curve tool was used specifically to analyze three medical classes: pulmonary edema, pleural effusion, and normal cases using the dataset of X-ray images under consideration in this study, as represented in Fig. 8. The results revealed that the AUC was 1.00 for pulmonary edema and normal cases. Additionally, the AUC was 0.99 for pleural effusion disease. These ROC evaluations confirmed the robustness of the developed categorization system that differentiated between pulmonary edema, pleural effusion, and normal cases, thus providing valuable insights into its diagnostic capabilities.
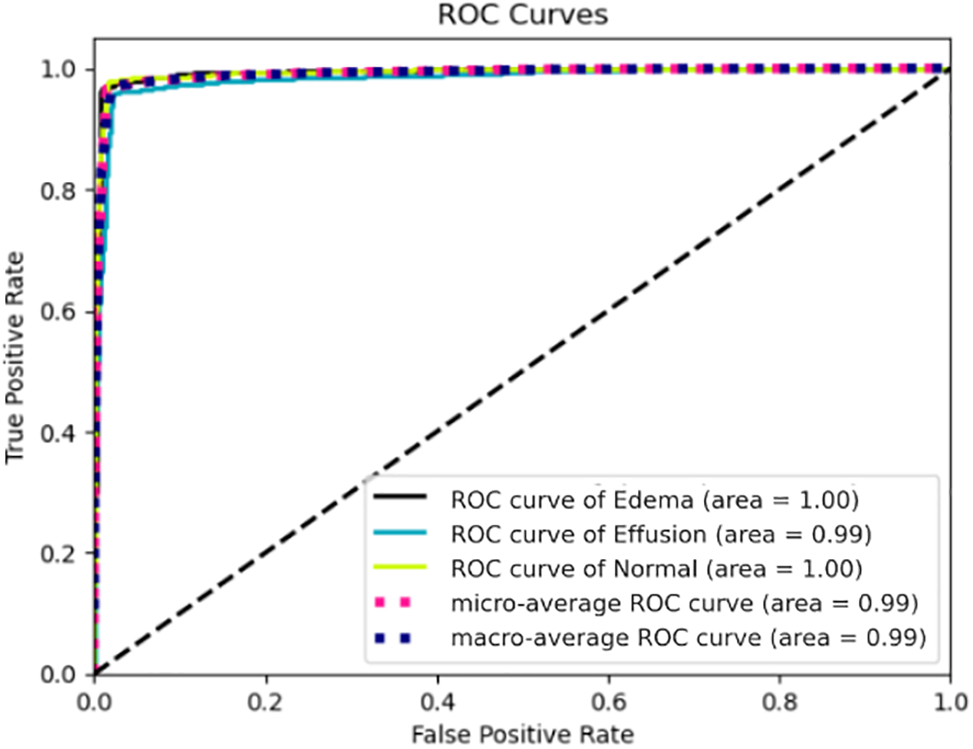
Figure 8: ROC curves for pulmonary edema, pleural effusion, and normal cases using chest X-rays
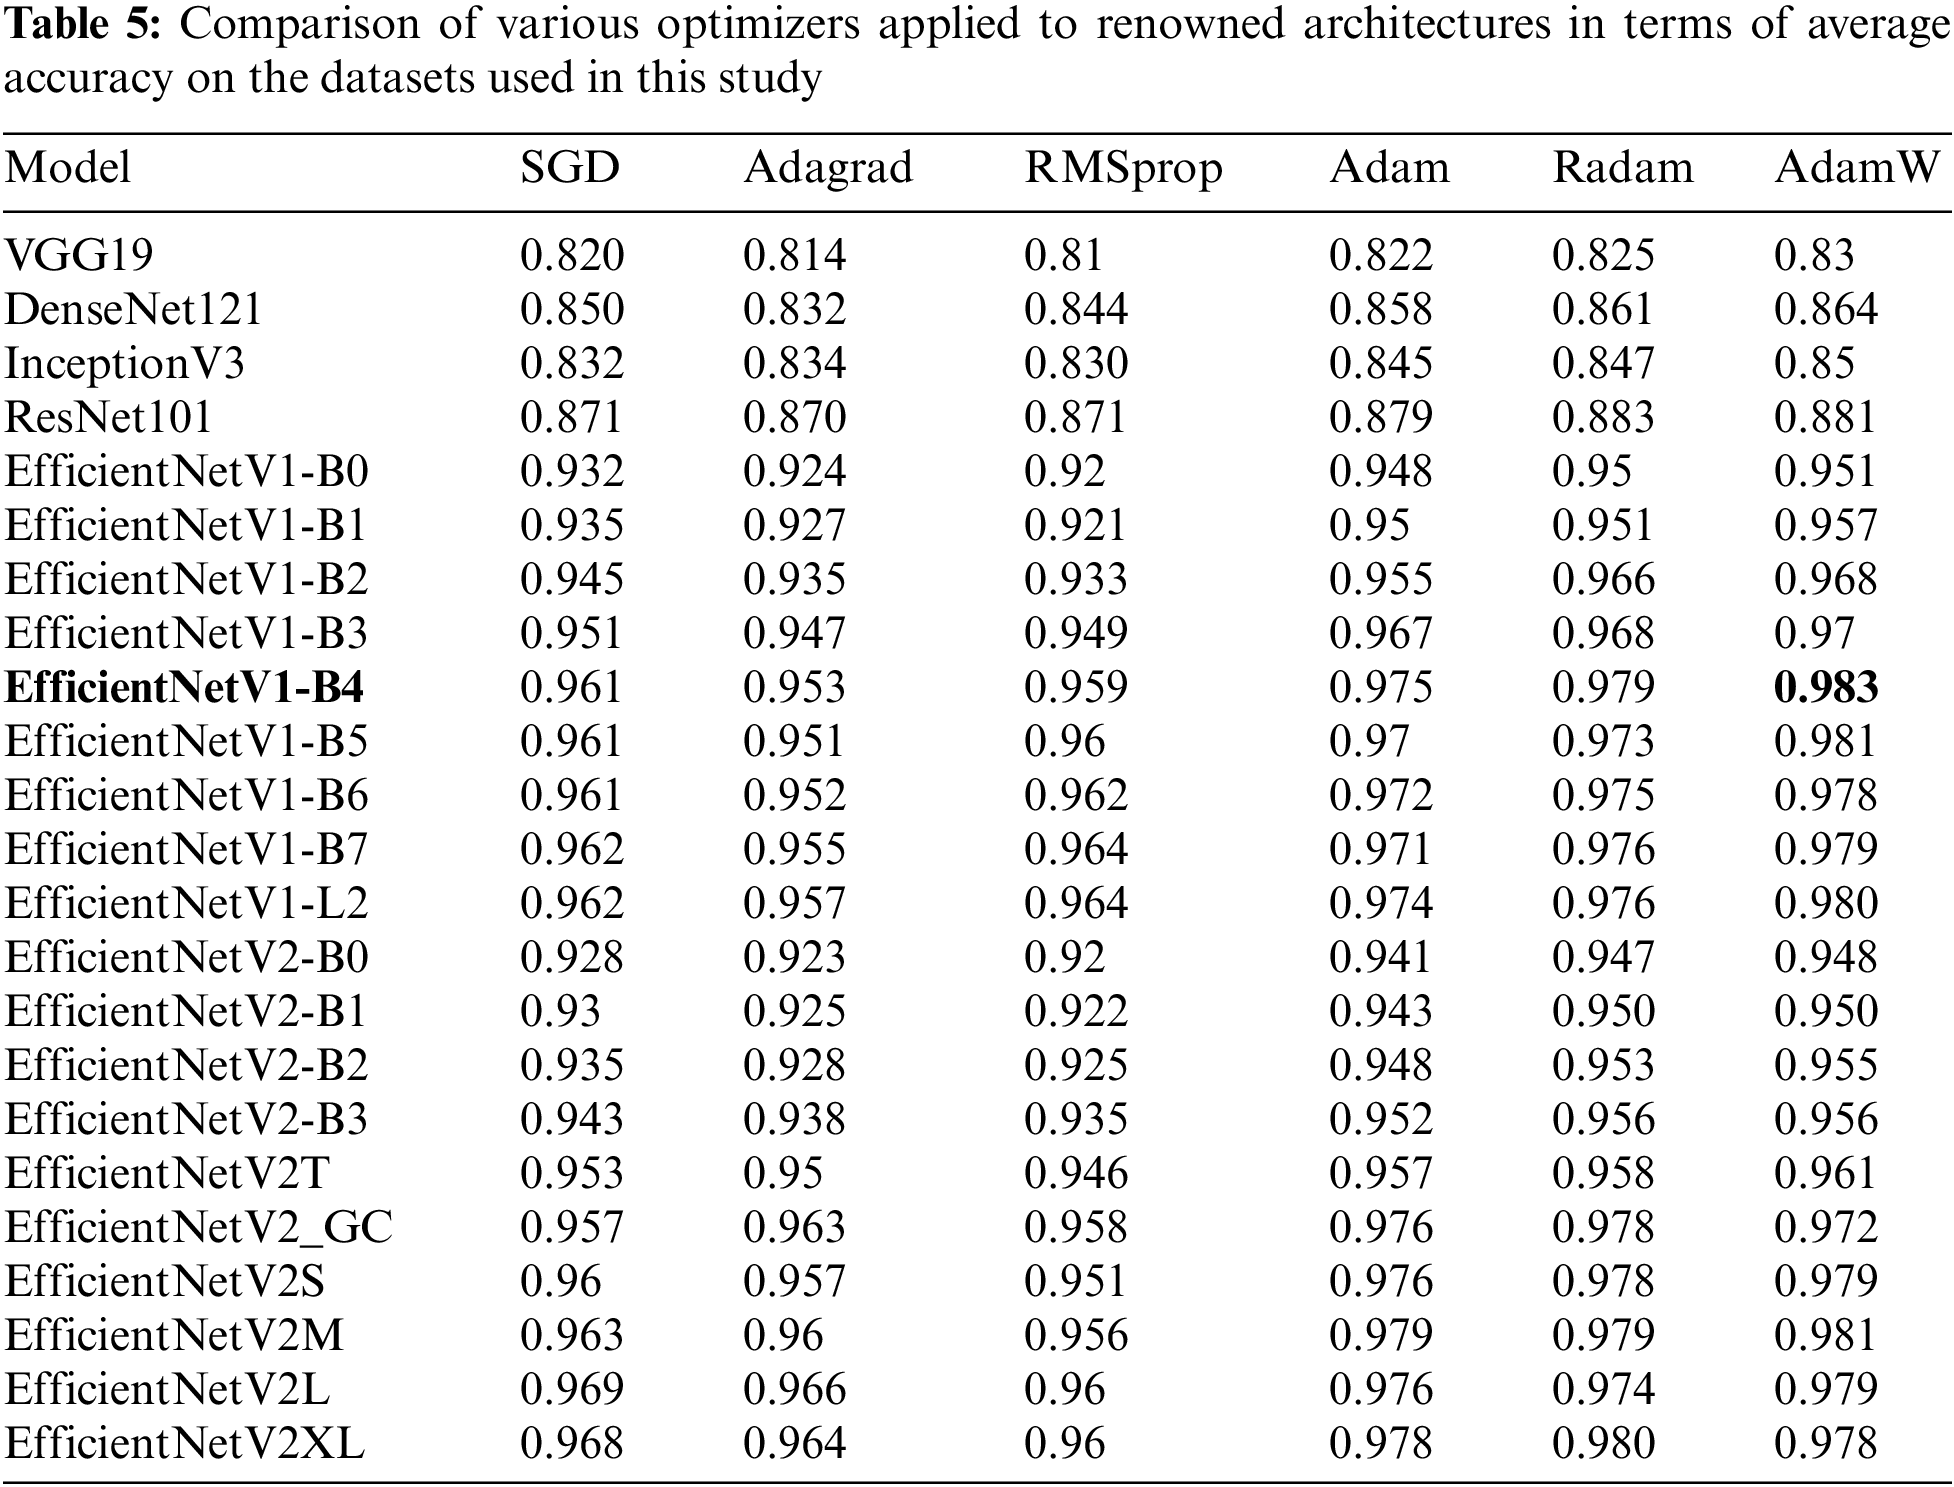
This work proves the effectiveness of the proposed neural network architecture combined with the AdamW optimizer for the detection of Pulmonary Edema and Pleural Effusion diseases. The results were compared with well-known classification architectures such as VGG19, DenseNet121, InceptionV3, EfficientNet, and ResNet101. Hence, the average accuracy of these architecture models was assessed using various training-based optimizers including SGD, Adagrad, RMSprop, Adam, Radam, and AdamW. Table 5 compares the aforementioned optimizers and architectures. As a result, the proposed model achieved the highest average accuracy of 0.983 when employing the AdamW optimizer across EfficientNet-V1-B4 compared to the others utilizing the same datasets applied in this study.
4.4 Localization Using Ablation-CAM
In the context of medical image classification using deep learning, it is imperative to enhance the interpretability and significance of the results. Ablation-CAM emerged as a gradient-free methodology designed to provide visual explanations for models based on deep CNNs [54]. This technique operates by selectively ablating (removing) individual units within feature maps and measuring the subsequent drop in the activation score for the target class. The significance of each feature map unit was then quantified as the proportion of decrease in the activation score.
To generate the ablation-CAM map, feature map units are weighted based on their calculated importance and superimposed onto the original image. The outcome is a coarse localization map that accentuates the pivotal regions in the image, thereby influencing the model’s concept predictions.
Notably, ablation-CAM exhibits superiority over the state-of-the-art Grad-CAM technique across diverse image classification tasks [55]. Because ablation-CAM is more resilient to local irregularities and saturations within the neural network, it is considered an effective and robust approach to visual interpretation. To utilize this functionality, ablation-CAM was applied after the prediction of the class label by the developed classification system. Further, we visualized the effect of employing the ablation-CAM technique on X-ray test images. Fig. 9a shows the heatmap for a test image from the pulmonary edema class; Fig. 9b depicts the heatmap for a test image from the pleural effusion class; and Fig. 9c exhibits the heatmap for a test image from the normal cases class.
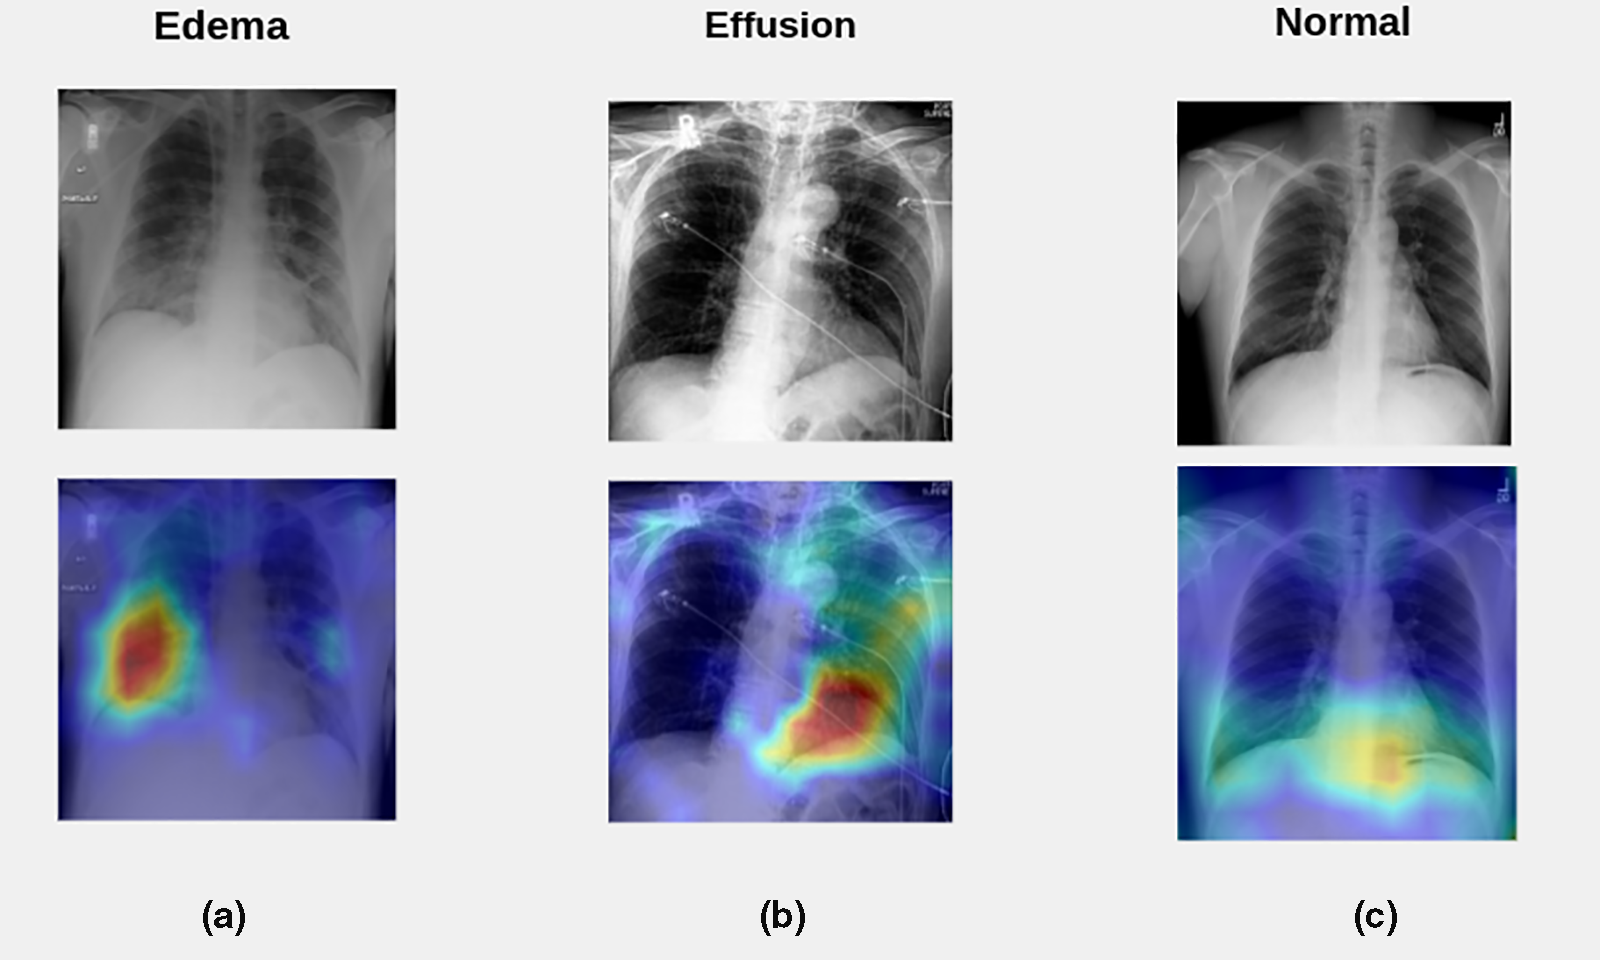
Figure 9: Visualization of the effect of employing the ablation-CAM technique on X-ray test images. (a) The heatmap for a test image from the pulmonary edema class; (b) The heatmap for a test image from the pleural effusion class; (c) The heatmap for a test image from the normal cases class
Based on radiographic differences, a normal chest X-ray (Fig. 9c) shows clear lungs at which there is no buildup in the person’s lungs and a physician can define the borders of the vessels very well because they appear sharp and demarcated. Moreover, the vessels in the upper lung were relatively smaller than the vessels in the lower lungs of a person with a healthy lung. Besides, the pleural cavity typically contains approximately 15 ml of pleural fluid.
In contrast, increased hydrostatic pressure leads to pulmonary vascular congestion and cephalization of the pulmonary vasculature. This case is not yet edema because the fluid is still in the pulmonary vessels. Consequently, once the fluid leaves the pulmonary vessels and enters the interstitial space, the patient will develop interstitial pulmonary edema (actual edema). Subsequently, the fluid spills into the alveolar space in which the patient will get alveolar pulmonary edema (airspace edema). The appearance of edema was heterogeneous with interstitial and airspace edema. Hence, if a patient develops pulmonary edema, there may be two signs. First, the upper lungs are much more indistinct which means that the edema fluid has moved from the vessels to the interstitial space, and the vessels seem to be more enlarged and not well-defined. The other sign is, that the patient has interlobular septal thickening, which is manifested by Kerley B lines, which are typically less than 1 cm in length at the lung periphery and represent fluid in the interstitial space (Fig. 9a).
On the contrary, pleural effusion is excess fluid that accumulates between two layers of the plural including the parietal pleura and visceral pleura. Because the lungs are always in motion, there must be some fluid between the two layers of the pleura to protect them from injury by friction. Furthermore, pleural effusion is the result of any process that causes more fluid to develop than it can be absorbed (>15 ml in the pleural cavity). Typically, the area that is the first to present plural effusion is the right and left costophrenic angle. This is because the fluid is heavier than the lung and it must fall towards gravity. In the normal case (Fig. 9c), the appearance of both costophrenic angles was clear and sharp. In contrast, left-sided pleural effusion is present in Fig. 9b, because the left costophrenic angle is blunt and is not visible due to the high fluid level.
Lastly, based on the abovementioned analysis of X-rays for normal cases, pulmonary edema disease, and pleural effusion disease, it is obvious that employing the ablation-CAM technique on X-ray test images provides meaningful insight into the chest X-rays of the target medical application.
There is a growing need to promote the advancement of medical image classification systems that demonstrate superior performance in diagnosing diseases within the field of pathology. Therefore, this study incorporated a deep learning model based on the EfficientNet-V1-B4 architecture with the training-based AdamW optimization method. Consequently, the developed system operated on chest X-ray, which required passing through a preprocessing stage before being fed into the training model. The preprocessing stage involves enhancing the contrast of the chest X-ray images using the CLAHE approach, resizing images to 380 × 380 resolution, and applying the data augmentation process.
To carry out the classification task, a new dataset of 28,309 samples was formed by combining several publicly available datasets. This dataset comprised three patterns: pleural effusion, pulmonary edema, and normal cases. Further, the dataset was divided into 85% samples for training the model and 15% samples for testing the model. The results show that the developed system achieved a classification rate of approximately 0.983. In addition, the achieved AUC was 1.00 for pulmonary edema and normal cases, and the obtained AUC for pleural effusion disease was approximately 0.99. Additionally, the categorization system utilizes ablation-CAM which provides meaningful insight into the chest X-rays of the target medical application.
In summary, early and accurate detection of pulmonary conditions such as edema and effusion can significantly influence patient outcomes. This study has the potential to revolutionize the detection of pulmonary edema and pleural effusion, leading to improvements in patient care, healthcare efficiency, and accessibility of advanced diagnostic tools. In line with this, the study may contribute to reducing the workload of radiologists and healthcare providers. Automating the initial screening and diagnosis process can allow specialists to focus on more complex cases and patient care, thereby enhancing the overall healthcare efficiency.
Future work should focus on further validating the suitability of the model under consideration in this research to identify other diagnoses using larger and more diverse datasets. Further research can be conducted using the EffiecientNet-V2 model and examining its performance on smaller X-ray image sizes to reduce memory usage for the image classification problem under investigation.
Acknowledgement: We sincerely thank the editorial board and reviewers of the CMC Journal for their valuable feedback and insightful suggestions, which have significantly enhanced the quality of this manuscript.
Funding Statement: The authors received no specific funding for this study.
Author Contributions: The authors confirm contribution to the paper as follows: study conception and design: Anas AbuKaraki, Khalid Alemerien; data collection: Malek Zakarya Alksasbeh; analysis and interpretation of results: Anas AbuKaraki, Malek Zakarya Alksasbeh, Sumaya Abusaleh, Hamzah Alshamaseen; draft manuscript preparation: Bilal Alqudah, Tawfi Alrawashdeh. All authors reviewed the results and approved the final version of the manuscript.
Availability of Data and Materials: Data will be made available on request.
Conflicts of Interest: The authors declare that they have no conflicts of interest to report regarding the present study.
References
1. A. A. Nasser and M. A. Akhloufi, “A review of recent advances in deep learning models for chest disease detection using radiography,” Diagnostics, vol. 13, no. 1, pp. 159, 2023. doi: 10.3390/diagnostics13010159. [Google Scholar] [PubMed] [CrossRef]
2. S. Horng, R. Liao, X. Wang, S. Dalal, P. Golland and S. J. Berkowitz, “Deep learning to quantify pulmonary edema in chest radiographs,” Radiol.: Artif. Intell., vol. 3, no. 2, pp. e190228, 2021. [Google Scholar] [PubMed]
3. J. Murray, “Pulmonary edema: pathophysiology and diagnosis,” Int. J. Tuberc. Lung Dis., vol. 15, no. 2, pp. 155–160, 2011. [Google Scholar] [PubMed]
4. C. I. Henschke, S. D. Davis, P. M. Romano, and D. F. Yankelevitz, “The pathogenesis, radiologic evaluation, and therapy of pleural effusions,” Radiol. Clin. North Am., vol. 27, no. 6, pp. 1241–1255, 1989. doi: 10.1016/S0033-8389(22)01209-X. [Google Scholar] [CrossRef]
5. Cleveland Clinic, “Pulmonary Edema,” 2024. Accessed: Jan. 5, 2024. [Online]. Available: https://my.clevelandclinic.org/health/diseases/24218-pulmonary-edema [Google Scholar]
6. St Vincent’s Hospital Lung Health, “PE (Pleural Effusion),” 2024. Accessed: Jan. 5, 2024. [Online]. Available: https://www.svhlunghealth.com.au/conditions/pleural-effusion/pe-pleural-effusion [Google Scholar]
7. S. Assaad, W. B. Kratzert, B. Shelley, M. B. Friedman, and A. Perrino Jr, “Assessment of pulmonary edema: Principles and practice,” J. Cardiothorac. Vasc. Anesth., vol. 32, no. 2, pp. 901–914, 2018. doi: 10.1053/j.jvca.2017.08.028. [Google Scholar] [PubMed] [CrossRef]
8. S. Rakshit, I. Saha, M. Wlasnowolski, U. Maulik, and D. Plewczynski, “Deep learning for detection and localization of thoracic diseases using chest X-ray imagery,” in Int. Conf. Artif. Intell. Soft Comput., Zakopane, Poland, 2019, pp. 271–282. [Google Scholar]
9. A. C. Ijiga, M. A. Igbede, C. Ukaegbu, T. I. Olatunde, F. I. Olajide and L. A. Enyejo, “Precision healthcare analytics: Integrating ML for automated image interpretation, disease detection, and prognosis prediction,” World J. Biol. Pharm. Health Sci., vol. 18, no. 1, pp. 336–354, 2024. doi: 10.30574/wjbphs.2024.18.1.0214. [Google Scholar] [CrossRef]
10. L. Liong-Rung et al., “Using artificial intelligence to establish chest X-ray image recognition model to assist crucial diagnosis in elder patients with Dyspnea,” Front. Med., vol. 9, no. 893208, pp. 1–9, 2022. doi: 10.3389/fmed.2022.893208. [Google Scholar] [PubMed] [CrossRef]
11. R. Sexauer et al., “Automated detection, segmentation, and classification of pleural effusion from computed tomography scans using machine learning,” Investig. Radiol., vol. 57, no. 8, pp. 552–559, 2022. doi: 10.1097/RLI.0000000000000869. [Google Scholar] [PubMed] [CrossRef]
12. S. Wali, Chest Sonography as an Accurate Diagnostic Tool in the Diagnosis of Patients with Respiratory Distress. Bangalore, India: Emergency Medicine, Rajiv Gandhi University of Health Sciences (India2017. [Google Scholar]
13. M. P. McBee et al., “Deep learning in radiology,” Acad. Radiol., vol. 25, no. 11, pp. 1472–1480, 2018. doi: 10.1016/j.acra.2018.02.018. [Google Scholar] [PubMed] [CrossRef]
14. M. I. Razzak, S. Naz, and A. Zaib, “Deep learning for medical image processing: Overview, challenges and the future,” Classif. BioApps: Autom. Decis. Making, vol. 26, no. 3, pp. 323–350, 2018. [Google Scholar]
15. S. M. Anwar, M. Majid, A. Qayyum, M. Awais, M. Alnowami and M. K. Khan, “Medical image analysis using convolutional neural networks: A review,” J. Med. Syst., vol. 42, no. 226, pp. 1–13, 2018. doi: 10.1007/s10916-018-1088-1. [Google Scholar] [PubMed] [CrossRef]
16. D. Schulz et al., “A deep learning model enables accurate prediction and quantification of pulmonary edema from chest X-rays,” Crit. Care, vol. 27, no. 1, pp. 201–210, 2023. doi: 10.1186/s13054-023-04426-5. [Google Scholar] [PubMed] [CrossRef]
17. J. Huynh et al., “Deep learning radiographic assessment of pulmonary edema: Optimizing clinical performance, training with serum biomarkers,” IEEE Access, vol. 10, no. 1, pp. 48577–48588, 2022. doi: 10.1109/ACCESS.2022.3172706. [Google Scholar] [CrossRef]
18. S. Serte and A. Serener, “Classification of COVID-19 and pleural effusion on chest radiographs using CNN fusion,” in Int. Conf. Innov. Intell. Syst. Appl. (INISTA), Kocaeli, Turkey, 2021, pp. 1–6. [Google Scholar]
19. M. Tan and Q. Le, “EfficientNet: Rethinking model scaling for convolutional neural networks,” in Int. Conf. Mach. Learn., California, USA, 2019, pp. 6105–6114. [Google Scholar]
20. C. Lin, P. Yang, Q. Wang, Z. Qiu, W. Lv and Z. Wang, “Efficient and accurate compound scaling for convolutional neural networks,” Neural Netw., vol. 167, no. 8, pp. 787–797, 2023. doi: 10.1016/j.neunet.2023.08.053. [Google Scholar] [PubMed] [CrossRef]
21. R. Raza et al., “Lung-EffNet: Lung cancer classification using EfficientNet from CT-scan images,” Eng. Appl. Artif. Intell., vol. 126, no. 106902, pp. 1–17, 2023. doi: 10.1016/j.engappai.2023.106902. [Google Scholar] [CrossRef]
22. I. Loshchilov and F. Hutter, “Fixing weight decay regularization in adam,” in ICLR 2018, 2018, pp. 1–4. [Google Scholar]
23. L. Wang, Z. Q. Lin, and A. Wong, “COVID-Net: A tailored deep convolutional neural network design for detection of COVID-19 cases from chest X-ray images,” Sci. Rep., vol. 10, no. 1, pp. 19549, 2020. doi: 10.1038/s41598-020-76550-z. [Google Scholar] [PubMed] [CrossRef]
24. B. Hurt, S. Kligerman, and A. Hsiao, “Deep learning localization of pneumonia: 2019 coronavirus (COVID-19) outbreak,” J. Thorac. Imaging, vol. 35, no. 3, pp. 87–89, 2020. doi: 10.1097/RTI.0000000000000512. [Google Scholar] [PubMed] [CrossRef]
25. F. Munera and J. C. Infante, “Deep learning for chest radiography in the emergency department,” Radiological, vol. 293, no. 3, pp. 581–582, 2019. doi: 10.1148/radiol.2019192079. [Google Scholar] [PubMed] [CrossRef]
26. P. Rajpurkar et al., “Deep learning for chest radiograph diagnosis: A retrospective comparison of the CheXNeXt algorithm to practicing radiologists,” PLoS Med., vol. 15, no. 11, pp. e1002686, 2018. doi: 10.1371/journal.pmed.1002686. [Google Scholar] [PubMed] [CrossRef]
27. C. H. Tsai et al., “Automatic deep learning-based pleural effusion classification in lung ultrasound images for respiratory pathology diagnosis,” Phys. Med., vol. 83, pp. 38–45, 2021. doi: 10.1016/j.ejmp.2021.02.023. [Google Scholar] [PubMed] [CrossRef]
28. X. Wang et al., “Pulmonary edema severity estimation in chest radiographs using deep learning,” in Med. Imaging with Deep Learn. Conf., London, UK, 2019, pp. 1–5. [Google Scholar]
29. A. E. Johnson et al., “MIMIC-CXR-JPG, a large publicly available database of labeled chest radiographs,” arXiv preprint arXiv:1901.07042, 2019. [Google Scholar]
30. M. Hammon et al., “Improving diagnostic accuracy in assessing pulmonary edema on bedside chest radiographs using a standardized scoring approach,” BMC Anesthesiol., vol. 14, no. 14, pp. 1–9, 2014. doi: 10.1186/1471-2253-14-94. [Google Scholar] [PubMed] [CrossRef]
31. S. Kennedy, B. Simon, H. J. Alter, and P. Cheung, “Ability of physicians to diagnose congestive heart failure based on chest X-ray,” J. Emerg. Med., vol. 40, no. 1, pp. 47–52, 2011. doi: 10.1016/j.jemermed.2009.10.018. [Google Scholar] [PubMed] [CrossRef]
32. C. Hayat, “DenseNet-CNN architectural model for detection of abnormality in acute pulmonary edema,” Khazanah Informatika: Jurnal Ilmu Komputer dan Informatika, vol. 7, no. 2, pp. 73–79, 2021. [Google Scholar]
33. Y. Geng, Y. Ren, R. Hou, S. Han, G. D. Rubin and J. Y. Lo, “2.5 D CNN model for detecting lung disease using weak supervision,” in Medical Imaging 2019: Computer-Aided Diagnosis, San Diego, CA, USA, 2019, pp. 924–928. [Google Scholar]
34. S. Serte and A. Serener, “Early pleural effusion detection from respiratory diseases including COVID-19 via deep learning,” in 2020 Medical Technologies Congress (TIPTEKNO), Antalya, Turkey, 2020, pp. 1–4. [Google Scholar]
35. Y. Bar, I. Diamant, L. Wolf, S. Lieberman, E. Konen and H. Greenspan, “Chest pathology identification using deep feature selection with non-medical training,” Comput. Methods Biomech. Biomed. Eng.: Imaging Vis., vol. 6, no. 3, pp. 259–263, 2018. [Google Scholar]
36. P. Lakhani and B. Sundaram, “Deep learning at chest radiography: Automated classification of pulmonary tuberculosis by using convolutional neural networks,” Radiology, vol. 284, no. 2, pp. 574–582, 2017. doi: 10.1148/radiol.2017162326. [Google Scholar] [PubMed] [CrossRef]
37. National Institutes of Health Clinical Center (NIHCC“Chest X-ray dataset,” 2024. Accessed: Jan. 6, 2024. [Online]. Available: https://www.kaggle.com/datasets/nih-chest-xrays/data [Google Scholar]
38. Medical Imaging Databank of the Valencia Region (BIMCV“Padchest,” 2024. Accessed: Jan. 6, 2024. [Online]. Available: https://github.com/BIMCV-CSUSP [Google Scholar]
39. Stanfordmlgroup, “CheXpert,” 2024. Accessed: Jan. 15, 2024. [Online]. Available: https://stanfordmlgroup.github.io/competitions/chexpert/ [Google Scholar]
40. R. J. S. Raj, S. J. Shobana, I. V. Pustokhina, D. A. Pustokhin, D. Gupta and K. Shankar, “Optimal feature selection-based medical image classification using deep learning model in internet of medical things,” IEEE Access, vol. 8, no. 2981337, pp. 58006–58017, 2020. doi: 10.1109/ACCESS.2020.2981337. [Google Scholar] [CrossRef]
41. B. Unal and A. Akoglu, “Resource efficient real-time processing of contrast limited adaptive histogram equalization,” in 26th Int. Conf. Field Program. Logic Appl. (FPL), Lausanne, Switzerland, 2016, pp. 1–8. [Google Scholar]
42. S. Anand and R. Roshan, “Chest X ray image enhancement using deep contrast diffusion learning,” Optik, vol. 279, no. 170751, pp. 1–15, 2023. doi: 10.1016/j.ijleo.2023.170751. [Google Scholar] [CrossRef]
43. J. Huang et al., “Speed/accuracy trade-offs for modern convolutional object detectors,” in Comput. Vis. Pattern Recognit. Conf., Honolulu, Hawaii, 2017, pp. 7310–7311. [Google Scholar]
44. J. Kim, J. K. Lee, and K. M. Lee, “Accurate image super-resolution using very deep convolutional networks,” in Comput. Vis. Pattern Recognit. Conf., Las Vegas, NV, USA, 2016, pp. 1646–1654. [Google Scholar]
45. L. Zheng, Y. Zhao, S. Wang, J. Wang, and Q. Tian, “Good practice in CNN feature transfer,” arXiv preprint arXiv:1604.00133, 2016. [Google Scholar]
46. M. L. Richter, W. Byttner, U. Krumnack, A. Wiedenroth, L. Schallner and J. Shenk, “(Input) size matters for CNN classifiers,” in Artif. Neural Netw. Mach. Learn. Conf., Bratislava, Slovakia, 2021, pp. 133–144. [Google Scholar]
47. N. Bayramoglu, J. Kannala, and J. Heikkilä, “Deep learning for magnification independent breast cancer histopathology image classification,” in 23rd Int. Conf. Pattern Recognit., Cancun, Mexico, 2016, pp. 2440–2445. [Google Scholar]
48. S. Yun, D. Han, S. J. Oh, S. Chun, J. Choe and Y. Yoo, “CutMix: Regularization strategy to train strong classifiers with localizable features,” in Int. Conf. Comput. Vis., Seoul, Republic of Korea, 2019, pp. 6023–6032. [Google Scholar]
49. H. Zhang, M. Cisse, Y. N. Dauphin, and D. Lopez-Paz, “mixup: Beyond empirical risk minimization,” in Int. Conf. Learn. Rep., Vancouver, BC, Canada, 2018, pp. 1–13. [Google Scholar]
50. C. Chen et al., “An effective deep neural network for lung lesions segmentation from COVID-19 CT images,” IEEE Trans. Ind. Inform., vol. 17, no. 9, pp. 6528–6538, 2021. doi: 10.1109/TII.2021.3059023. [Google Scholar] [PubMed] [CrossRef]
51. Z. Hussain, F. Gimenez, D. Yi, and D. Rubin, “Differential data augmentation techniques for medical imaging classification tasks,” in AMIA Annu. Symp. Proc., 2017, pp. 979–984. [Google Scholar]
52. R. Tabares-Soto et al., “Sensitivity of deep learning applied to spatial image steganalysis,” PeerJ. Comput. Sci., vol. 7, no. 616, pp. 1–27, 2021. doi: 10.7717/peerj-cs.616. [Google Scholar] [PubMed] [CrossRef]
53. N. U. Rehman et al., “A self-activated cnn approach for multi-class chest-related COVID-19 detection,” Appl. Sci., vol. 11, no. 19, pp. 9023, 2021. doi: 10.3390/app11199023. [Google Scholar] [CrossRef]
54. H. G. Ramaswamy, “Ablation-CAM: Visual explanations for deep convolutional network via gradient-free localization,” in Proc. IEEE/CVF Winter Conf. Appl. Comput. Vis., 2020, pp. 983–991. [Google Scholar]
55. Z. Feng, M. Zhu, L. Stanković, and H. Ji, “Self-matching CAM: A novel accurate visual explanation of CNNs for SAR image interpretation,” Remote Sens., vol. 13, no. 9, pp. 1772, 2021. doi: 10.3390/rs13091772. [Google Scholar] [CrossRef]
Cite This Article
 Copyright © 2024 The Author(s). Published by Tech Science Press.
This work is licensed under a Creative Commons Attribution 4.0 International License , which permits unrestricted use, distribution, and reproduction in any medium, provided the original work is properly cited.
 Downloads
 Citation Tools