
 Submit a Paper
 Propose a Special lssue
 Open Access
ARTICLE

Contemporary Study for Detection of COVID-19 Using Machine Learning with Explainable AI
1 Department of Computer Science, University of Karachi, Karachi, 75270, Pakistan
2 Department of Computing, Faculty of Engineering Science and Technology, Hamdard University, Karachi, 75540, Pakistan
3 Department of Health Informatics, College of Applied Medical Sciences, Qassim University, Qassim, 51452, Saudi Arabia
4 Department of Computer Science, College of Computer Science, King Khalid University, Abha, 61421, Saudi Arabia
* Corresponding Author: Sulaiman Sulmi Almutairi. Email:
(This article belongs to the Special Issue: Medical Imaging Based Disease Diagnosis Using AI)
Computers, Materials & Continua 2024, 80(1), 1075-1104. https://doi.org/10.32604/cmc.2024.050913
Received 22 February 2024; Accepted 23 May 2024; Issue published 18 July 2024
 View Full Text
 Download PDF
Abstract
The prompt spread of COVID-19 has emphasized the necessity for effective and precise diagnostic tools. In this article, a hybrid approach in terms of datasets as well as the methodology by utilizing a previously unexplored dataset obtained from a private hospital for detecting COVID-19, pneumonia, and normal conditions in chest X-ray images (CXIs) is proposed coupled with Explainable Artificial Intelligence (XAI). Our study leverages less preprocessing with pre-trained cutting-edge models like InceptionV3, VGG16, and VGG19 that excel in the task of feature extraction. The methodology is further enhanced by the inclusion of the t-SNE (t-Distributed Stochastic Neighbor Embedding) technique for visualizing the extracted image features and Contrast Limited Adaptive Histogram Equalization (CLAHE) to improve images before extraction of features. Additionally, an Attention Mechanism is utilized, which helps clarify how the model makes decisions, which builds trust in artificial intelligence (AI) systems. To evaluate the effectiveness of the proposed approach, both benchmark datasets and a private dataset obtained with permissions from Jinnah Postgraduate Medical Center (JPMC) in Karachi, Pakistan, are utilized. In 12 experiments, VGG19 showcased remarkable performance in the hybrid dataset approach, achieving 100% accuracy in COVID-19 vs. pneumonia classification and 97% in distinguishing normal cases. Overall, across all classes, the approach achieved 98% accuracy, demonstrating its efficiency in detecting COVID-19 and differentiating it from other chest disorders (Pneumonia and healthy) while also providing insights into the decision-making process of the models.Keywords
Coronavirus disease also recognized as COVID-19 is a very transmissible respiratory disease/infection caused by the SARS-CoV-2 virus. The World Health Organization (WHO) has received reports of 774,593,066 confirmed COVID-19 cases, with 7,028,881 resulting in death, by 04 February 2024, the cumulative number of administered vaccine doses reached 13,195,832,385 [1]. The worldwide COVID-19 problem has affected many people and economies everywhere [2]. The virus has caused lots of deaths and made millions of people sick. Also, many businesses and industries are having big problems and losing money, and the situation is getting worse. People with COVID-19 usually have common signs like fever, feeling tired, and a dry cough [3]. They might also feel like they cannot breathe well and have body aches, a sore throat, and sometimes even diarrhea, nausea, or a runny nose [4]. The social and psychological impact of the pandemic has also been significant, with many people experiencing stress, anxiety, and loneliness due to social distancing measures and other restrictions. The COVID-19 pandemic had a widespread and unprecedented impact on the world, and efforts are ongoing to address the various challenges it has created [5]. In general, COVID-19 diagnosis is possible through PCR tests, however, these types of tests can be time-consuming and require specialized laboratory equipment. There has been growing interest in using deep learning (DL) to examine X-ray images especially CXIs to find various diseases related to the lungs, including COVID-19, Tuberculosis, or pneumonia [6–10]. One of the primary drawbacks of CT imaging is that it generally requires more time compared to X-ray imaging. Additionally, the availability of CT scanners is limited in many regions, which can hinder timely screening for COVID-19. In contrast, X-rays are the most commonly used and widely available diagnostic imaging technique [10] and are portable. CXIs are often thought to be better than CT scans for finding COVID-19 because they are easy to get and the pictures are made quickly. COVID-19 can make the lungs look different, and X-rays can show if someone has it by looking at their lungs.
In recent years, AI has made remarkable strides, but its inner workings often remain opaque, hindering trust and understanding. XAI is a new growing field focused on making AI systems transparent and interpretable. This article explores the significance of XAI in the detection of COVID-19, fostering accountability, and enhancing user confidence in AI technologies, especially in the field of medical systems. Reference [11] proposed an AI model, enhanced with XAI, to detect and interpret COVID-19-positive CXIs, aiming to aid clinical decisions. Another technique proposed [12] is a novel methodology integrating copy number alteration, DNA methylation, and gene expression data to predict Gleason’s score in prostate cancer. By providing a visual representation of the integrated data, researchers can gain insights into how different omics features contribute to the predictive model’s outcomes, thereby enhancing interpretability and transparency in the predictive process.
2 Objectives and Contributions
In this section, the proposed methodology for the experiment is shown in Fig. 1 below. In this study, CNN is used for feature extraction by the removal of the fully connected layers from the CNN, a t-SNE embedding is also utilized to visualize the extracted features of the diseases. In the end, the attention mechanism, which is associated with XAI techniques, is employed to improve the transparency and interpretability of the model’s predictions. However, this approach is very helpful and novel for viewing the features, and SVM is used for classification tasks.
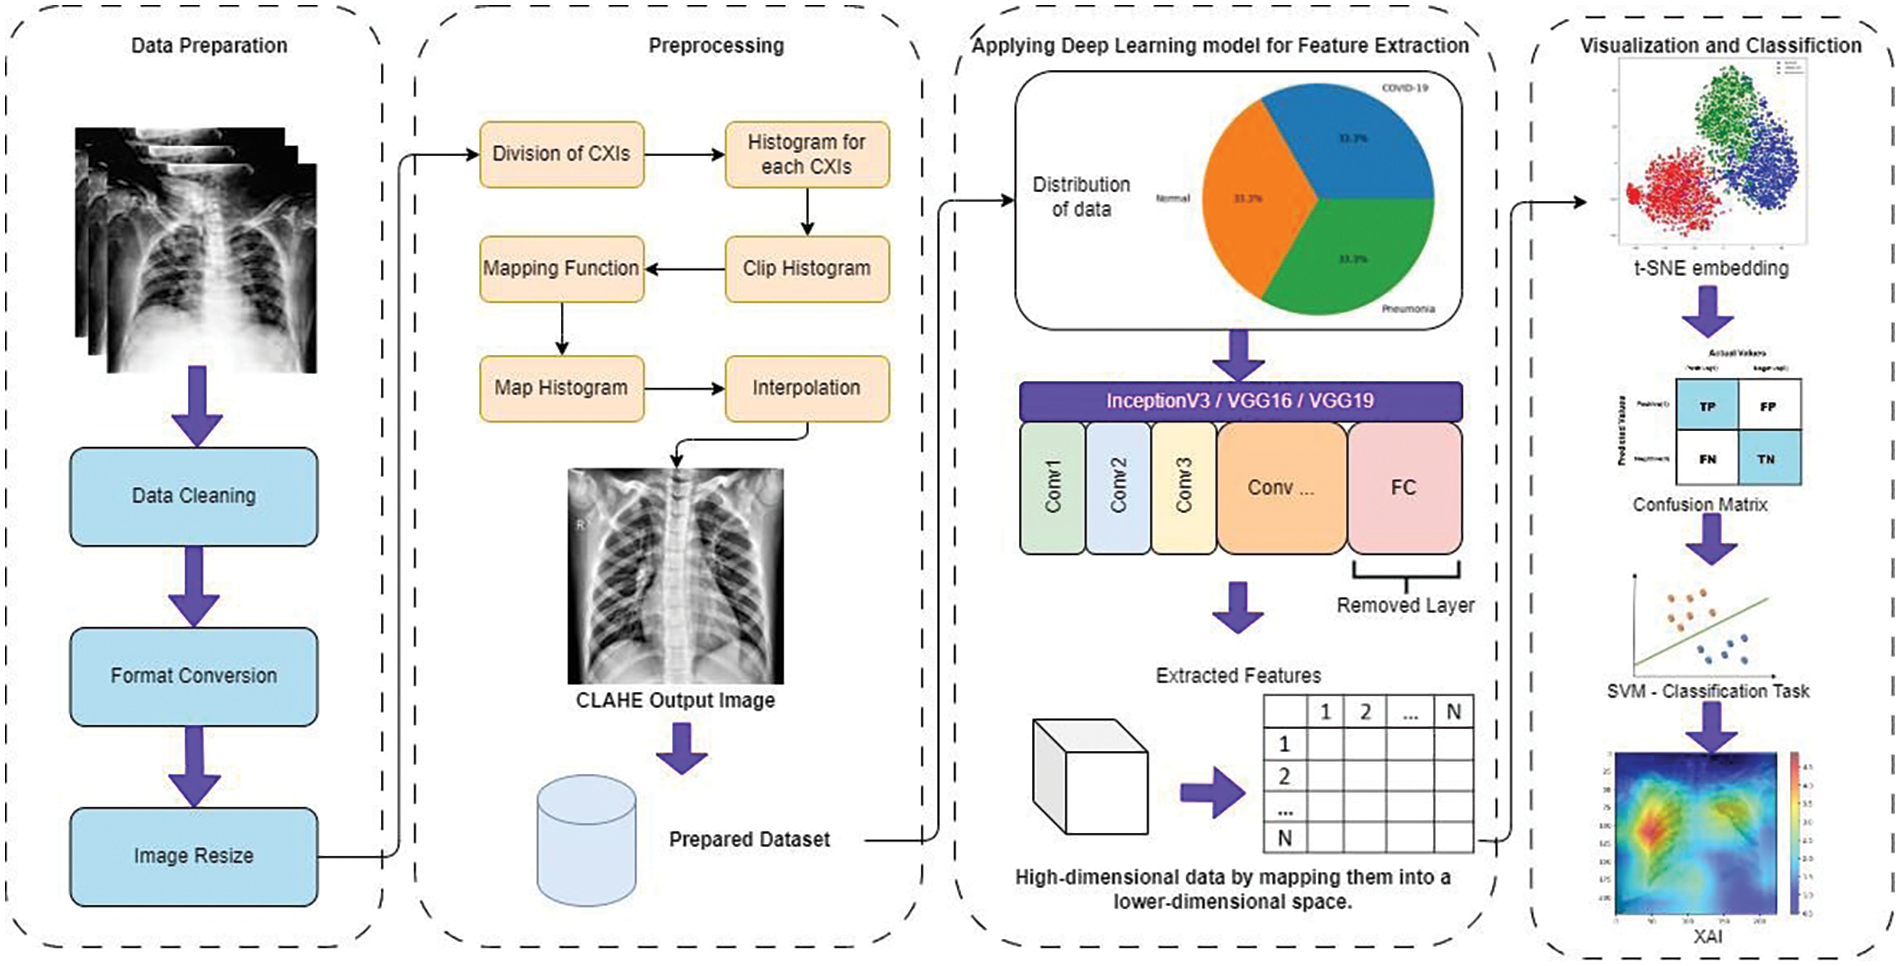
Figure 1: Comprehensive experimental process overview
In recent times, there has been a notable surge in interest surrounding the application of DL techniques to analyze medical images. Different state-of-the-art studies use cutting-edge technologies to utilize the images for diagnosis purposes [13–15]. Limited studies have been identified that leverage XAI techniques in the domain of medical imaging analysis. Gamage et al. [16] utilized recently the XAI technique to identify skin cancer. This surge stems from their capability to enhance the precision and proficiency of disease identification. Sarkar et al. [17] proposed a novel Multi-Scale CNN architecture coupled with SHAP and Grad-CAM explainable AI techniques enhances accuracy in multi-class lung disease classification from CXIs. In [18] reseracher with his team introduces a framework for classifying XAI methods in this field, categorizes existing papers based on this framework and anatomical location, and discuss future prospects for XAI in medical image analysis. Wang et al. [19] proposed a Particle Swarm Optimization guided Self-Tuning CNN (PSTCNN) for COVID-19 diagnosis, combining automated hyperparameter optimization with XAI for enhanced accuracy, efficiency, and interpretability. Overall, it offers valuable insights into the current state and future directions of XAI in healthcare.
Specifically in relation to COVID-19, CXIs have emerged as a prevalent diagnostic tool, valued for their ease of access and non-intrusive characteristics. This section dedicated to a review of existing literature aims to investigate into the current forefront of implementation. Also, delve into diverse methodologies and architectures employed, the datasets coupled for training and assessment, as well as the varied performance outcomes documented across multiple studies as mentioned in Table 1. CXIs are classic approach and broadly used for the detection of lung illnesses, including COVID-19. However, understanding CXIs can be difficult, especially when there are a lot of images to look at during a pandemic, and radiologists have many pictures to review. Lately, deep neural networks (DNNs) have been used a lot to understand pictures better. They have been helpful in telling what’s in the pictures, especially in medical pictures. However, these studies have provided a comprehensive summary of their findings, including relevant details, also not utlizaing the XAI approach in relation to COVID-19 detection from CXIs as discussed in Table 1.
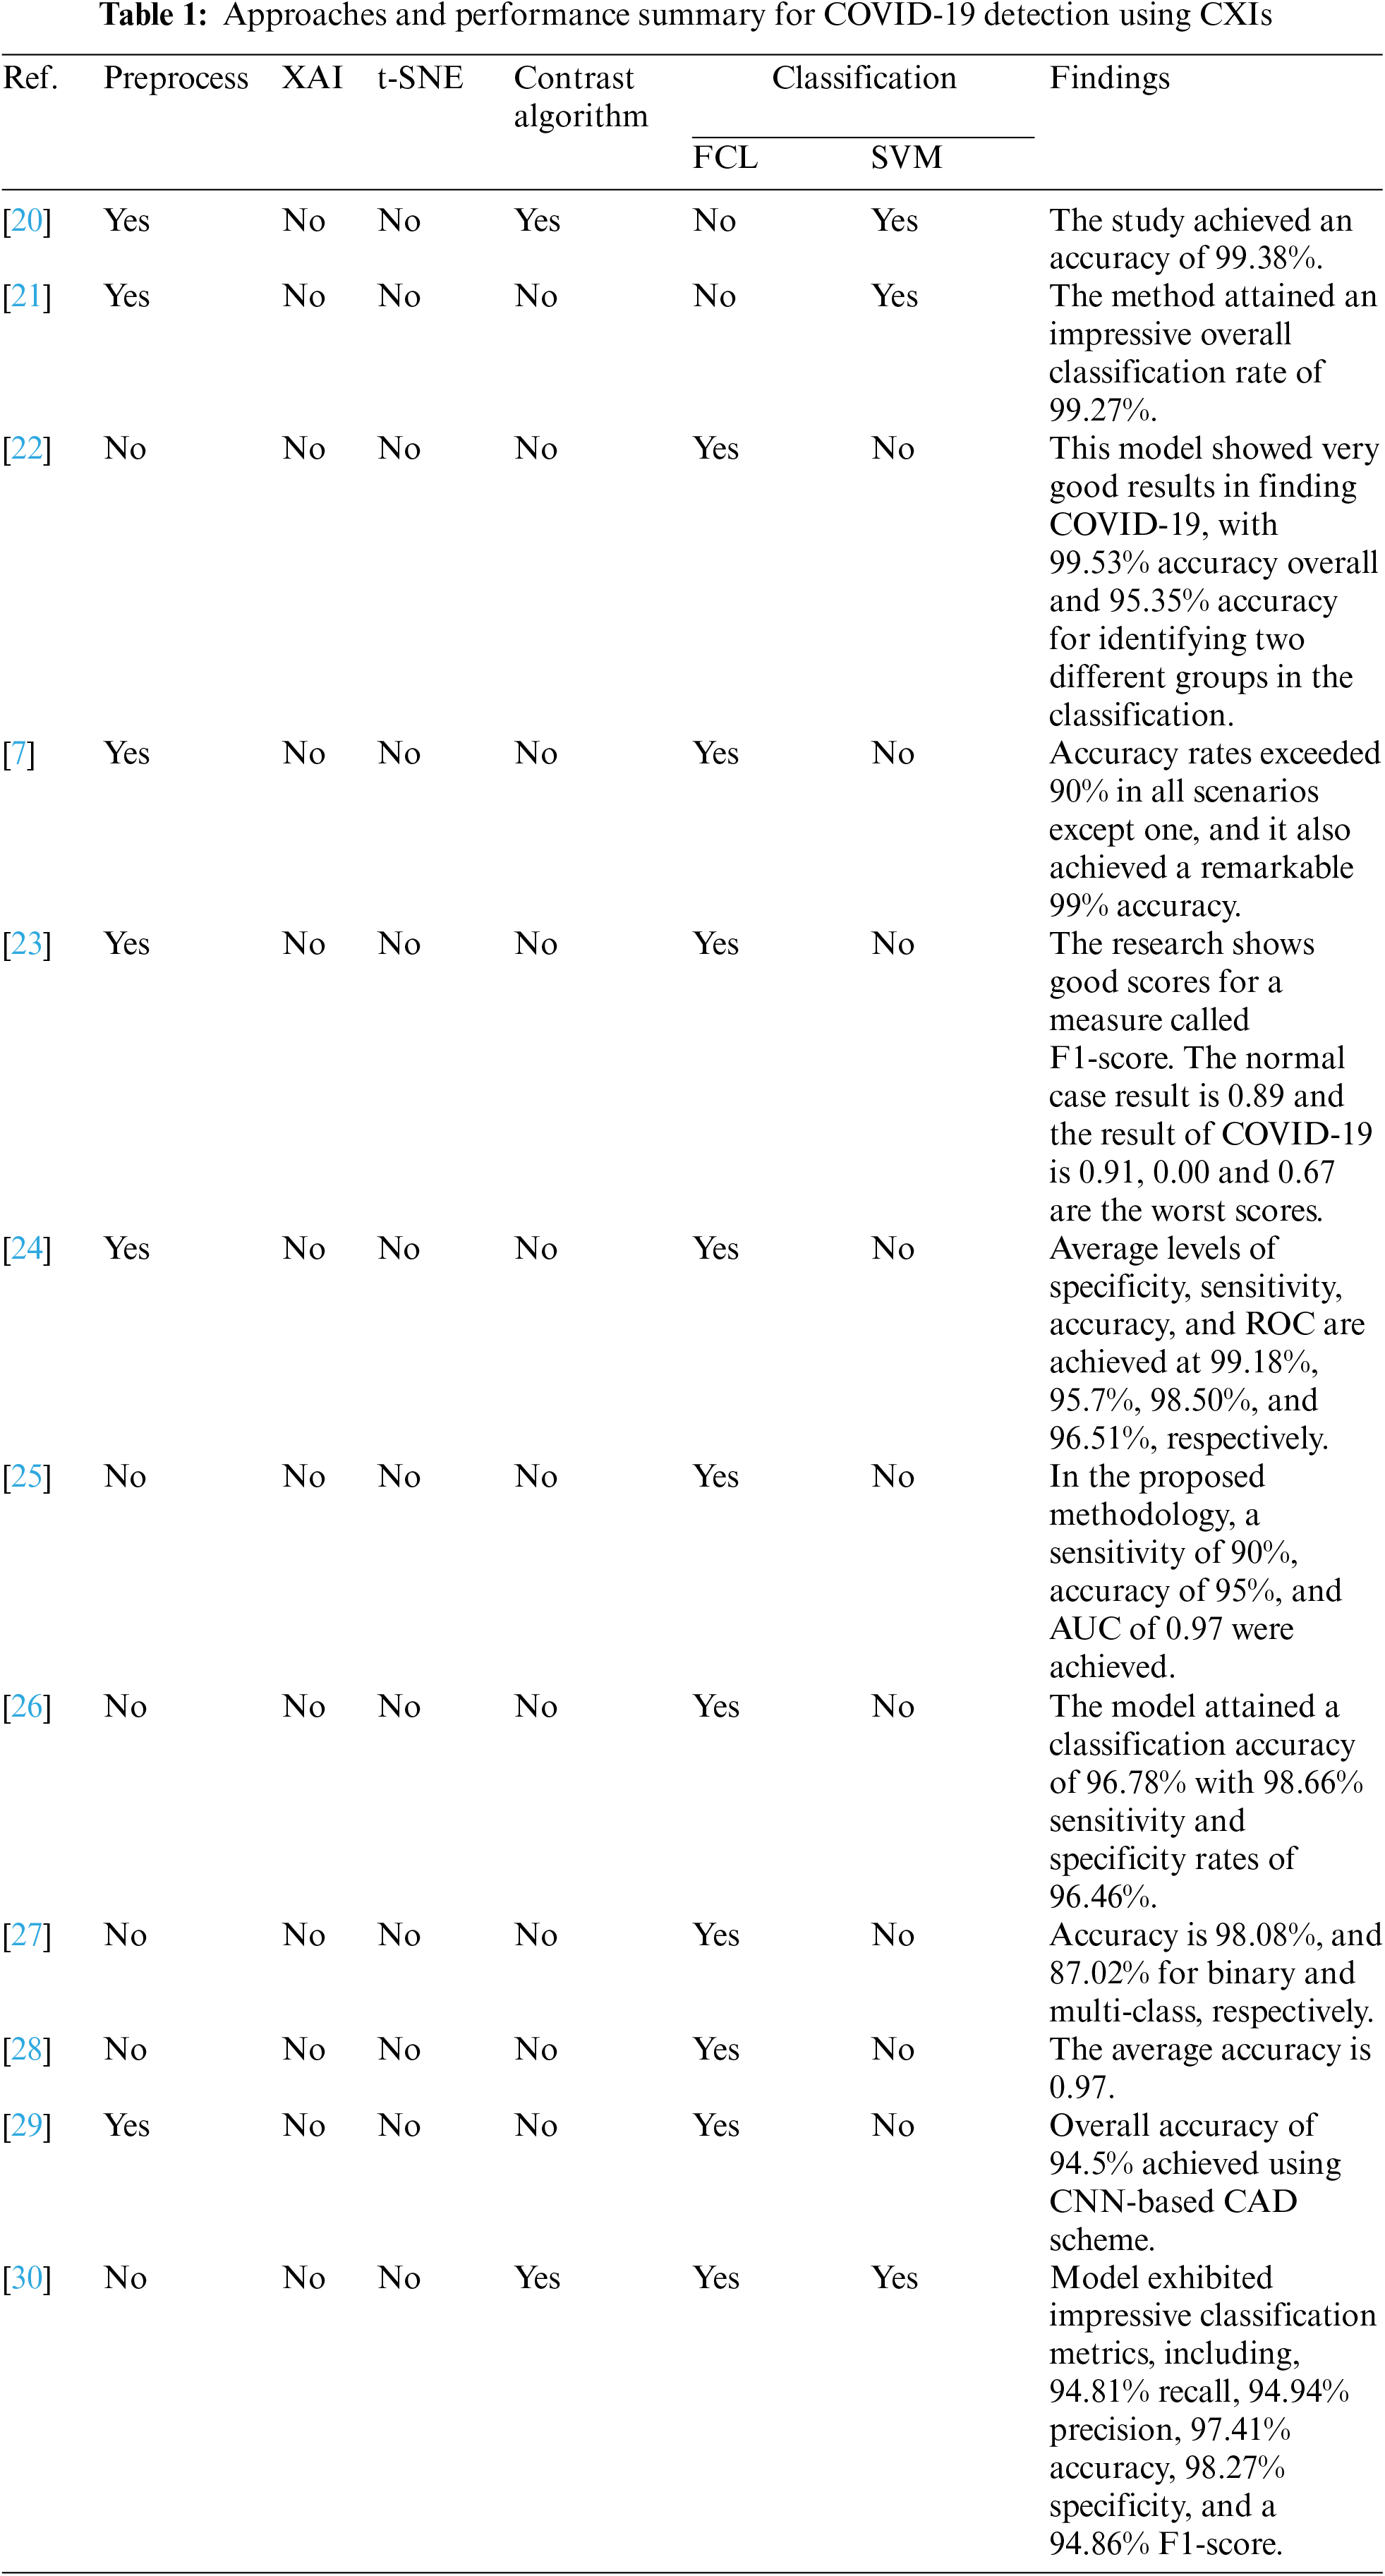
Table 1 summarizes several implementations on COVID-19 classification using different models of DL, detailing their preprocessing steps, baseline models, contrast amplification, classification methods, and findings in terms of accuracy and other metrics, where FCL stands for Fully Connected Layer and SVM for support vector machine. The model proposed in [31] presents an automated approach for designing to classify COVID-19 from CXIs, approach uses DCNN architecture with a minimum number of convolutional layers, also approach involves an iterative process that optimizes the hyper parameters until no further improvement in accuracy is achieved. This approach starts with a simple CNN and gradually enhances the model by adding up to two additional layers. A practical solution utilizes cutting-edge Machine Learning (ML) techniques, particularly EfficientNet and MixNet, for detecting COVID-19 from CXIs and lung computed tomography images [32]. Through rigorous validation across multiple datasets, the approach consistently achieves high accuracy rates exceeding 95%, demonstrating significant performance gains compared to existing studies. Also in [33] survey assesses the role of DL in combating the COVID-19 pandemic across various domains, highlighting its applications in Natural Language Processing (NLP), Computer Vision, Life Sciences, and Epidemiology, while addressing key challenges and potential directions for future research. Wu et al. [22] proposed a novel approach for detection of COVID-19 using CXIs. They combined a CNN with UL-Net, a modified version of U-Net, to create their proposed structure. The modified structure included a new down sampling side and omitted the connections among the FCL. This adaptation was inspired by the structure of UL. By leveraging this architecture, the main purpose of the researchers is to escalate the detection accuracy of COVID-19. Sheykhivand with his team [7] utilized CXIs to classify two to four classes, which included healthy, viral, bacterial, and COVID-19 classes, based on seven distinct and meaningful scenarios. To improve the classification performance within the CXIs dataset, the authors proposed an architecture that incorporated LSTM and transfer learning with Generative Adversarial Networks (GANs). This combination of techniques aimed to enhance the accuracy of classifying the given classes. Canayaz [20] investigated the diagnosis of COVID-19 utilizing CXIs. In the research, they made a dataset with different types of images: normal ones, ones with COVID-19, and ones with pneumonia. They wanted to see how well certain methods could tell these three types apart in the CXIs dataset. Ying et al. [34] created a special way to make pictures look clearer. Their method was really useful for making pictures better, and it made datasets used for different things much better too. Hemdan et al. [23] used primarily concentrated on COVIDX-Net, a novel model that integrates seven different methods of DCNN. Among these methods are advanced models such as VGG19, as well as an additional variant of Google MobileNet. Each DCNN model within COVIDX-Net is specifically designed to analyze the normalized intensities of CXIs and diagnose whether a patient’s condition is negative or positive for COVID-19. The research aimed to assess the efficacy of the different DCNN models in accurately classifying COVID-19 cases through the analysis of CXIs. Togaçar et al. [21] worked with datasets that included three classification classes: COVID-19, healthy and pneumonia cases. To enhance the image quality in the preprocessing stage, the datasets the Fuzzy Color method was applied, and the images were stacked with the original images for organization after preprocessing feature extraction was performed by applying SqueezeNet and MobileNetV2 models, aided by the Social Mimic Optimization (SMO) technique and, a SVM was used as the classifier in the final step of the detection process. This integrated approach aimed to achieve accurate classification of COVID-19 cases based on the CXIs dataset by incorporating preprocessing, feature extraction, and classification techniques. In [24], the researchers pro a CNN-based approach for identifying COVID-19 diseases with the help of CXIs. They utilized of previous training models, which are considered state-of-the-art, for transfer learning. The design they suggested, named COVID-CAPS, used a special kind of network called Capsule Network. This network had four layers that understand shapes in images and three layers that understand features. They aimed to be very good at finding COVID-19, while using as few settings as possible. Their main goal was to help doctors and patients quickly know if someone had COVID-19. They tried their design and it worked-it could find COVID-19 in the medical images. The combination of a Capsule Network architecture proved to be effective in achieving accurate and efficient COVID-19 diagnosis from CXIs. Apostolopoulos et al. [26] employed transfer learning for detection of COVID-19 from CXIs in which system utilized well known CNN architectures that have been proposed in recent years. By including transfer learning, the goal of the study was to leverage the knowledge acquired from available previous training models on huge datasets. References [35,36] also used DL technique to detect COVID-19 from CXIs. Ozturk et al. [27] also utilized CXIs and introduced a model for the detection of COVID-19, the model they proposed employed an end-to-end framework, eliminating the need for separate feature extraction. For both multi-class and binary-class classification tasks, the DarkNet model was utilized. Through experimental testing conducted on recovered patients between 5 to 13 days after recovery, the model demonstrated its capability to identify positive symptoms [37]. Brunese et al. [28] proposed a model designed to discern between CXIs depicting COVID-19, pneumonia, and healthy cases. The approach proposed by the researchers consisted of three distinct stages, each fulfilling a specific objective. Heidari et al. [29] utilized CAD for the detection of COVID-19, while Azad et al. [30] employed different techniques for classifying CXIs. On the other hand, Azad et al. directed their efforts towards CXIs classification by utilizing pre-trained CNN models alongside Local Binary Pattern (LBP) for extracting features. These captured characteristics were subsequently utilized as input for various classifiers, such as the PIN, SVM, CT, RT, and KCN. Although the specific classes are not mentioned, their aim was to classify CXIs into four classes. By leveraging pre-trained CNN models and utilizing LBP for feature extraction, they aimed to capture relevant patterns and information from the images and improve the classification task. In a recent study [38], a hybridized approach combining manual and deep spatial features, along with traditional transfer learning techniques using CNN-based deep learning models, achieved a diagnostic accuracy of 95.57% for COVID-19 detection from CXIs. Zhang et al. [39] used the FECNet model, utilizing a varying-distance GLCM-based feature extraction and ELMclassifier, and achieved an accuracy of 92.70% for COVID-19 recognition on one dataset and 92.53% on another, outperforming five other state-of-the-art models.
In the field of diagnosing COVID-19 through medical imaging, there is a notable research gap that needs attention. Currently, many studies have focused on using CXIs together with advanced deep neural networks or state-of-the-art CNN architectures to detect COVID-19 features. However, XAI remains underutilized in the detection and visualization of COVID-19, and other medical imaging tasks. Also, CXIs have been extensively studied, CT scans offer a different perspective and can potentially provide valuable insights for a more accurate and comprehensive diagnosis of COVID-19 with XAI techniques. Investigating the application of these state-of-the-art DL learning models, alongside other cutting-edge pre-trained models, on CT scans may reveal new possibilities and improve the accuracy of COVID-19 detection with XAI to find the unexplored areas in the image. In this regard, the survey of additional preprocessing techniques may improve the performance of these models, making them more effective in addressing this research gap in the field of medical diagnosis using images.
This research study involved the use of chest X-ray images from real-time patient data collected between November 2020 and November 2021. Data for the experiments were sourced from Jinnah Postgraduate Medical Center, Karachi. The data collection received ethical approval from the Ethics Committee of Jinnah Postgraduate Medical Center, Karachi (MXR(G)-39/21/JPMC).
The experiments conducted in this study utilized four distinct datasets for COVID-19 detection from CXIs. One dataset is collected from JPMC hospital, which is the private dataset. For ensuring worth and suitability of dataset for our experiments, data preprocessing steps were performed. Firstly, a data cleaning process was conducted to remove any corrupt or unusable images from the datasets. Additionally, resizing operations were applied to standardize the images to a uniform size of 128 × 128 pixels, which is a commonly used resolution for CXIs. Fig. 2 below shows the process before training the model and cleaning the datasets.
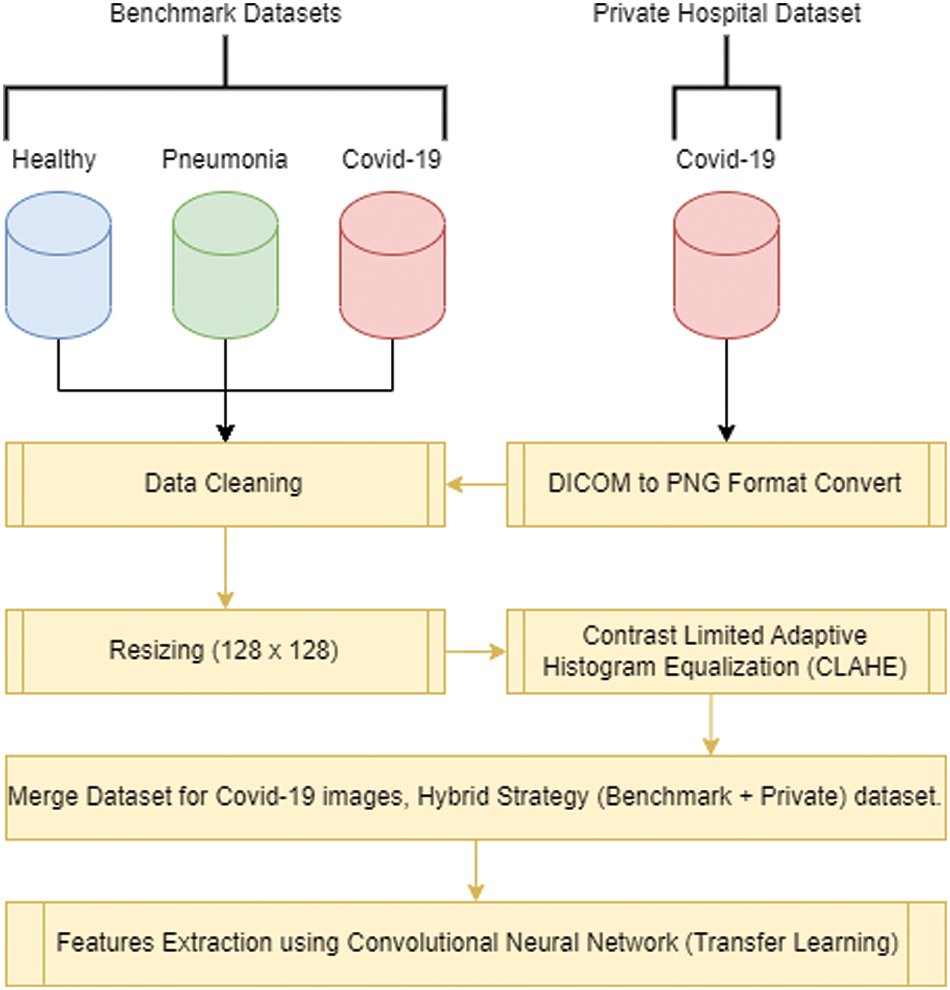
Figure 2: Data collection and preprocessing flow before performing the experiment
The first dataset, obtained from Kermany et al. [40], consists of normal and pneumonia cases. It encompasses CXIs of individuals without respiratory abnormalities as well as those diagnosed with pneumonia, including both bacterial and viral cases. The second dataset is a private dataset obtained from JPMC, for which proper permission was obtained which contains COVID-19 cases. This dataset contains CXIs of patients diagnosed with COVID-19, confirmed through RT-PCR tests. In Fig. 3, JPMC dataset example is given.
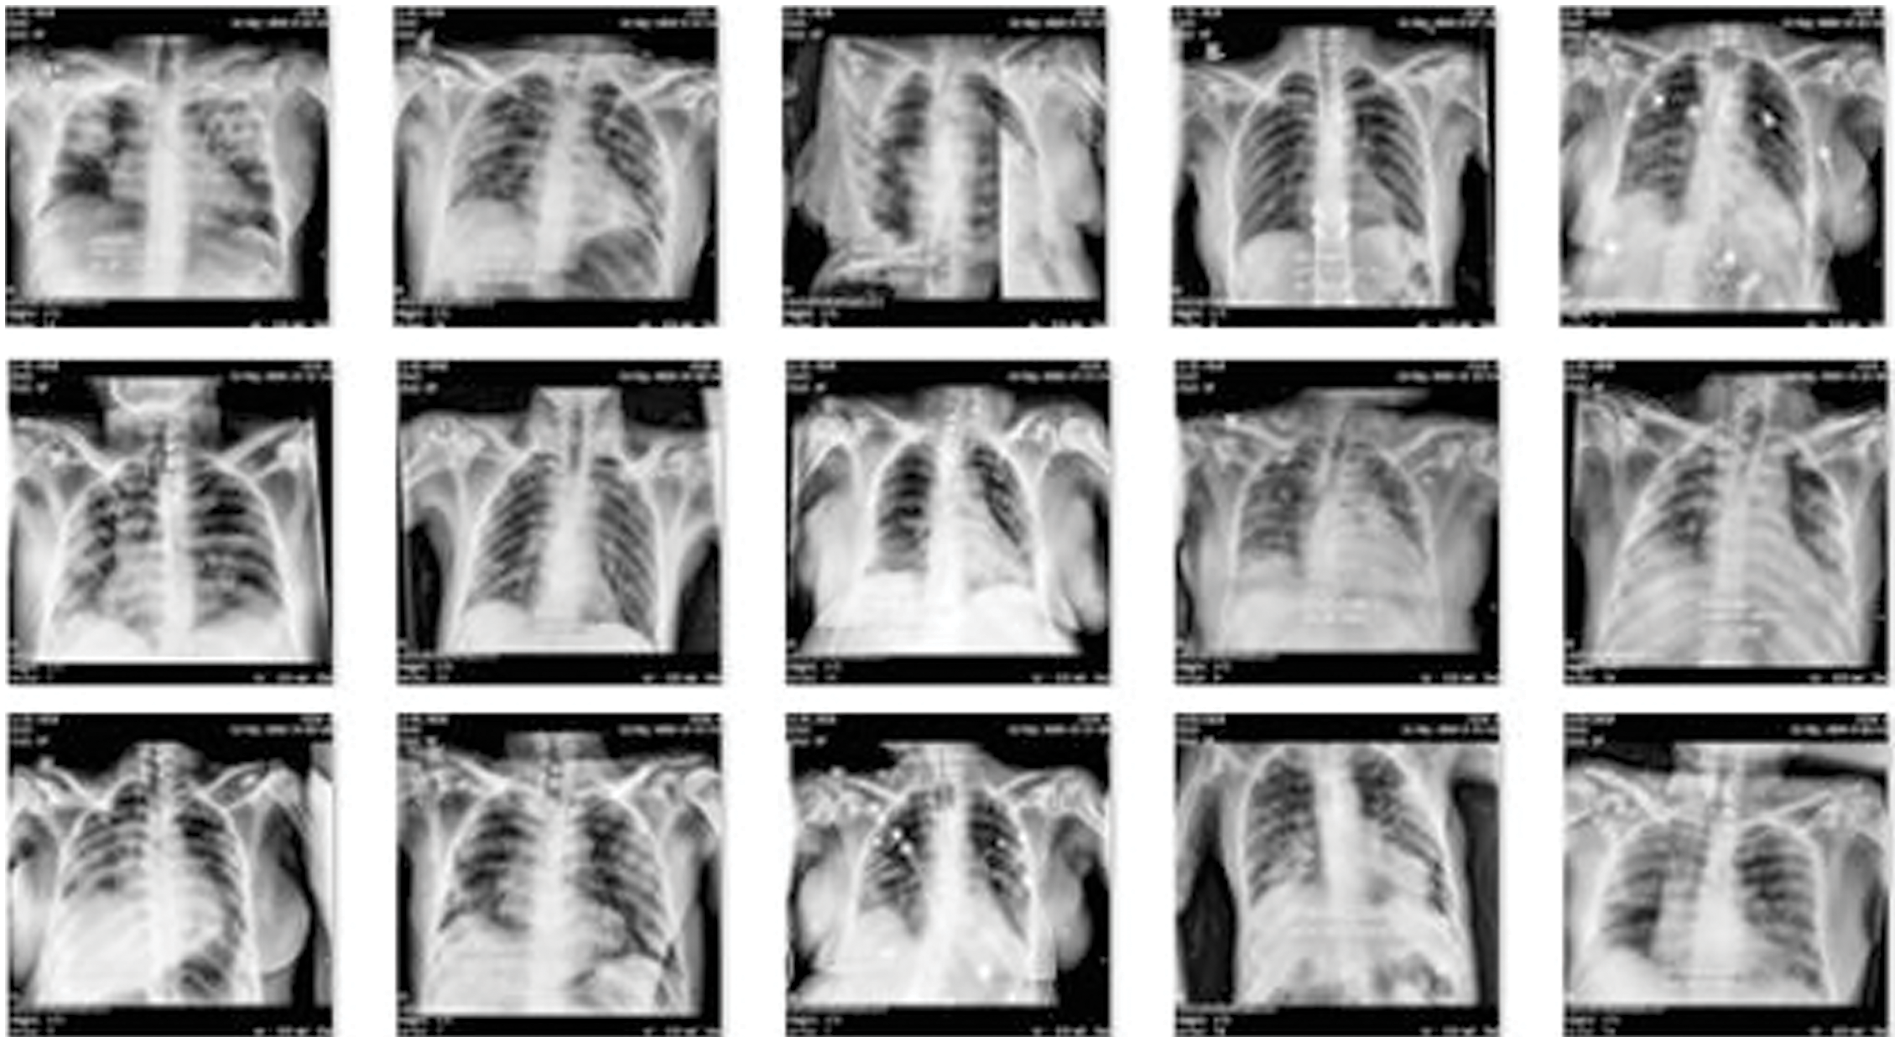
Figure 3: Example of COVID-19 dataset obtained from JPMC
Lastly, the JP Cohen dataset was utilized, which specifically focuses on the CXIs of patients diagnosed with COVID-19 [41]. The inclusion of these datasets, representing normal, pneumonia, and COVID-19 cases, allows for a comprehensive evaluation of our DL approach effectiveness in differentiating between these conditions accurately.
In this experiment, a balanced number of images were used to ensure equal representation and minimize potential biases. The use of a balanced dataset is important for obtaining accurate and reliable results, as it helps to mitigate any potential confusing factors that may arise due to an unequal distribution of images with dimensions of 128 × 128 pixels after resizing the images from higher dimensions. Fig. 4 shows the summary and distribution of the CXIs used to perform the experiments.
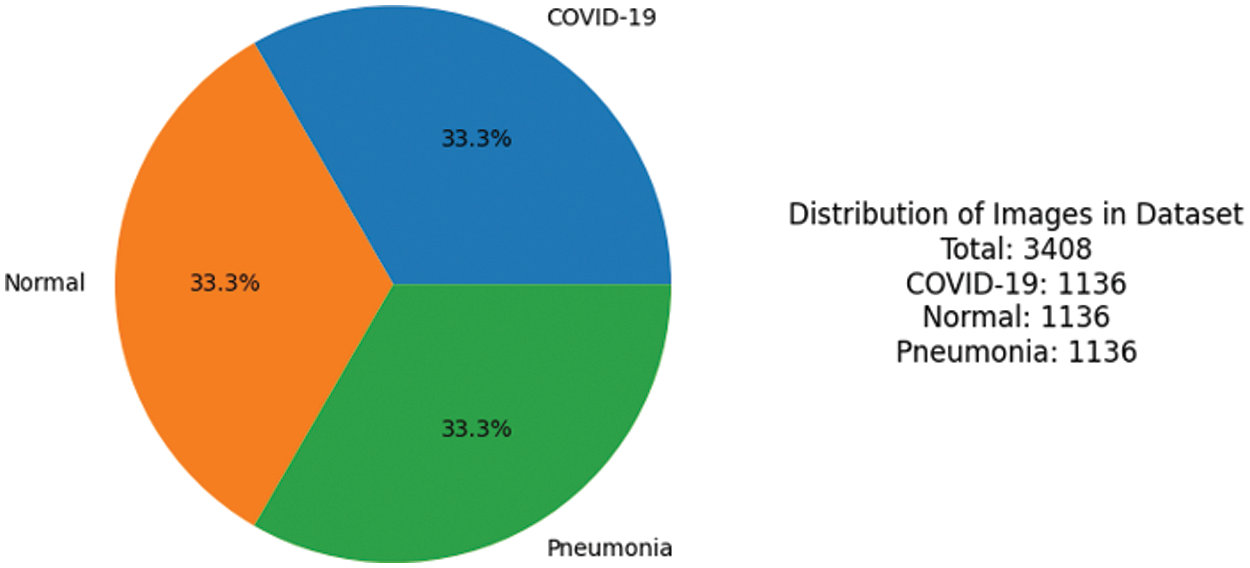
Figure 4: Ratio of images used to perform the experiment
This study was conducted with an additional 500 (after cleaning the data) COVID-19 patients who had been confirmed positive and discharged from the hospital between November 2020 and November 2021. Most of those patients are not younger than 50 years old. Images are in the DICOM format and before training cleaning, preprocessing, and image enhancements were applied.
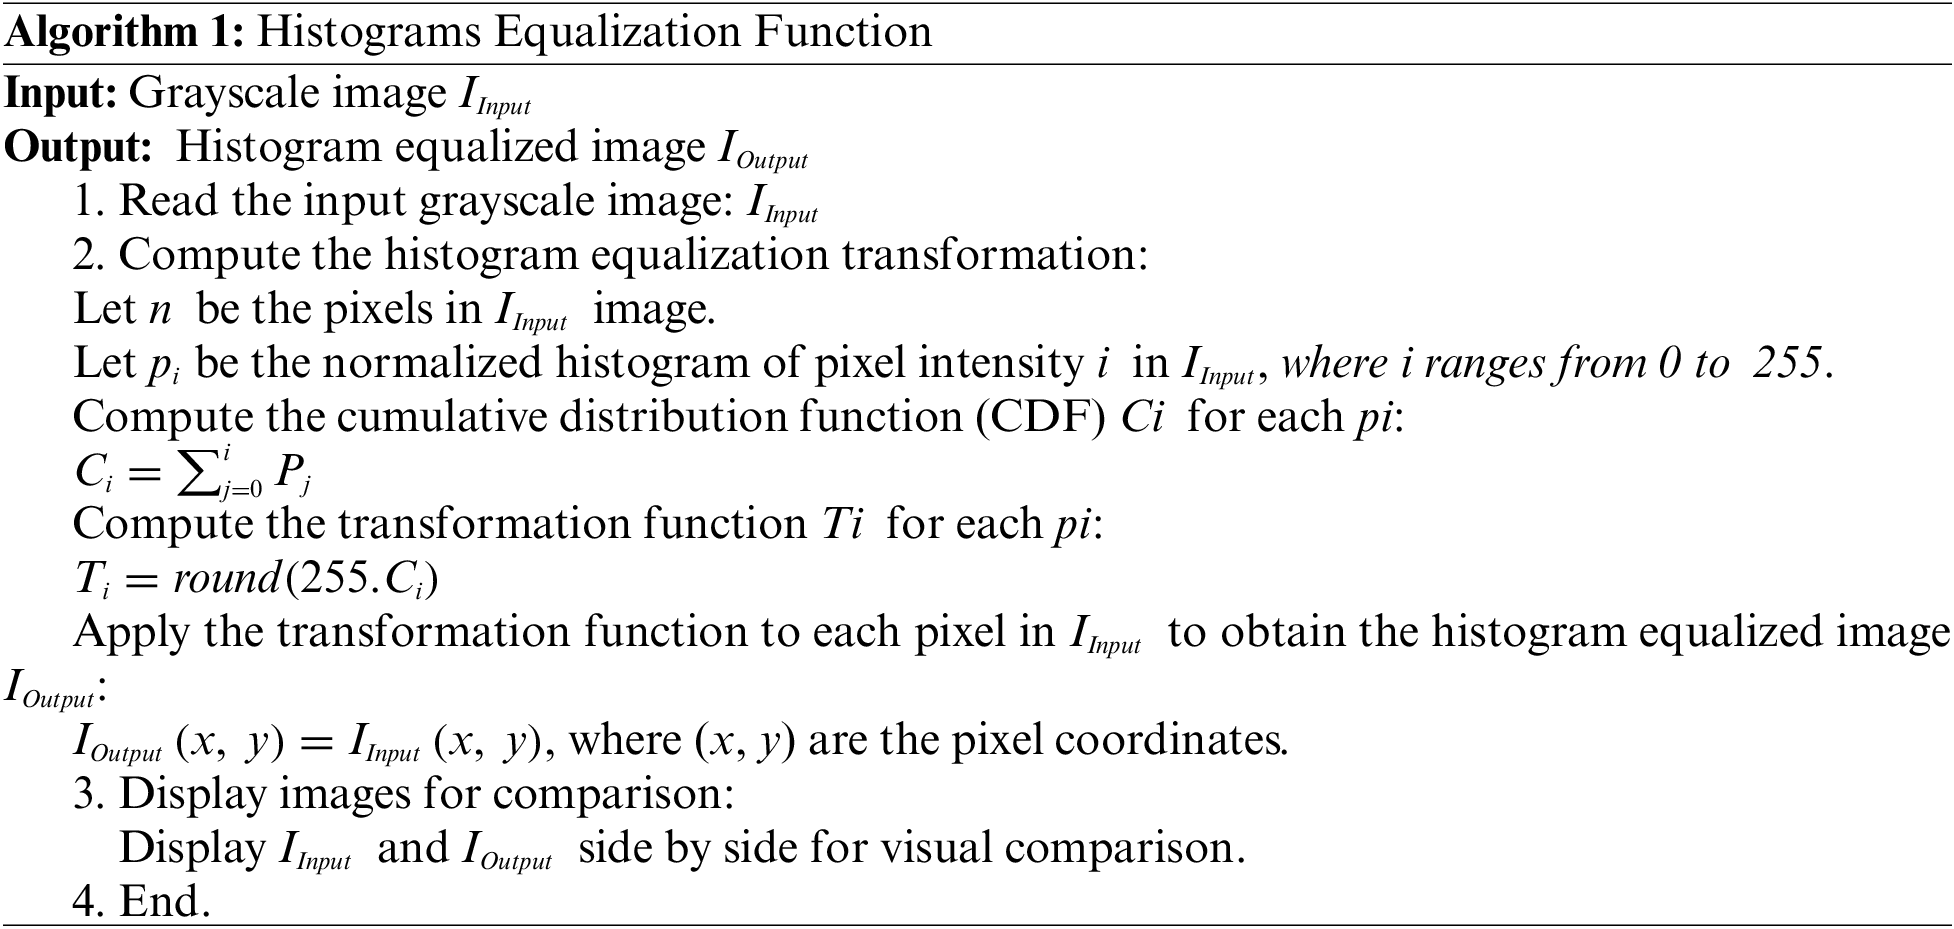
Several studies [42–45] have shown how important it is to make DL models work better for this task they do this by using the right techniques or methods to process the pictures that are put into the models. The CLAHE algorithm is a commonly used technique in image processing that improves the contrast and details in an image by redistributing the pixel intensities. Fig. 5 shows the steps which are in Algorithm 1 applied to enhance the visibility of an image.
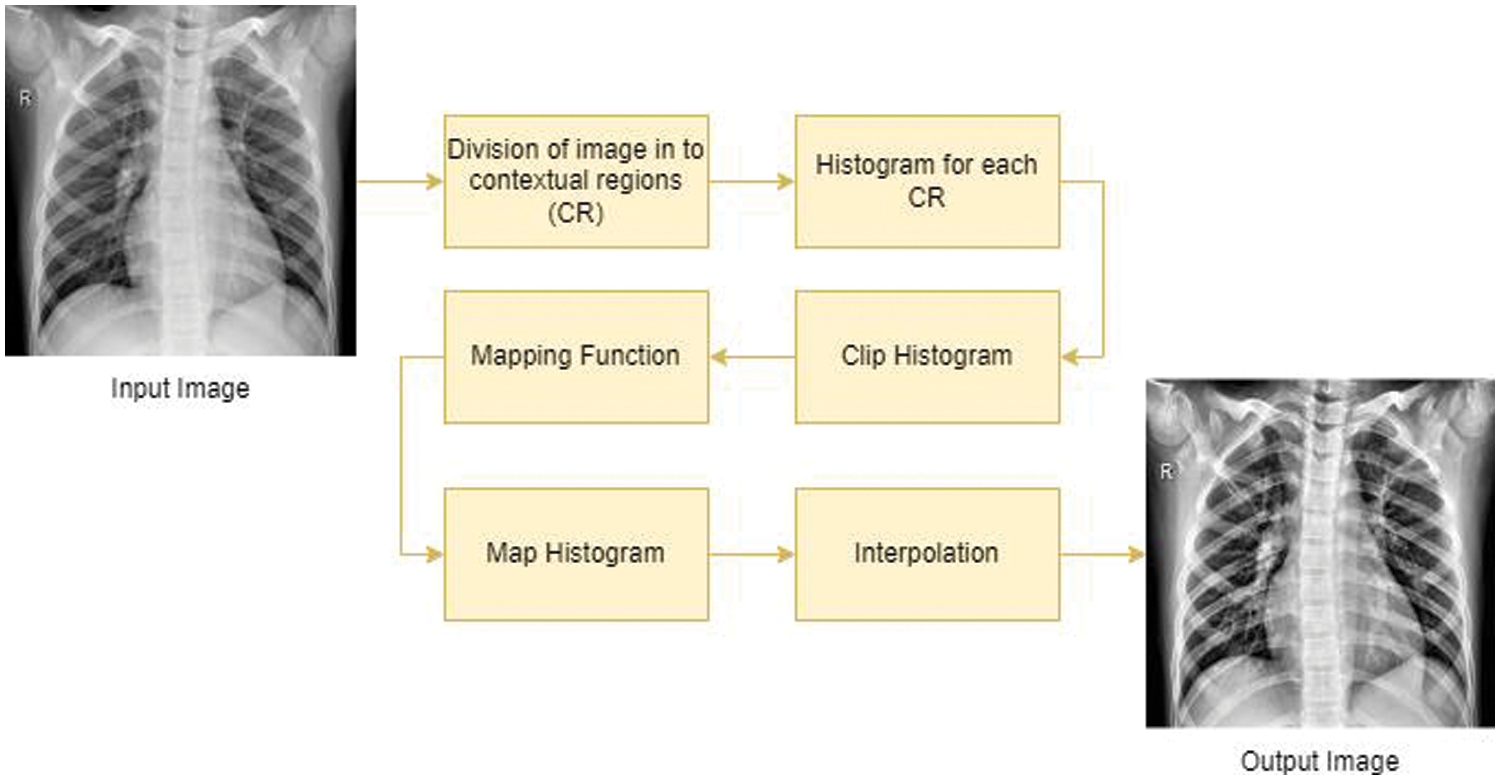
Figure 5: Process of CLAHE algorithm to perform the enhancement
In this regard, the CLAHE algorithm is implemented to increase visibility of images before training. Fig. 6 illustrates an instance demonstrating the unaltered image alongside the image improved through the implementation of the CLAHE method.
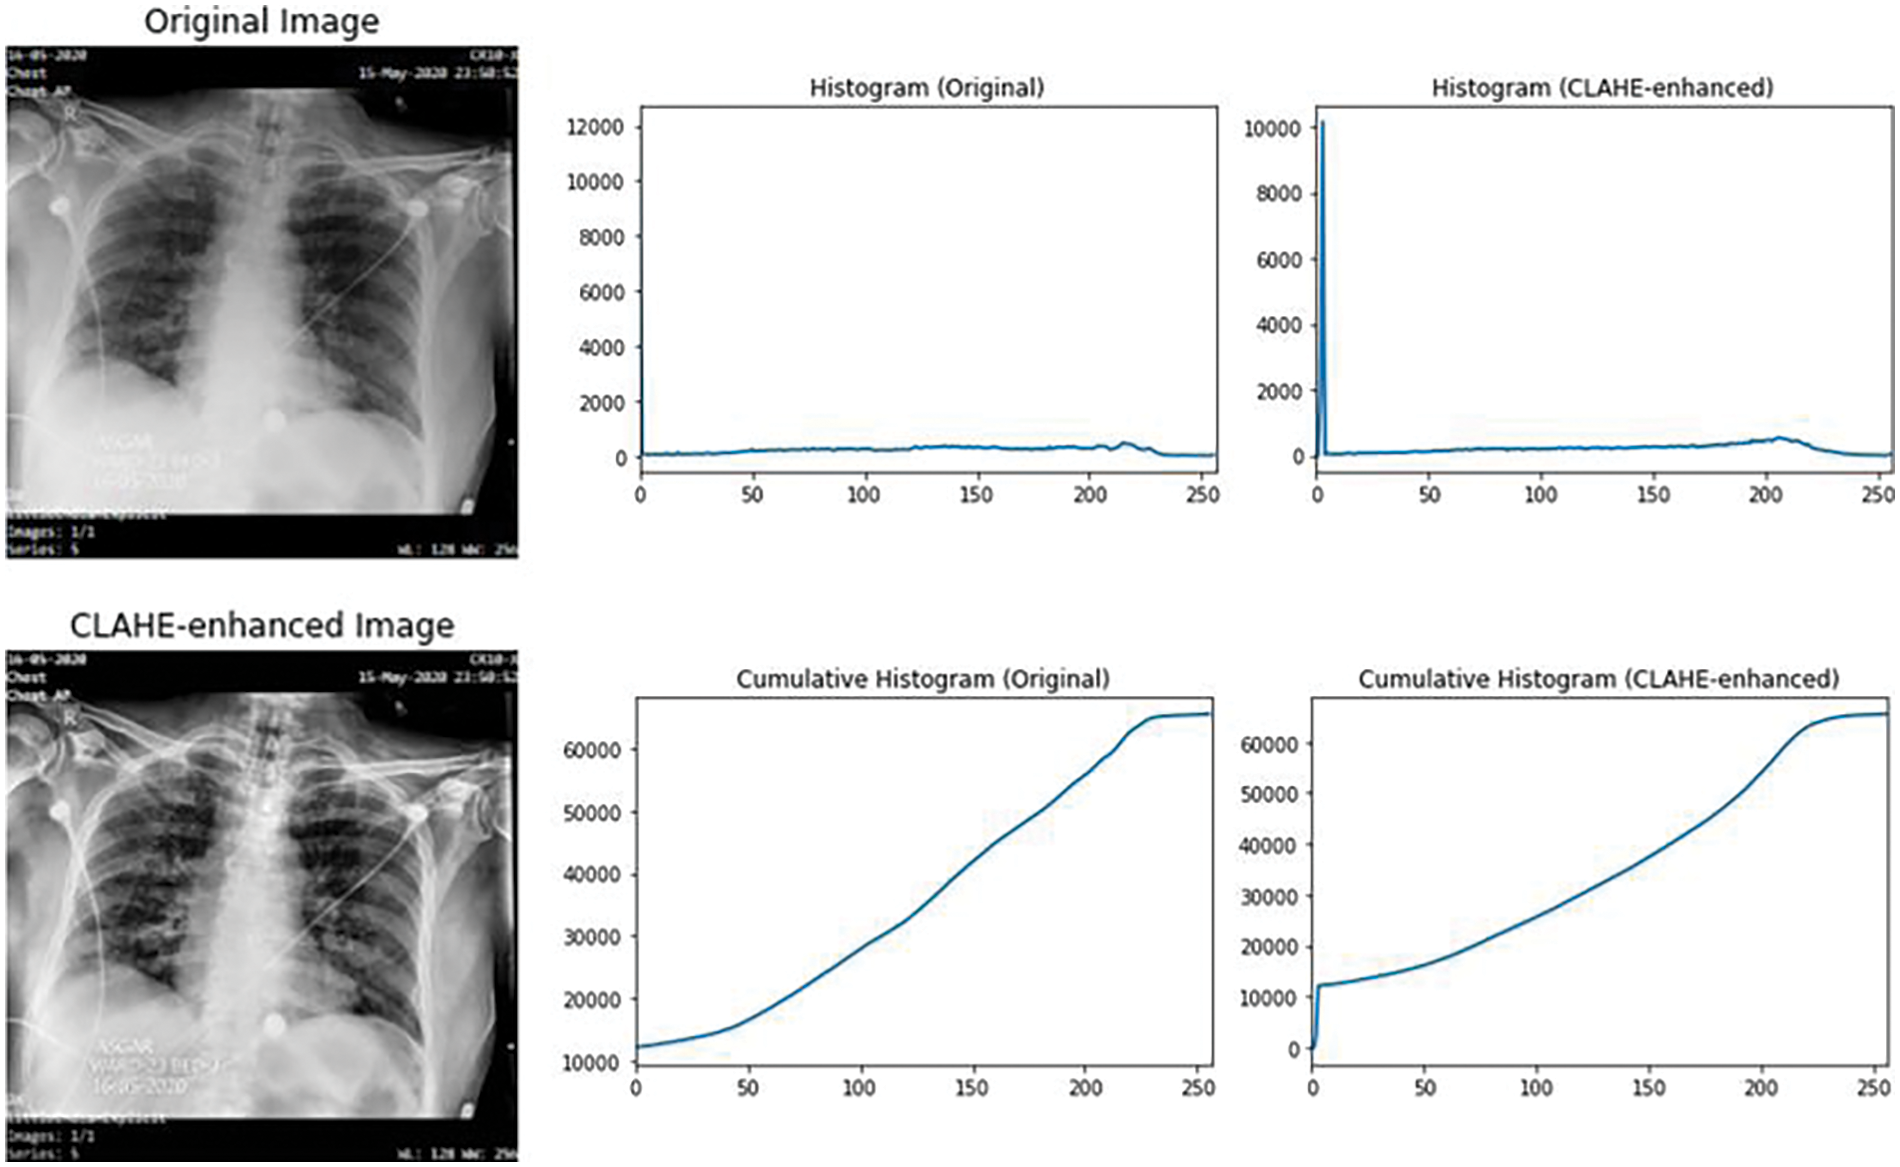
Figure 6: Example of CLAHE, before and after applied in an image
Histogram Equalization is applied to the grayscale image denoted as x, where the variable i represents a grayscale intensity ranging up to a maximum value of 256. To determine the probabilities associated with a pixel in the image at intensity level j, the calculation is performed mathematically as follows in Eq. (1):
where L denotes the total count of gray levels present in the image, n corresponds to the total number of pixels and Px (j) signifies a portrayal of the image histogram, associating the pixel intensity with an index j.
Attention mechanism help models pay attention to the right things when they are working on tasks of recognizing objects in pictures or patterns and also on NLP [46]. The technique works like a spotlight that shines on the important parts of the data, making it easier for the model to do its job well. They are inspired by how humans pay attention to things, and they help the models perform better and make their decisions more understandable. Attention mechanisms have not been widely utilized as an approach for explainability in medical imaging, particularly in the context of COVID-19 diagnosis so far. In [16], authors employed XAI techniques for medical imaging in their study on classifying melanoma skin cancer images.
The attention mechanism is like a spotlight for a transformer model. It helps the model focus on important parts of the input while ignoring less relevant ones. Here is how it works: First, the input is broken down into pieces, like words in a sentence or patches in an image. Then, the model learns three things for each piece: what to look for (query), what to compare it to (key), and what information to gather (value). The model calculates how similar each piece is to the query. This similarity score determines how much attention the model gives to each piece. After that, the model uses these scores to decide how much importance each piece gets. Finally, it combines all the information from the pieces, giving more weight to the ones that are most relevant to the query. So, the attention mechanism helps the model focus on what matters most for the task it is doing [47,48].
To gain insights into the extracted features and explore the clustering patterns within the extracted features, we employed t-SNE, a widespread dimensionality reduction technique. t-SNE is suitable for visualizing high-dimensional data by mapping them into a lower-dimensional space while preserving their local relationships [49]. In this experiment, t-SNE was utilized to the extracted features obtained from the models used in the experiment to visualize the features. This visualization allowed us to assess the separability of different classes and identify any inherent clustering patterns within the dataset. The t-SNE embedding served as a valuable tool for understanding the relationships and distributions of the extracted features.
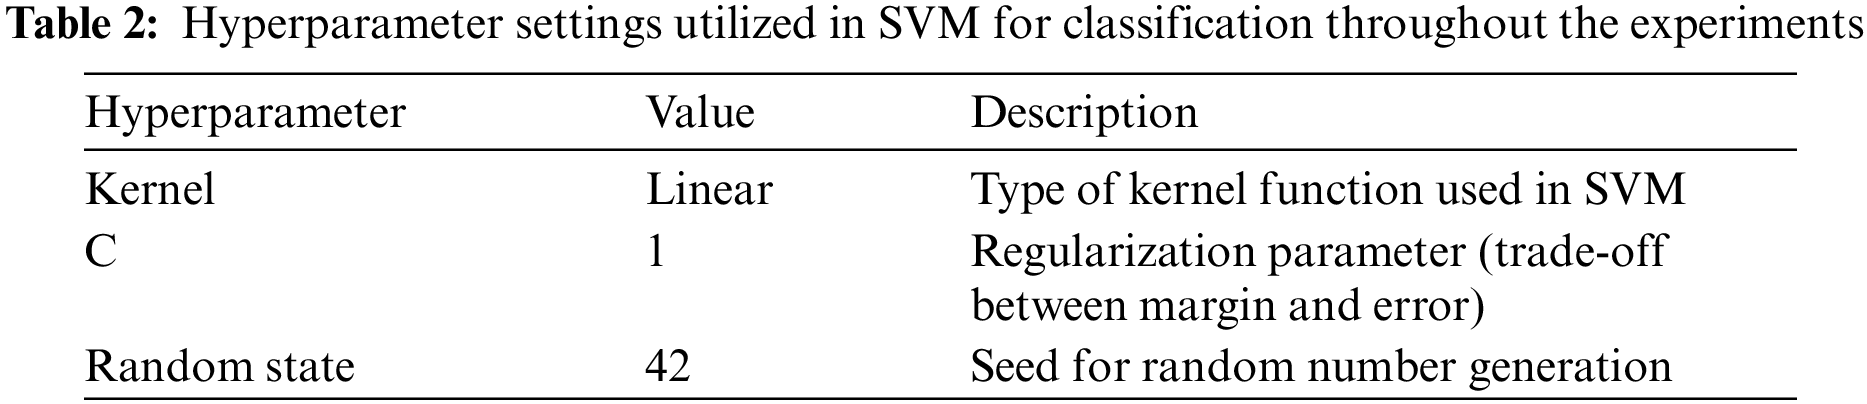
A linear kernel and SVM are used for the classification problem, and the utilization of hyper-plane performs well for linearly separable data [50,51]. SVM employs a technique known as the kernel trick to handle the classification of linearly inseparable data as mentioned in Table 2 below. The linear kernel computes the dot product between the feature vectors, which measures the similarity or dissimilarity between them. It establishes a linear decision boundary within the feature space, rendering it appropriate for datasets that are linearly separable mathematically in Eq. (2).
In 2015, Szegedy and his team introduced InceptionV3 [52]. The Inception Module is the key component of this network, characterized by its distinct features. It incorporates convolutions of different sizes, such as 1 × 1, 3 × 3, and 5 × 5.
To extract informative features from the preprocessed CXIs, the VGG16 model was applied, a widely used CNN architecture known for its excellent performance in image classification tasks. The VGG16 model, pre-trained on large-scale image datasets, has shown remarkable capability in learning hierarchical representations of images [53]. By utilizing transfer learning, the pre-trained weights of the VGG16 model removed the fully connected layers, transforming them into a feature extractor.
The VGG19 model is a DCNN that builds upon the architecture of VGG16 with 16 and 3, convolutional layers and FCL, respectively. The pre-trained VGG19 model is utilized for extracting the features from the preprocessed images of the hybrid dataset. During training, the pre-trained weights of the VGG19 model were frozen, and only the newly added layer was trained to extract features from the CXIs. The extracted high-level features from the model were then used as inputs to train and evaluate the subsequent DL model also used to train the COVID-19 [54]. This utilization of the VGG19 model allowed us to explore its potential for feature extraction and its impact on the performance of our classification task using SVM.
7 Experiment and Performance Evaluation
Colab (Google Colaboratory) is a free feature, it uses with the help of Jupyter for ML implementation in research [35,36]. Python 3 is embedded in Jupiter Notebook, along with important ML libraries. This eliminates the requirement for local installation ensures a hassle-free environment, and supports full flash implementation of DL, including GPU acceleration.
7.2 Performance Evaluation Method
This section presents a comprehensive analysis of the evolving performance metrics, encompassing accuracy (Acc), recall (Rec), F1-score (F1), and precision (Prec), to assess the efficacy of the proposed methodology which is given in Eqs. (3)–(6), respectively. These metrics serve as essential benchmarks in evaluating the model’s ability to accurately classify and characterize the underlying data patterns.
To further assess the effectiveness of our DL models, a confusion matrix was employed. A confusion matrix is a tabular representation that summarizes the predicted and actual class labels of a classification model which provides valuable insights into the model’s performance by quantifying the number of true positives (TP), true negatives (TN), false positives (FP), and false negatives (FN). This analysis provided a more comprehensive understanding of the model’s strengths and weaknesses in correctly classifying Normal, Pneumonia, and COVID-19 cases. By visualizing the confusion matrices, valuable insights into the models’ performance and identified any specific patterns or challenges in their predictions, enabling us to make informed decisions for further model improvement and optimization.
Four different target approaches were used to evaluate the three DL pre-trained models as shown in Table 3 below.
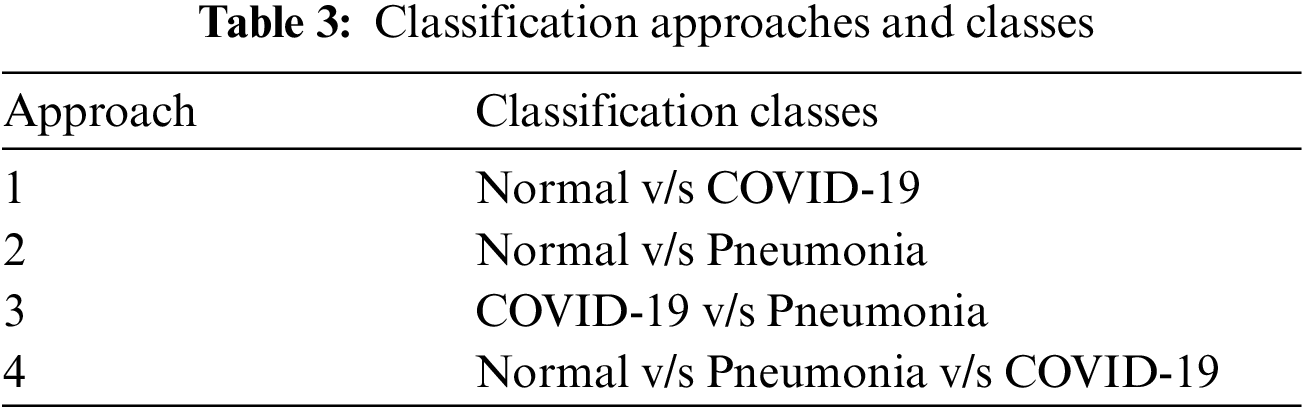
In all experiments mentioned in Table 3 image data are divided into two parts: 80% was used to teach the model how to recognize patterns, and the remaining 20% was saved to check how well it learned. However, this same split every time to run the experiments. You can find the code we used to do this by clicking the provided link in the end of the article.
In first step features was extracted using the state-of-art previously trained models and extracted features was visualized using the t-SNE embedding techniques as discussed earlier in the for better understanding of the extracted features. Fig. 7 shows the t-SNE embedding using extracted features from InceptionV3, Fig. 8 shows the results of VGG16 and Fig. 9 shows the results of VGG19.
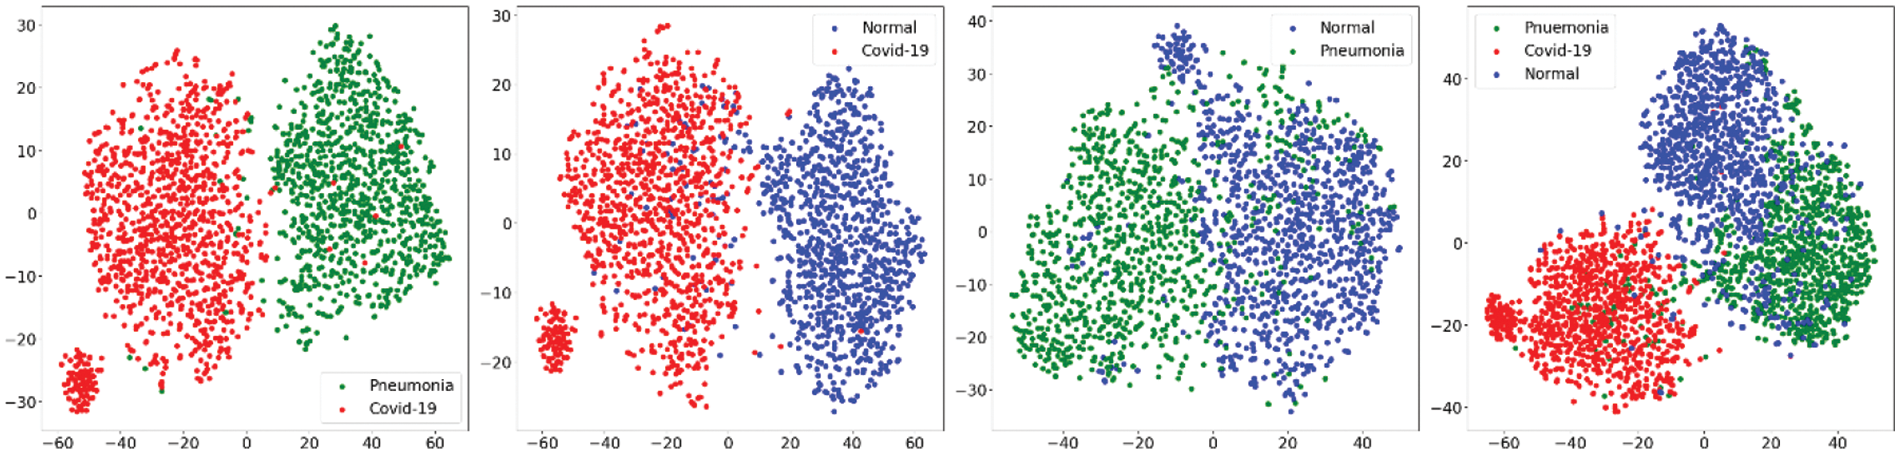
Figure 7: t-SNE visualizing the high-dimensional features extracted by the InceptionV3
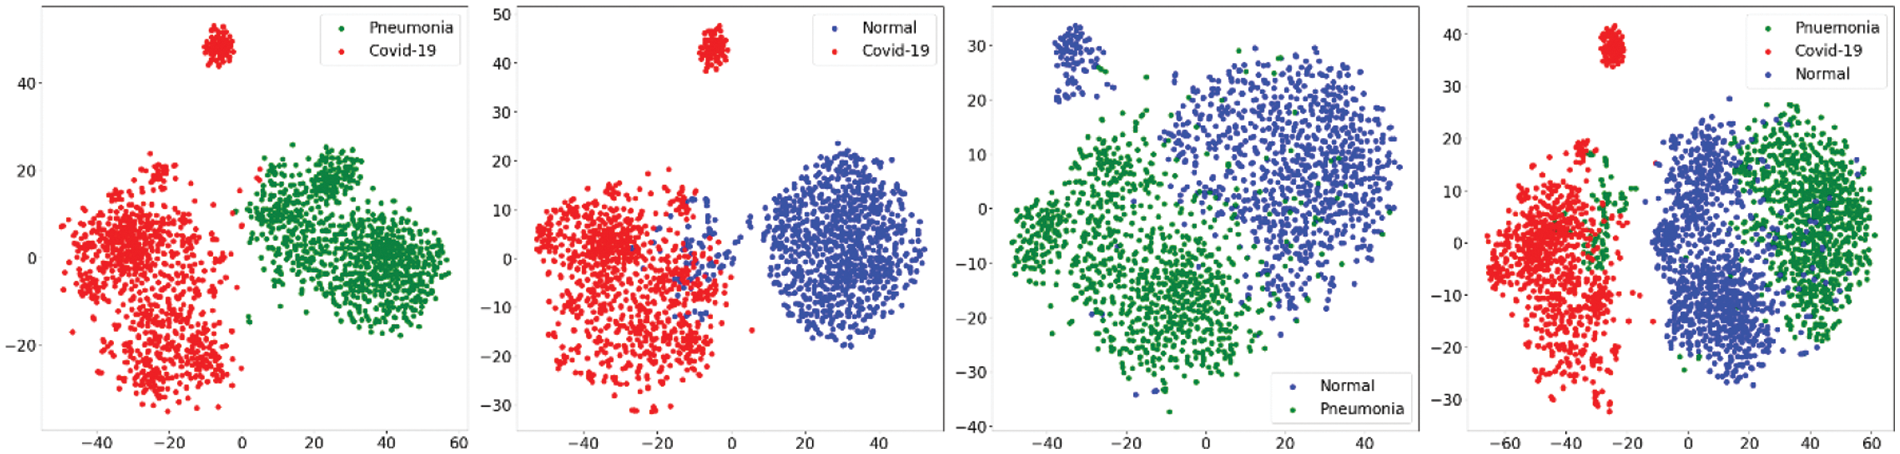
Figure 8: t-SNE embedding visualizing the high-dimensional features extracted by the VGG16
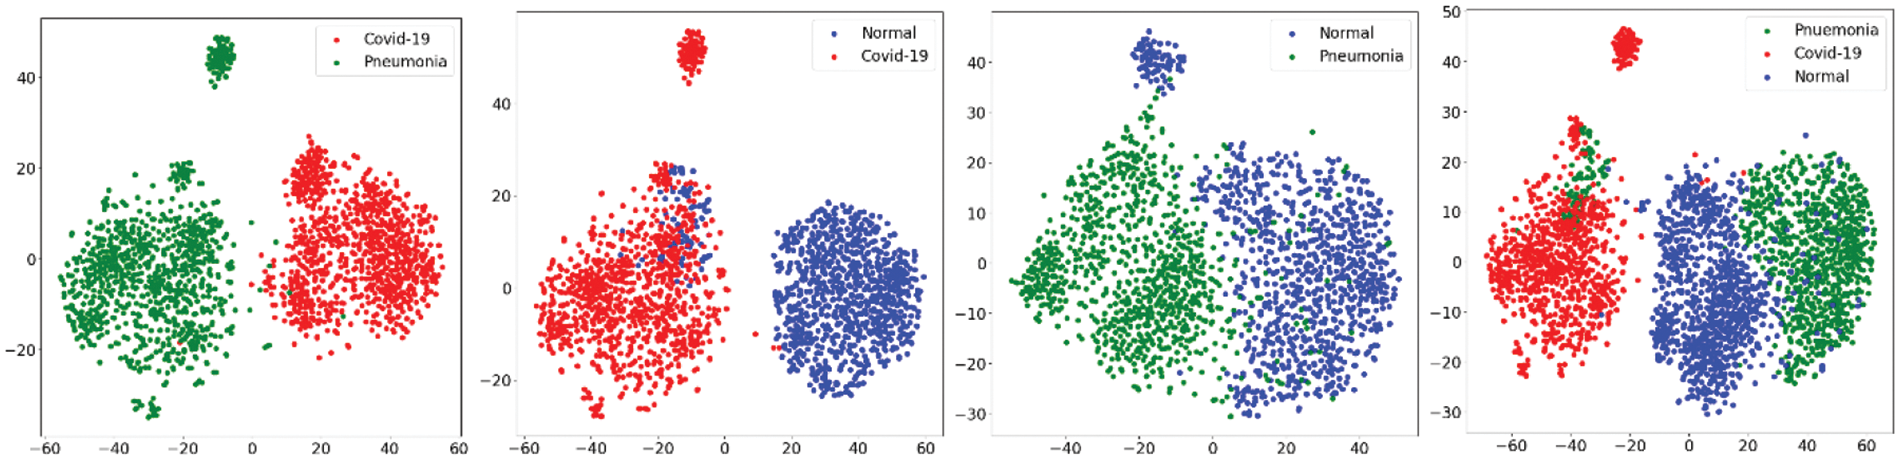
Figure 9: t-SNE embedding visualizing the high-dimensional features extracted by the VGG19
7.5 Model Performance Evaluation with State-of-the-Art Pre-Trained Models
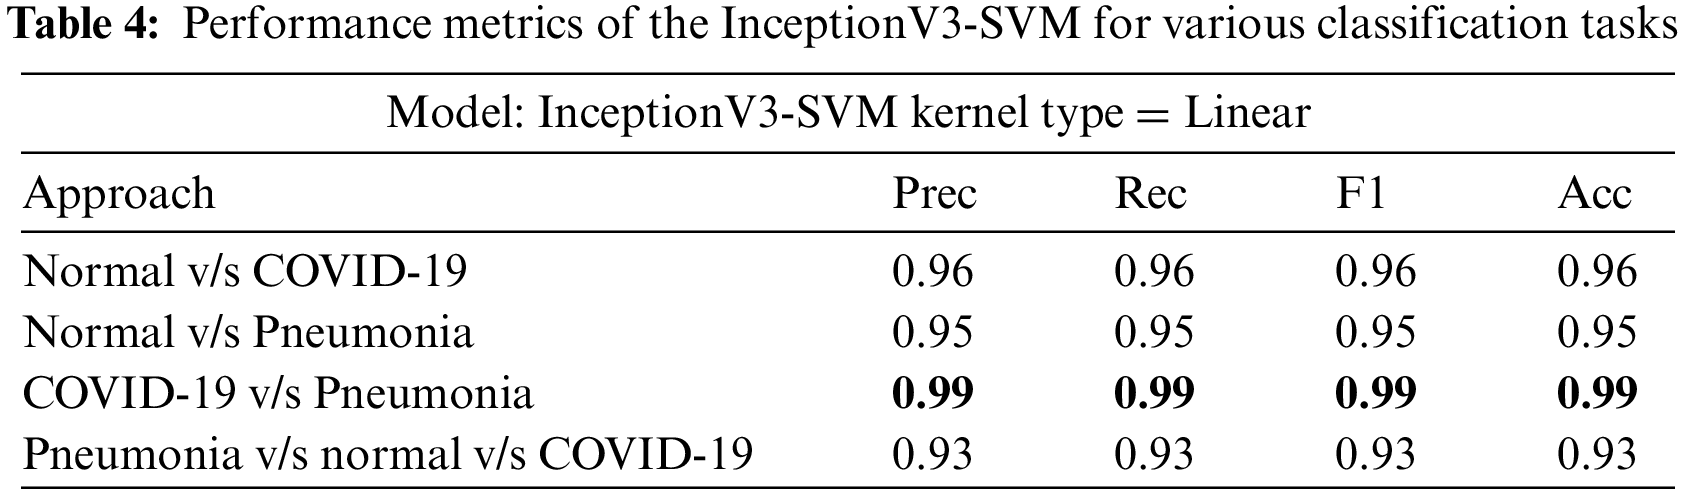
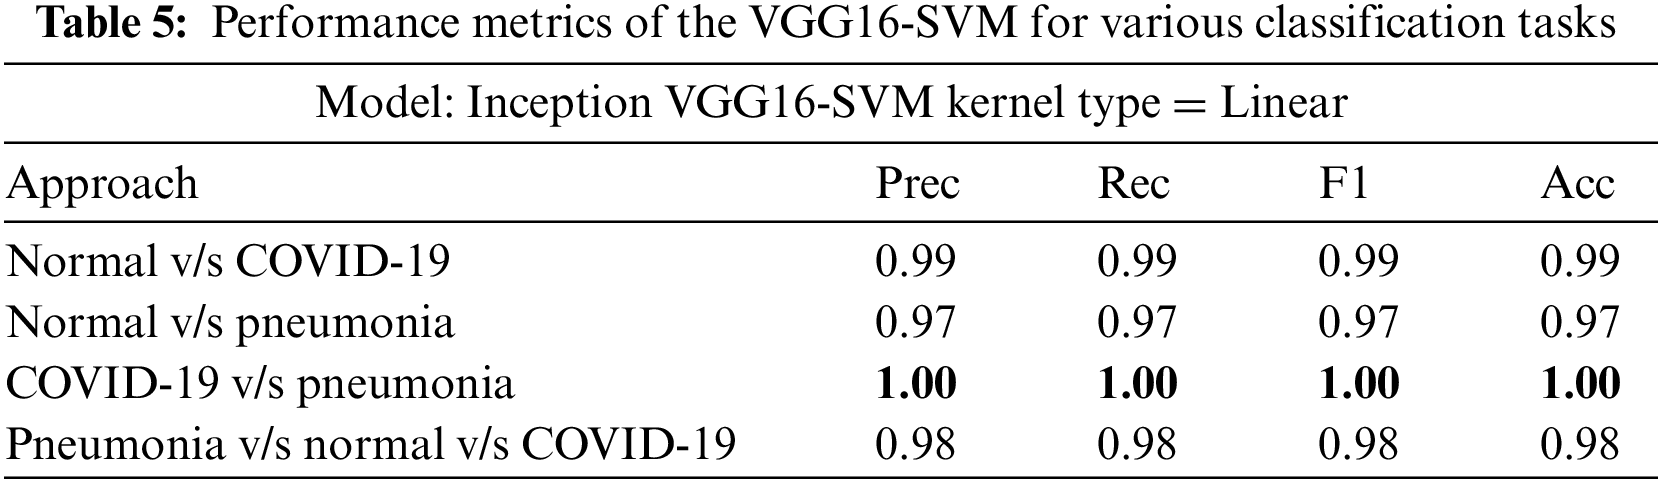
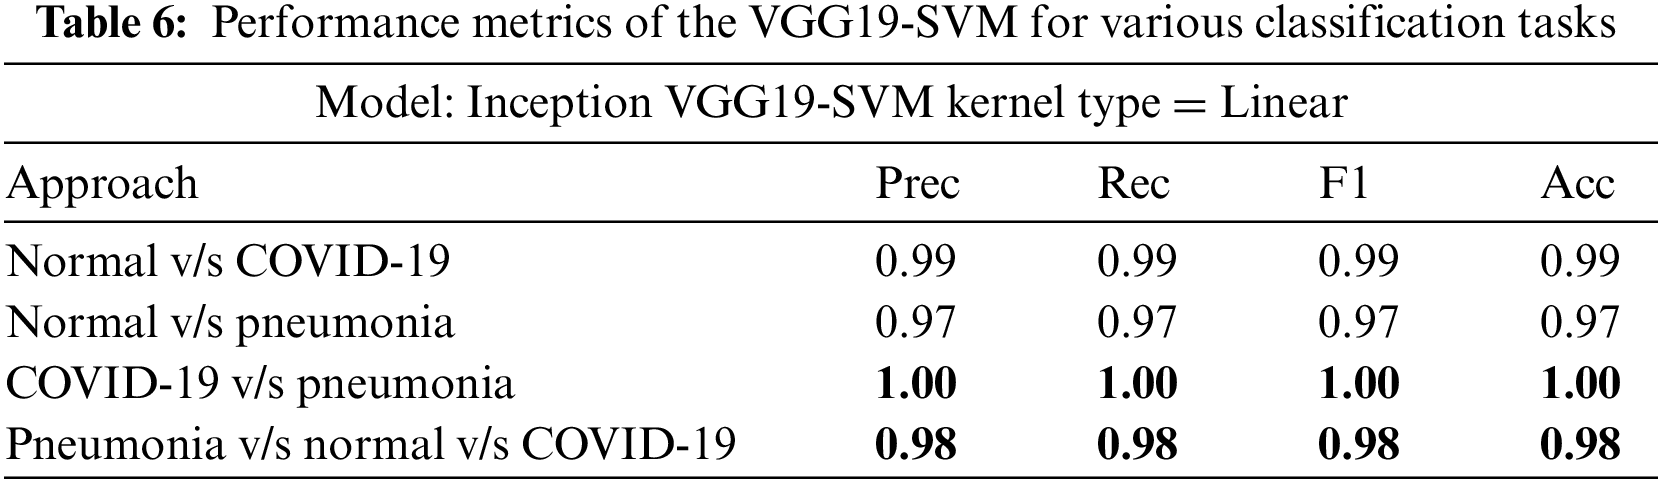
InceptionV3, VGG16, and VGG19 were evaluated on four classification tasks on different approaches mentioned in Table 3. The highlighted results in the table show the tasks where the models achieved the highest accuracy. Tables 4–6 show the performance evaluation results of the InceptionV3, VGG16, and VGG19 architecture with a linear SVM kernel, respectively. The model’s effectiveness is evaluated across four distinct classification tasks.
Figs. 10–12 illustrate the performance of the InceptionV3, VGG16, and VGG19 models, respectively, in classifying various medical conditions. Curves that closely approach the top-left corner indicate the superior ability of the model to distinguish between positive and negative cases.
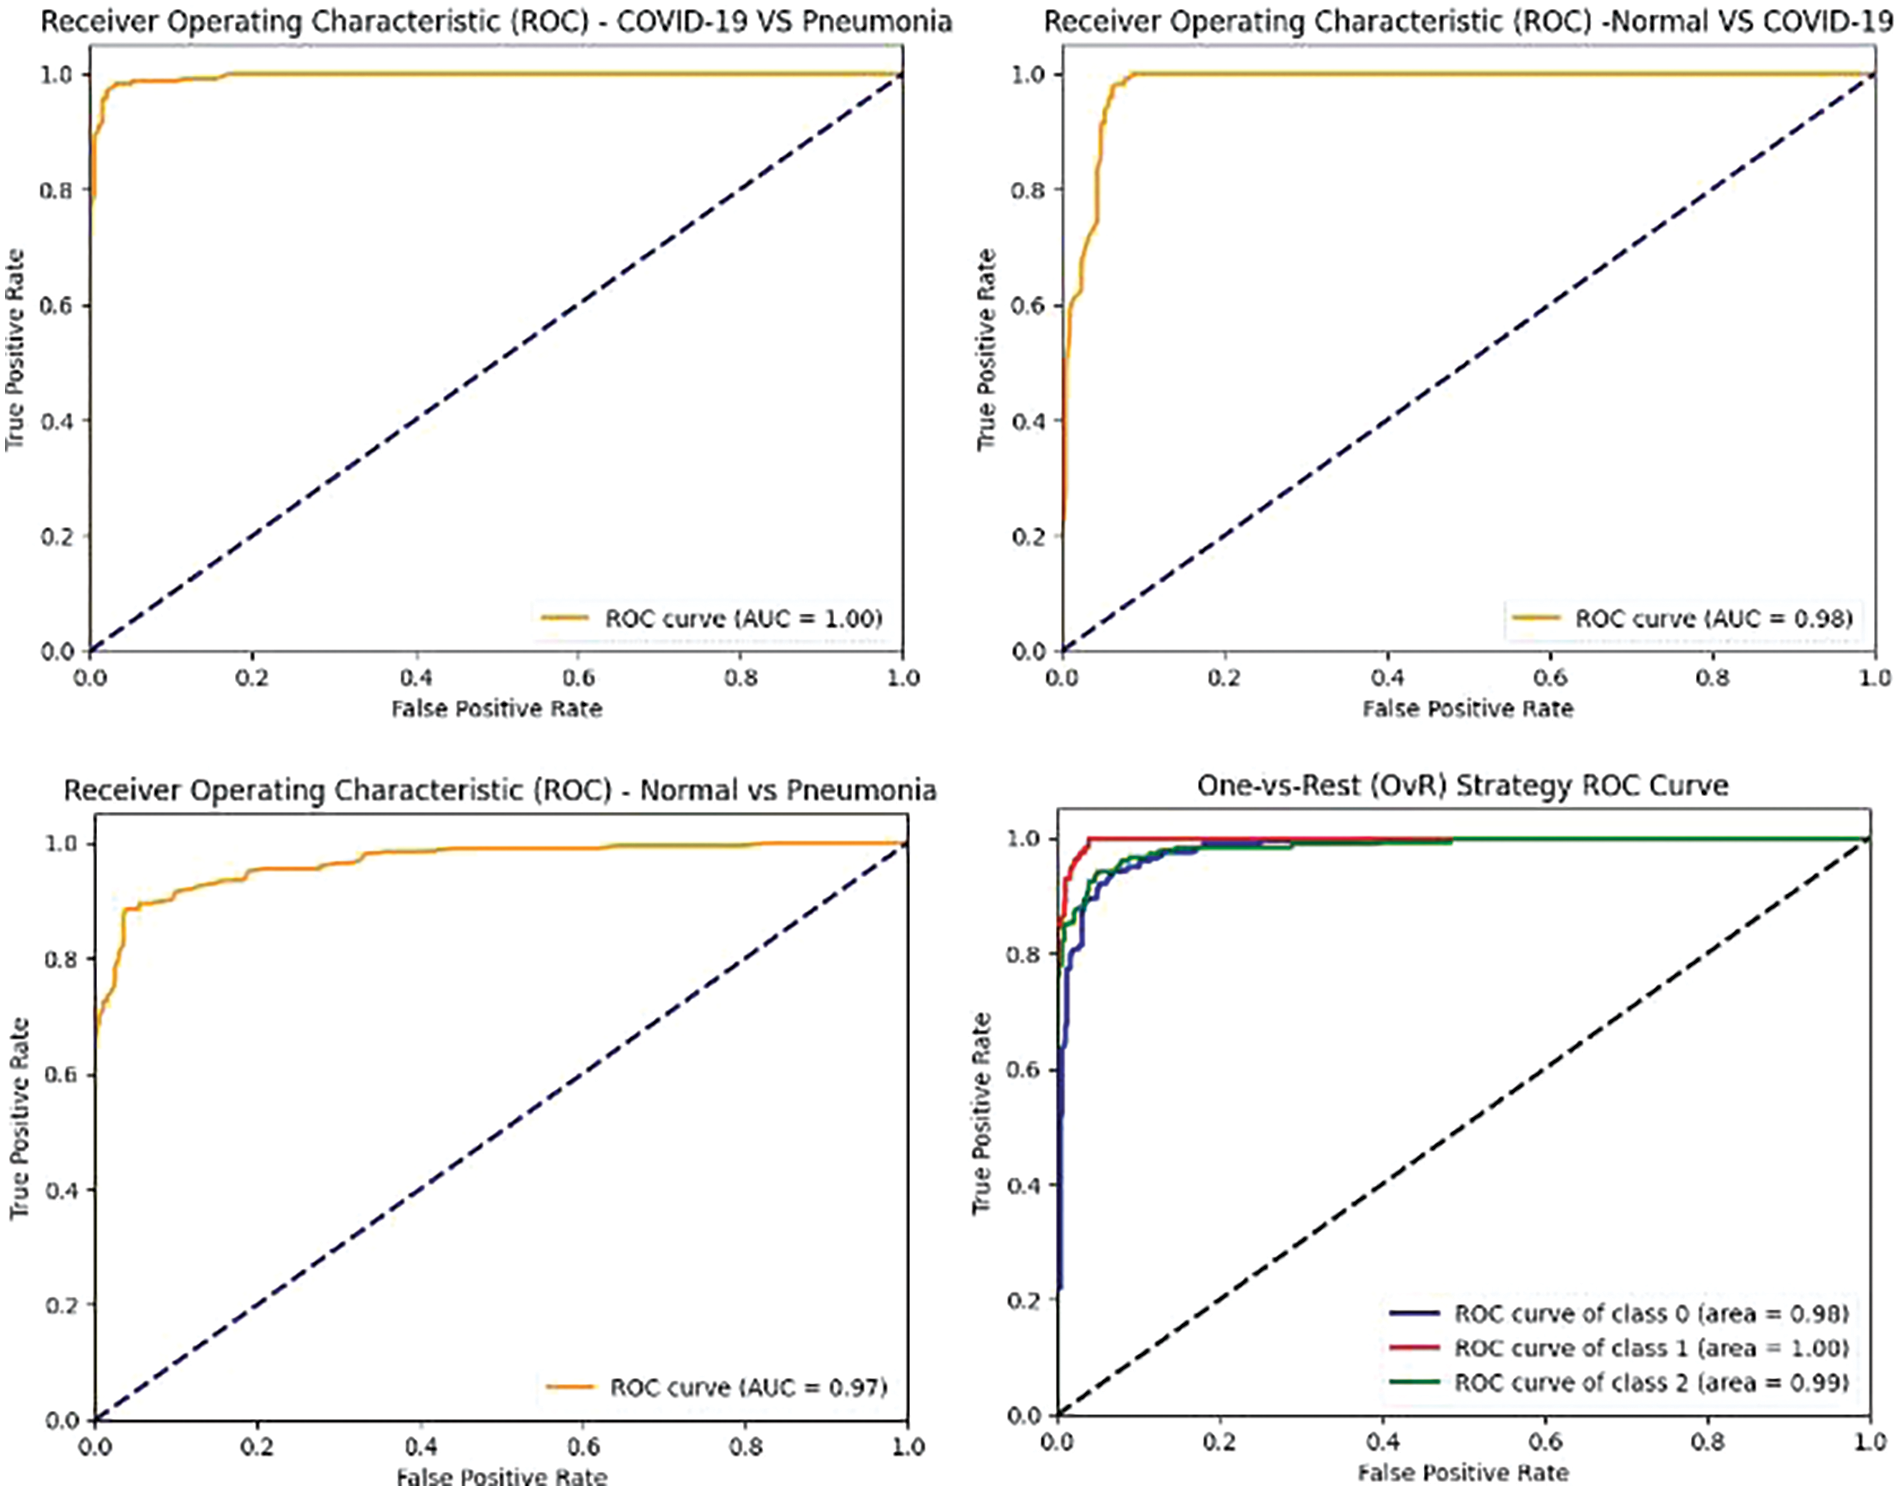
Figure 10: InceptionV3 model’s ROCAUC of all medical condition experiments

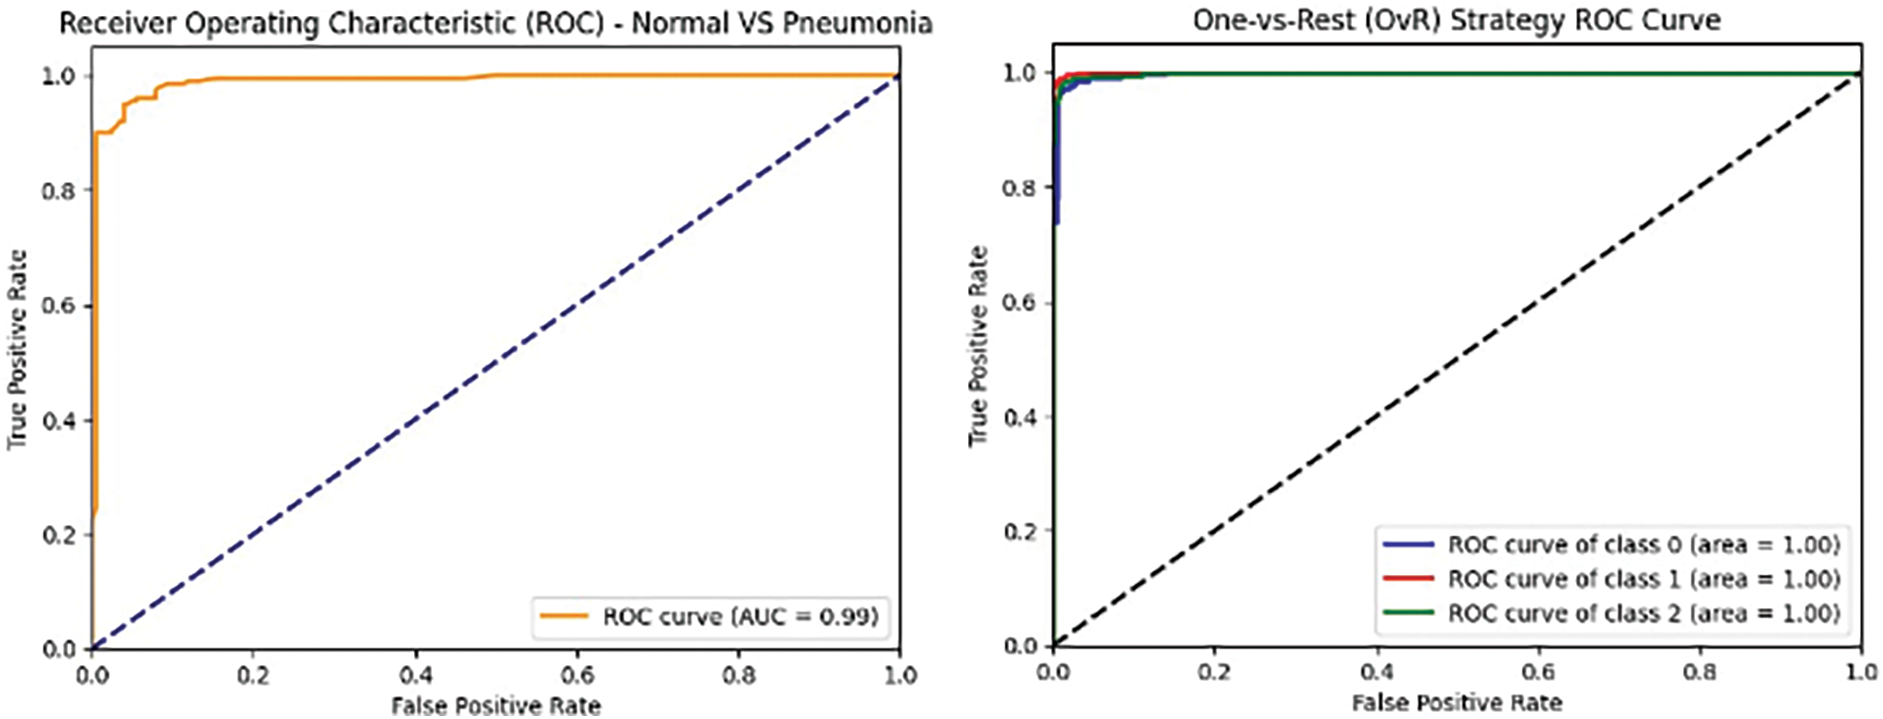
Figure 11: VGG16 model’s ROCAUC of all medical condition experiments
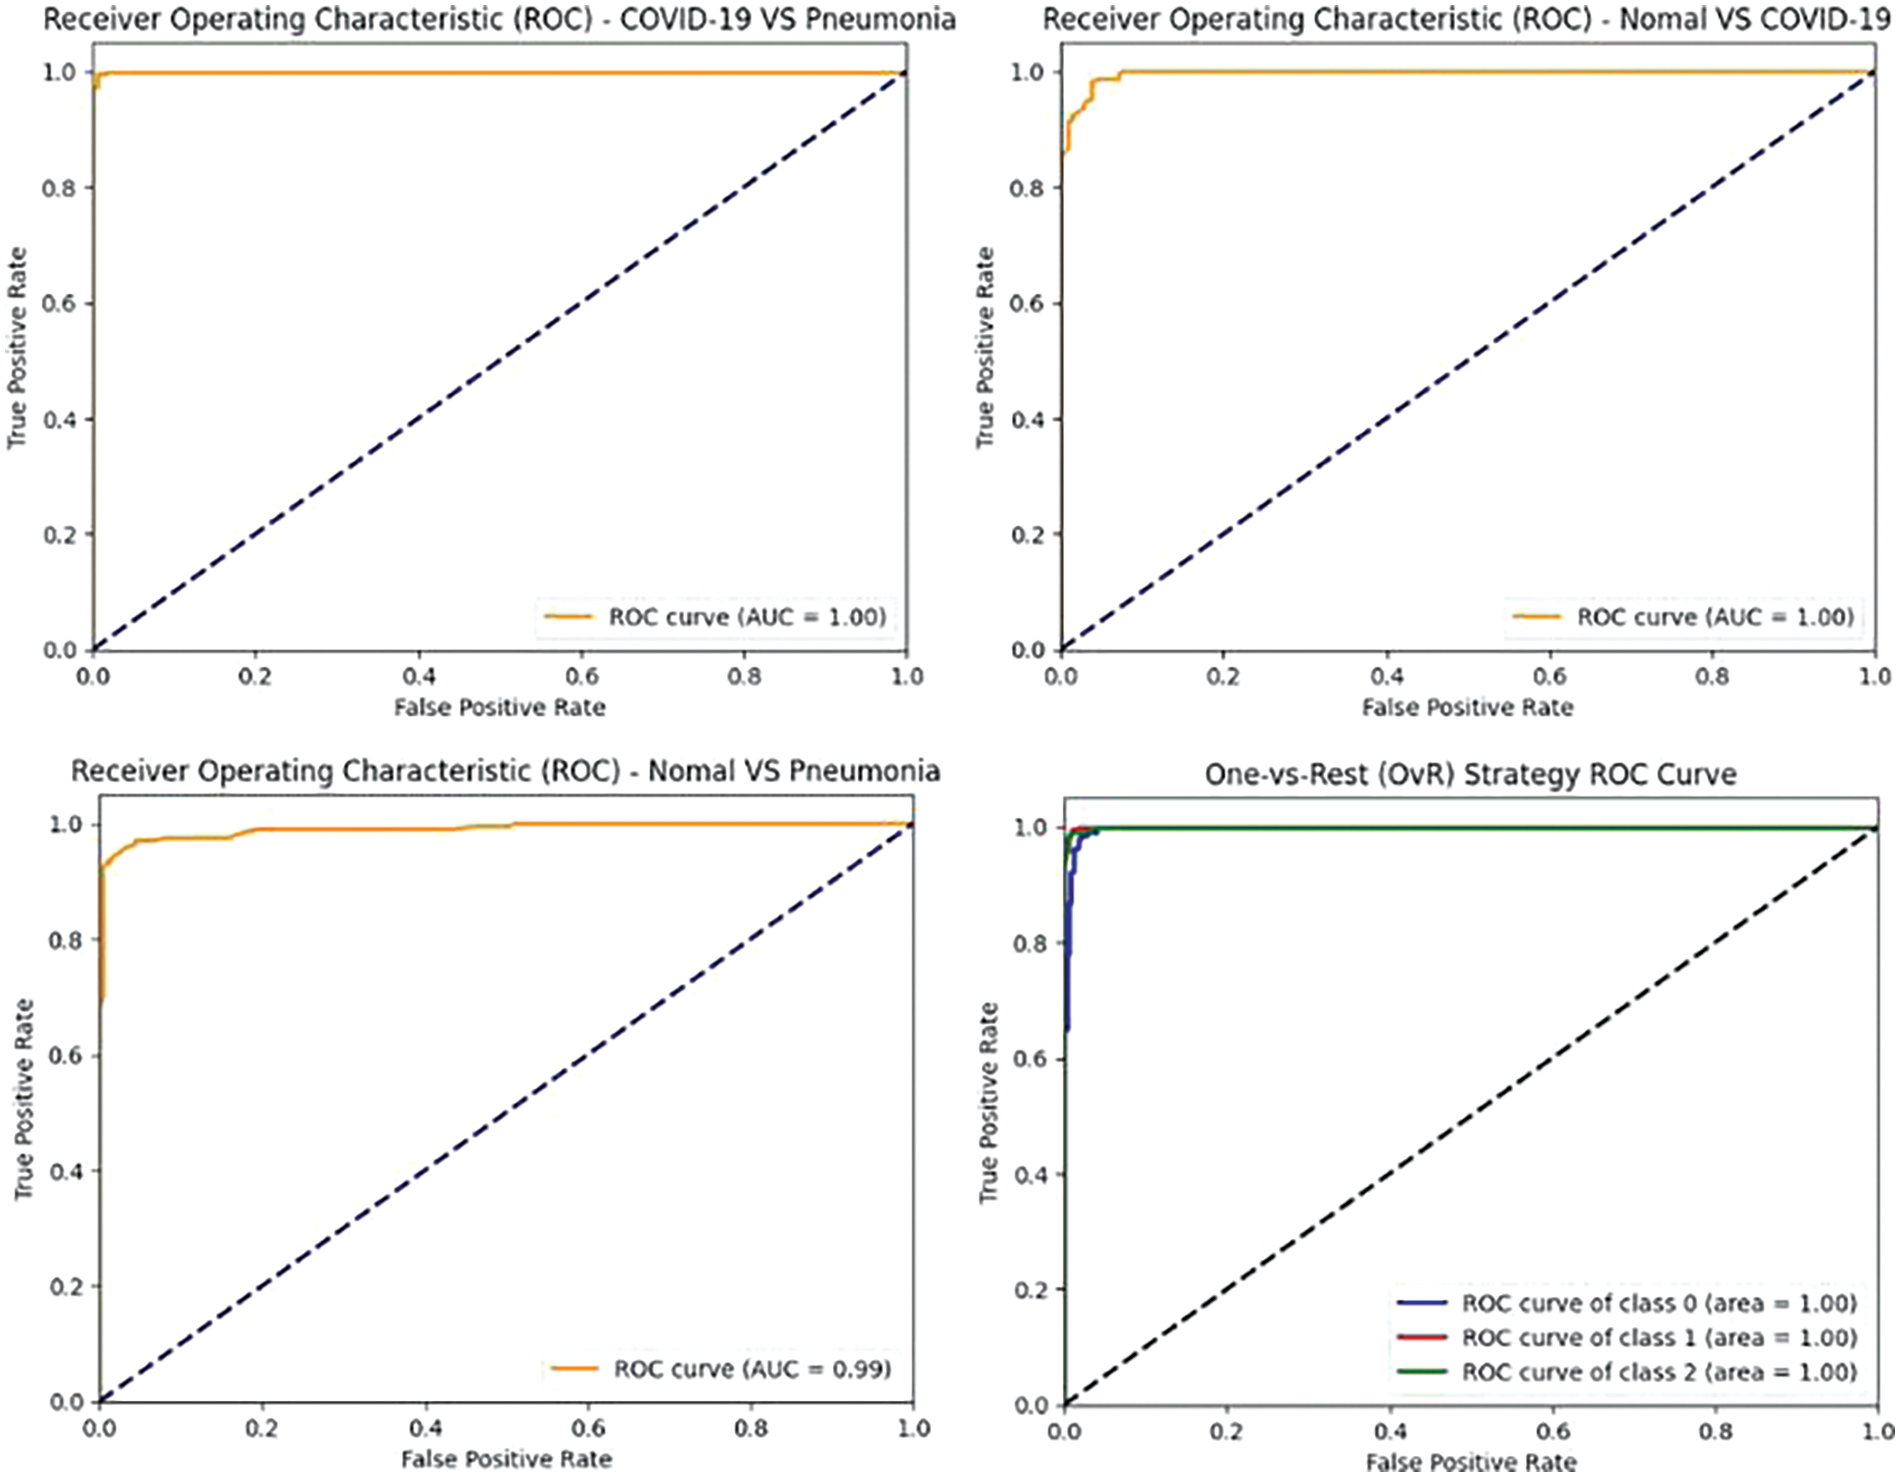
Figure 12: VGG19 model’s ROCAUC of all medical condition experiments
In the first approach, all three models achieved high accuracies, with InceptionV3 and VGG16 at 96% and VGG19 at 99%, demonstrating excellent performance in identifying Normal and COVID-19 cases. In the second approach, accuracies ranged from 95% (InceptionV3) to 97% (VGG16 and VGG19), effectively distinguishing Normal and Pneumonia cases. For classifying COVID-19 vs. Pneumonia, all models achieved perfect accuracy (100%). In the last approach, accuracies ranged from 93% (InceptionV3) to 98% (VGG16 and VGG19), showcasing effectiveness in multi-class classification. The precision, recall, and F1-scores were consistently high across all approaches. Figs. 13–15 show the confusion matrices for the various runs, detailing the models’ classification performance.
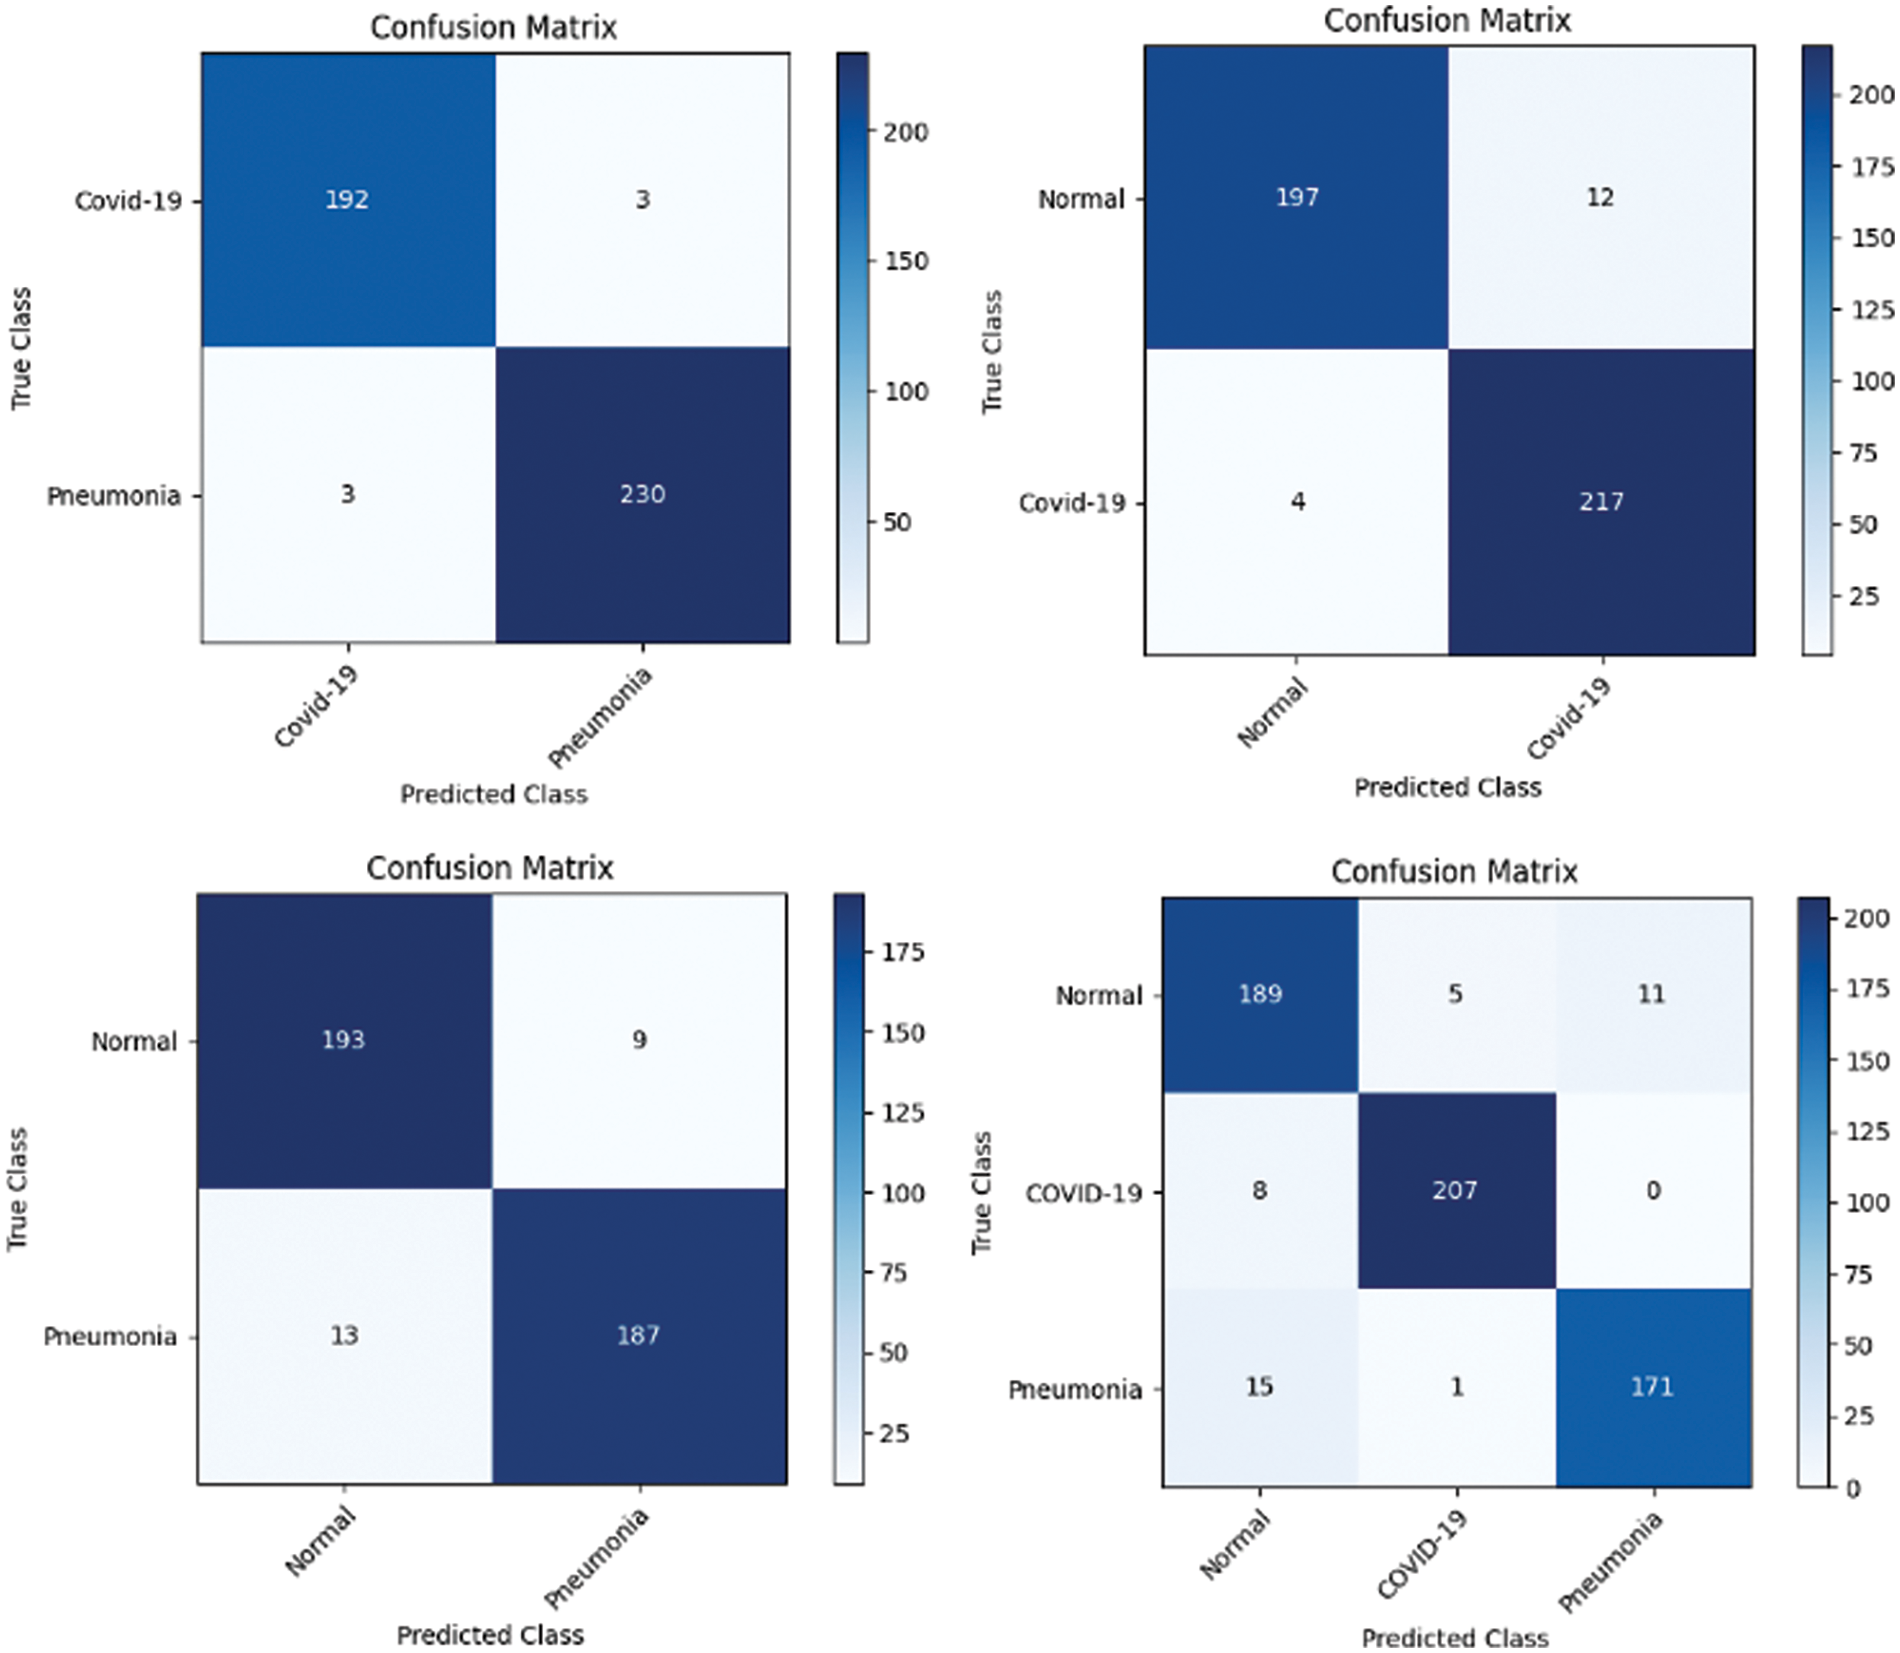
Figure 13: Confusion matrix obtained using InceptionV3 and SVM using linear kernel
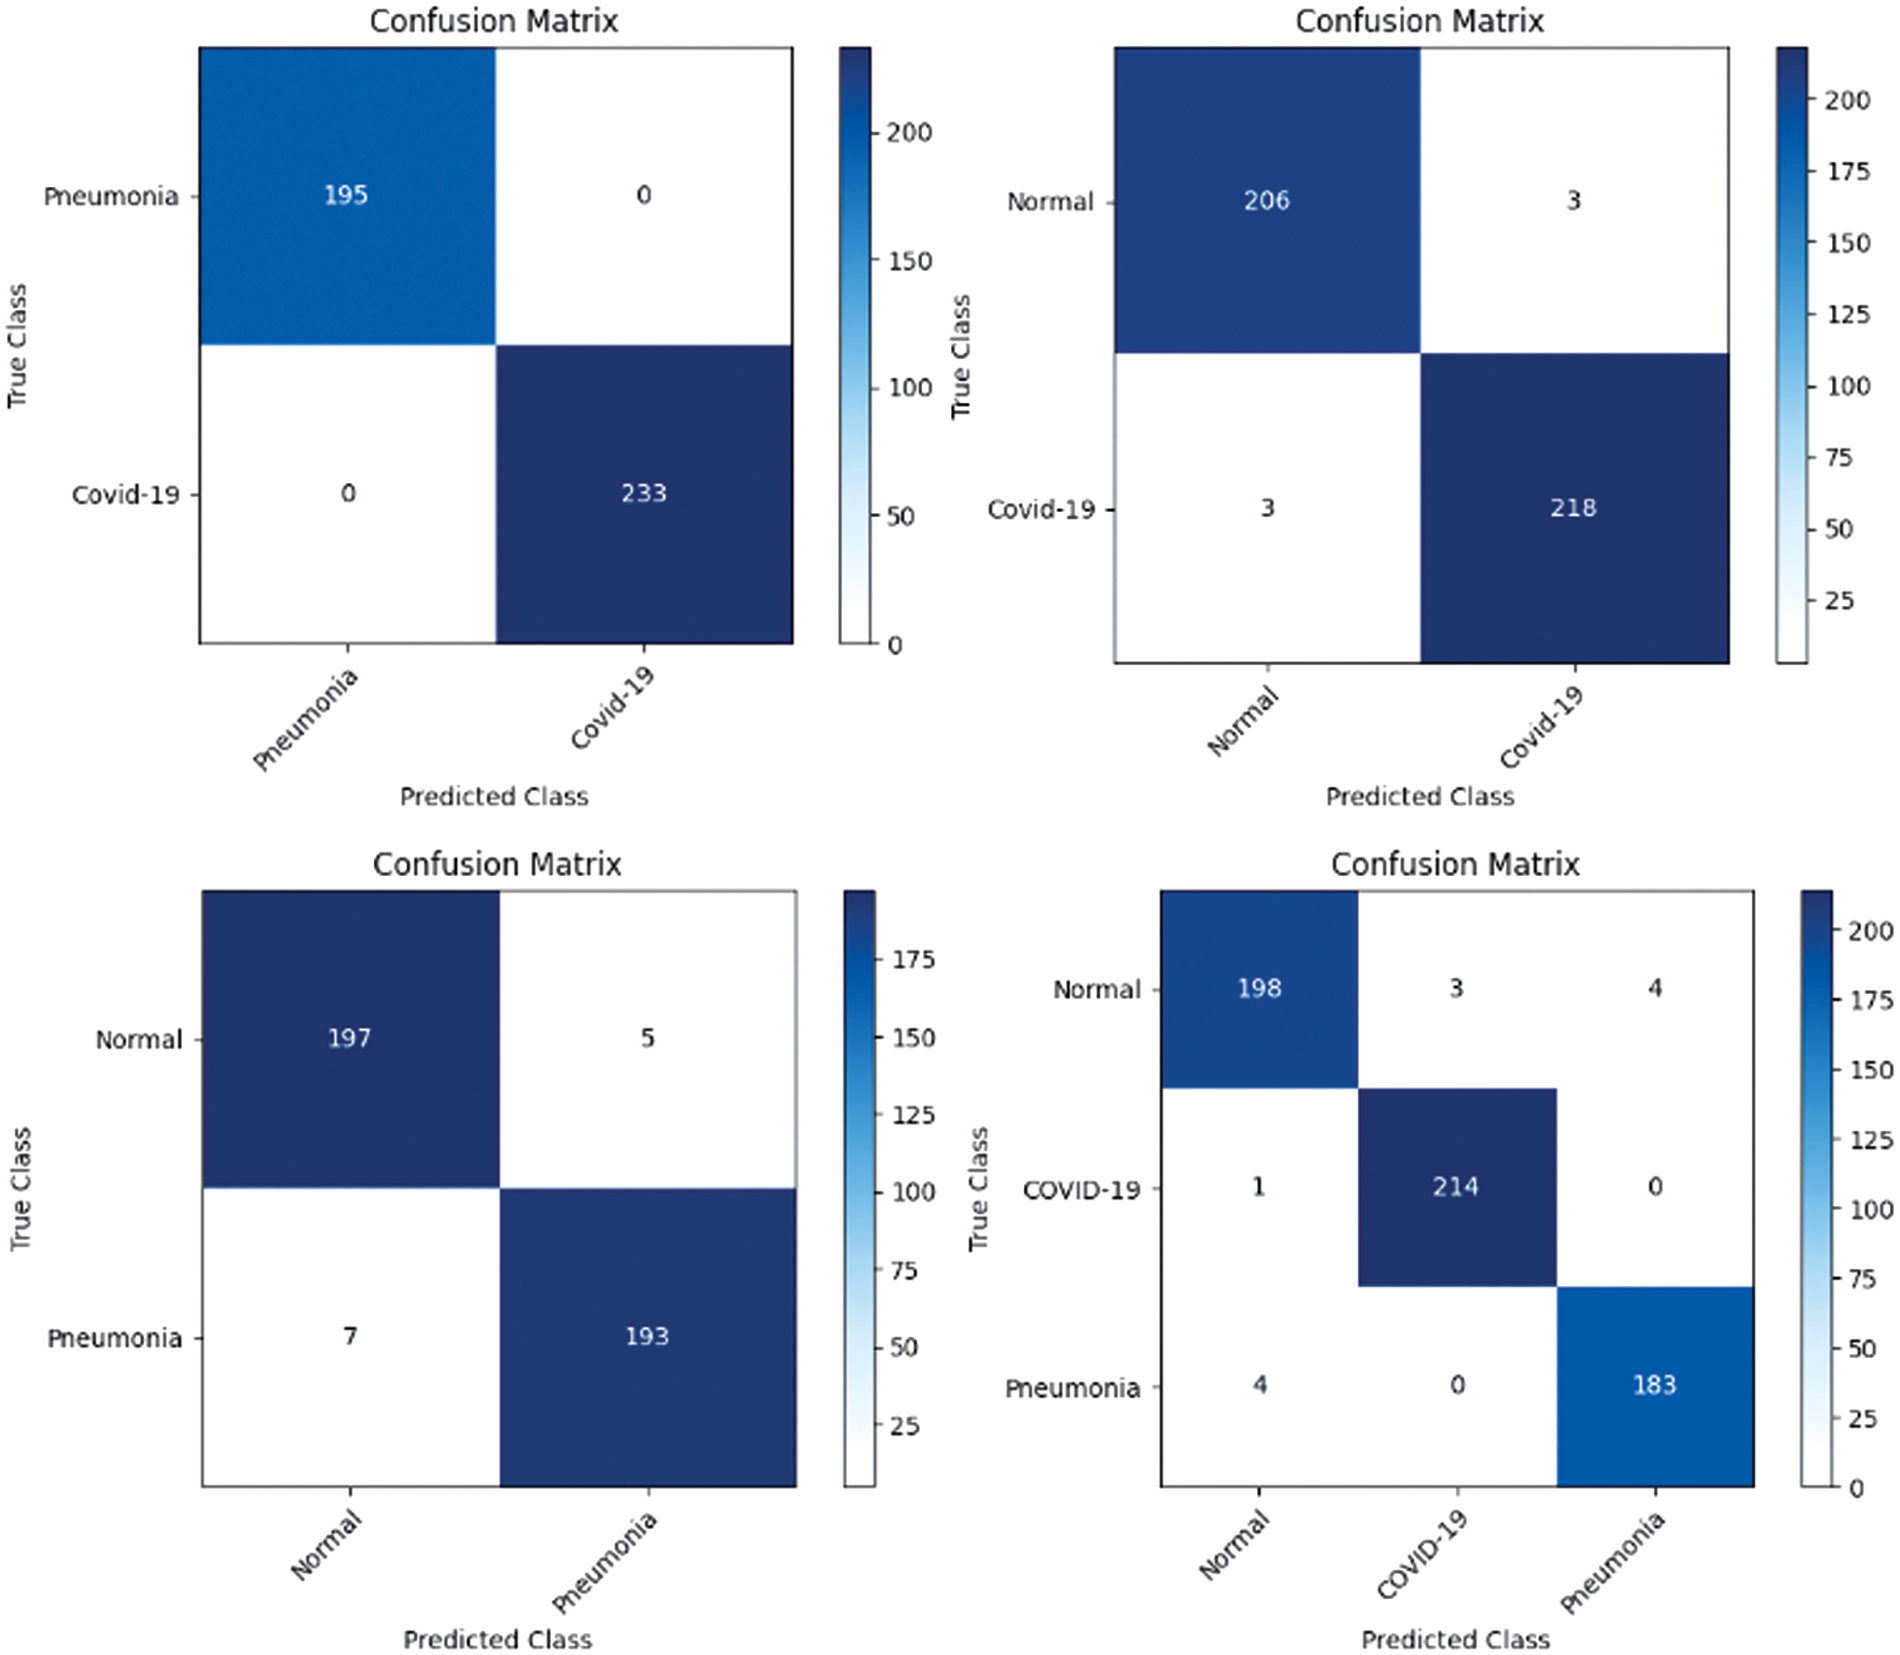
Figure 14: Confusion matrix obtained using VGG16 and SVM using linear kernel
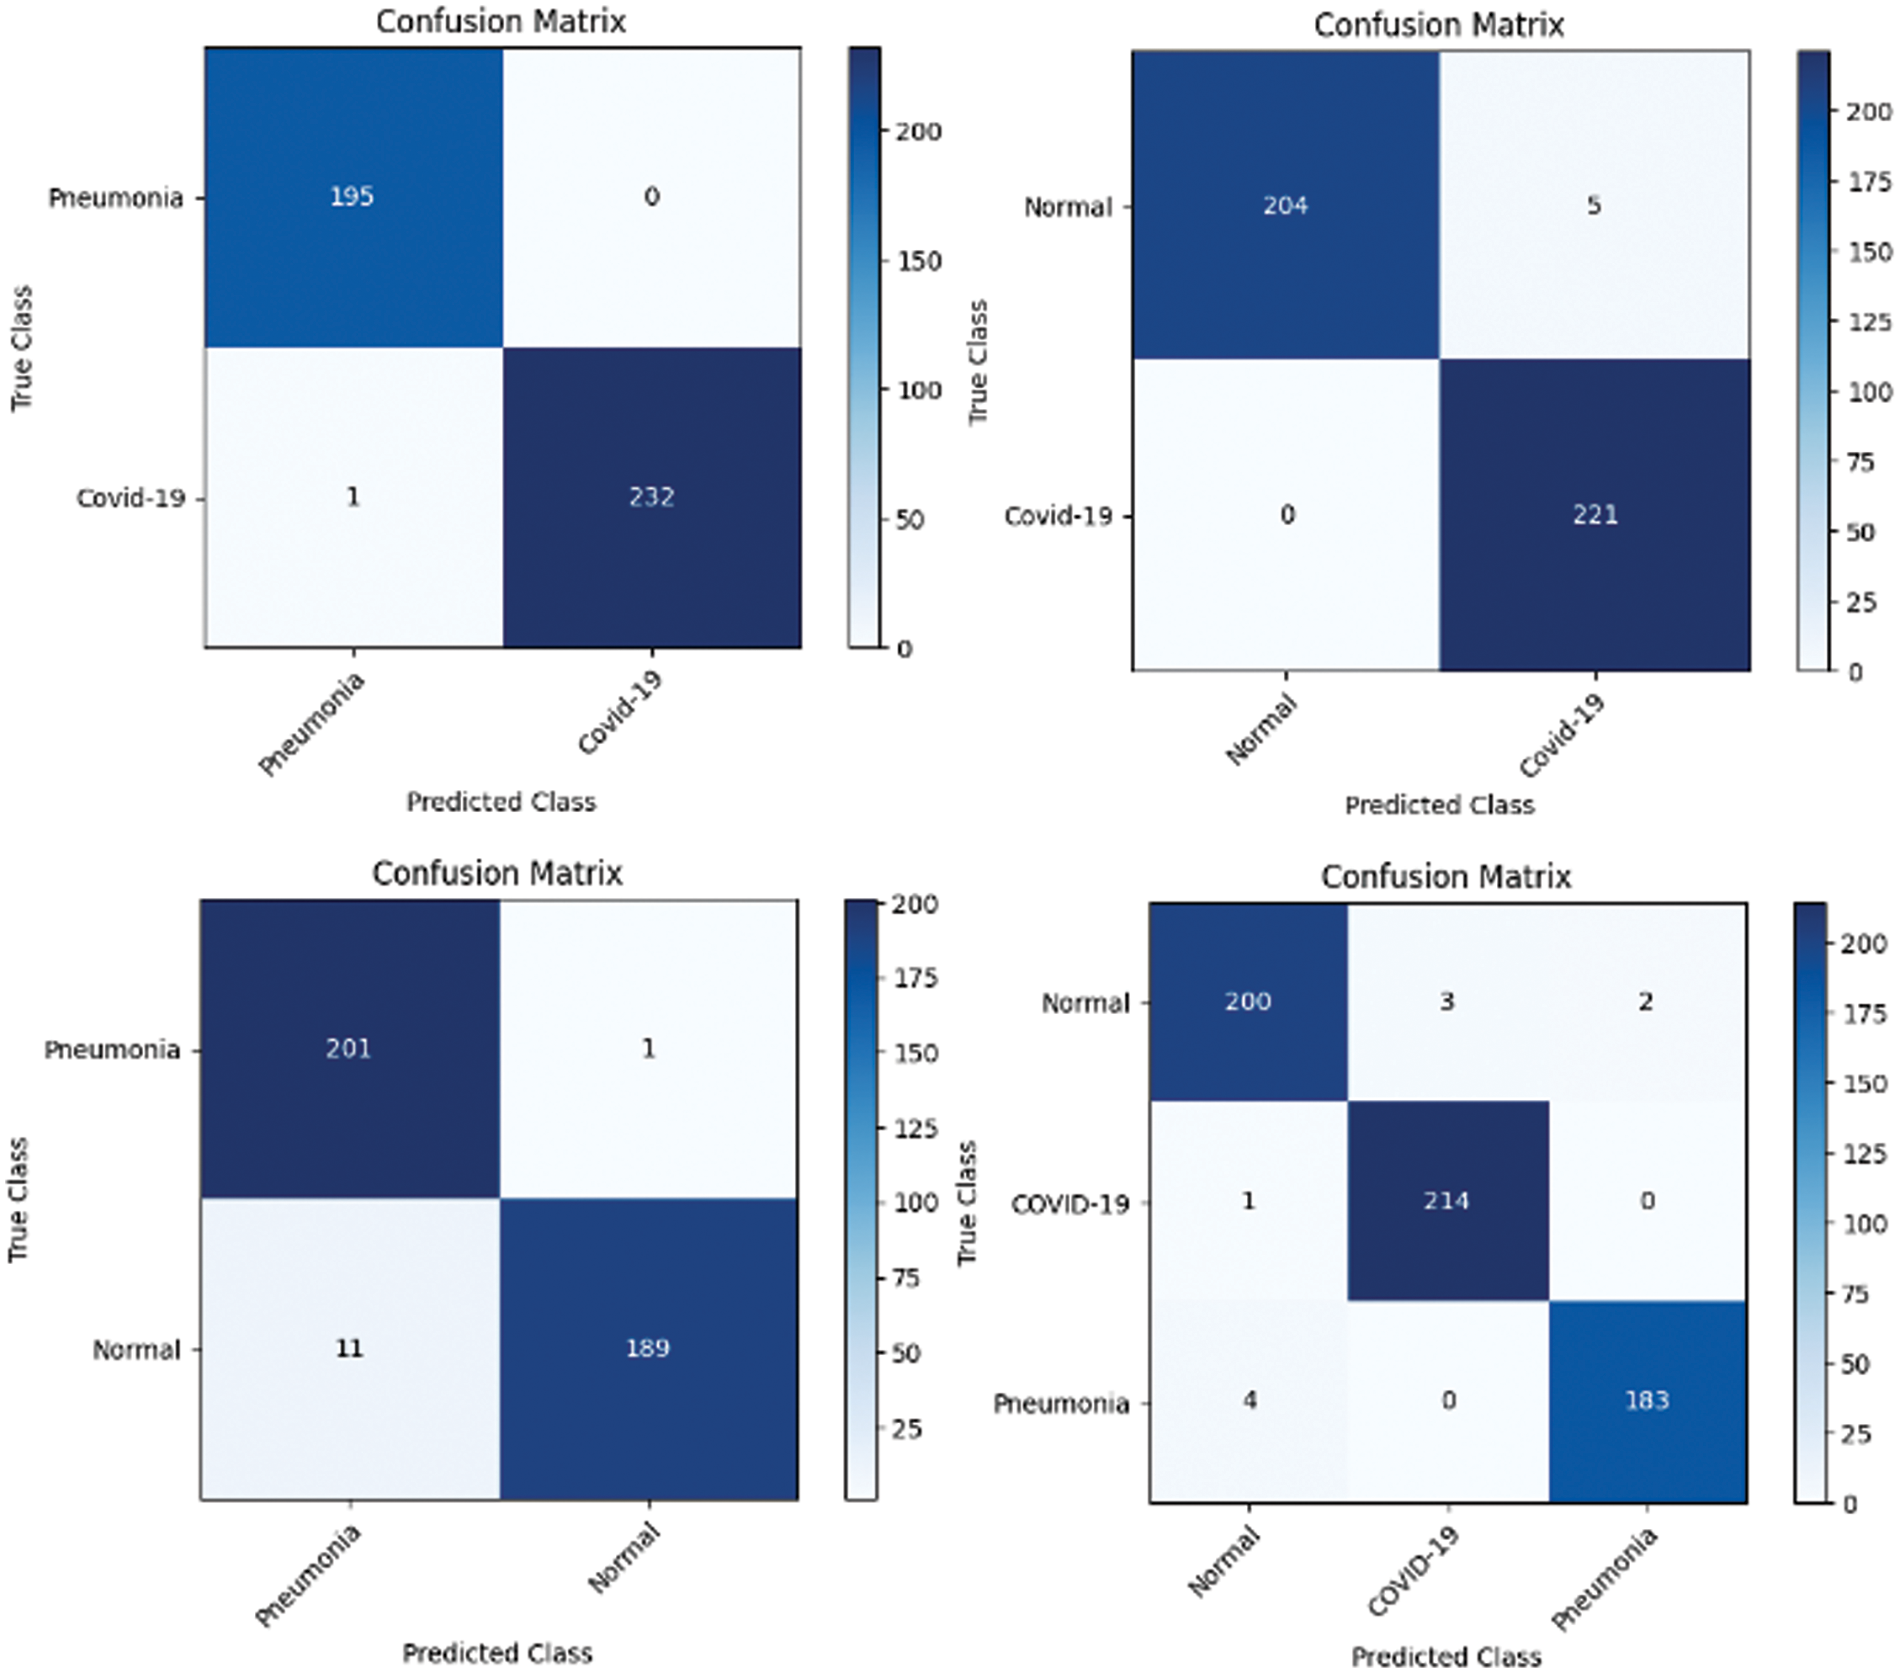
Figure 15: Confusion matrix obtained using VGG19 and SVM using linear kernel
The findings in the experiments demonstrate that these models exhibit robust performance without showing signs of overfitting. This can be attributed to several technical factors.
1. The CNN architectures provide effective feature representation, capturing relevant patterns in the input data while avoiding noise.
2. The use of a linear kernel promotes simplicity in decision boundaries, preventing excessive complexity that could lead to overfitting.
3. The incorporation of regularization mechanisms within the SVM framework further aids in preventing overfitting by penalizing overly complex models.
4. Also, the balanced representation of classes ensures that the models learn effectively from all categories, contributing to their generalization ability.
5. The models underwent thorough cross-validation and hyperparameter tuning of SVM, ensuring their performance consistency across different subsets of the data and mitigating the risk of overfitting. These technical factors collectively contribute to the robustness of the SVM models and their ability to generalize well to unseen data.
In this section, we present our methodology for enhancing the interpretability and trustworthiness of the AI system utilized in this study. Initially as mentioned in earlier section, a state-of-the-art pre-trained DL model, leveraging its powerful feature extraction capabilities. To gain insight into the underlying structure of these features. To sustain confidence in the AI model’s decision-making process, we integrated an Attention Mechanism typically utilized in NLP tasks, but this study’s innovation lies in the application of Attention Mechanism to CXIs, shedding light on how the AI system identifies various chest disorders.
Experiment was performed by selecting four CXIs and presenting their corresponding attention weight distribution graphs. These graphs represent the relationship between pixel indices along the x-axis and attention weights along the y-axis, offering insights into which regions of the images the AI model focuses on during its analysis. In the attention mechanism in figures below from Figs. 16 to 27red color indicates regions of the CXIs that the model considers to be most important or in other words consider relevant for making predictions according to the mentioned classes.
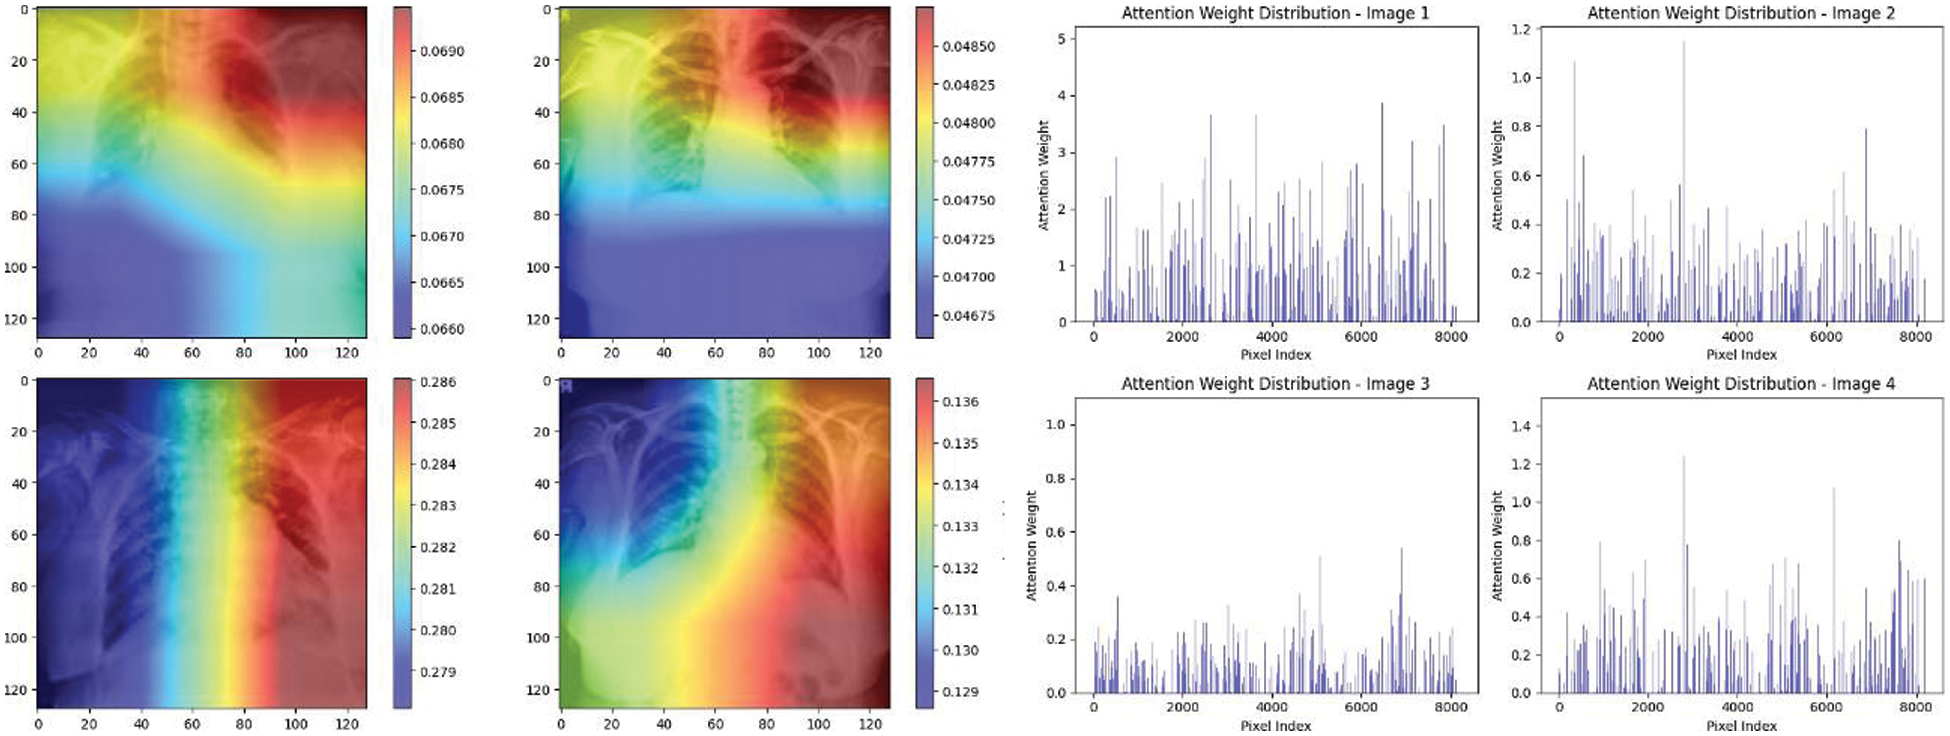
Figure 16: Attention mechanism to visualize the InceptionV3 (COVID-19 vs. pneumonia)
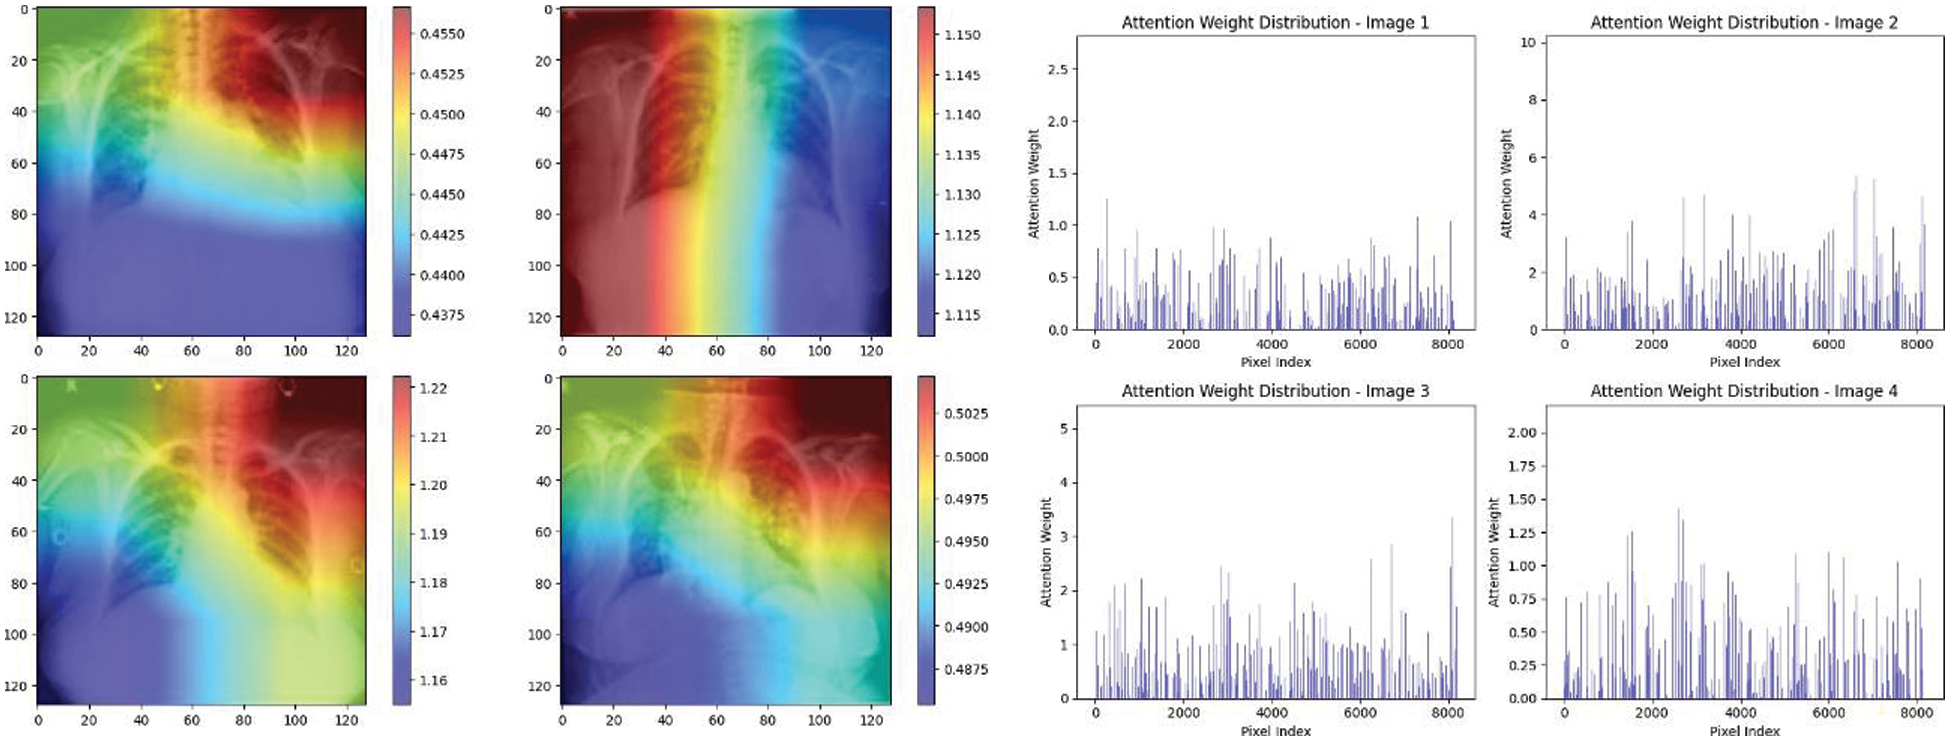
Figure 17: Attention mechanism to visualize the InceptionV3 (Normal vs. COVID-19)
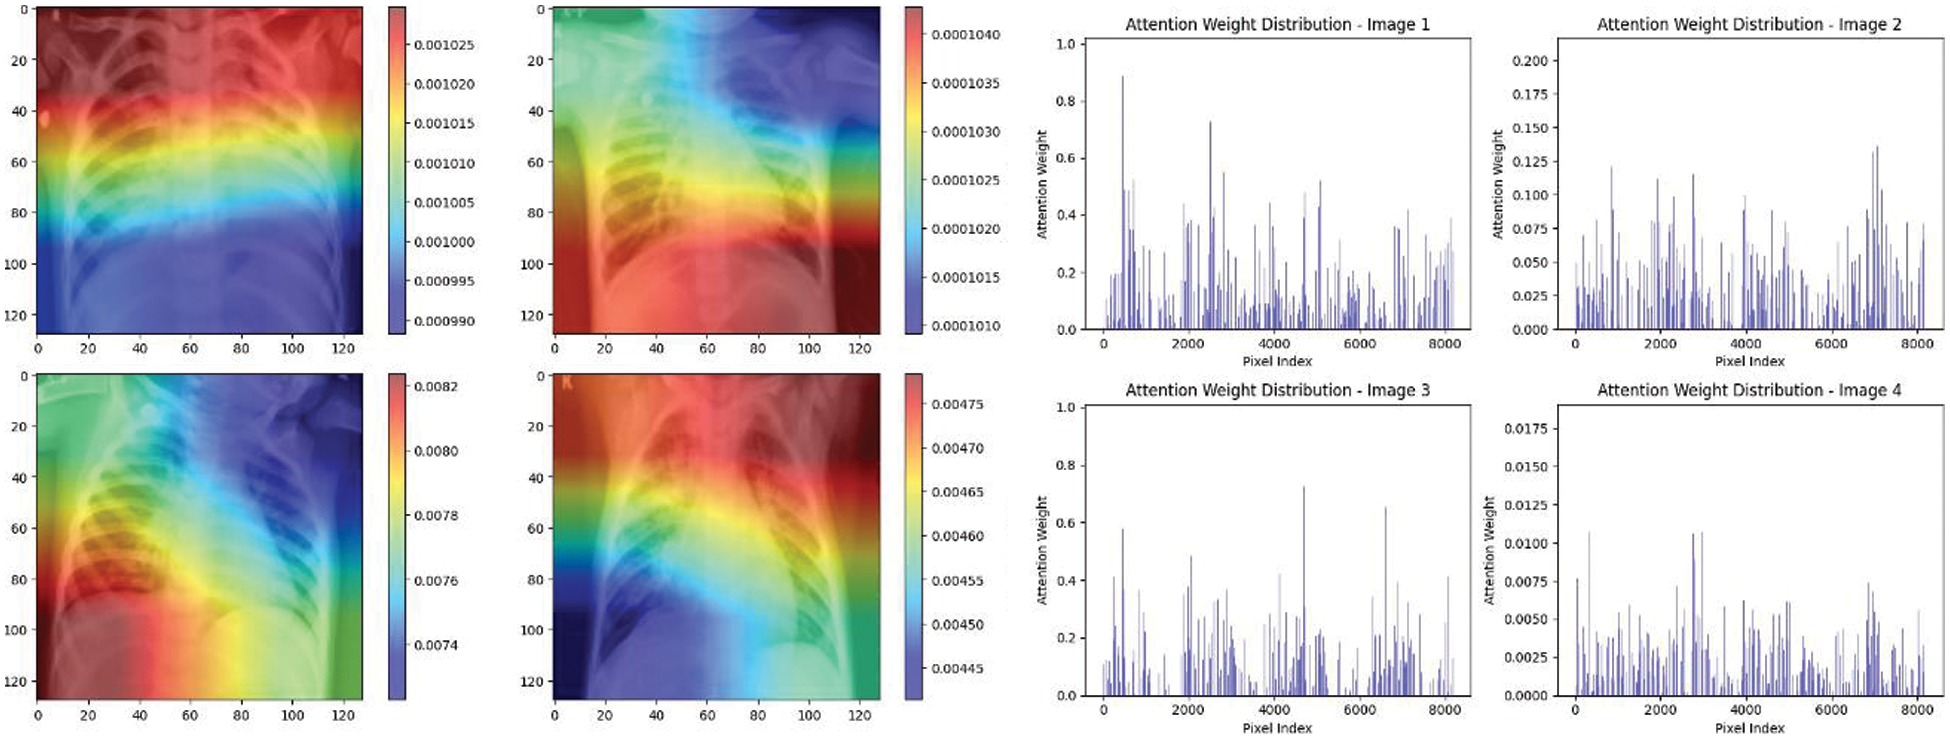
Figure 18: Attention mechanism to visualize the InceptionV3 (Normal vs. pneumonia)
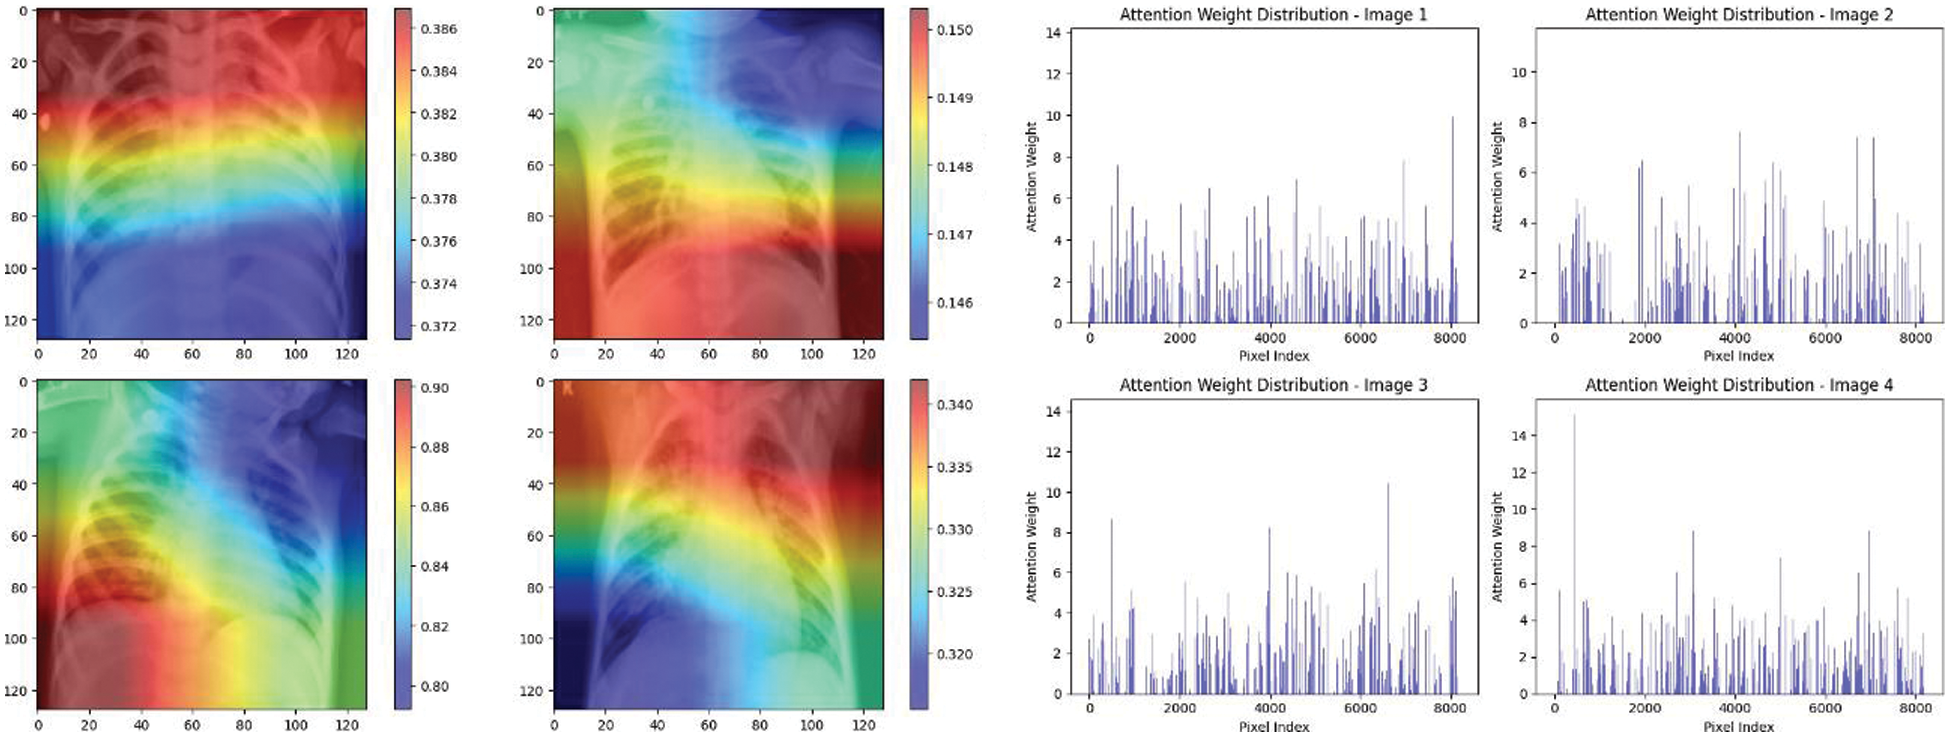
Figure 19: Attention mechanism to visualize the InceptionV3 (Multi class)
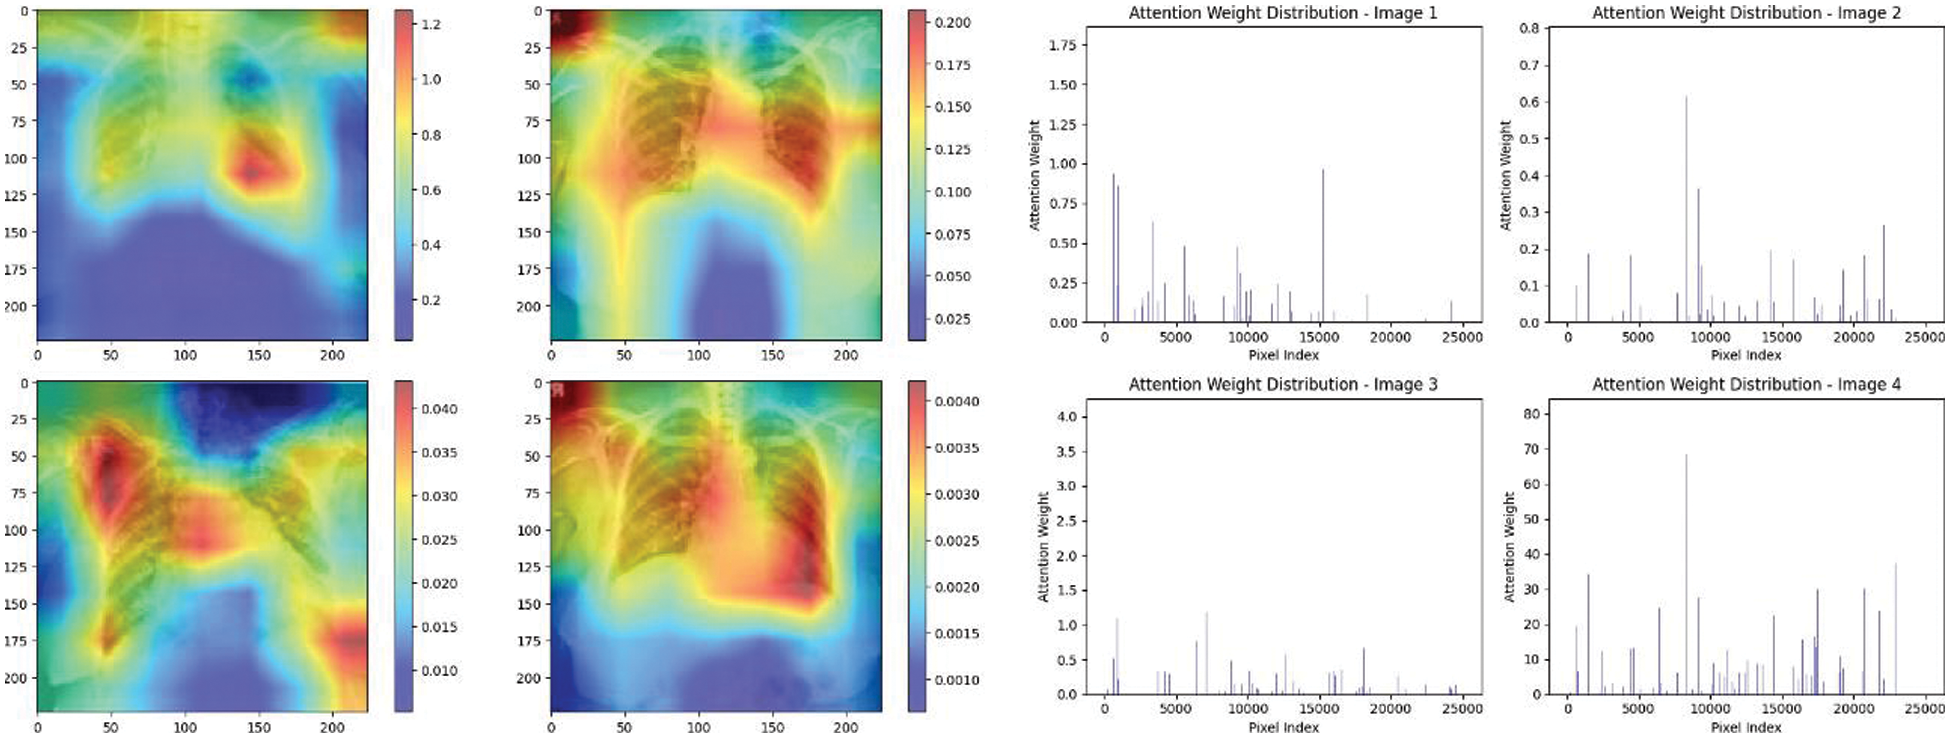
Figure 20: Attention mechanism to visualize the VGG16 (COVID-19 vs. pneumonia)
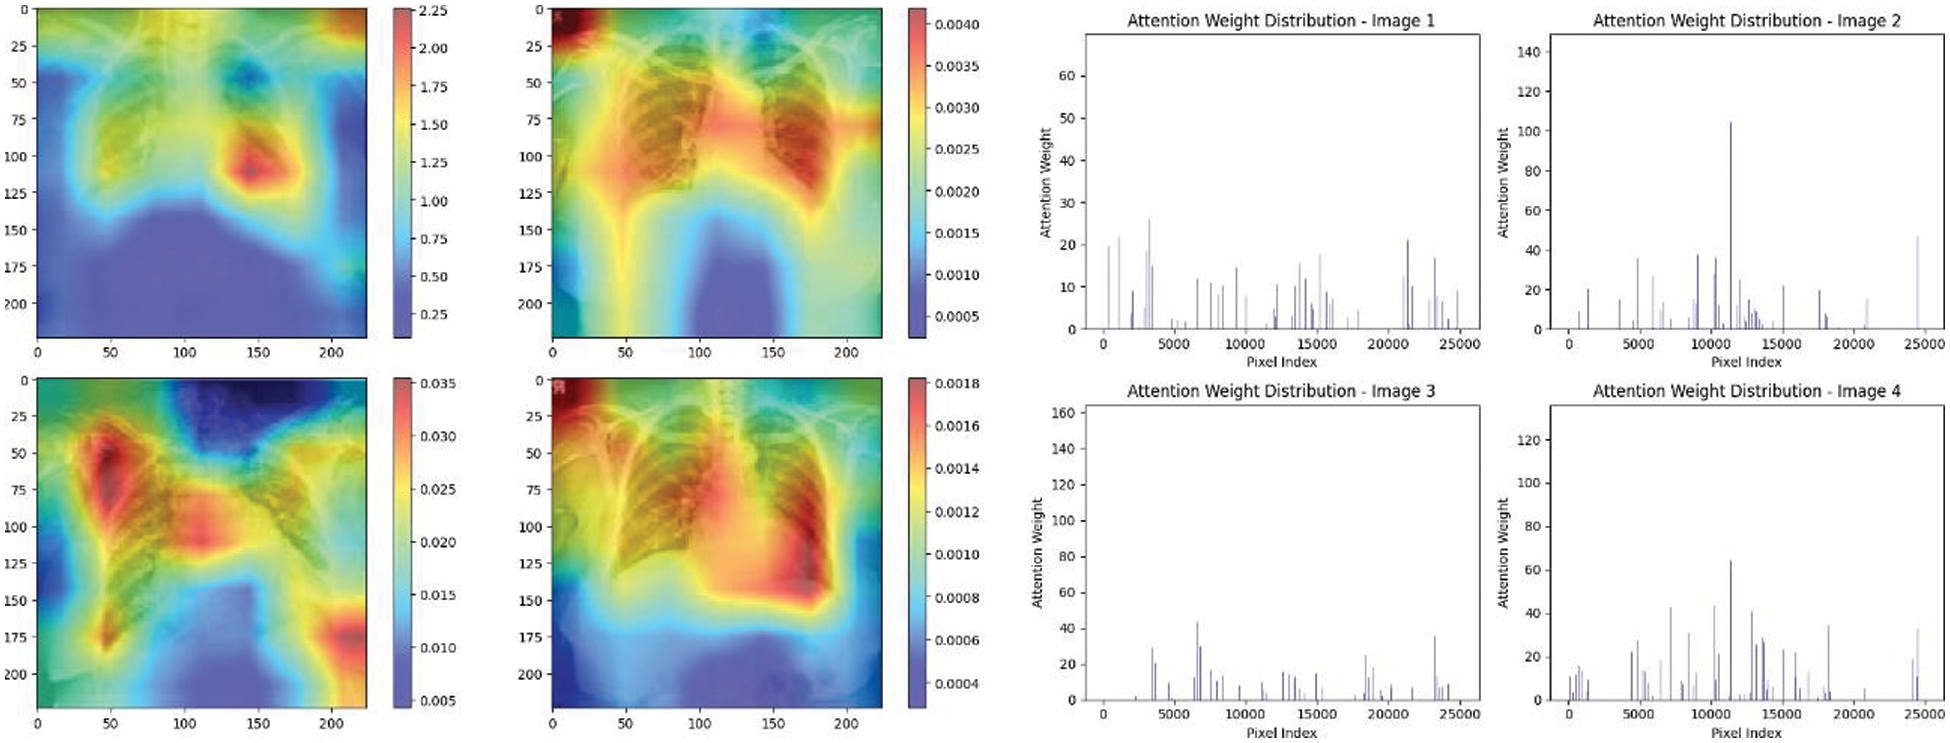
Figure 21: Attention mechanism to visualize the VGG16 (Normal vs. COVID-19)
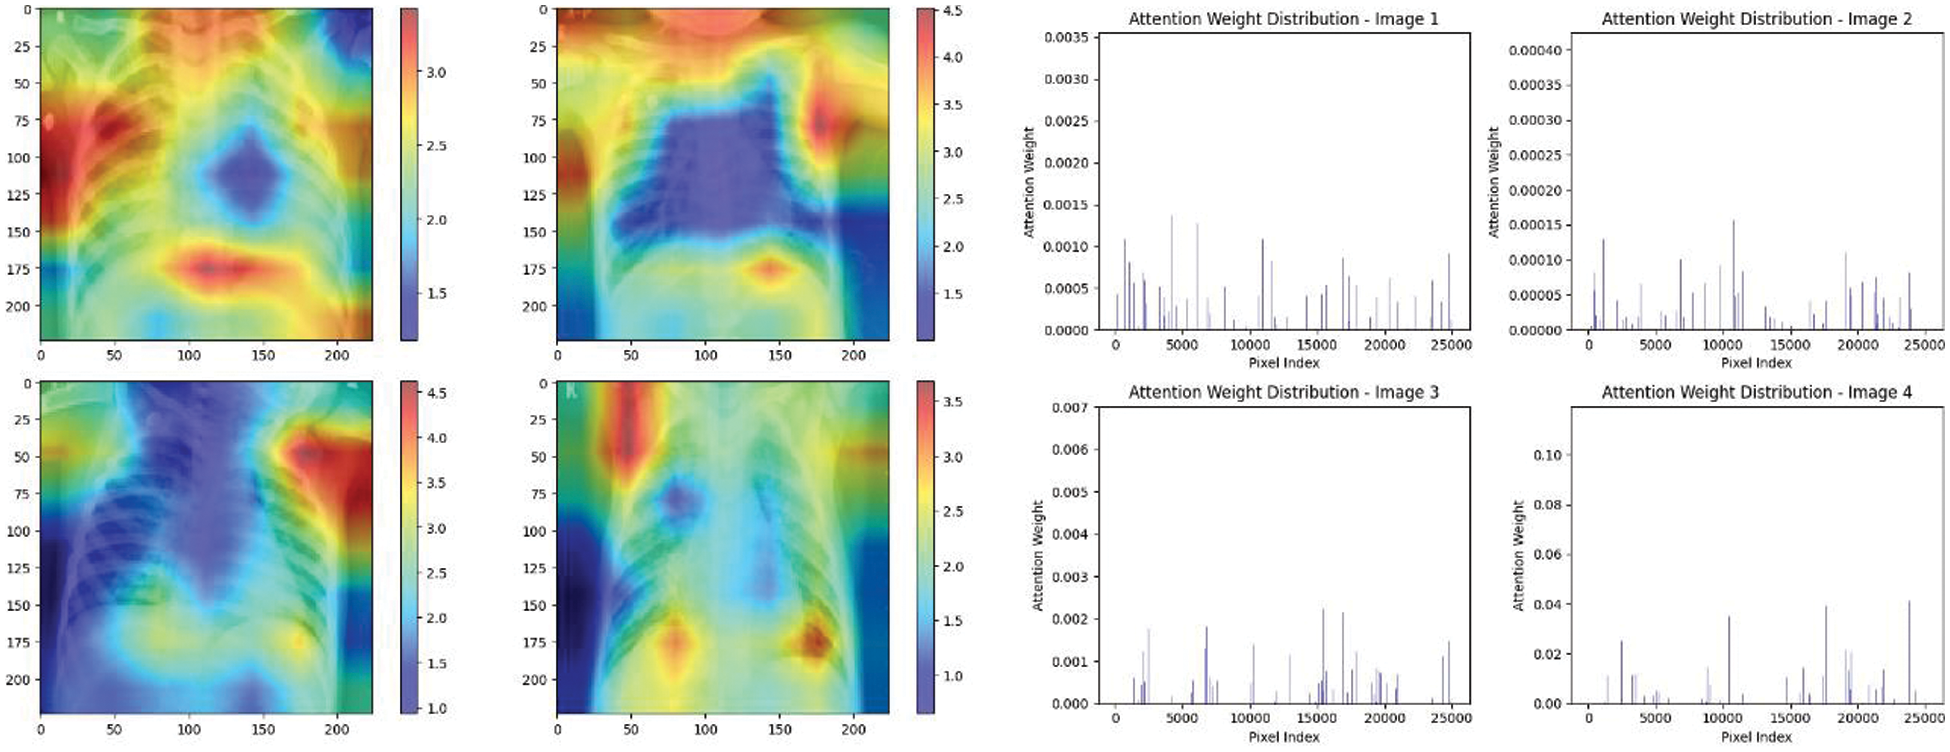
Figure 22: Attention mechanism to visualize the VGG16 (Normal vs. pneumonia)
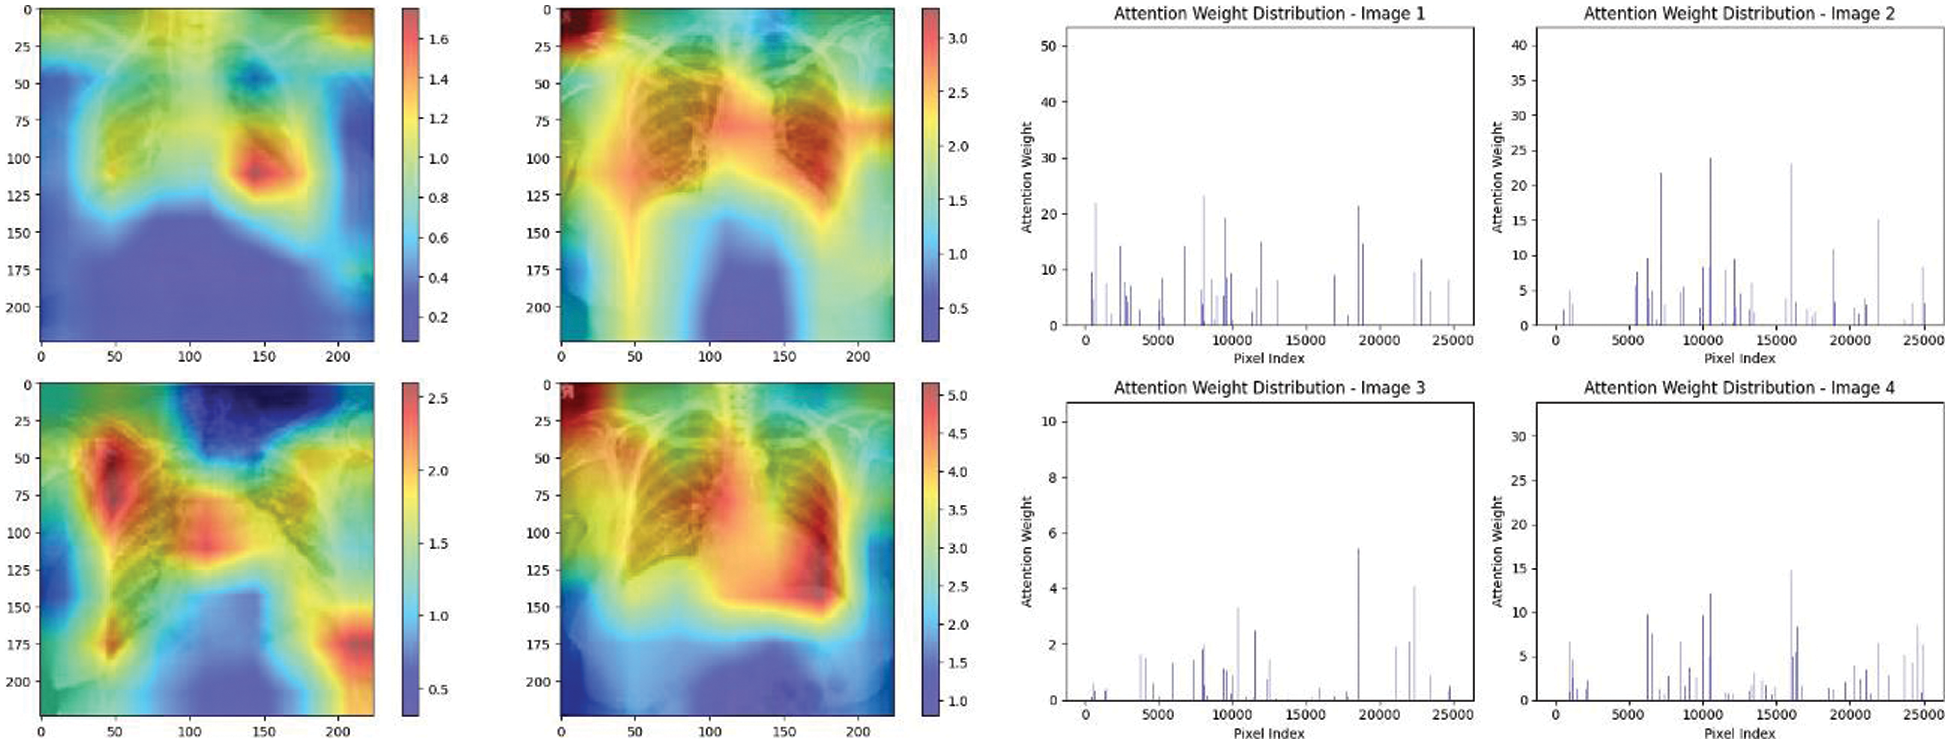
Figure 23: Attention mechanism to visualize the VGG16 (Multi class)
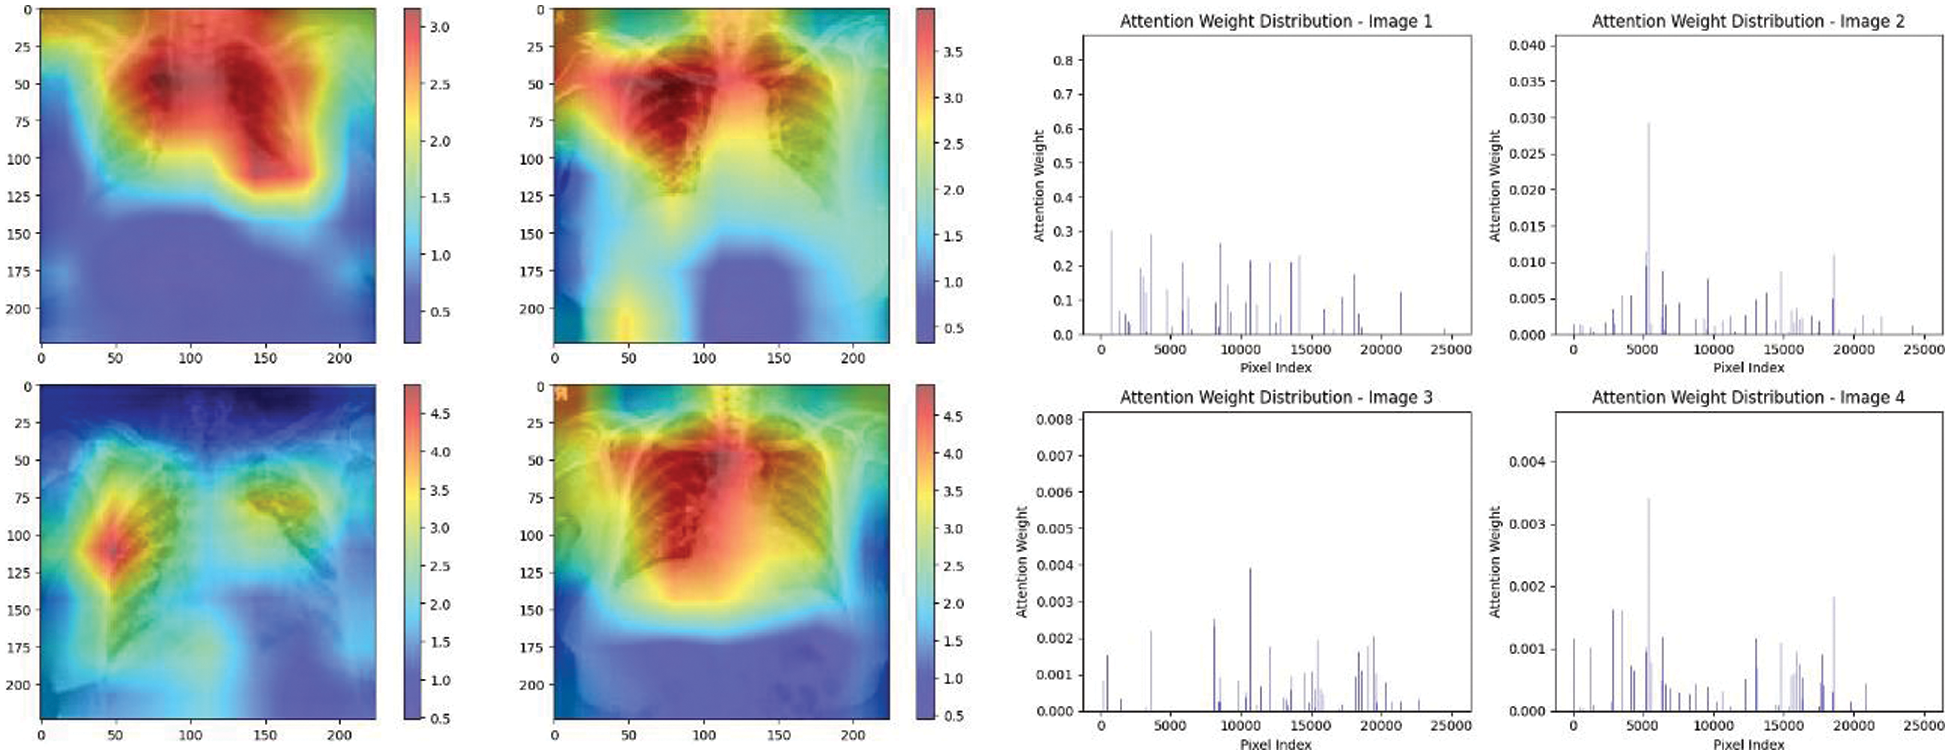
Figure 24: Attention mechanism to visualize the VGG19 (COVID-19 vs. pneumonia)
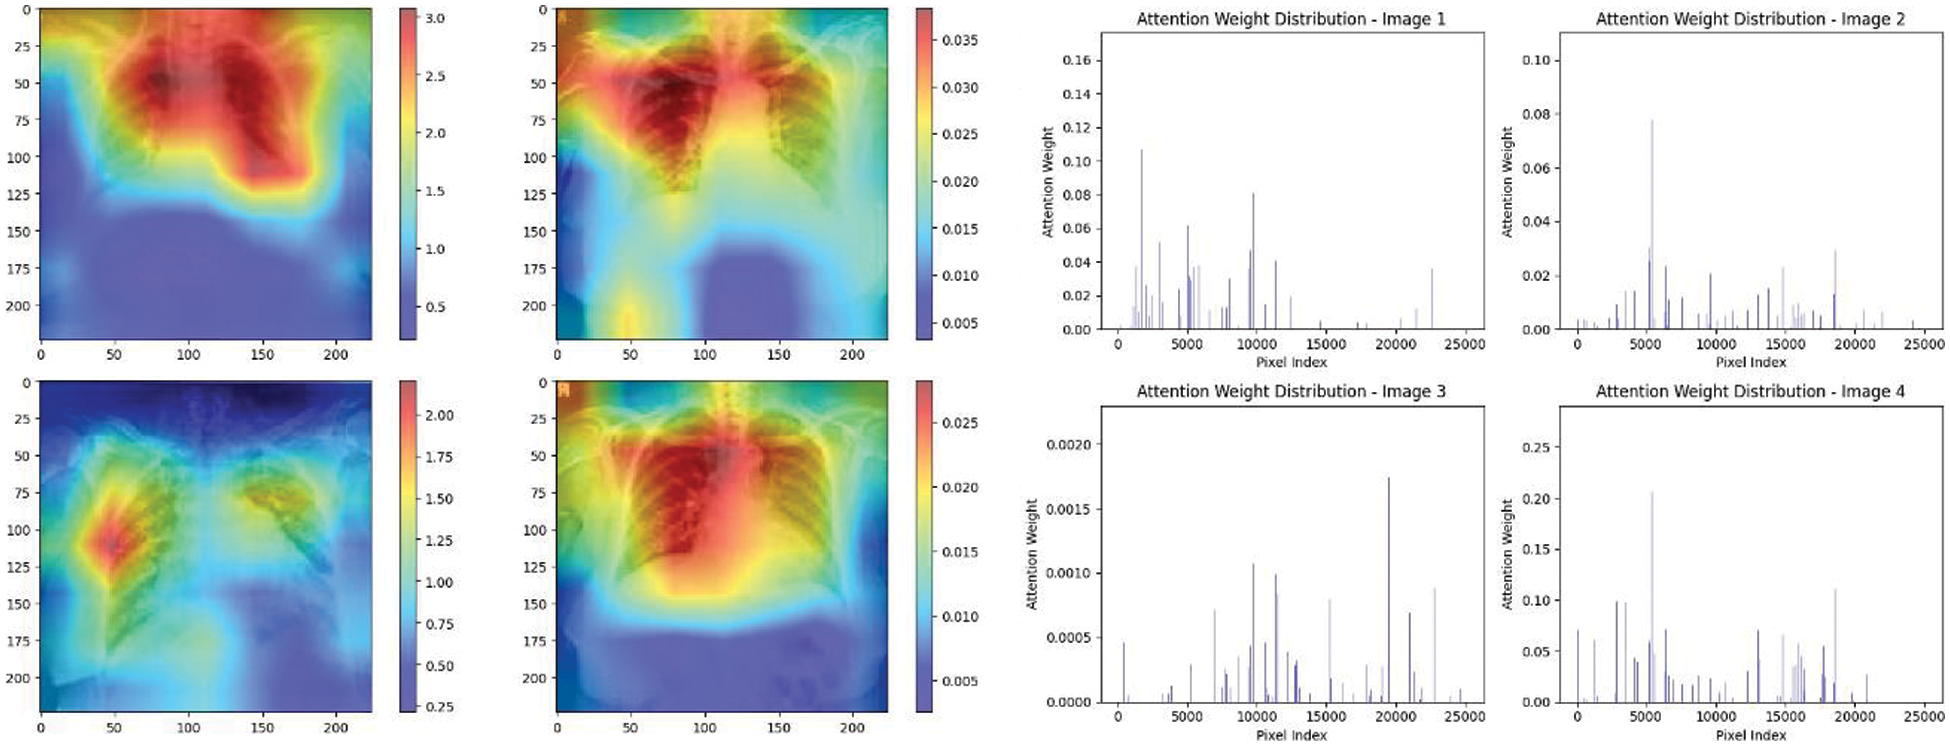
Figure 25: Attention mechanism to visualize the VGG19 (Normal vs. COVID-19)
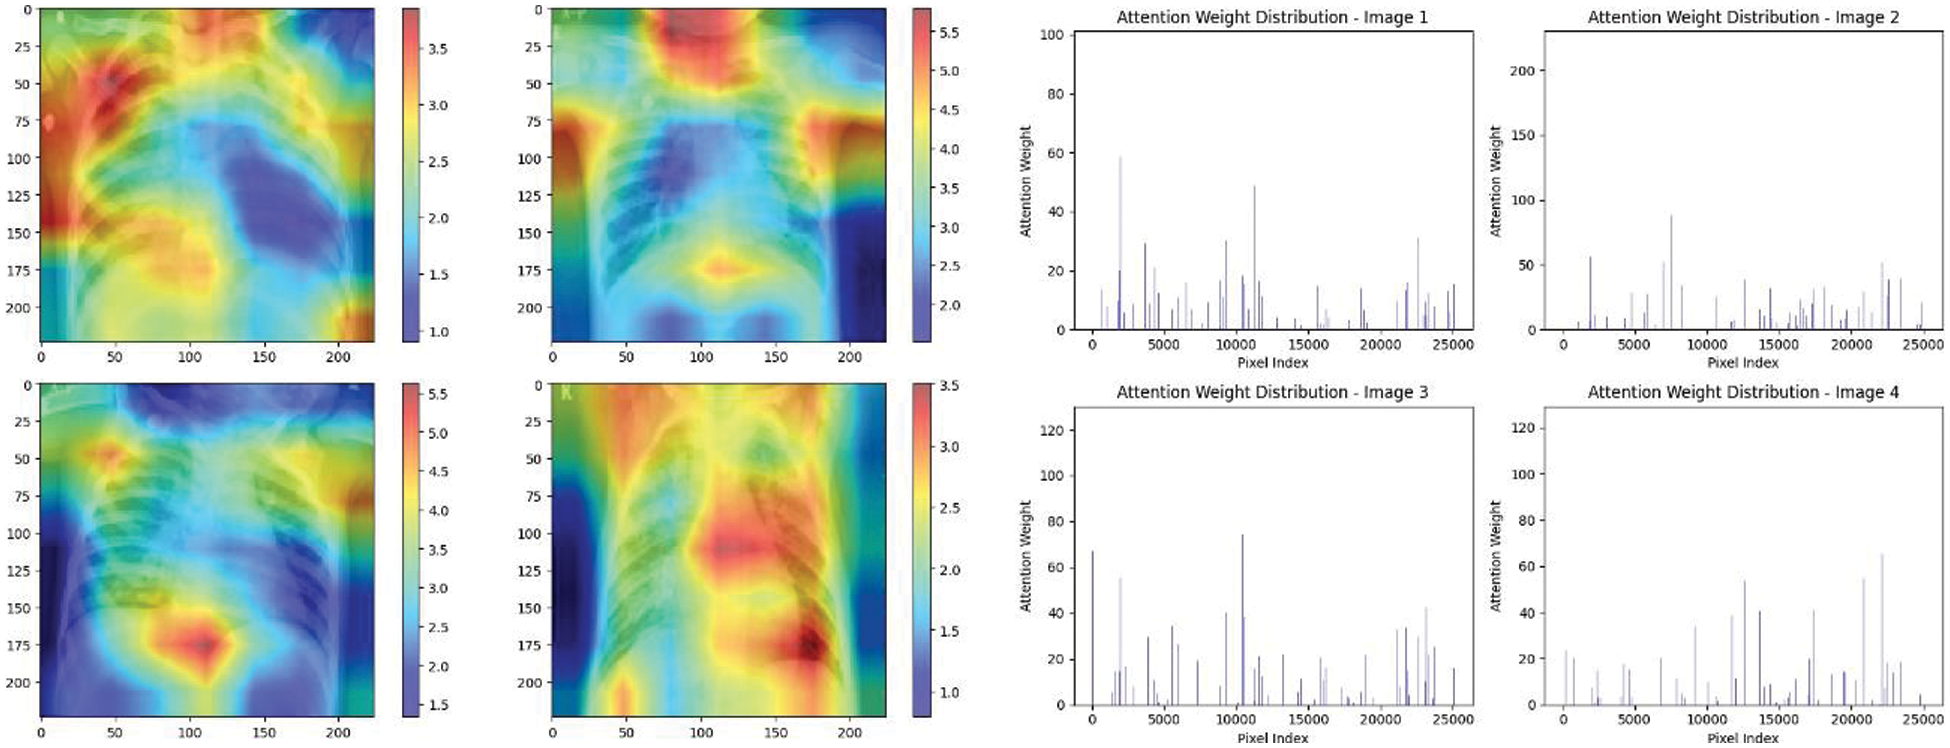
Figure 26: Attention mechanism to visualize the VGG19 (Normal vs. pneumonia)
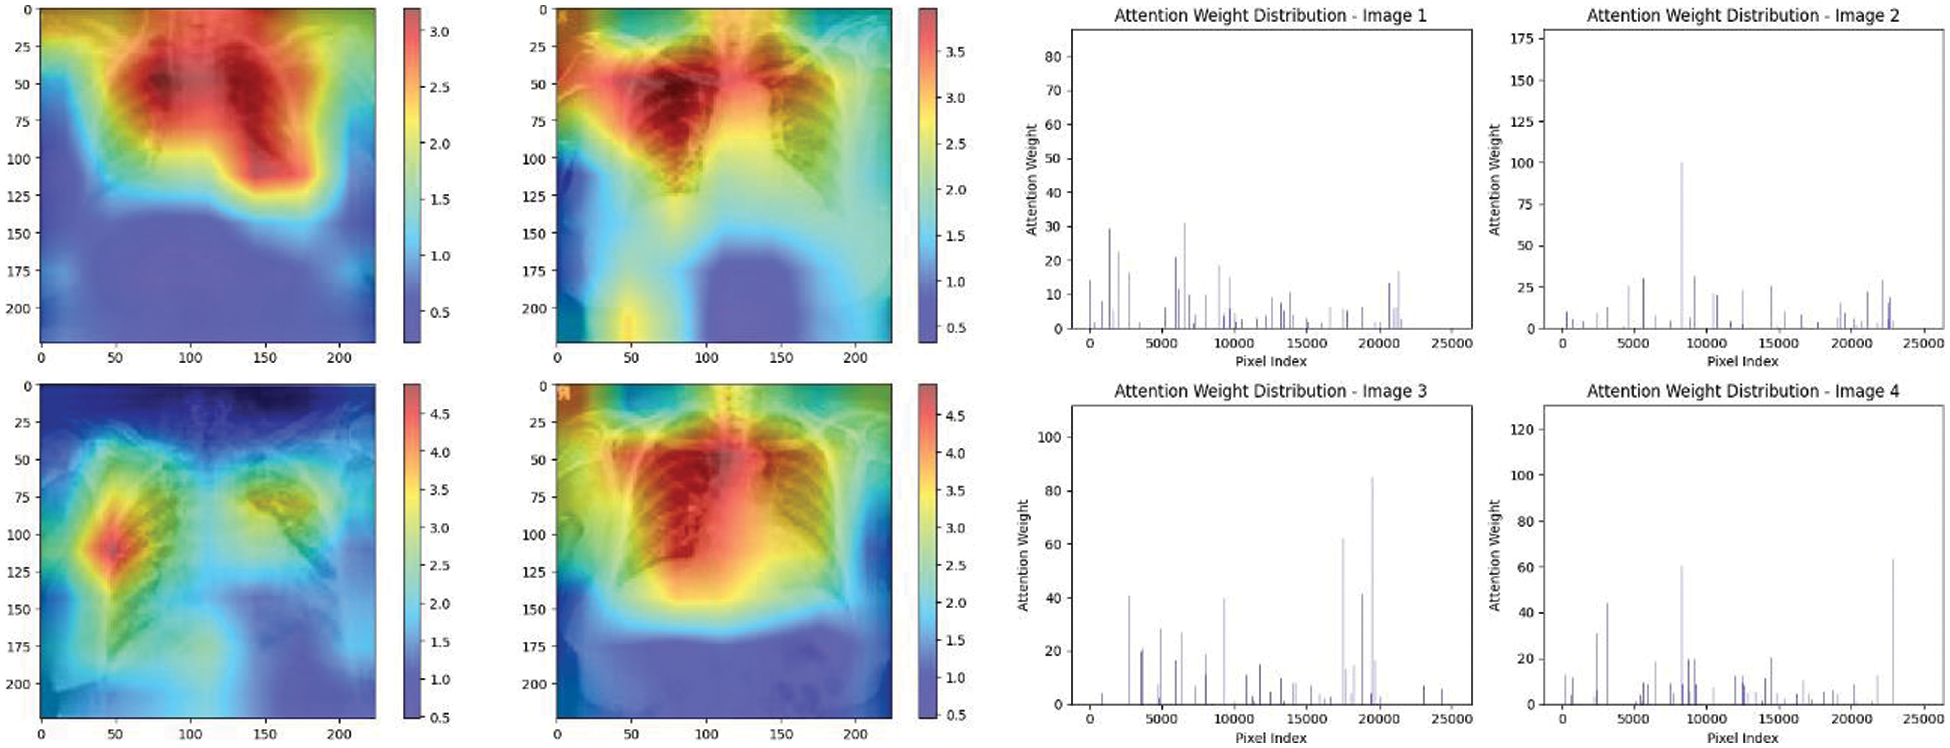
Figure 27: Attention mechanism to visualize the VGG19 (Multi class)
The high attention values suggest that the model focuses its processing resources on specific image parts. These regions are likely to strongly influence the model’s predictions. On the other hand, blue areas in the attention heat map suggest that the model is paying less attention to those regions. These regions are likely to have a weaker influence on the model’s predictions compared to regions highlighted in other colors (e.g., red, yellow).
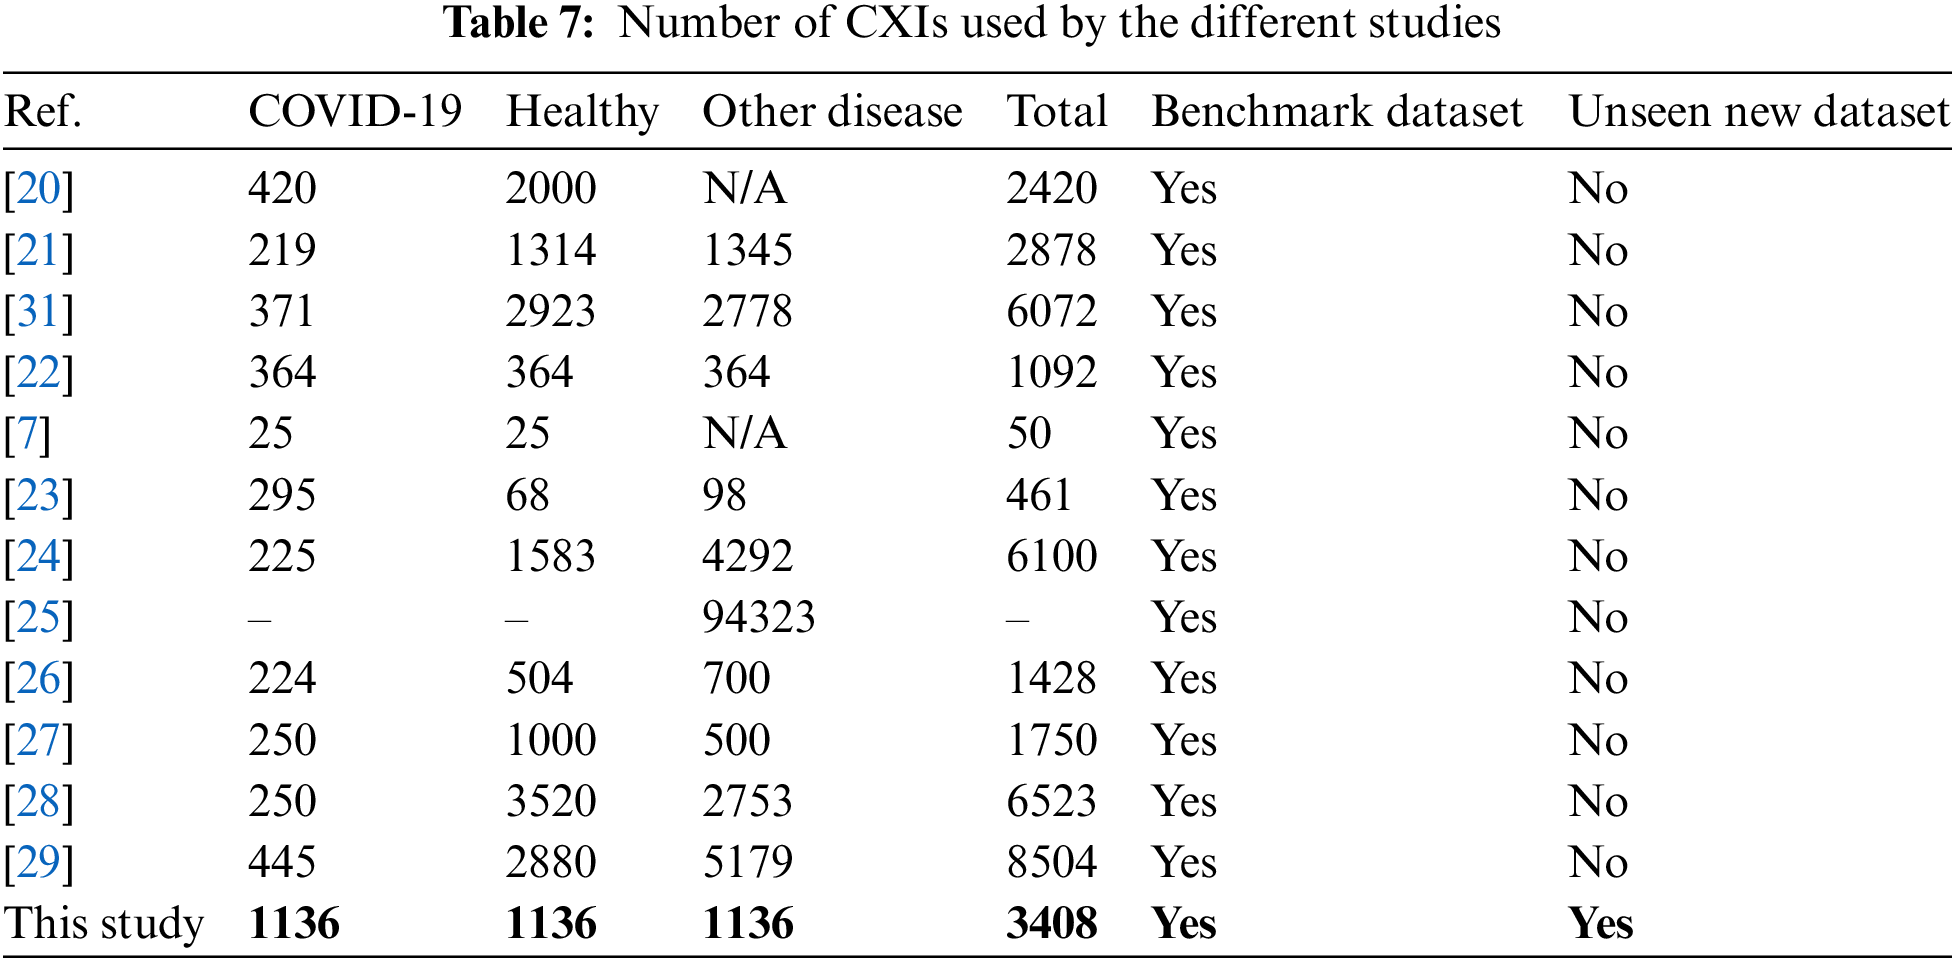
8 Comparison of Dataset Utilized for the Experiment
In this section, comparisons of performance studies of both classifications (multi-class and binary) using CXIs. Table 7 shows some recent studies that did not report accuracy due to their datasets being heavily imbalanced. While many of the related studies reported high accuracy values, a prevailing trend among them is the scarcity of a substantial number of COVID-19 cases.
The field of DL for medical diagnosis, especially in COVID-19 classification, has seen significant growth with an extensive body of literature. However, to ensure the reliability and generalizability of models, it is crucial to have access the large and unexplored datasets.
With more and more people getting affected by COVID-19 in some regions now, there is a need to test a lot of cases quickly. In this study, we tried to use different state-of-the-art models to figure out if someone has COVID-19 by looking at their CXIs with the XAI technique to model dynamically weigh the importance of different input features or parts of the input data when making predictions or generating outputs. However, XAI is still underutilized in the medical and healthcare sector due to regulatory, technical, privacy, integration, and awareness challenges. It is also important to talk to doctors and experts if we want to use this in real life. Also, more experiments will be beneficial to perform with more state-of-the-art architectures.
This study presented a novel approach by utilizing the XAI technique, specifically the attention mechanism, to visualize the decision-making areas crucial for CNNs in feature extraction, as well as to assign importance scores to each input feature, providing explanations for predictions. While applied this technique in image analysis, it has also been extensively employed in NLP. Also, the attention mechanism was able to evaluate how well our suggested solution performed in a real-world clinical setting, thereby enhancing the generalizability and practicality of findings. By incorporating data from a private hospital, our study contributes to the growing body of research on DL applications in healthcare and demonstrates the adaptability of our system in diverse medical environments. This system has the potential to significantly improve the efficiency of diagnosis, isolation, and treatment of COVID-19 patients, relieve the workload of radiologists, and help control the spread of the epidemic. The best results were achieved in the classification of COVID-19 and pneumonia, where an accuracy of 100% was obtained.
Acknowledgement: The authors extend their appreciation to the Deanship of Scientific Research at King Khalid University for funding this work through the Small Groups Project under Grant Number RGP.1/369/44.
Funding Statement: The researchers would like to thank the Deanship of Graduate Studies and Scientific Research at Qassim University for financial support (QU-APC-2024-9/1).
Author Contributions: The authors confirm their contribution to the paper as follows: Saad Akbar; study conception and design, methodology development, draft preparation, experiment and investigation, data curation and visualization. Humera Azam; supervision, draft editing, review, project administration. Sulaiman Sulmi Almutairi; validation and analysis. Omar Alqahtani and Habib Shah; paper finalization. Aliya Aleryani; final editing. All authors reviewed the results and approved the final version of the manuscript.
Availability of Data and Materials: The code utilized in this research project can be accessed at https://sites.google.com/view/saadakbar/covid-19-project (accessed on 20/04/2024). However, per privacy protocols and the sensitive nature of the data employed, the dataset utilized in this study will not be made publicly accessible.
Ethics Approval: This research study involved the use of chest X-ray images from real-time patient data collected between November 2020 and November 2021. The following information pertains to the ethical approval for this study: 1. Inclusion of Human Subjects: This study involved the use of medical imaging data obtained from human subjects. 2. Ethical Approval Committee: The research project received ethical approval from the Ethics Committee of Jinnah Postgraduate Medical Center, Karachi 3. Persistent Identifier: The ethical approval for this study is associated with a reference or approval number issued by Jinnah Postgraduate Medical Center. The reference number for this approval is MXR(G)-39/21/JPMC. All participating patients provided informed consent.
Conflicts of Interest: The authors declare that they have no conflicts of interest to report regarding the present study.
References
1. “WHO coronavirus (COVID-19) dashboard,” Accessed: Oct. 08, 2022. [Online]. Available: https://covid19.who.int [Google Scholar]
2. “Coronavirus (COVID-19) events as they happen,” Accessed: Feb. 18, 2023. [Online]. Available: https://www.who.int/emergencies/diseases/novel-coronavirus-2019/events-as-they-happen [Google Scholar]
3. “Coronavirus disease (COVID-19) situation reports,” Accessed: Feb. 18, 2023. [Online]. Available: https://www.who.int/emergencies/diseases/novel-coronavirus-2019/situation-reports [Google Scholar]
4. “Coronavirus,” Accessed: May 09, 2023. [Online]. Available: https://www.who.int/health-topics/coronavirus [Google Scholar]
5. “Laboratory testing for 2019 novel coronavirus (2019-nCoV) in suspected human cases,” Accessed: Feb. 18, 2023. [Online]. Available: https://www.who.int/publications-detail-redirect/10665-331501 [Google Scholar]
6. S. Akbar, N. G. Haider, and H. Tariq, “Tuberculosis diagnosis using X-ray images,” Int. J. Adv. Res., vol. 7, no. 4, pp. 689-696, 2019. doi: 10.21474/ijar01/8872. [Google Scholar] [CrossRef]
7. S. Sheykhivand et al., “Developing an efficient deep neural network for automatic detection of COVID-19 using chest X-ray images,” Alex. Eng. J., vol. 60, no. 3, pp. 2885–2903, Jun. 2021. doi: 10.1016/j.aej.2021.01.011. [Google Scholar] [CrossRef]
8. N. Subramanian, O. Elharrouss, S. Al-Maadeed, and M. Chowdhury, “A review of deep learning-based detection methods for COVID-19,” Comput. Biol. Med., vol. 143, pp. 105233, Apr. 2022. doi: 10.1016/j.compbiomed.2022.105233. [Google Scholar] [PubMed] [CrossRef]
9. P. Silva et al., “COVID-19 detection in CT images with deep learning: A voting-based scheme and cross-datasets analysis,” Inform. Med. Unlocked, vol. 20, pp. 100427, 2020. doi: 10.1016/j.imu.2020.100427. [Google Scholar] [PubMed] [CrossRef]
10. S. Akbar, H. Tariq, M. Fahad, G. Ahmed, and H. J. Syed, “Contemporary study on deep neural networks to diagnose COVID-19 using digital posteroanterior X-ray images,” Electronics, vol. 11, no. 19, pp. 3113, Jan. 2022. doi: 10.3390/electronics11193113. [Google Scholar] [CrossRef]
11. S. S. et al., “An XAI approach for COVID-19 detection using transfer learning with X-ray images,” Heliyon, vol. 9, no. 4, pp. e15137, Apr. 2023. doi: 10.1016/j.heliyon.2023.e15137. [Google Scholar] [PubMed] [CrossRef]
12. H. Qattous, M. Azzeh, R. Ibrahim, I. A. Al-Ghafer, M. Al Sorkhy and A. Alkhateeb, “PaCMAP-embedded convolutional neural network for multi-omics data integration,” Heliyon, vol. 10, no. 1, Jan. 2024. doi: 10.1016/j.heliyon.2023.e23195. [Google Scholar] [CrossRef]
13. H. Azam, H. Tariq, D. Shehzad, S. Akbar, H. Shah and Z. A. Khan, “Fully automated skull stripping from brain magnetic resonance images using mask RCNN-based deep learning neural networks,” Brain Sci., vol. 13, no. 9, pp. 1255, Sep. 2023. doi: 10.3390/brainsci13091255. [Google Scholar] [PubMed] [CrossRef]
14. M. F. Mushtaq et al., “BHCNet: Neural network-based brain hemorrhage classification using head CT Scan,” IEEE Access, vol. 9, pp. 113901–113916, 2021. doi: 10.1109/ACCESS.2021.3102740. [Google Scholar] [CrossRef]
15. L. T. Duong, N. H. Le, T. B. Tran, V. M. Ngo, and P. T. Nguyen, “Detection of tuberculosis from chest X-ray images: Boosting the performance with vision transformer and transfer learning,” Expert. Syst. Appl., vol. 184, pp. 115519, Dec. 2021. doi: 10.1016/j.eswa.2021.115519. [Google Scholar] [CrossRef]
16. L. Gamage, U. Isuranga, D. Meedeniya, S. de Silva, and P. Yogarajah, “Melanoma skin cancer identification with explainability utilizing mask guided technique,” Electronics, vol. 13, no. 4, pp. 680, Jan. 2024. doi: 10.3390/electronics13040680. [Google Scholar] [CrossRef]
17. O. Sarkar et al., “Multi-scale CNN: An explainable AI-integrated unique deep learning framework for lung-affected disease classification,” Technologies, vol. 11, no. 5, pp. 134, Oct. 2023. doi: 10.3390/technologies11050134. [Google Scholar] [CrossRef]
18. B. H. M. van der Velden, H. J. Kuijf, K. G. A. Gilhuijs, and M. A. Viergever, “Explainable artificial intelligence (XAI) in deep learning-based medical image analysis,” Med. Image Anal., vol. 79, pp. 102470, Jul. 2022. doi: 10.1016/j.media.2022.102470. [Google Scholar] [PubMed] [CrossRef]
19. W. Wang, Y. Pei, S. H. Wang, J. Gorrz, and Y. D. Zhang, “PSTCNN: Explainable COVID-19 diagnosis using PSO-guided self-tuning CNN,” BIOCELL, vol. 47, no. 2, pp. 373–384, 2022. doi: 10.32604/biocell.2023.025905. [Google Scholar] [CrossRef]
20. M. Canayaz, “MH-COVIDNet: Diagnosis of COVID-19 using deep neural networks and meta-heuristic-based feature selection on X-ray images,” Biomed. Signal Process. Control, vol. 64, pp. 102257, Feb. 2021. doi: 10.1016/j.bspc.2020.102257. [Google Scholar] [PubMed] [CrossRef]
21. M. Toğaçar, B. Ergen, and Z. Cömert, “COVID-19 detection using deep learning models to exploit social mimic optimization and structured chest X-ray images using fuzzy color and stacking approaches,” Comput. Biol. Med., vol. 121, pp. 103805, Jun. 2020. doi: 10.1016/j.compbiomed.2020.103805. [Google Scholar] [PubMed] [CrossRef]
22. T. Wu, C. Tang, M. Xu, N. Hong, and Z. Lei, “ULNet for the detection of coronavirus (COVID-19) from chest X-ray images,” Comput. Biol. Med., vol. 137, pp. 104834, Oct. 2021. doi: 10.1016/j.compbiomed.2021.104834. [Google Scholar] [PubMed] [CrossRef]
23. E. E. D. Hemdan, M. A. Shouman, and M. E. Karar, “COVIDX-Net: A framework of deep learning classifiers to diagnose COVID-19 in X-ray images,” 2020. doi: 10.48550/arXiv.2003.11055. [Google Scholar] [CrossRef]
24. B. Sekeroglu and I. Ozsahin, “Detection of COVID-19 from chest X-ray images using convolutional neural networks,” SLAS Technol., vol. 25, no. 6, pp. 553–565, Dec. 2020. doi: 10.1177/2472630320958376. [Google Scholar] [PubMed] [CrossRef]
25. P. Afshar, S. Heidarian, F. Naderkhani, A. Oikonomou, K. N. Plataniotis and A. Mohammadi, “COVID-CAPS: A capsule network-based framework for identification of COVID-19 cases from X-ray images,” Pattern Recognit. Lett., vol. 138, pp. 638–643, Oct. 2020. doi: 10.1016/j.patrec.2020.09.010. [Google Scholar] [PubMed] [CrossRef]
26. I. D. Apostolopoulos and T. A. Mpesiana, “COVID-19: Automatic detection from X-ray images utilizing transfer learning with convolutional neural networks,” Phys. Eng. Sci. Med., vol. 43, no. 2, pp. 635–640, Jun. 2020. doi: 10.1007/s13246-020-00865-4. [Google Scholar] [PubMed] [CrossRef]
27. T. Ozturk, M. Talo, E. A. Yildirim, U. B. Baloglu, O. Yildirim and U. Rajendra Acharya, “Automated detection of COVID-19 cases using deep neural networks with X-ray images,” Comput. Biol. Med., vol. 121, pp. 103792, Jun. 2020. doi: 10.1016/j.compbiomed.2020.103792. [Google Scholar] [PubMed] [CrossRef]
28. L. Brunese, F. Mercaldo, A. Reginelli, and A. Santone, “Explainable deep learning for pulmonary disease and coronavirus COVID-19 detection from X-rays,” Comput. Methods Programs Biomed., vol. 196, pp. 105608, Nov. 2020. doi: 10.1016/j.cmpb.2020.105608. [Google Scholar] [PubMed] [CrossRef]
29. M. Heidari, S. Mirniaharikandehei, A. Z. Khuzani, G. Danala, Y. Qiu and B. Zheng, “Improving the performance of CNN to predict the likelihood of COVID-19 using chest X-ray images with preprocessing algorithms,” Int. J. Med. Inform., vol. 144, pp. 104284, Dec. 2020. doi: 10.1016/j.ijmedinf.2020.104284. [Google Scholar] [PubMed] [CrossRef]
30. A. K. Azad, M. A. Alahi, and M. U. Ahmed, “In search of an efficient and reliable deep learning model for identification of COVID-19 infection from chest X-ray images,” Diagnostics, vol. 13, no. 3, pp. 574, Jan. 2023. doi: 10.3390/diagnostics13030574. [Google Scholar] [PubMed] [CrossRef]
31. M. Khishe, F. Caraffini, and S. Kuhn, “Evolving deep learning convolutional neural networks for early COVID-19 detection in chest X-ray images,” Mathematics, vol. 9, no. 9, pp. 1002, Apr. 2021. doi: 10.3390/math9091002. [Google Scholar] [CrossRef]
32. L. T. Duong, P. T. Nguyen, L. Iovino, and M. Flammini, “Automatic detection of COVID-19 from chest X-ray and lung computed tomography images using deep neural networks and transfer learning,” Appl. Soft Comput., vol. 132, pp. 109851, Jan. 2023. doi: 10.1016/j.asoc.2022.109851. [Google Scholar] [PubMed] [CrossRef]
33. C. Shorten, T. M. Khoshgoftaar, and B. Furht, “Deep learning applications for COVID-19,” J. Big Data, vol. 8, no. 1, pp. 484, 2021. doi: 10.1186/s40537-020-00392-9. [Google Scholar] [PubMed] [CrossRef]
34. Z. Ying, G. Li, Y. Ren, R. Wang, and W. Wang, “A new image contrast enhancement algorithm using exposure fusion framework,” in M. Felsberg, A. Heyden, N. Krüger (Eds.Computer Analysis of Images and Patterns. Cham: Springer International Publishing, 2017, vol. 10425, pp. 36–46. 10.1007/978-3-319-64698-5_4. [Google Scholar] [CrossRef]
35. S. Mahajan, A. Raina, M. Abouhawwash, X. Z. Gao, and A. Kant Pandit, “COVID-19 detection from chest X-ray images using advanced deep learning techniques,” Comput. Mater. Contin., vol. 70, no. 1, pp. 1541–1556, 2022. doi: 10.32604/cmc.2022.019496. [Google Scholar] [CrossRef]
36. A. Siddique, S. Talha, M. Aamir, A. Algarni, N. Soliman and W. El-Shafai, “COVID-19 classification from X-ray images: An approach to implement federated learning on decentralized dataset,” Comput. Mat. Contin., vol. 75, pp. 3883–3901, Mar. 2023. doi: 10.32604/cmc.2023.037413 [Google Scholar] [CrossRef]
37. M. E. H. Chowdhury et al., “Can AI help in screening viral and COVID-19 pneumonia?,” IEEE Access, vol. 8, pp. 132665–132676, 2020. doi: 10.1109/ACCESS.2020.3010287. [Google Scholar] [CrossRef]
38. I. A. Choudhry, A. N. Qureshi, K. Aurangzeb, S. Iqbal, and M. Alhussein, “Hybrid diagnostic model for improved COVID-19 detection in lung radiographs using deep and traditional features,” Biomimetics, vol. 8, no. 5, pp. 406, Sep. 2023. doi: 10.3390/biomimetics8050406. [Google Scholar] [PubMed] [CrossRef]
39. Y. D. Zhang, V. Govindaraj, and Z. Zhu, “FECNet: A neural network and a mobile app for COVID-19 recognition,” Mobile Netw. Appl., vol. 9, Jul. 2023. doi: 10.1007/s11036-023-02140-8. [Google Scholar] [CrossRef]
40. D. Kermany, K. Zhang, and M. Goldbaum, “Large dataset of labeled optical coherence tomography (OCT) and chest X-ray images,” vol. 3, Jun. 2018. doi: 10.17632/rscbjbr9sj.3. [Google Scholar] [CrossRef]
41. J. P. Cohen, P. Morrison, L. Dao, K. Roth, T. Q. Duong and M. Ghassemi, “ieee8023/covid-chestxray-dataset,” Sep. 26, 2022. Accessed: Sep. 27, 2022. [Online]. Available: https://github.com/ieee8023/covid-chestxray-dataset [Google Scholar]
42. C. Shorten and T. M. Khoshgoftaar, “A survey on image data augmentation for deep learning,” J. Big Data, vol. 6, no. 1, pp. 60, Jul. 2019. doi: 10.1186/s40537-019-0197-0. [Google Scholar] [CrossRef]
43. K. K. Pal and K. S. Sudeep, “Preprocessing for image classification by convolutional neural networks,” in 2016 IEEE Int. Conf. Recent Trends Electron., Inform. Commun. Technol. (RTEICT), Bangalore, India, May 2016, pp. 1778–1781. doi: 10.1109/RTEICT.2016.7808140. [Google Scholar] [CrossRef]
44. X. Chen, “Image enhancement effect on the performance of convolutional neural networks,” 2019. Accessed: May 30, 2023. [Online]. Available: https://urn.kb.se/resolve?urn=urn:nbn:se:bth-18523 [Google Scholar]
45. A. Schwartzman, M. Kagan, L. Mackey, B. Nachman, and L. D. Oliveira, “Image processing, computer vision, and deep learning: New approaches to the analysis and physics interpretation of LHC events,” J. Phys.: Conf. Ser., vol. 762, no. 1, pp. 12035, Oct. 2016. doi: 10.1088/1742-6596/762/1/012035. [Google Scholar] [CrossRef]
46. X. Yang, “An overview of the attention mechanisms in computer vision,” J. Phys.: Conf. Ser., vol. 1693, no. 1, pp. 12173, Dec. 2020. doi: 10.1088/1742-6596/1693/1/012173. [Google Scholar] [CrossRef]
47. J. Hu, L. Shen, S. Albanie, G. Sun, and E. Wu, “Squeeze-and-excitation networks,” May 16, 2019. doi: 10.48550/arXiv.1709.01507. [Google Scholar] [CrossRef]
48. H. Touvron, M. Cord, A. Sablayrolles, G. Synnaeve, and H. Jégou, “Going deeper with image transformers,” Apr. 07, 2021. doi: 10.48550/arXiv.2103.17239. [Google Scholar] [CrossRef]
49. L. van der Maaten and G. Hinton, “Visualizing data using t-SNE,” J. Mach. Learn. Res., vol. 9, no. 86, pp. 2579–2605, 2008. [Google Scholar]
50. S. Guhathakurata, S. Kundu, A. Chakraborty, and J. S. Banerjee, “A novel approach to predict COVID-19 using support vector machine,” in Data Science for COVID-19, 2021, vol. 395, pp. 351–364. doi: 10.1016/B978-0-12-824536-1.00014-9. [Google Scholar] [CrossRef]
51. N. A. Almansour et al., “Neural network and support vector machine for the prediction of chronic kidney disease: A comparative study,” Comput Biol. Med., vol. 109, pp. 101–111, Jun. 2019. doi: 10.1016/j.compbiomed.2019.04.017. [Google Scholar] [PubMed] [CrossRef]
52. X. Guo et al., “An ensemble learning method based on ordinal regression for COVID-19 diagnosis from chest CT,” Phys Med. Biol., vol. 66, no. 24, pp. 244001, Dec. 2021. doi: 10.1088/1361-6560/ac34b2. [Google Scholar] [PubMed] [CrossRef]
53. L. S. Chow, G. S. Tang, M. I. Solihin, N. M. Gowdh, N. Ramli and K. Rahmat, “Quantitative and qualitative analysis of 18 deep convolutional neural network (CNN) models with transfer learning to diagnose COVID-19 on chest X-ray (CXR) images,” SN Comput. Sci., vol. 4, no. 2, pp. 141, Jan. 2023. doi: 10.1007/s42979-022-01545-8. [Google Scholar] [PubMed] [CrossRef]
54. S. Namani, L. Akkapeddi, and S. Bantu, “Performance analysis of VGG-19 deep learning model for COVID-19 detection,” in 2022 9th Int. Conf. Computing Sustain Global Dev (INDIACom), New Delhi, India, vol. 4, pp. 781–787, May 2022. doi: 10.23919/INDIACom54597.2022.9763177. [Google Scholar] [CrossRef]
Cite This Article
 Copyright © 2024 The Author(s). Published by Tech Science Press.
This work is licensed under a Creative Commons Attribution 4.0 International License , which permits unrestricted use, distribution, and reproduction in any medium, provided the original work is properly cited.
 Downloads
 Citation Tools