
 Submit a Paper
 Propose a Special lssue
 Open Access
ARTICLE

Automatic Rule Discovery for Data Transformation Using Fusion of Diversified Feature Formats
1 Department of CSE, Jawaharlal Nehru Technological University, Anantapur, 515002, India
2 Department of CSE, Marri Laxman Reddy Institute of Technology and Management, Hyderabad, 500043, India
3 Department of Information Technology, Mahatma Gandhi Institute of Technology, Hyderabad, 500075, India
* Corresponding Author: G. Sunil Santhosh Kumar. Email:
Computers, Materials & Continua 2024, 80(1), 695-713. https://doi.org/10.32604/cmc.2024.050143
Received 29 January 2024; Accepted 14 May 2024; Issue published 18 July 2024
 View Full Text
 Download PDF
Abstract
This article presents an innovative approach to automatic rule discovery for data transformation tasks leveraging XGBoost, a machine learning algorithm renowned for its efficiency and performance. The framework proposed herein utilizes the fusion of diversified feature formats, specifically, metadata, textual, and pattern features. The goal is to enhance the system’s ability to discern and generalize transformation rules from source to destination formats in varied contexts. Firstly, the article delves into the methodology for extracting these distinct features from raw data and the pre-processing steps undertaken to prepare the data for the model. Subsequent sections expound on the mechanism of feature optimization using Recursive Feature Elimination (RFE) with linear regression, aiming to retain the most contributive features and eliminate redundant or less significant ones. The core of the research revolves around the deployment of the XGBoost model for training, using the prepared and optimized feature sets. The article presents a detailed overview of the mathematical model and algorithmic steps behind this procedure. Finally, the process of rule discovery (prediction phase) by the trained XGBoost model is explained, underscoring its role in real-time, automated data transformations. By employing machine learning and particularly, the XGBoost model in the context of Business Rule Engine (BRE) data transformation, the article underscores a paradigm shift towards more scalable, efficient, and less human-dependent data transformation systems. This research opens doors for further exploration into automated rule discovery systems and their applications in various sectors.Keywords
Data transformation, a critical step in the data management lifecycle, is traditionally performed using predefined rules and manual interventions [1]. This conventional method becomes increasingly burdensome and inefficient with the escalating size and complexity of data. Recognizing this challenge, this article introduces an automatic rule discovery framework for data transformation tasks, powered by a well-renowned machine learning algorithm, XGBoost. The proposed model uniquely leverages a fusion of diversified feature formats, encompassing metadata, textual, and pattern features, thus enriching the transformation process’s versatility and adaptability [2]. By using these diverse types of features, the framework can accommodate and learn from a wide range of data structures and formats, thereby enhancing its ability to discover transformation rules in varied contexts. In this article, we will explore our proposed solution, beginning with the extraction of these features from raw data and the pre-processing steps undertaken to prepare the data for the model. We will delve into the mechanism of feature optimization using Recursive Feature Elimination (RFE) [3] with linear regression, and demonstrate how it helps eliminate less significant features, optimizing the input for our XGBoost model. Subsequently, we present a detailed analysis of the XGBoost [4] model training process, the mathematical and algorithmic intricacies involved, and how it learns to discover transformation rules from the prepared feature sets. Finally, we elucidate the process of rule discovery (prediction phase) by the trained XGBoost model, its working, and its potential to revolutionize real-time, automated data transformations. Our research aims to demonstrate the value of machine learning, particularly the XGBoost model, in the context of Business Rule Engine (BRE) [5] data transformations, marking a significant stride towards scalable, efficient, and autonomous data transformation systems.
Business workflows often need to change the format of different kinds of data based on certain business rules. These rules map the format of the source data to the format of the target data. At the moment, finding and using these transformation rules is a manual process that is prone to mistakes, takes a long time, and cannot be scaled up. Given the amount, variety, and speed of data that needs to be processed, this lack is especially important. The goal of this project is to make a system that can automatically find transformation rules. Machine learning techniques will be used in the system, and a big focus will be on designing and implementing an XGBoost-based framework. This framework will use examples of source-to-target pairs to figure out the rules that govern the transformation process.
The system that is being planned will be able to handle a wide range of data types and changes. It will adapt to changes in the source or target data formats and provide accurate, reliable transformation rules that meet business needs. Another important feature is that it is easy to understand. It should not only change data correctly, but also explain the rules it used to change the data. Several things will be used to judge the success of a project. These include how well the system can find transformation rules, how many different kinds of transformations it can handle, and how easy it is to use and understand.
Date transformation is one type of this kind of data transformation. In different parts of the world, dates are shown in different ways. In some places, dates are written as MM/DD/YYYY, while in others, they are written as DD/MM/YYYY. For business reasons, you may need to use a standard format like YYYY-MM-DD. At the moment, setting up the rules for such a transformation means understanding the source format and making rules to change each source format into the desired destination format. For example, a date in the source format MM/DD/YYYY would be changed to YYYY-MM-DD. A machine learning model like XGBoost can be used in an Automatic Rule Discovery for BRE data transformation scenario. This model would learn these rules automatically by looking at examples of source data and target data. The model would learn from a set of example data in which the source format of the date was used as input and the desired format of the date was used as output.
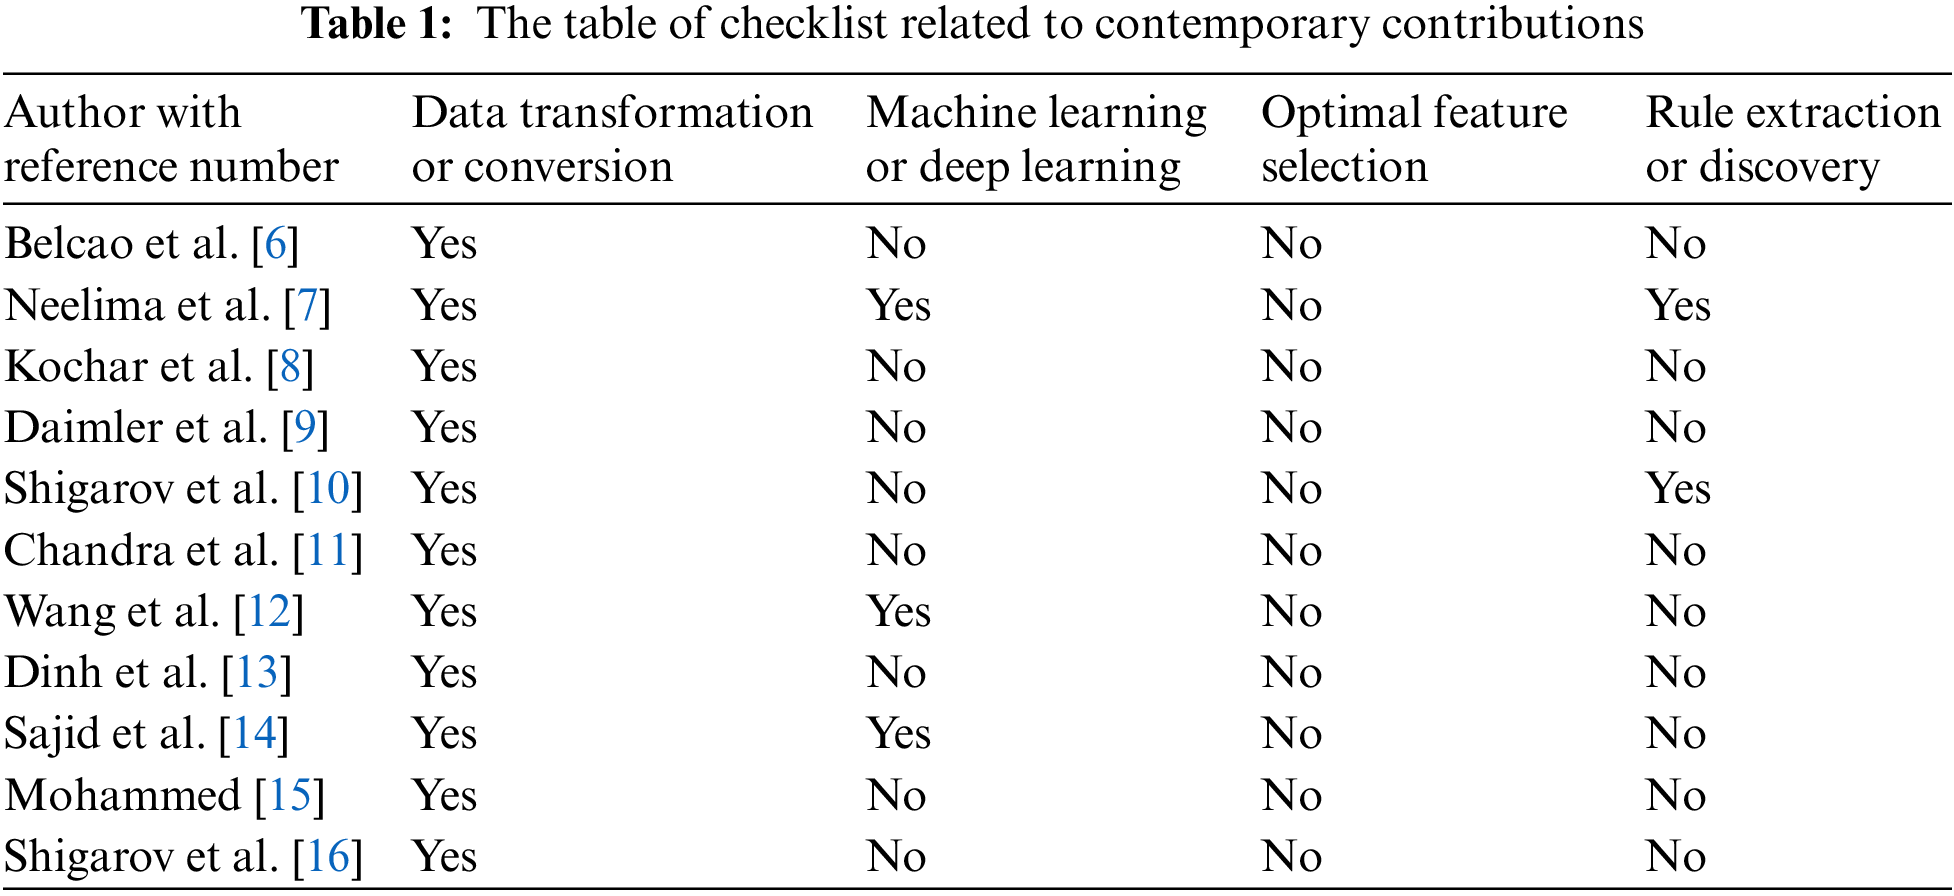
This review gives a thorough look at eleven articles on data transformation, machine learning, rule extraction, and other relevant topics. The articles cover different parts of data transformation, from semantic interoperability and knowledge retrieval in humanitarian crisis response to rule-based spreadsheet data extraction. The main goals, models, experimental results, and implications of each article are summed up to give a quick look at the research done in these areas. The checklist table is a quick way to look up the most important parts of each article. This review gives useful information about the progress and effects of data transformation and related techniques in different fields.
In order to accomplish semantic interoperability and effective data conversion in diverse systems, Belcao et al. [6] offer the Chimaera framework. In order to integrate data sources, the framework uses a semantic any-to-one centralized mapping strategy and offers ready-to-use components. The study emphasises the potential of Chimaera in tackling the difficulties of data format conversion, even if no experimental findings are given. A “machine learning-based business rule engine for data transformation (ML-BREDT)” is presented by Neelima et al. [7]. They use a combination of strategies to categorize and divide registered title data. The study achieves a high detection rate for abnormalities by evaluating the model using sample data and several ML techniques. The suggested technique has the potential to enable effective data transformation in commercial contexts. An “efficient data storage system for RFID applications” is proposed by Kochar et al. [8]. In order to enhance data integrity and storage optimization, they provide unique strategies for data cleaning, transformation, and loading. The suggested system and its advantages for handling sizable amounts of temporal and spatial RFID data are thoroughly described in the study.
According to Daimler et al. [9], a categorical query language (CQL)-based data transformation infrastructure with formal verification may be built. The significance of data quality is discussed, and a mathematical strategy to guarantee data integrity during transformation is suggested. The study demonstrates the possibility of their strategy in releasing AI’s full potential via trustworthiness in data transformation. For transforming random spreadsheet tables into relational form, Shigarov et al. [10] present a rule-based method. Their domain-specific language and table object model make tabular data analysis and interpretation possible. The suggested model is thoroughly described in the article, along with examples of how it has been used in government statistics and finance.
Chandru et al.’s [11] unique transformation approach is suggested for processing complicated medical data effectively. Using a template-based structure, their strategy entails transforming unstructured medical data into organized data. In the publication, the authors highlight how their method might enhance analytic skills and optimize storage in healthcare settings. An integrated big data analytics-enabled healthcare transformation model is created by Wang et al. [12]. Their concept identifies path-to-value chains for healthcare organizations based on the Practice-Based View (PBV). The article gives a thorough description of the concept, discusses how it is used in healthcare, and offers useful managerial advice. The research indicates the model’s potential for transforming organizational procedures and producing advantages. A smart data transformation procedure is suggested by Dinh et al. [13] for managing and providing smart customer data. Their procedure includes steps for processing data, information, and knowledge. The suggested approach is well explained in the paper, along with how it would affect businesses in terms of actionable insights and increased business value.
Sajid et al. [14] investigate the application of machine learning techniques to suggest predicted data transformations. The article examines the design features of a prototype application that enhances data preparation by making suggestions that are appropriate for the needs of the user. Through a usability assessment, the study confirms the prototype and shows how valuable it is for streamlining data preparation. Mohammed [15] creates a paradigm for data transformation and information retrieval in humanitarian crisis response settings. The Humanitarian Computing Environment (HCE) that is being suggested makes use of classes, vectors, and data transformation methods. The research emphasises the potential of the HCE model in assisting decision-making during humanitarian situations, even if no experimental outcomes are reported.
TabbyXL is a rule-based method for spreadsheet data extraction and transformation presented by Shigarov et al. in their publication [16]. The study proposes a domain-specific language for table analysis and interpretation as well as a table object model. The model’s success in transforming arbitrary spreadsheet tables into relational form is demonstrated by the model’s performance evaluation, which shows strong F-scores for various retrieved items.
This checklist table (see Table 1) provides a summary of whether each article addresses data transformation or data conversion, whether machine learning or deep learning techniques are used, whether optimal feature selection is performed, and whether rule extraction or rule discovery is addressed.
The “Automatic Rule Discovery for Data Transformation Using Fusion of Diversified Feature Formats” (FDFF) is a new way to change data that is introduced by the proposed model. The model’s goal is to improve the speed and accuracy of data transformation processes in environments with complex and different types of data. The FDFF model uses the power of machine learning, specifically XGBoost, along with different feature formats to work with many different kinds of data. It starts by making a repository for feature formats that stores the characteristics and rules for transforming different data formats. This repository is a knowledge base that helps the model transform data in a smart way. The model uses XGBoost’s gradient boosting framework to learn rules and pick the best features. This makes data transformations that are accurate and quick. The FDFF model makes sure that all data transformation needs are met by including different types of feature formats, such as numerical, categorical, and textual data.
Fig. 1 shows the whole framework, which is made up of several parts that work together to automate the data transformation process. The framework is made to handle different kinds of data and find the right rules for putting the data into a format that is wanted. Here is a detailed explanation of each part:
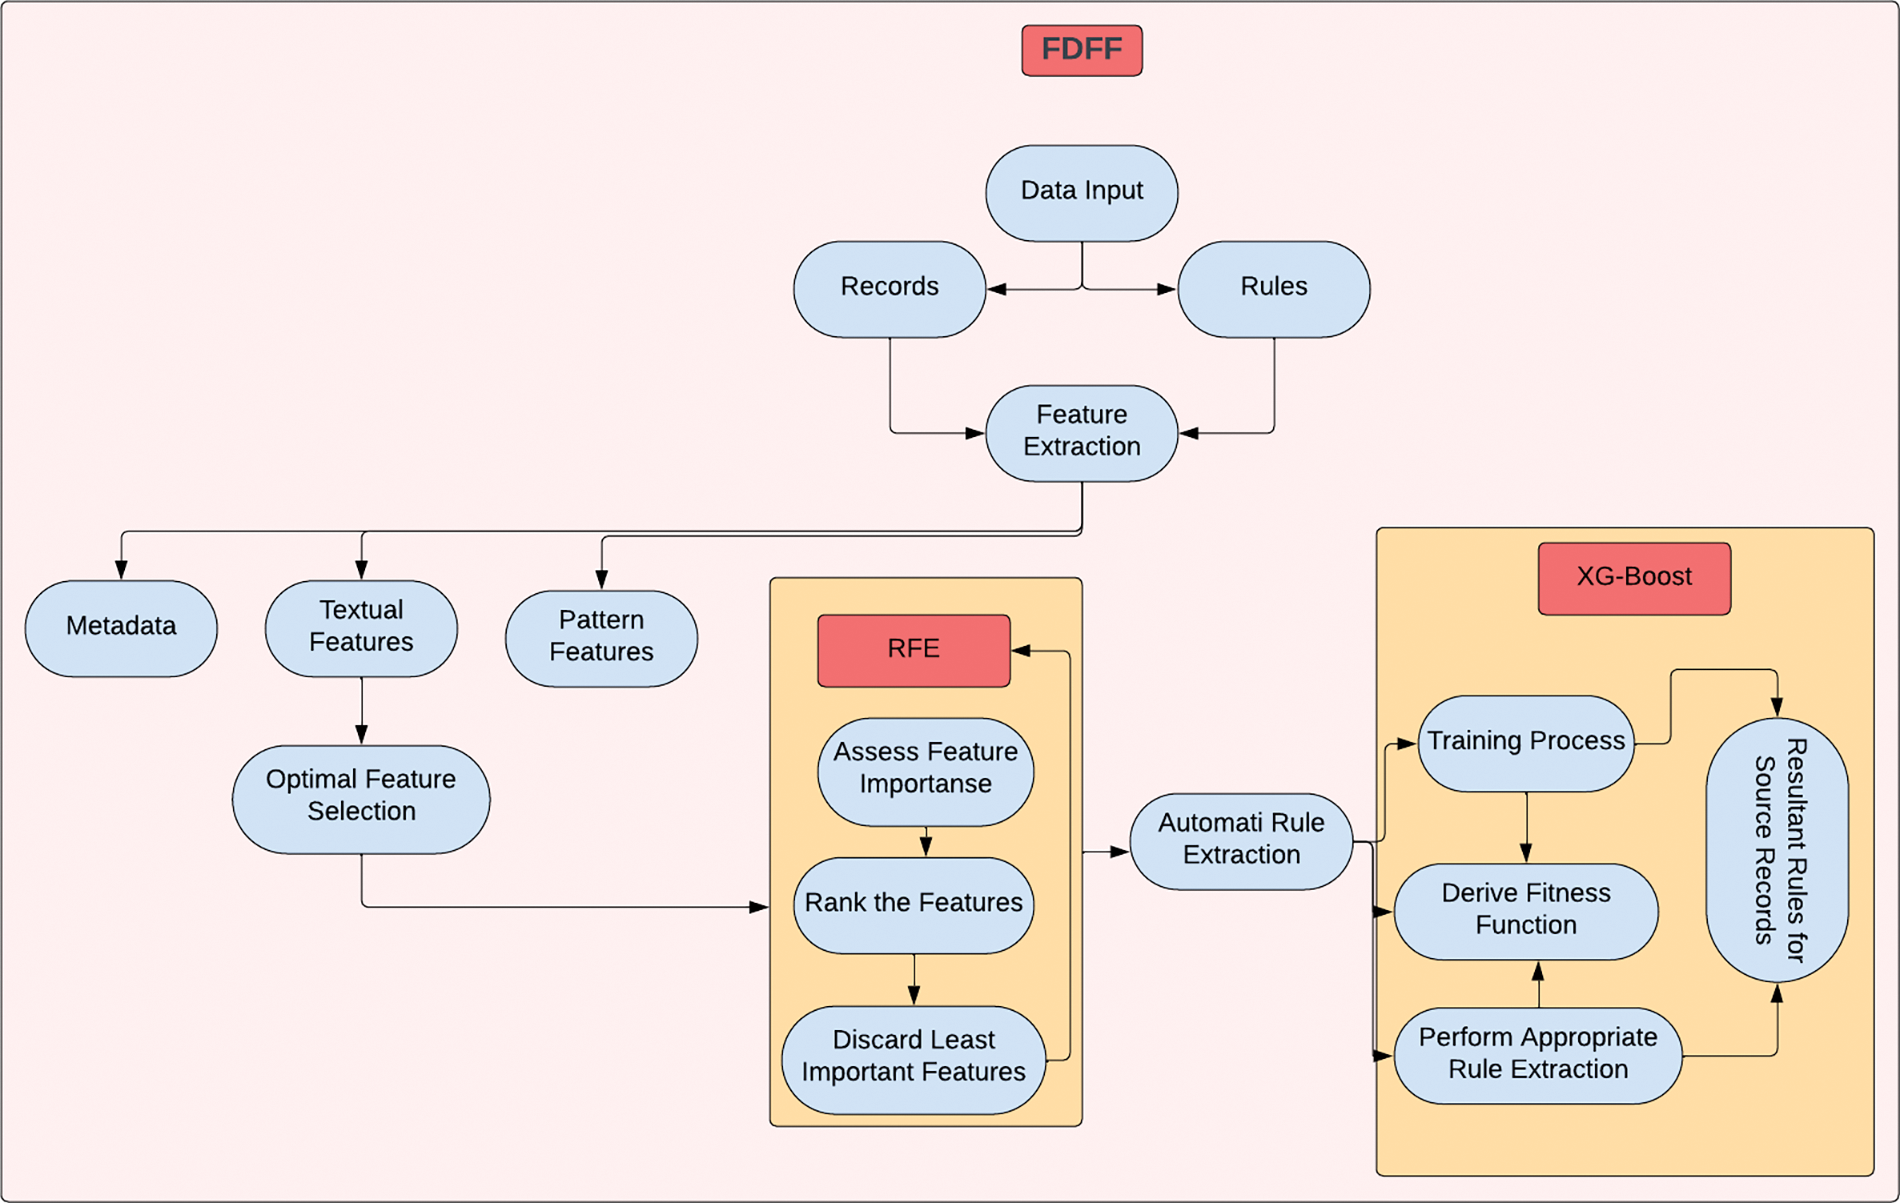
Figure 1: Block diagram of the proposed FDFF
Data Input: The framework starts with the data input, which can come from different databases, files, or other systems for storing data. The input data may have errors, inconsistencies, or different formats that need to be fixed during the process of transformation.
Feature Extraction: The Feature Extraction component takes the input data and pulls out the important features or attributes. In this step, you find and choose the data elements that are necessary for the transformation process. To pull out meaningful features, you can use techniques like statistical analysis, dimensionality reduction, or domain knowledge.
Feature Optimization: The Feature Optimization part is all about optimizing the chosen features to make the transformation process more efficient and effective. Recursive Feature Elimination (RFE) is a technique that can be used to iteratively choose the most informative features while getting rid of the less important ones.
Rule Discovery (or Rule Extraction): The Rule Discovery (or Rule Extraction) part is very important for figuring out the patterns, relationships, and transformations that are needed to change the data effectively. This part looks at the dataset and pulls out the rules that define the desired changes to the data. The rules can be figured out with the help of statistical analysis, machine learning algorithms, or expert knowledge. They tell exactly how to change, validate, or format the data attributes.
Rule Fusion: This part brings together the different rules that come from different sources or methods. By combining the rules, the framework aims to make the data transformation process more accurate and thorough. This step makes sure that the rules cover a wide range of transformation needs and take into account how complicated the data is.
Rule Application: The Rule Application part takes the rules that were found and applies them to the data that was given. In this step, the rules’ transformation instructions are carried out so that the input data can be changed into the desired output format. The rules tell you how to change, validate, or format the data attributes to make sure they match the schema or standards you want.
Output Generation: The framework’s last step is to make the output that has been changed. The rules say what the format, quality, and consistency of the output data should be. The changed data can be saved in databases, files, or other storage systems so that it can be analysed, processed, or combined with data from other systems.
Metadata Features: Imagine dealing with source data comprised of numeric and alphanumeric strings. The nature of these strings, whether numeric or alphanumeric, stands as crucial metadata influencing the application of transformations. An example could be a rule directing numeric strings to be squared, while alphanumeric strings are converted to uppercase. Thus, the data type becomes a key feature in determining the relevant transformation rule.
Textual Features: In scenarios where the transformation of unstructured text data into structured data is necessary, textual features are crucial. Suppose the task involves extracting the names of people from a text. Features such as the position of a word in a sentence, part-of-speech tagging (e.g., identifying whether a word is a noun, verb, adjective, etc.), or n-grams (combinations of adjacent words) could be pivotal in identifying and extracting the desired names.
Pattern Features: Transformation tasks involving date formats serve as good examples for understanding pattern features. If source data in the ‘MM/DD/YYYY’ format needs to be converted into ‘YYYY-MM-DD’ format, pattern features can facilitate capturing these formats. A feature indicating whether a slash (‘/’) follows two or four characters could effectively distinguish between the two date formats.
This investigation delves into the process of converting raw input data into a structured form suitable for machine learning models, emphasizing the extraction of three central features: metadata, textual, and pattern. The conversion of these extracted features into comprehensive feature vectors paves the way for an XGBoost-based model to discern and decode pertinent transformation rules.
The feature extraction process unfolds as follows: Start with a raw dataset
Next, extract textual features from each data pair
The final step is to construct a feature vector for each data pair by combining all the extracted features. This can be mathematically represented as a function
Regarding optimal feature selection, Recursive Feature Elimination (RFE) is utilized. This method involves fitting a model to the data and sequentially eliminating the least important feature until only a pre-specified number of features remain.
Consider a dataset
The first step is to fit a model on the complete dataset and compute the importance of each feature. For linear regression models, the importance of a feature is estimated by the absolute value of its corresponding coefficient. This can be mathematically represented as
The process continues by identifying the feature with the smallest importance
This procedure can be mathematically depicted as follows:
where
•
•
•
The algorithmic steps for the mathematical procedure
1. Initialization: Start with the full set of m features in
2. Model Fitting and Cost Computation: Fit the model
This is the error between the model
3. Feature Importance Calculation: Determine the importance of each feature. In the case of a linear regression model, the importance can be represented by the absolute value of the corresponding coefficient,
4. Feature Elimination: Identify the feature
5. Iteration: Repeat steps 2, 3, and 4 until only a desired number k of features are left.
In mathematical terms, the iterative part of the process can be expressed as:
For each
1. Fit the model F using all current features in
2. Calculate the cost:
3. Remove the feature
4. Output: The output of the procedure is the subset of features
This process successfully delineates the procedure of Recursive Feature Elimination using linear regression. This technique strategically uses the model to pinpoint the most influential features, thereby paving the way for efficient and effective modeling.
The fitness function in the context of rule discovery serves as a measure of the “goodness” or efficacy of the discovered rules. In a machine learning model, the fitness function typically is the objective function that the model optimizes during the training process. For a rule discovery problem, this function needs to capture not only the accuracy of the model’s predictions but also the complexity and interpretability of the discovered rules.
Considering an XGBoost-based rule discovery system, the fitness function is a combination of a differentiable convex loss function and a regularization term. It can be mathematically defined as follows:
Here:
•
•
•
•
•
•
The loss function
The training phase of XGBoost for rule discovery is focused on building an ensemble of decision trees that can accurately predict the target values from the given features as shown in Figs. 2 and 3. The objective is to minimize the loss function, which measures the difference between the actual and predicted target values, while also controlling the complexity of the model.
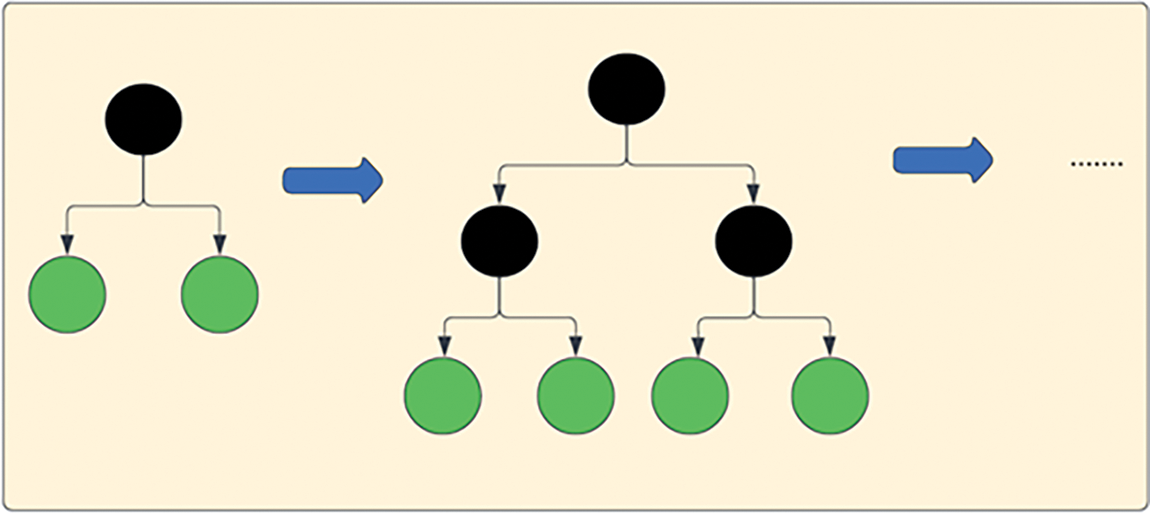
Figure 2: Level-wise tree growth
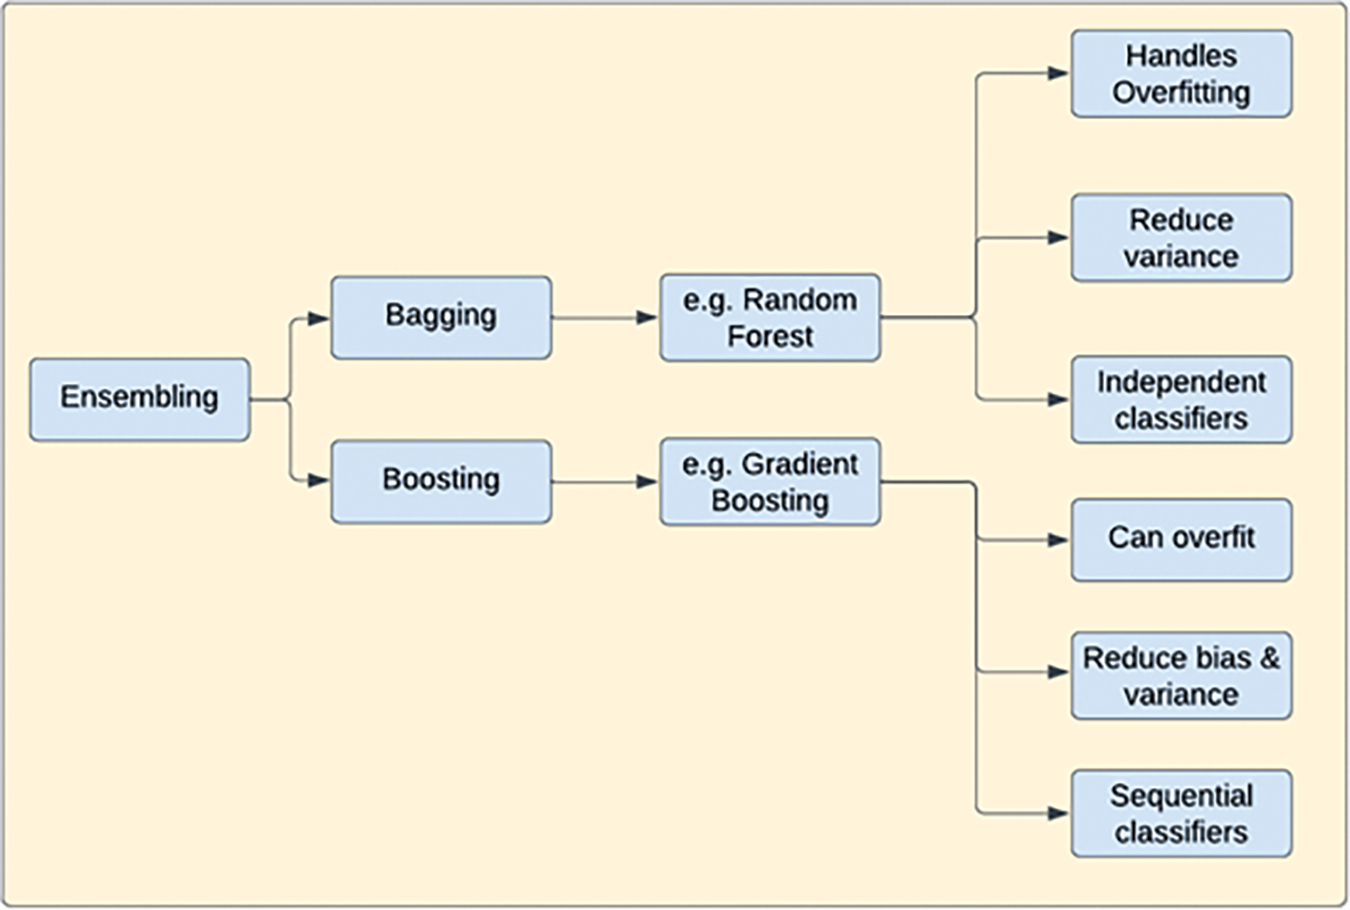
Figure 3: Discovery process
The steps for training XGBoost for rule discovery are as follows:
1. Initialization: The model is initialized by predicting the same output for every instance. The initial prediction can be set as the mean of the target variable, for regression problems.
2. Tree Construction: A decision tree is constructed by recursively splitting the features to minimize the loss function. The process continues until a specified maximum depth is reached or no further splits can reduce the loss. At each split, the feature and threshold that result in the largest reduction in the loss are selected. The optimal split at each node is determined by the following formula (Eq. (1)):
where,
•
•
•
•
3. Tree Pruning: The tree is pruned to avoid overfitting. The pruning process relies on a complexity parameter in the regularization term of the loss function.
4. Weight Update: The leaf weights of the tree are updated to minimize the loss function. The optimal weight
where
5. Iteration: Steps 2 through 4 are repeated to build new trees. Each new tree corrects the residuals of the previous trees.
6. Output: The final prediction is a weighted sum of the predictions of all the trees. In the context of rule discovery, the decision paths leading to these predictions can be viewed as a collection of “IF-THEN” rules.
These steps, when followed, train an XGBoost model to automatically discover transformation rules from the given source-target pairs of data. The rules are embedded within the ensemble of decision trees that the model constructs during training. The discovered rules are easily interpretable, as they are essentially the decision paths within the decision trees.
The algorithmic steps of the training phase of XGBoost for rule discovery can be outlined as follows:
1. Initialization:
• Initialize the model with a constant prediction value, which can be the mean of the target variable.
• Compute the initial prediction value for each instance as:
where
2. For each boosting round (iteration):
• Compute the gradients and Hessians of the loss function for each instance based on the current predictions.
• The gradient of the loss function for the
• The Hessian of the loss function for the
• Where m represents the current iteration.
• Fit a new decision tree using the gradients and Hessians as the targets.
• Compute the leaf weights (scores) by minimizing the following objective for each leaf node:
• Where
• Update the model predictions for each instance based on the new tree:
where
3. Output:
• The final model predictions are the sum of the predictions from all the trees:
where
By following these algorithmic steps and updating the model iteratively, XGBoost learns to discover transformation rules that capture patterns and relationships in the data. The ensemble of decision trees, along with the associated leaf weights, form the basis for interpreting the rules discovered by the model.
The rule discovery phase involves interpreting the trained XGBoost model to discover the transformation rules. The algorithmic steps of the Rule Discovery (Extraction) Phase of XGBoost can be described as follows:
1. For each decision tree in the model:
• Traverse the tree from the root to the leaf nodes.
• Extract the decision rules along the path from the root to each leaf node.
2. For each leaf node in the tree:
• Retrieve the leaf weight (score) associated with the node.
• The score represents the contribution of the corresponding rule to the final prediction.
3. Extracting a rule from a decision path:
• For each split along the decision path, extract the feature and the threshold used for the split.
The extracted rules can be represented as “IF-THEN” statements, where the conditions in the “IF” part represent the feature and threshold from the splits, and the “THEN” part represents the predicted outcome associated with the leaf node.
The algorithmic steps can be summarized as follows:
1. For each decision tree in the model:
a. For each leaf node in the tree:
i. Extract rule: Record the feature and threshold associated with each split along the decision path from the root to the leaf node.
ii. Calculate rule importance: The weight (score) of the leaf node that corresponds to a rule shows how much it contributed to the final prediction.
Mathematically, the rule extraction phase can be represented as:
For each decision tree in the model:
For each leaf node in the tree: -
Here, the
The objective of this experimental study is to evaluate the performance of the proposed FDFF (Fusion of Diversified Feature Formats) model and compare it with other contemporary models and ablated versions of FDFF using a subset of the Zillow Transaction and Assessment Dataset (ZTRAX) [17]. The ZTRAX dataset is a comprehensive collection of real estate data, containing approximately 374 million records, including details such as the built year of existing buildings going back over 100 years.
For the experimental study, a subset of 160,000 records from the ZTRAX dataset is selected. The data is prepared using the ArcGIS Insights Workflow [18], which generates formatted data in Excel format. This formatted data serves as the ground truth for cross-validating the resultant formatted records obtained from the FDFF model, its ablated versions, and the ML-BREDT [7] model when applied to the source records. The dataset consists of 100,000 positive records and 60,000 negative records. Positive records represent the records that require format and pattern corrections based on one or more rules, while negative records are those that do not require any corrections.
The experiments are conducted using a four-fold cross-validation approach. In each fold, 120,000 records (75,000 positive records and 45,000 negative records) are used to discover the rules by the FDFF model, its ablated versions, and the ML-BREDT model. The remaining 40,000 records (25,000 positive records and 15,000 negative records) are used for testing and validation. The models are trained on the 120,000 records to discover the transformation rules. These rules are then applied to the remaining 40,000 records to generate the resultant formatted records. The validity of each resultant record is verified by comparing it with the corresponding record in the resultant Excel sheet generated by the ArcGIS Insights Workflow.
The performance of the FDFF model, its ablated versions, and the ML-BREDT model is evaluated using the following metrics:
• True Positive (TP): The number of positive records correctly identified by the model as requiring modifications.
• False Positive (FP): The number of negative records incorrectly identified by the model as requiring modifications.
• True Negative (TN): The number of negative records correctly identified by the model as not requiring modifications.
• False Negative (FN): The number of positive records incorrectly identified by the model as not requiring modifications. Based on these metrics, the following performance measures are calculated:
• Accuracy: (TP + TN)/(TP + TN + FP + FN)
• Precision: TP/(TP + FP)
• Recall (Sensitivity): TP/(TP + FN)
• Specificity: TN/(TN + FP)
• F1-score: 2 * (Precision * Recall)/(Precision + Recall) Additionally, the execution time and memory usage of each model during the rule discovery and application process are recorded to assess their computational efficiency.
Ablation experiments are conducted to assess the impact and necessity of different components in the FDFF model. The following ablated versions of FDFF are evaluated:
• FDFF without RFE: The Recursive Feature Elimination (RFE) component is removed from the FDFF model, and the model is trained using all the extracted features.
• FDFF with Chi-square: The RFE component is replaced with the Chi-square feature selection method.
• FDFF with LightGBM: The XGBoost algorithm is replaced with LightGBM, another gradient boosting framework. These ablated versions are compared with the complete FDFF model to understand the contribution of each component to the overall performance.
The experimental results are presented, including the performance metrics (accuracy, precision, recall, specificity, F1-score, and Matthews correlation coefficient) of the FDFF model, its ablated versions, FDFF with LightGBM, FDFF without RFE, FDFF with Chi-square, and the ML-BREDT model for each fold of the cross-validation. The average and standard deviation of these metrics across all folds are also reported.
Fig. 4 shows the precision scores of the models in a 4-fold cross-validation scenario. The FDFF model achieves the highest average precision of 0.9797, outperforming all other models. FDFF with LightGBM follows with an average precision of 0.9613, while FDFF without RFE and FDFF with Chi-square have lower precision scores of 0.9342 and 0.94135, respectively. The ML-BREDT model has the lowest average precision of 0.950325.

Figure 4: Precision scores of FDFF, FDFF with LightGBM, FDFF without RFE, FDFF with Chi-square, and ML-BREDT models in 4-fold cross-validation
Fig. 5 presents the specificity scores of the models. The FDFF model exhibits the highest average specificity of 0.9668, indicating its superior ability to correctly identify negative instances. FDFF with LightGBM and FDFF with Chi-square have lower specificity scores of 0.936359 and 0.905301, respectively. FDFF without RFE shows a significant drop in specificity with an average score of 0.895006, while the ML-BREDT model has an average specificity of 0.919775.
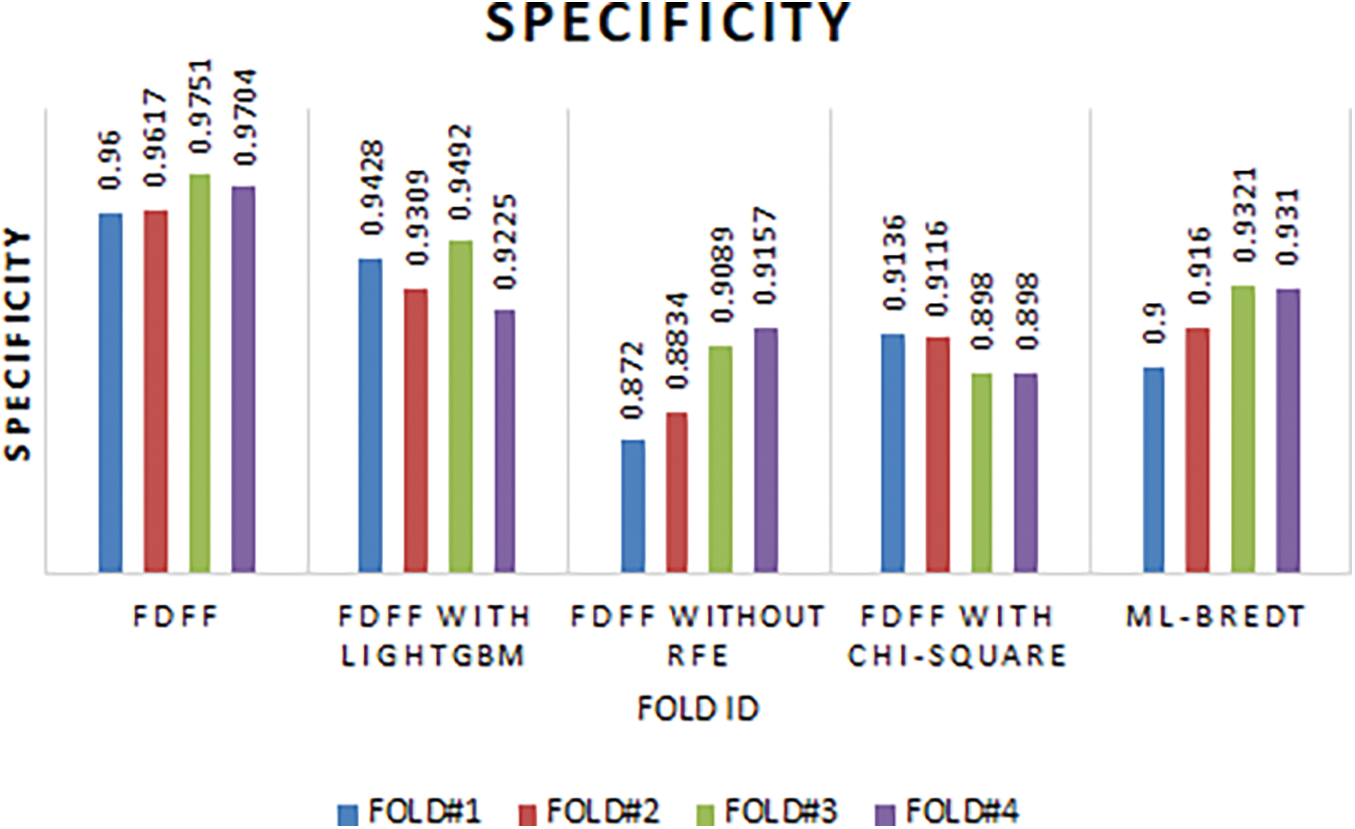
Figure 5: Specificity scores of FDFF, FDFF with LightGBM, FDFF without RFE, FDFF with Chi-square, and ML-BREDT models in 4-fold cross-validation
The sensitivity scores of the models are displayed in Fig. 6. The FDFF model achieves the highest average sensitivity of 0.9601, demonstrating its effectiveness in correctly identifying positive instances. FDFF with LightGBM follows closely with an average sensitivity of 0.946738. FDFF without RFE and FDFF with Chi-square have lower sensitivity scores of 0.892325 and 0.91098, respectively. The ML-BREDT model has an average sensitivity of 0.92.

Figure 6: Sensitivity scores of FDFF, FDFF with LightGBM, FDFF without RFE, FDFF with Chi-square, and ML-BREDT models in 4-fold cross-validation
Fig. 7 shows the accuracy scores of the models. The FDFF model exhibits the highest average accuracy of 0.96265, outperforming all other models. FDFF with LightGBM has an average accuracy of 0.94285, while FDFF without RFE and FDFF with Chi-square have lower accuracy scores of 0.893325 and 0.90885, respectively. The ML-BREDT model has an average accuracy of 0.919925.

Figure 7: F-Measure scores of FDFF, FDFF with LightGBM, FDFF without RFE, FDFF with Chi-square, and ML-BREDT models in 4-fold cross-validation
The F-measure scores of the models are presented in Fig. 8. The FDFF model achieves the highest average F-measure of 0.9825, indicating its superior balance between precision and recall. FDFF with LightGBM follows with an average F-measure of 0.94865. FDFF without RFE and FDFF with Chi-square have lower F-measure scores of 0.91415 and 0.922975, respectively. The ML-BREDT model has an average F-measure of 0.934775.

Figure 8: Accuracy of FDFF, FDFF with LightGBM, FDFF without RFE, FDFF with Chi-square, and ML-BREDT models in 4-fold cross-validation
Fig. 9 displays the Matthews correlation coefficient (MCC) scores of the models. The FDFF model exhibits the highest average MCC of 0.921125, demonstrating its strong overall classification performance. FDFF with LightGBM has an average MCC of 0.87895, while FDFF without RFE and FDFF with Chi-square have lower MCC scores of 0.777275 and 0.80865, respectively. The ML-BREDT model has an average MCC of 0.83175.

Figure 9: MCC statistics of FDFF, FDFF with LightGBM, FDFF without RFE, FDFF with Chi-square, and ML-BREDT models in 4-fold cross-validation
The results of the ablation experiments provide valuable insights into the importance of different components in the FDFF model. The removal of RFE (FDFF without RFE) leads to a significant drop in performance across all metrics, highlighting the crucial role of feature selection in the FDFF model. The replacement of RFE with Chi-square (FDFF with Chi-square) also results in a decrease in performance, suggesting that RFE is a more effective feature selection method for the FDFF model. The use of LightGBM instead of XGBoost (FDFF with LightGBM) shows comparable performance to the complete FDFF model, indicating the potential of LightGBM as an alternative boosting algorithm.
Overall, the experimental results demonstrate the superior performance of the FDFF model compared to its ablated versions and the ML-BREDT model. The FDFF model consistently achieves the highest scores across all evaluation metrics, showcasing its effectiveness in discovering transformation rules and accurately identifying records that require modifications. The ablation experiments further validate the importance of the RFE component and the choice of XGBoost as the boosting algorithm in the FDFF model.
The experimental results provide strong evidence of the FDFF model’s superior performance in data transformation tasks compared to its ablated versions and the ML-BREDT model. The FDFF model’s ability to effectively discover transformation rules and accurately identify records requiring modifications can be attributed to its fusion of diversified feature formats and the use of RFE for feature selection. The ablation experiments reveal the significance of the RFE component in the FDFF model. The removal of RFE leads to a substantial decrease in performance, indicating that feature selection plays a crucial role in the model’s effectiveness. The comparison with alternative feature selection methods, such as Chi-square, further highlights the suitability of RFE for the FDFF model. The use of LightGBM as an alternative boosting algorithm shows promising results, with performance comparable to the complete FDFF model. This suggests that LightGBM could be considered as a potential alternative to XGBoost in certain scenarios, depending on the specific requirements and characteristics of the dataset. The FDFF model’s superior performance has significant implications for automated data preprocessing and data quality assurance. The model’s ability to accurately identify records requiring modifications and apply the necessary transformations can greatly reduce manual efforts and improve data consistency. The discovered transformation rules can be integrated into data pipelines to automate the data transformation process, ensuring data quality and saving time and resources. However, it is important to acknowledge the limitations and challenges encountered during the experimental study. The performance of the FDFF model may vary depending on the characteristics and complexity of the dataset. Further research is needed to evaluate the model’s performance on diverse datasets from different domains to assess its generalizability. Future work can focus on enhancing the FDFF model’s performance by exploring additional feature formats, investigating alternative feature selection methods, and optimizing the model’s hyperparameters. The integration of the FDFF model into real-world data preprocessing workflows and its application to various domains can provide valuable insights into its practical utility and potential improvements.
The experimental study demonstrates the superior performance of the FDFF model in discovering transformation rules and accurately identifying records requiring modifications compared to its ablated versions and the ML-BREDT model. The fusion of diversified feature formats and the use of RFE for feature selection contribute significantly to the model’s effectiveness. The FDFF model’s potential for automated data preprocessing and data quality assurance highlights its significance in the context of data transformation and rule discovery. Further research and real-world applications can help refine the model and extend its applicability to diverse domains.
The proposed “Automatic Rule Discovery for Data Transformation Using Fusion of Diversified Feature Formats” framework, in conclusion, demonstrates a thorough method for automating the process of data transformation by fusing various feature formats. The FDFF combines feature extraction, optimization, and rule discovery in an effort to increase the accuracy and speed of data transformation tasks. Selecting the best features for improved rule extraction is made simpler when machine learning techniques like Recursive Feature Elimination (RFE) are combined. To ensure that the data is accurate and of high quality, the FDFF provides a systematic and automated way to modify it based on the rules discovered and refine it based on these rules. The experiments’ findings demonstrate that the suggested model performs well for precise and quick data transformation. Overall, this research contributes to the improvement of automated data transformation techniques and has potential applications in many fields where data integration and transformation are critical for decision-making and data analysis.
Acknowledgement: We would like to express our sincere gratitude to the Department of Computer Science and Engineering at JNTU Ananthapuramu and MLRITM-Hyderabad for their support and the facilities provided, which greatly assisted the research. Special thanks also to our colleagues who provided insight and expertise that greatly assisted this research.
Funding Statement: This research did not receive any specific grant from funding agencies in the public, commercial, or not-for-profit sectors.
Author Contributions: G. Sunil Santhosh Kumar: Conceptualization, Methodology, Software, Formal Analysis, Investigation, Writing-Original Draft. M. Rudra Kumar: Validation, Supervision, Writing-Review & Editing, Ensuring the originality and significance of the study.
Availability of Data and Materials: The datasets generated and analyzed during the current study are available from the corresponding author on reasonable request. Additional details regarding data sources and processing are documented within the manuscript to ensure transparency and reproducibility.
Conflicts of Interest: The authors declare no conflict of interest regarding the publication of this paper. The research was conducted in the absence of any commercial or financial relationships that could be construed as a potential conflict of interest.
References
1. K. Krish, Introduction to big data. in Data Warehousing in the Age of Big Data, 1st ed., Waltham, USA: Morgan Kaufmann, pp. 3–14, 2013. doi: 10.1016/C2012-0-02737-8. [Google Scholar] [CrossRef]
2. A. Rouhi and K. Lano, “Towards a Pattern-based model transformation framework,” Softw. Pract. Exp., vol. 53, no. 9, pp. 1815–1849, Sep. 2023. doi: 10.1002/spe.3215. [Google Scholar] [CrossRef]
3. H. Jeon and S. Oh, “Hybrid-recursive feature elimination for efficient feature selection,” Appl. Sci., vol. 10, no. 9, pp. 3211, 4 May 2020. doi: 10.3390/app10093211. [Google Scholar] [CrossRef]
4. T. Chen and C. Guestrin, “XGBoost: A scalable tree boosting system,” in Proc. 22nd ACM SIGKDD Int. Conf. Knowl. Disc. Data Min., San Francisco, California, USA, ACM, Aug. 2016, pp. 785–794. doi: 10.1145/2939672.2939785. [Google Scholar] [CrossRef]
5. P. Jiménez and R. Corchuelo, “On the design of an advanced business rule engine,” Softw.: Pract. Exp., vol. 52, no. 10, pp. 2097–2126, Oct. 2022. doi: 10.1002/spe.3115. [Google Scholar] [CrossRef]
6. M. Belcao, E. Falzone, E. Bionda, and E. D. Valle, “Chimera: A bridge between big data analytics and semantic technologies,” in Proc. 20th Int. Semant. Web Conf. (ISWC 2021), Cham: Springer, Oct. 24–28, 2021, vol. 12922, pp. 463–479. doi: 10.1007/978-3-030-88361-4_27. [Google Scholar] [CrossRef]
7. K. Neelima and S. Vasundra, “Machine learning-based business rule engine data transformation over high-speed networks,” Comput. Assist. Methods Eng. Sci., vol. 30, no. 1, pp. 55–71, 2022. doi: 10.24423/cames.472. [Google Scholar] [CrossRef]
8. B. Kochar and R. S. Chhillar, “An effective data warehousing system for RFID using novel data cleaning, data transformation and loading techniques,” Int. Arab J. Inf. Technol., vol. 9, no. 3, pp. 208–216, 2012. [Google Scholar]
9. E. Daimler and R. Wisnesky, “Informal data transformation considered harmful,” Jan. 02, 2020. doi: 10.48550/arXiv.2001.00338. [Google Scholar] [CrossRef]
10. A. O. Shigarov and A. A. Mikhailov, “Rule-based spreadsheet data transformation from arbitrary to relational tables,” Inf. Syst., vol. 71, no. 1, pp. 123–136, Nov. 2017. doi: 10.1016/j.is.2017.08.004. [Google Scholar] [CrossRef]
11. A. S. Chandru and K. Seetharam, “Framework for efficient transformation for complex medical data for improving analytical capability,” Int. J. Electr. Comput. Eng., vol. 10, no. 5, pp. 4853, 1 Oct. 2020. doi: 10.11591/ijece.v10i5.pp4853-4862. [Google Scholar] [CrossRef]
12. Y. Wang, L. A. Kung, W. Y. C. Wang, and C. G. Cegielski, “An integrated big data analytics-enabled transformation model: Application to health care,” Inf. Manag., vol. 55, no. 1, pp. 64–79, Jan. 2018. doi: 10.1016/j.im.2017.04.001. [Google Scholar] [CrossRef]
13. T. L. Dinh, A. K. D. Nguyen, N. N. Chan, M. H. V. Thi, and C. P. Nguyen, “From customer data to smart customer data: The smart data transformation process,” in Proc. ITM Web of Conf.,2022, vol. 41, pp. 05002. doi: 10.1051/itmconf/20224105002. [Google Scholar] [CrossRef]
14. S. Sajid, B. M. V. Zernichow, A. Soylu, and D. Roman, “Predictive data transformation suggestions in grafterizer using machine learning,” in Proc. 13th Int. Conf. Metadata Semant. Res. (MTSR 2019), Rome, Italy, Springer International Publishing, Oct. 28–31, 2019, pp. 137–149. doi: 10.1007/978-3-030-36599-8_12. [Google Scholar] [CrossRef]
15. S. A. A. Mohammed, “Data transformation and knowledge retrieval for humanitarian crisis response,” Ph.D. dissertation, University of Otago, New Zealand, 2022. [Google Scholar]
16. A. Shigarov, V. Khristyuk, and A. Mikhailov, “TabbyXL: Software platform for rule-based spreadsheet data extraction and transformation,” SoftwareX, vol. 10, no. 2, pp. 1–6, 2019. doi: 10.1016/j.softx.2019.100270. [Google Scholar] [CrossRef]
17. Zillow Transaction and Assessment Dataset (ZTRAX). Accessed: Oct. 02, 2023. [Online]. Available: https://github.com/zillow-research/ztrax [Google Scholar]
18. M. Scott Lauren and M. V. Janikas, “Spatial statistics in ArcGIS,” in Handbook of Applied Spatial Analysis: Software Tools, Methods and Applications. Berlin Heidelberg: Springer Berlin Heidelberg, 2009, pp. 27–41. Accessed: Oct. 02, 2023. [Online]. Available: https://link.springer.com/chapter/10.1007/978-3-642-03647-7_2 [Google Scholar]
Cite This Article
 Copyright © 2024 The Author(s). Published by Tech Science Press.
This work is licensed under a Creative Commons Attribution 4.0 International License , which permits unrestricted use, distribution, and reproduction in any medium, provided the original work is properly cited.
 Downloads
 Citation Tools