
 Submit a Paper
 Propose a Special lssue
 Open Access
ARTICLE

A Tabletop Nano-CT Image Noise Reduction Network Based on 3-Dimensional Axial Attention Mechanism
Henan Key Laboratory of Imaging and Intelligent Processing, PLA Strategic Support Force Information Engineering University, Zhengzhou, 450000, China
* Corresponding Author: Bin Yan. Email:
(This article belongs to the Special Issue: Advances and Applications in Signal, Image and Video Processing)
Computers, Materials & Continua 2024, 80(1), 1711-1725. https://doi.org/10.32604/cmc.2024.049623
Received 12 January 2024; Accepted 28 April 2024; Issue published 18 July 2024
 View Full Text
 Download PDF
Abstract
Nano-computed tomography (Nano-CT) is an emerging, high-resolution imaging technique. However, due to their low-light properties, tabletop Nano-CT has to be scanned under long exposure conditions, which the scanning process is time-consuming. For 3D reconstruction data, this paper proposed a lightweight 3D noise reduction method for desktop-level Nano-CT called AAD-ResNet (Axial Attention DeNoise ResNet). The network is framed by the U-net structure. The encoder and decoder are incorporated with the proposed 3D axial attention mechanism and residual dense block. Each layer of the residual dense block can directly access the features of the previous layer, which reduces the redundancy of parameters and improves the efficiency of network training. The 3D axial attention mechanism enhances the correlation between 3D information in the training process and captures the long-distance dependence. It can improve the noise reduction effect and avoid the loss of image structure details. Experimental results show that the network can effectively improve the image quality of a 0.1-s exposure scan to a level close to a 3-s exposure, significantly shortening the sample scanning time.Keywords
Computed tomography (CT) is the technique that uses the projection of X-ray through the object and mathematical formulas to reconstruct the three-dimensional internal structure of the object. With the rapid development of X-ray sources and high-resolution detectors, Nano-Computed Tomography (Nano-CT) realizes non-destructive high-resolution imaging of the nanoscale structure of the object being detected [1], which provides an unprecedented opportunity for direct observation of the fine structure of the object and has been widely used in many fields such as material science [2,3], drug development [4], integrated circuits, and so on [5–7].
Tabletop Nano-CT (after this referred to as Nano-CT) is exhibits portability characteristics, user-friendly operation, and low maintenance requirements. However, in practical applications, there are still some problems that affect the imaging quality. The X-ray source of Nano-CT adopts the nanoscale focus spot ray source with low-energy characteristics. Compared with micro-CT, the photon intensity of Nano-CT has decreased by 1–2 orders of magnitude, and its ray source has small power and weak light intensity. At short exposure times, Nano-CT is in a weak photon condition, and the reduced number of photons received by the detector can lead to noise interference in the projection data [8]. These subtle noise changes will be amplified during the image reconstruction process, resulting in serious noise and artifacts in the reconstructed CT image, which cannot accurately reflect the real structure inside the object, and thus is not conducive to the subsequent analysis of the internal structure of the measured object. Although the noise can be suppressed by increasing the exposure time, this will substantially increase the scanning time, decreasing scanning efficiency. Therefore, reducing the noise level in Nano-CT images is crucial in improving image quality, especially under fast scanning conditions. The achievement of both high efficiency and high-quality imaging in Nano-CT is crucial for advancing the practical application of this technology.
The development of deep neural networks provides a new processing method for image post-processing, and the network realizes the denoising of images through the nonlinear mapping relationship between image features. Thanks to deep models’ strong linear fitting ability, deep learning has achieved satisfactory performance in medical CT noise reduction [9–11]. According to the current research, noise reduction methods for 2D CT images have been relatively abundant and are gradually becoming mature. Although the noise reduction methods for 2D CT images have been relatively mature, the 3D noise reduction of Nano-CT is still a challenging problem. Nano-CT as a three-dimensional imaging technology has many applications in many fields. These application scenarios require high resolution and sharpness of volume data. For example, additive manufacturing of precision components [12], volume measurement [13], and fossil grain characterization [14]. The 3D correlation of Nano-CT exists not only within slices but also between slices. Directly stacking 2D noise reduction slices may cause incoherent volume data [15]. Therefore, it is necessary to consider extracting features from adjacent slices to capture and enhance the structural details of CT images. However, implementing 3D network noise reduction requires storing volume data and numerous network parameters in memory, which requires high memory. Noise reduction of volume data requires considerable time and computational resources. This problem limits further research, development, and applications.
This paper focuses on the problems of a large number of parameters, long training time, and high requirement of computational resources of existing 3D networks. We aim to achieve fast and high-quality Nano-CT imaging by developing efficient 3D image processing algorithms without significantly increasing computational costs. So, we propose a lightweight Nano-CT 3D Axial Attention DeNoise ResNet (AAD-ResNet). The main innovations of this paper are as follows:
(1) We propose an encode-decode noise reduction network based on a three-dimensional axial attention mechanism, which can effectively improve the image quality of a 0.1-s exposure scan to a level close to a 3-s exposure. This significantly shortens the sample scanning time.
(2) We design a 3D axial attention that apply attention independently for each axis, and then correlate the attention of these three axes to realize global attention. This method effectively reduces the number of network parameters while capturing the long-range dependencies among 3D data. The proposed 3D network parameter number can be reduced to 6.64 M, which is suitable for application scenarios with limited computational resources.
(3) Depending on the tabletop Nano-CT device, various samples (including corals and rocks) are scanned to construct the network training dataset. Experimental results show that the proposed method performs significantly better than existing methods in 3D networks. Ablation experiments verified the effectiveness of the components in AAD-ResNet.
In this section, we review related works including 2D CT image denoising, current 3D network designs and applications, and the application of self-attention mechanism. Recent research has focused on data-driven and model-driven deep learning strategies. Data-driven methods have been used to learn a fully nonlinear mapping from noise images to target images by pairing training data.
There are many studies on improving the image quality of medical CT slices. In 2023, Li et al. [16] proposed a Progressive Circular Convolutional Neural Network (PCCNN) that introduces a noise transfer model. Transfers noise from low-dose CT to normal-dose CT using denoised and noisy CT images generated from unpaired CT images. The denoising model also contains a progressive module that efficiently removes noise through a multistage wavelet transform without sacrificing high-frequency components such as edges and details. In 2023, Ma et al. [17] proposed a Residual Dense Network with Self-Calibrated Convolution for low-dose CT image denoising. This network fully utilizes the hierarchical features of the original image to obtain a reconstructed image with more details.
2.2 3D Network Design and Application
Due to the 3D imaging properties of Nano-CT, the reconstruction results are 3D data; the correlations in the 3D still exist between slices apart from the 2D correlations in the slice. For this reason, extracting the feature from the adjacent slices is very effective for capturing and enhancing fine details.
3D network design: In 2017, Liu et al. mentioned the importance of the third dimension and applied a 3D convolution over 2D convolutions for the segmentation of Digital Breast Tomosynthesis and CT [18]. In 2023, Liu et al. [19] proposed an attention mechanism based 3D segmentation network, and refer to this algorithm as the Dilated Hierarchical Decoupled Convolution Network with Attention (ADHDC-Net). In 2023, Cao et al. proposed a 3D lightweight segmentation network for multimodal brain tumor MRI images. It added 3D SA attention to skip connections to address the semantic gap problem with spatial and channel aggregation [20].
3D image denoising: In 2018, You et al. [21] proposed a Structure-Sensitive Multiscale Generative Adversarial Network (SMGAN) that utilizes the information of 3D data to improve image quality, which can effectively preserve the structural and textural information of low-dose CT images and significantly reduce noise and artifacts. In the same year, Shan et al. [22] proposed a Conveying Path-Based Convolutional Encoder-Decoder network used for LDCT noise reduction within the GAN framework. An initial 3D CPCE denoising model is directly obtained by extending a trained 2D CNN. Then, it is fine-tuned to merge 3D spatial information from neighboring slices. The method suppresses image noise and preserves fine image structure. In 2019, Yin et al. [23] proposed a domain-progressive 3D residual convolutional network for LDCT noise reduction, which can reduce CT images from the projection domain to the image domain. In 2020, Li et al. [24] proposed a new 3D self-attention convolutional neural network that utilizes 3D data to capture a wide range of spatial information within and between CT slices. In 2022, Gunduzalp et al. [25] proposed a 3D U-Net based noise reduction method, and the proposed 3D U-NetR architecture was tested on simulated and real chest CT data to achieve better noise reduction. In 2023, Zhou et al. [15] aimed to investigate whether multi-slice input improves the denoising performance compared to single-slice input and whether the 3D network architecture outperforms the 2D version in utilizing multi-slice input.
The existing research on 3D networks provides new ideas and directions to solve the noise reduction of Nano-CT 3D data.
The self-attention mechanism enables the model to automatically learn the relationships between different positions within a sequence. It dynamically adjusts the level of attention each location pays to other locations by calculating the interrelationships between each location in the sequence and all other locations in the sequence [26]. This mechanism allows the model to capture long-distance dependencies, independent of sequence length.
Self-attention is the core idea of Transformer, and the mechanism of self-attention has become a hot research topic and has been explored in various NLP tasks. For example, Wang et al. [27] proposed a convolution-free Token2Token extended visual Transformer for low-dose CT noise removal. The method applied Transformer for noise suppression processing and enhanced the feature optimization process in the model by introducing inflated convolution, which better removes common boundary artifacts. In 2023, Zhu et al. [28] proposed an LDCT noise and artifact suppressing network based on the Swin Transformer. The noise removal sub-network improves the network’s ability to extract relevant image features by using a Swin Transformer with a shift window as an encoder-decoder for global feature fusion. In 2023, Kirillov et al. [29] proposed a robust segment anything model. SAM improves the accuracy and efficiency of image recognition and segmentation by using the Transformer architecture.
Although the self-attention mechanism dramatically improves network performance optimization, it requires high computational resources due to its higher complexity. Currently, there are not many studies on lightweight 3D networks and self-attention mechanisms; later, we introduce in detail the lightweight 3D network proposed in this paper and design a 3D axial attention mechanism to improve noise reduction performance on Nano-CT images.
The reconstructed Nano-CT image mainly contains photon statistical noise [30] and reconstruction noise [31]. In this paper, the short exposure time scan image is assumed to be the approximate sum of the long exposure time scan image and the noise. Then, the Nano-CT reconstructed image can be expressed in a linear algebraic form:
where

Figure 1: The propose noise reduction process
First, we scan the samples using the Nano-CT device to obtain training data for long and short exposure times. Subsequently, the FBP algorithm reconstructs the projection data to obtain the reconstructed volume data [32]. Since the 3D volume data occupy high memory, we cropped the 3D volume data. The 512 × 512 × 1024 volume data was cropped into multiple 64 × 64 × 64 block data. Finally, we input these block data into AAD-ResNet to get clean block data.
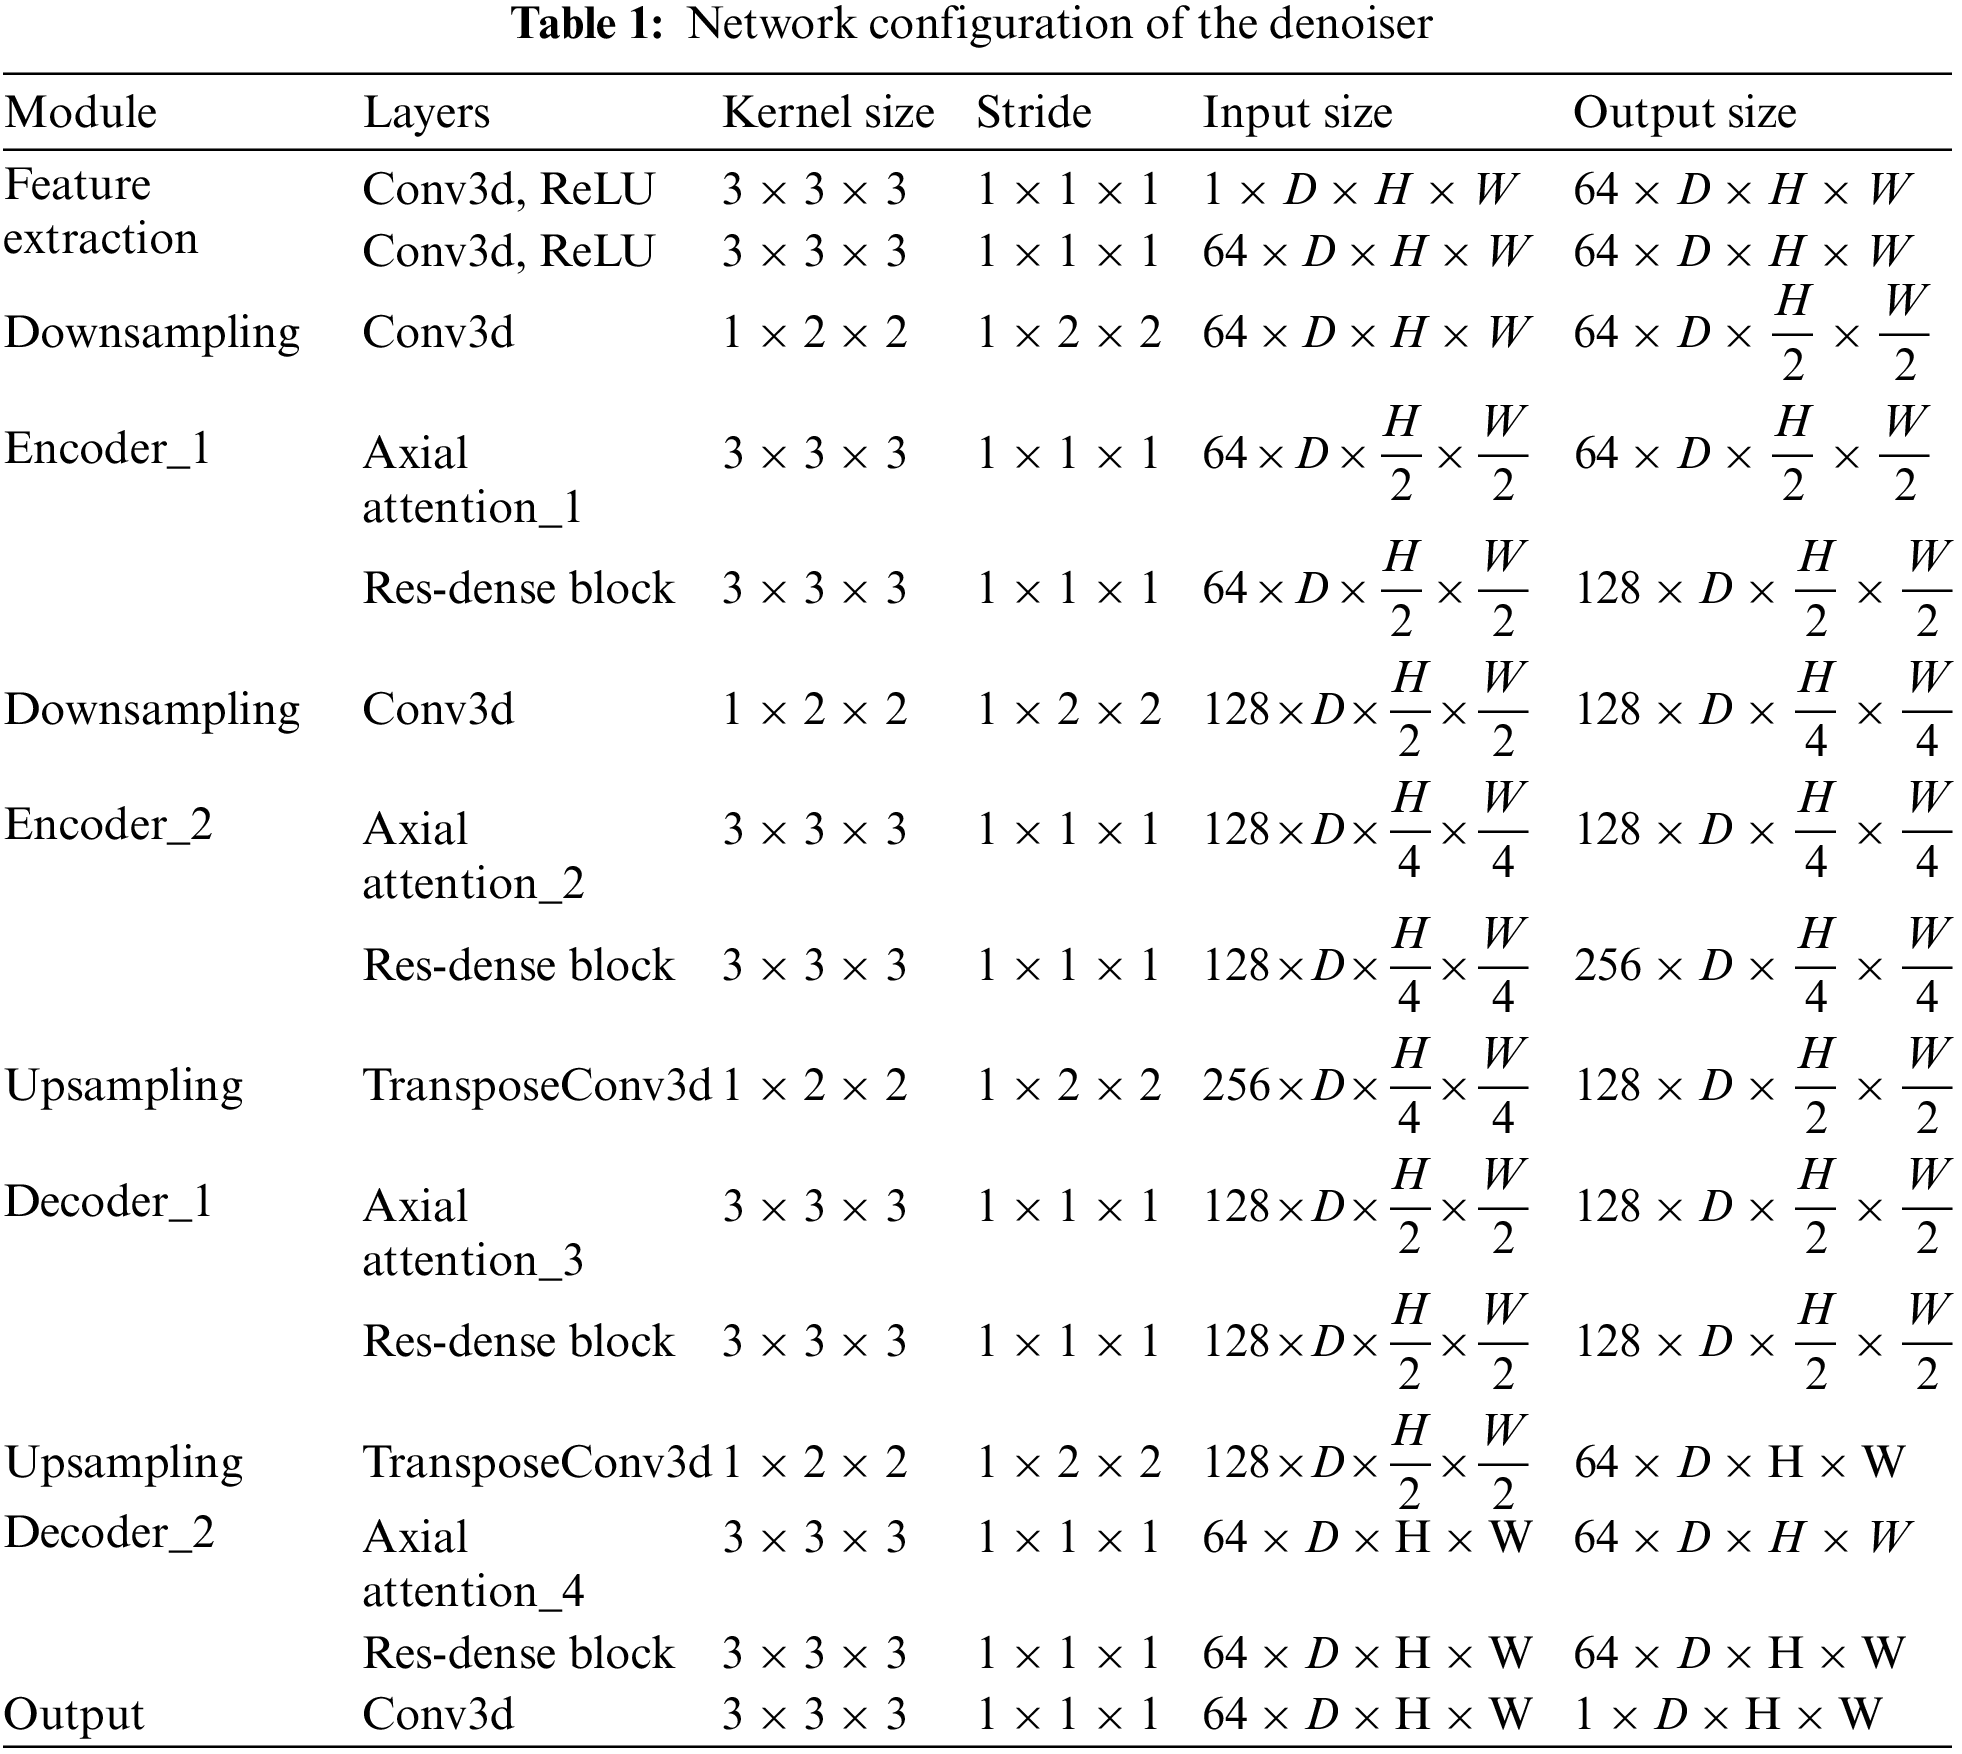
Inspired by the successful application of 3D-Unet in medical image segmentation [33], we constructed AAD-ResNet using 3D convolution. Fig. 2 presents the network architecture, containing encoding and decoding paths, each with three resolution levels. The encoder and decoder contain 3D axial attention mechanisms and residual dense blocks. This network design can efficiently capture contextual information and preserve local details to achieve better performance in Nano-CT noise reduction.

Figure 2: AAD-ResNet network structure
Three-dimensional axial attention mechanism: The self-attention mechanism enables associations between a target pixel and any other pixel. In many Natural Language Processing (NLP) applications, Transformer has been demonstrated to encode long-distance dependencies [26]. It is due to the self-attention mechanism that reveals the correlations between the input sequences. This involves considerable computation, especially when the feature map size is large, and can lead to a significant efficiency decrease. To cope with this computational demand while efficiently integrating global information and preserving long-distance dependencies, we propose a three-dimensional axial attention mechanism that improves efficiency by constraining attention on specific axial, as shown in Fig. 3.

Figure 3: Axial attention mechanism schematic
For the computation of the axial attention mechanism, we need to compute Query, Key, and Value for all depths of all columns in each row. These can be realized by linear changes:
where
Typically, the self-attention mechanism needs to computes the relationships between all the pixels in the image when dealing with 3D data, which usually involves a large weight matrix, thus increasing the number of parameters. Pixel position encoding is generally obtained by network training, which also increases the number of parameters of the model. While our proposed 3D axial attention mechanism only compute the relationship between elements in one direction. The computational complexity is reduced by handling rows, columns, and depths and combining their attention separately. It effectively reduces the number of parameters and computation of the model while maintaining the performance of the model. This mechanism is crucial when dealing with large-scale 3D data, as it can improve computational efficiency without sacrificing performance.
For example, suppose the dimension of the input image block is
Residual dense module: This paper uses residual dense blocks to extract many local properties. Specifically, we use three 3 × 3 × 3 convolutions to construct a third-order dense connection. The residual connection [35] adaptively fuses the previous and current local features to better learn these features. By incorporating residual connection and dense connection [36], the proposed model can learn image features more deeply and improve the noise reduction performance of the network. In addition, since our network applied dense blocks, each layer can directly access the previous layers, reducing the redundancy of parameters and improving the network’s training efficiency [37].
The network structure of each section is shown below. Each part of our model uses 3D convolution to enhance the correlation between slices. The specific parameters of the network are shown in Table 1. At feature extraction, we use two convolution blocks with kernel size of 3 × 3 × 3 and the filter is 64. We use convolution with kernel size of 1 × 2 × 2 and stride of 1 × 2 × 2 for down-sampling. Similarly, the transposed convolution with kernel size 1 × 2 × 2 and stride 1 × 2 × 2 is used for up-sampling. We use a 3D axial attention mechanism and residual dense block in the encoder and decoder.
The network was trained and tested in the PyTorch framework on the AMAX workstation with an Intel Xeon Gold 5118 CPU and 64 GB of available memory. Used three Graphics Processing Units GeForce RTX 3090Ti. An Adam optimizer with a 1 × 10⁻⁴ learning rate was used to minimize the objective function during the network training. In the network parameter training optimization experiments, the batch size was set to 48, the epoch was set to 100, and it took 36 h to complete the training on 14,297 pairs of real datasets.
The proposed method uses deep networks to deal with the problem of Nano-CT image noise, which is independent of the statistical properties of the noise [28]. It attempts to learn from many data pairs to find the mapping relationship between short exposure time CT images and long exposure time. Therefore, Nano-CT denoising can be summarized as the optimal approximation of the objective function, and the denoising process can be expressed as:
where
In this section, we conduct a series of experiments on the real data to fully evaluate the proposed AAD-ResNet. Detailed information about these experiments is described as follows.
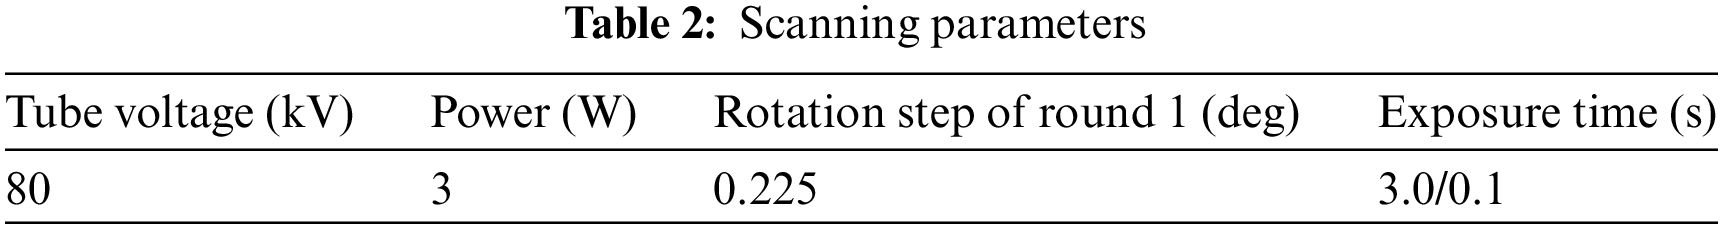
To ensure the accuracy and generalization of the model usually requires a large amount of data to train the model. We have accumulated two types of sample data (fossil and coral) based on Nano-CT. We acquire real data under different exposure time scanning conditions. The reconstruction algorithm obtains the 3D volume data to construct the dataset. The scanning parameters are shown in Table 2, the scanning parameter tube voltage is set to 80 kV, and the power of the ray source is set to 3 W. The long exposure time is set to 3 s, and the short exposure time is set to 0.1 s. Different quality CT images are acquired by this acquisition method. The scans that are taken at long exposure times are of high quality and are used as labels for network training. The scans that are taken at short exposure times are of poor quality, contain a lot of noise and artifacts, and are used as training data.
In addition, due to the size of the Nano-CT reconstructed volume data, which is 512 × 512 × 1024, the memory consumption is high during processing. Due to the limitation of computer hardware, it is inefficient and infeasible to process complete 3D CT images directly. Therefore, we consider overlapping and cropping the full 3D volume data into block data. This strategy is effective and efficient and can significantly increase the training dataset. In network training, models trained on small image blocks converge faster and use less GPU memory, while models trained on larger image blocks have better image quality and take longer to train. Considering the model convergence, memory usage, model performance, and testing time, the method in this paper selects 64 × 64 × 64 block data for network training. The consecutive 128 layers in the volume data are randomly chosen as the test data (the test data size is 512 × 512 × 128). Each dataset contains 14,297 training data and 2,523 test data.
The image recovery task widely uses the evaluation metrics Peak Signal Noise Ratio (PSNR) and Structural Similarity (SSIM) to evaluate the method performance. The formulae for PSNR and SSIM are defined as follows:
where
5 Experimental Results and Analysis
To analyze and judge the denoising effect of the methods proposed in this paper, we choose 3D UnetR, ADHDC-Net, and 3D-Unet as the comparison methods. We use their officially released codes as much as possible to make a fairer comparison with the existing methods. We train and test the network according to the training parameters given in the related literature.
First, we show the test results for the fossil data, where we randomly show the xOy and xOz planes of the test data. As shown in Fig. 4, from left to right, long exposure time image, short exposure time image, UnetR, ADHDCNet, 3D-Unet, and the proposed method. From Fig. 4, it can be seen that all the methods can reduce the noise in the Nano-CT images with different degrees. Fig. 3 demonstrates the deviation between the noise reduction results of each method and the label image. All processing methods can suppress the noise in the Nano-CT image. However, each method also loses part of the image information while removing noise, especially the loss of image contour information is more serious. In contrast, the method proposed in this paper avoids this phenomenon as much as possible.
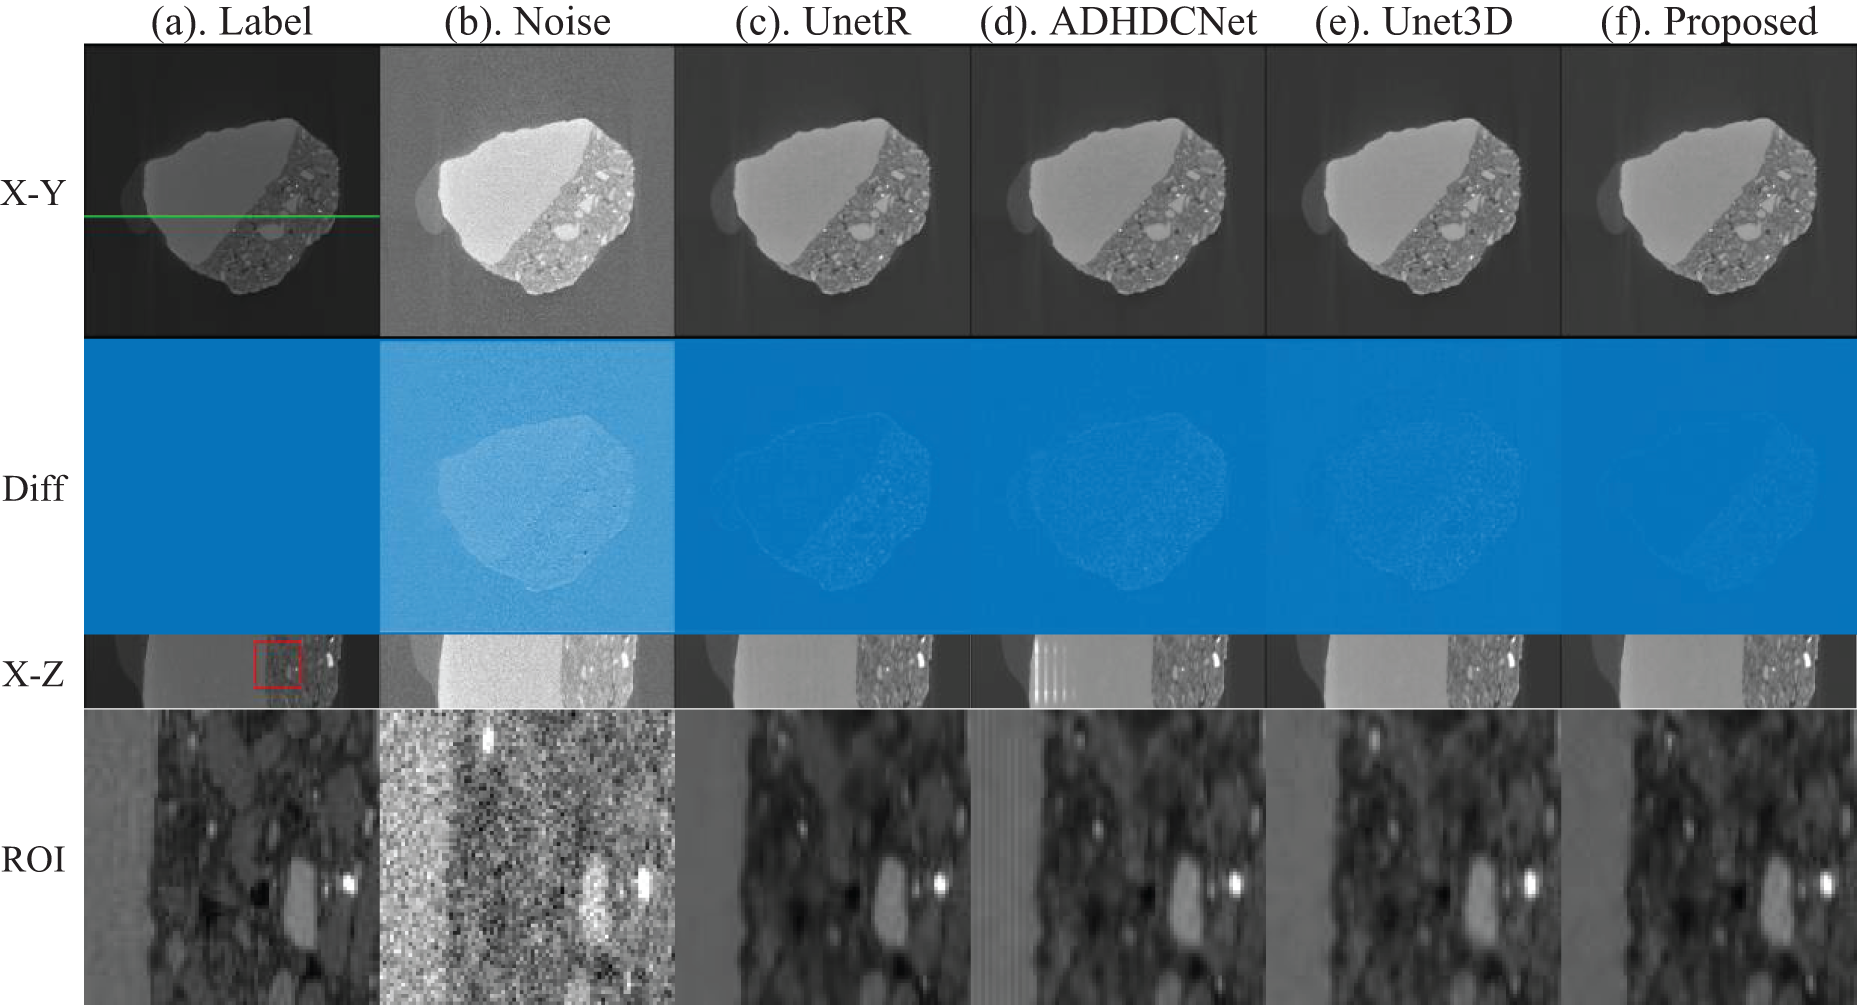
Figure 4: Comparison of the fossil denoising results of actual short-exposure images. From (a) to (f) indicate the long exposure CT images, short exposure CT images, UnetR, ADHDCNet, 3D-Unet, and proposed denoised images
To better identify the low-contrast regions and further compare the results of each method in terms of detailed structural processing effects, we mark the region of interest (ROI) with a red box in Fig. 4 to observe better and compare the correction effects of each method. More obvious splicing gaps exist in the comparison methods UnetR and ADHDCNet processing results. Our method can effectively improve the image quality of a 0.1-s exposure scan to a level close to a 3-s exposure, preserving the image structure and detail information.
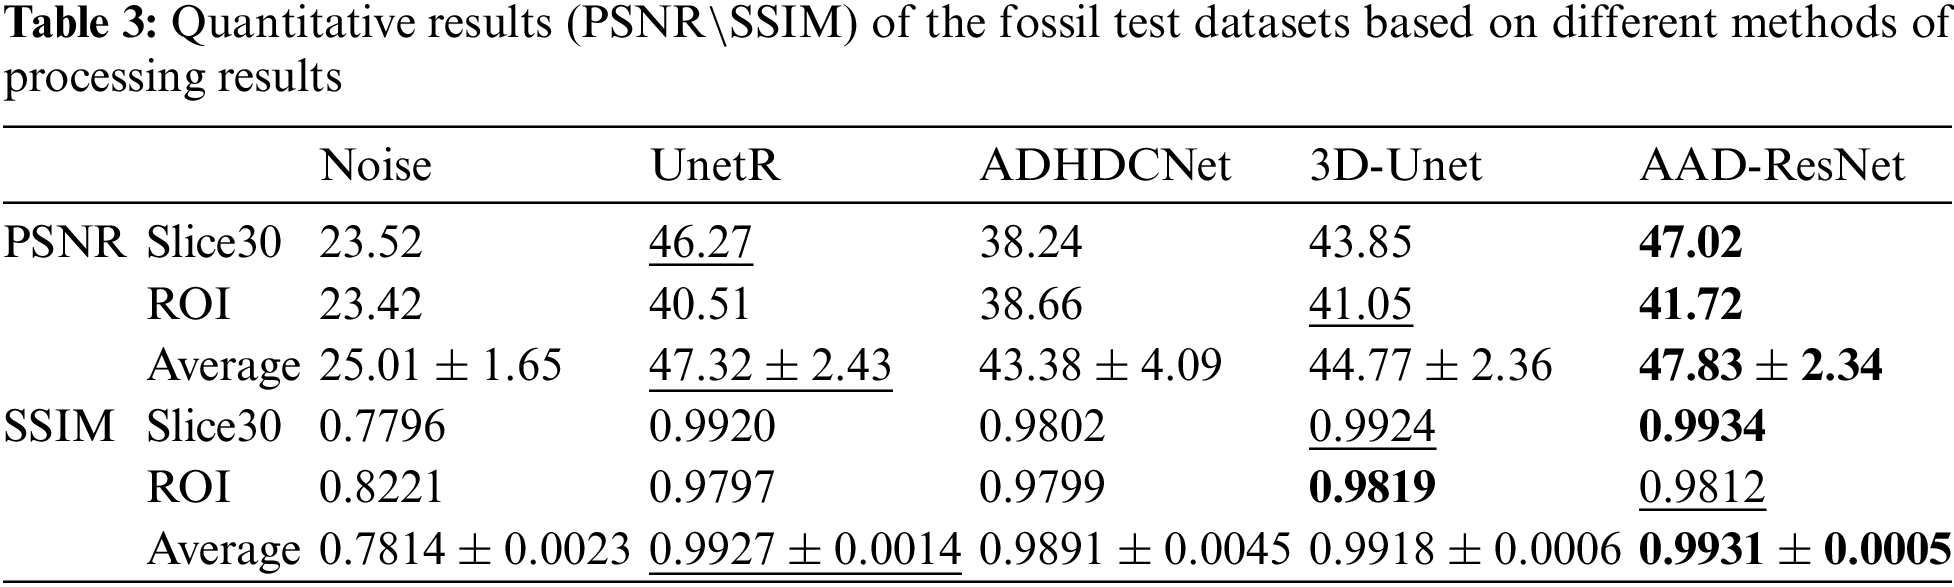
In addition, evaluation metrics are used to evaluate the results of each method quantitatively. As shown in Table 3, the optimal and suboptimal solutions of the quantization results are highlighted in the table, where the optimal solutions are shown in bold and the suboptimal solutions are underlined. The quantitative results are consistent with the visual perception, and the proposed method has the highest PSNR and SSIM among all the test results. Based on the average of the test results, we calculate the percentage change in metric values of the proposed method relative to the other methods. Specifically, the proposed method improves the PSNR and SSIM of the noise reduction results by 1.62% and 0.14% compared to UnetR, 22.96% PSNR and 1.32% SSIM compared to ADHDCNet, and 7.22% PSNR and 0.1% SSIM compared to Unet3D.
Next, we show the denoising results of different methods on the coral data. As above, we show the xOy plane and xOz plane of the coral volume data. Similarly, our method denoises while minimizing the loss of image information. Moreover, we can see from Fig. 5 that the denoising results of UnetR have serious blurring of image information in the ROIs and more obvious splicing gaps in the xOz plane. ADHDCNet can suppress noise but still produces new artifacts in the low-contrast region. The 3D-Unet method can achieve noise suppression, but the processing results also have blurring, resulting in some image information loss. The proposed method can achieve better noise suppression and retain image details.
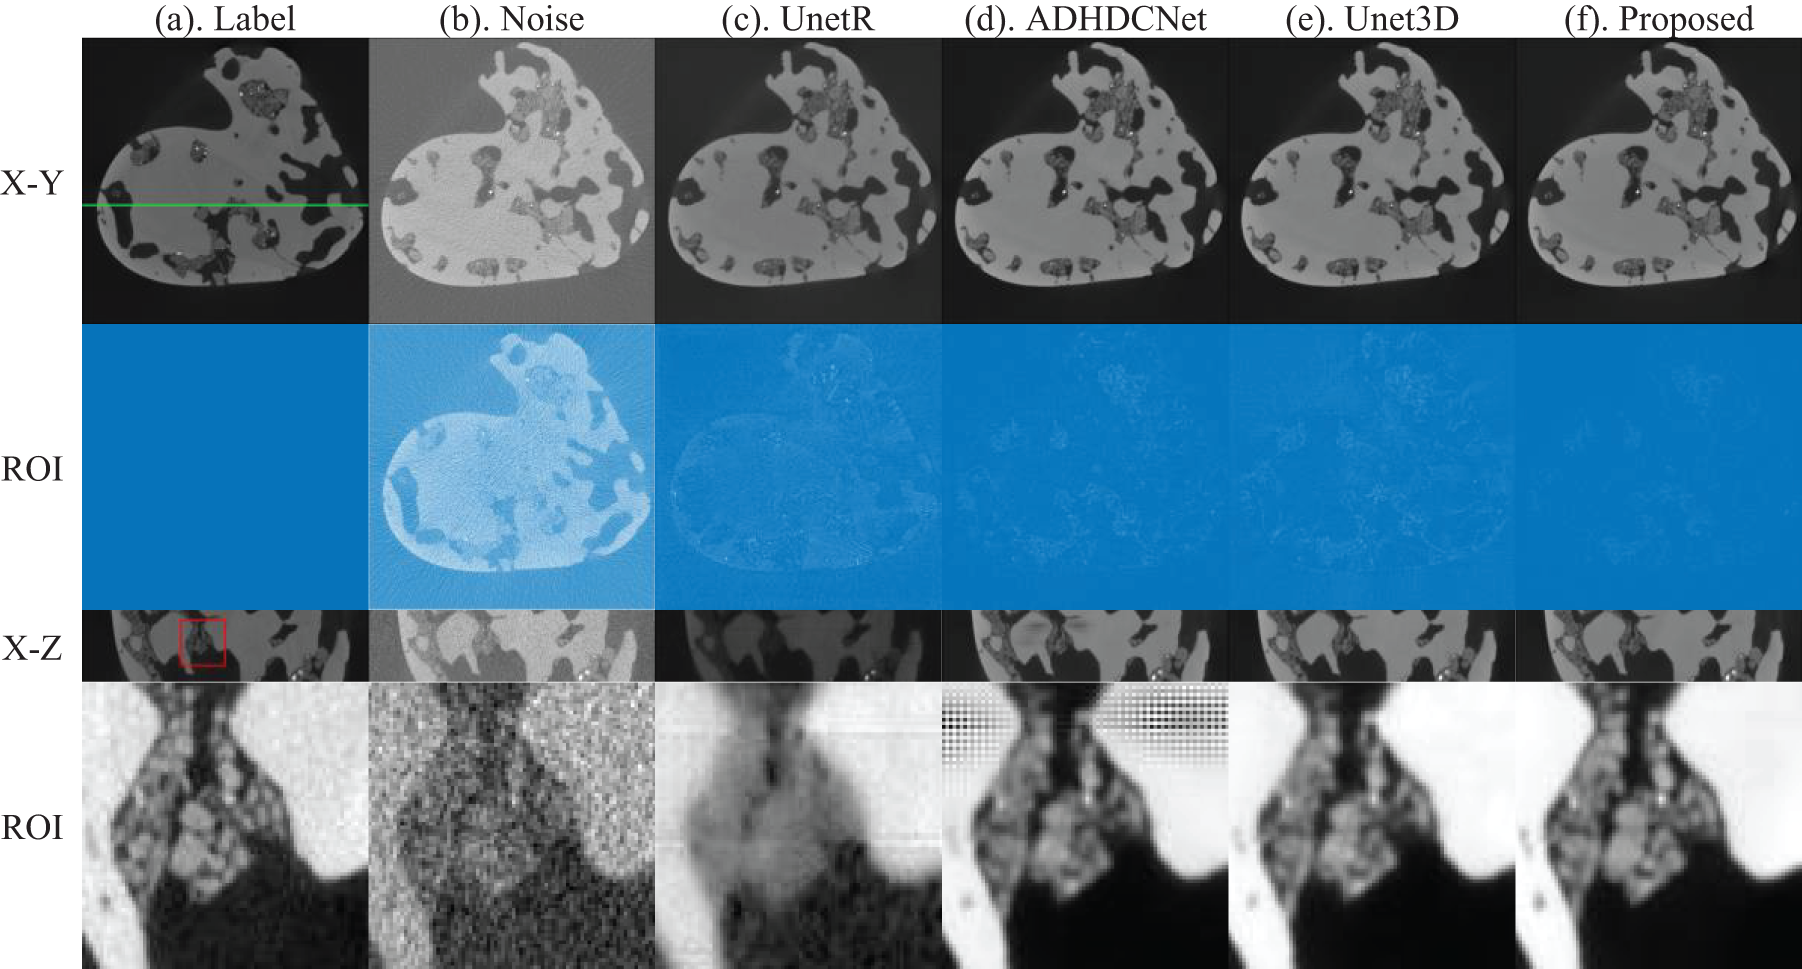
Figure 5: Comparison of the coral denoising results of actual short-exposure images. From (a) to (f) indicate the long exposure CT images, short exposure CT images, UnetR, ADHDCNet, 3D-Unet, and proposed denoised images
The quantitative results of each method for coral data denoising are presented in Table 4, using the same approach as in Table 3 to highlight the optimal and suboptimal solutions. The quantitative results are consistent with the visual perception, and the AAD-ResNet method proposed in this chapter achieves the highest PSNR and SSIM for both denoising results for the coral test set among all the test results, outperforming the other noise reduction methods in terms of numerical results.

Fig. 6 gives the gray scale distribution of the labeled positions in Figs. 4 and 5. The denoising results of the proposed method are closer to the fluctuation of the label image at the edge position, which indicates that the proposed method has good edge preservation ability. The gray level distribution of the rest of the compared methods still has a part of the deviation from the label.
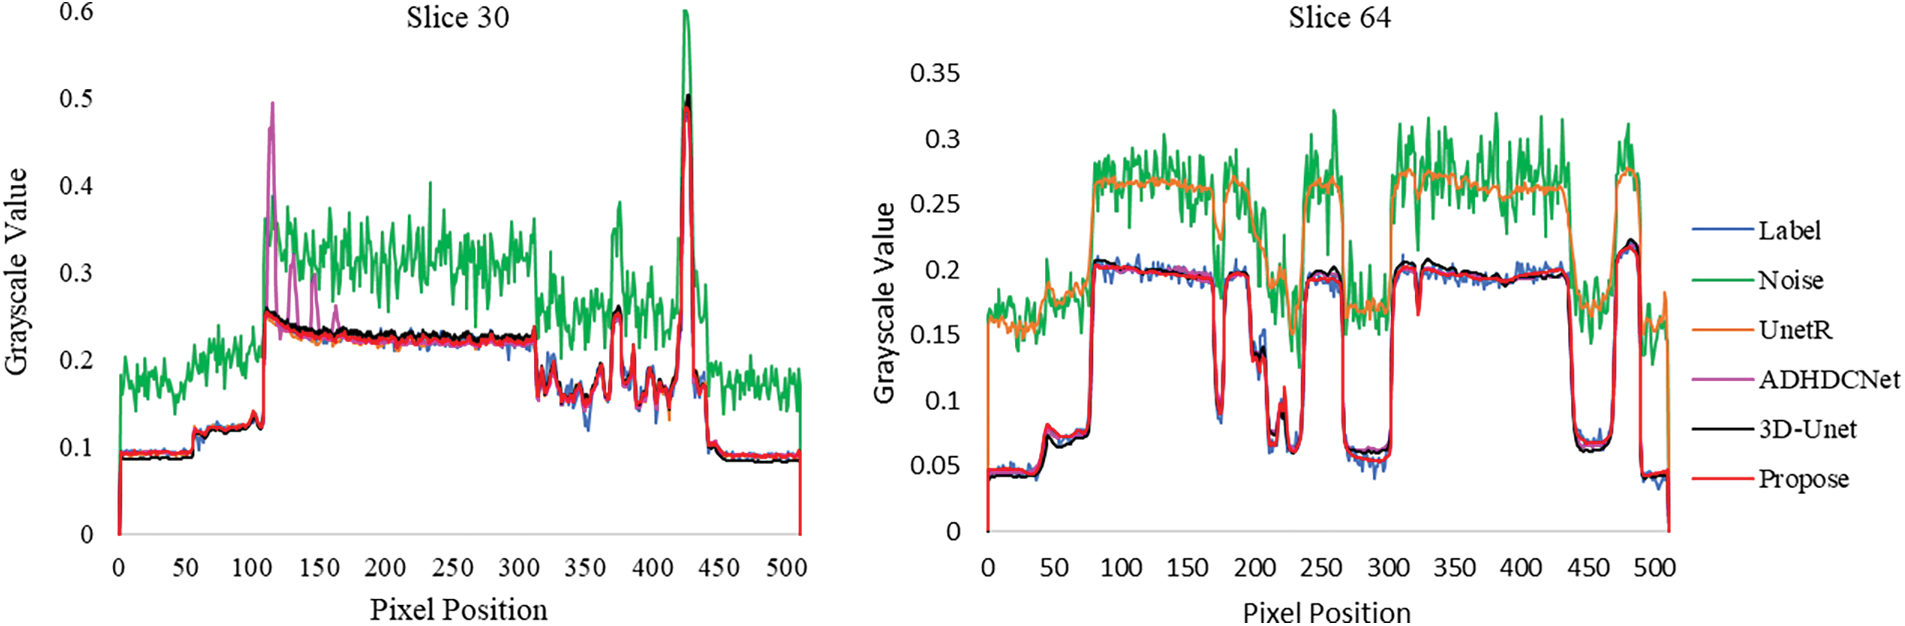
Figure 6: The grayscale values at the locations marked by the green lines in Figs. 4 and 5
In addition, we compare the number of network parameters and test times of these four methods. As shown in Table 5, the number of parameters and test time of the proposed method are closer to that of the UnetR model, and the ADHDCNet model has the least number of parameters, but the test time is slightly longer. The 3D-Unet model has the most significant parameters and the longest test time. Combining the above objective and quantitative analyses, the following conclusion can be drawn: the 3D-Unet model has similar noise reduction performance as our method, but our method has the advantages of small number of parameters and fast test time.

In this section, we design ablation experiments to demonstrate that each module in the proposed method is helpful for the denoising task by analyzing the noise reduction effect of the 3D axial attention mechanism and residual dense blocks. As shown in Table 6, we validate each module on the coral dataset, while considering the values of the evaluation metrics with the number of network parameters, and verify that each module is helpful for the denoising task through ablation experiments. The network removes the dense residual block, PSNR decreases by 12.94%, and SSIM decreases by 0.7%. Removal of the axial attention block decreases PSNR by 2.61% and SSIM by 0.1%.

The above results show that the residual dense block can fully utilize the global features, which can effectively improve the ability of the network to remove noise. More features are essential in image recovery to maintain detailed information in the original image.
Tabletop Nano-CT has a wide range of applications as a nondestructive examination tool. However, it is usually necessary to scan under long exposure conditions to obtain high-quality Nano-CT images. It sacrifices imaging efficiency and increases time costs. Since Nano-CT reconstructed images are 3D data, existing methods are often accompanied by high computational costs, and the increased computational demands may limit the practical application of these methods. In order to advance the application of tabletop Nano-CT, this study aims to explore and develop new strategies to improve the quality of Nano-CT imaging under short exposure conditions.
With the development and broad application of deep learning technology, deep learning technology provides a new solution for noise removal of Nano-CT images. In this paper, we proposed a novel residual dense denoising network based on an axial attention mechanism. Experimental results verify the effectiveness of the proposed method. This method effectively suppresses the noise of Nano-CT in short-exposure-time imaging through a lightweight network, thus significantly reducing the scanning time of Nano-CT.
Acknowledgement: None.
Funding Statement: This work was supported by the National Natural Science Foundation of China (62201618).
Author Contributions: Conceptualization, H.F. and L.Z.; methodology, L.Z.; software, H.F.; validation, H.F., C.W. and X.X.; formal analysis, H.F. and C.W.; investigation, H.F.; resources, B.Y.; data curation, Z.C., C.W. and X.X.; writing-original draft preparation, H.F. and Y.H.; writing-review and editing, L.Z., L.L., B.Y. and Y.S.; visualization, H.F., L.Z. and C.W.; supervision, B.Y.; project administration, Y.S.; funding acquisition, Y.H. and L.L. All authors reviewed the results and approved the final version of the manuscript.
Availability of Data and Materials: The data and the code used for the manuscript are available for researchers on request from the corresponding author.
Conflicts of Interest: The authors declare that they have no conflicts of interest to report regarding the present study.
References
1. A. Sakdinawat and D. Attwood, “Nanoscale X-ray imaging,” Nat. Photon, vol. 4, no. 12, pp. 840–848, Dec. 2010. doi: 10.1038/nphoton.2010.267. [Google Scholar] [CrossRef]
2. Z. Su et al., “Artificial neural network approach for multiphase segmentation of battery electrode nano-CT images,” npj Comput. Mater, vol. 8, no. 1, pp. 30, Feb. 2022. doi: 10.1038/s41524-022-00709-7. [Google Scholar] [CrossRef]
3. J. Zhang, W. K. Lee, and M. Ge, “Sub-10 second fly-scan nano-tomography using machine learning,” Commun. Mat., vol. 3, pp. 91, Dec. 2022. doi: 10.1038/s43246-022-00313-8. [Google Scholar] [CrossRef]
4. E. J. Curry, A. D. Henoun, A. N. Miller, and T. D. Nguyen, “3D nano- and micro-patterning of biomaterials for controlled drug delivery,” Ther. Deliv., vol. 8, no. 1, pp. 15–28, Jan. 2017. doi: 10.4155/tde-2016-0052. [Google Scholar] [PubMed] [CrossRef]
5. Z. H. Levine et al., “A tabletop X-ray tomography instrument for nanometer-scale imaging: Reconstructions,” Microsyst. Nanoeng., vol. 9, pp. 47, 2023. doi: 10.1038/s41378-023-00510-6. [Google Scholar] [PubMed] [CrossRef]
6. M. Kampschulte et al., “Nano-computed tomography: Technique and applications,” Rofo, vol. 188, no. 2, pp. 146–154, Feb. 2016. [Google Scholar] [PubMed]
7. J. Scharf et al., “Bridging nano- and microscale X-ray tomography for battery research by leveraging artificial intelligence,” Nat. Nanotechnol., vol. 17, no. 5, pp. 446–459, May 2022. doi: 10.1038/s41565-022-01081-9. [Google Scholar] [PubMed] [CrossRef]
8. B. Yu et al., “Phase retrieval in 3D X-ray magnified phase nano CT: Imaging bone tissue at the nanoscale,” presented at the 2017 IEEE 14th Int. Symp. Biomed. Imaging (ISBI 2017), Melbourne, VIC, Australia, 2017, pp. 56–59. [Google Scholar]
9. H. Chen et al., “Low-dose CT with a residual encoder-decoder convolutional neural network,” IEEE Trans. Med. Imaging, vol. 36, no. 12, pp. 2524–2535, Dec. 2017. doi: 10.1109/TMI.2017.2715284. [Google Scholar] [PubMed] [CrossRef]
10. W. Yao, L. Chen, H. Wu, Q. Zhao, and S. Luo, “Micro-CT image denoising with an asymmetric perceptual convolutional network,” Phys. Med. Biol., vol. 66, no. 13, pp. 135018, 2021. doi: 10.1088/1361-6560/ac0bd2. [Google Scholar] [PubMed] [CrossRef]
11. L. Yang, Z. Li, R. Ge, J. Zhao, H. Si and D. Zhang, “Low-dose CT denoising via sinogram inner-structure transformer,” IEEE Trans. Med. Imaging, vol. 42, no. 4, pp. 910–921, 2022. doi: 10.1109/TMI.2022.3219856. [Google Scholar] [PubMed] [CrossRef]
12. Z. Huang, G. Shao, and L. Li, “Micro/nano functional devices fabricated by additive manufacturing,” Prog. Mater. Sci., vol. 131, pp. 101020, Jan. 2023. doi: 10.1016/j.pmatsci.2022.101020. [Google Scholar] [CrossRef]
13. M. Kodama et al., “Three-dimensional structural measurement and material identification of an all-solid-state lithium-ion battery by X-ray nanotomography and deep learning,” J. Power Sources Adv., vol. 8, pp. 100048, Apr. 2021. doi: 10.1016/j.powera.2021.100048. [Google Scholar] [CrossRef]
14. D. Müller, J. Graetz, A. Balles, S. Stier, R. Hanke and C. Fella, “Laboratory-based nano-computed tomography and examples of its application in the field of materials research,” Crystals, vol. 11, no. 6, pp. 677, Jun. 2021. doi: 10.3390/cryst11060677. [Google Scholar] [CrossRef]
15. Z. Zhou, N. R. Huber, A. Inoue, C. H. McCollough, and L. Yu, “Multislice input for 2D and 3D residual convolutional neural network noise reduction in CT,” J. Med. Imaging, vol. 10, no. 1, pp. 14003, Jan. 2023. doi: 10.1117/1.JMI.10.1.014003. [Google Scholar] [PubMed] [CrossRef]
16. Q. Li et al., “Unpaired low-dose computed tomography image denoising using a progressive cyclical convolutional neural network,” Med. Phys., vol. 51, no. 2, pp. 1289–1312, Feb. 2023. [Google Scholar] [PubMed]
17. L. Ma et al., “SCRDN: Residual dense network with self-calibrated convolutions for low dose CT image denoising,” Nuclear Instrum. Methods Phys. Res. Section A: Accelerators, Spectrom., Detectors Associated Equip., vol. 1045, pp. 167625, Jan. 2023. doi: 10.1016/j.nima.2022.167625. [Google Scholar] [CrossRef]
18. S. Liu et al., “3D anisotropic hybrid network: Transferring convolutional features from 2D images to 3D anisotropic volumes,” presented at the Med. Image Comput. Comput. Assisted Interv–MICCAI 2018, Spain, Sep. 16–20, 2018. [Google Scholar]
19. H. Liu, G. Huo, Q. Li, X. Guan, and M. L. Tseng, “Multiscale lightweight 3D segmentation algorithm with attention mechanism: Brain tumor image segmentation,” Expert. Syst. Appl., vol. 214, pp. 119166, Mar. 2023. doi: 10.1016/j.eswa.2022.119166. [Google Scholar] [CrossRef]
20. Y. Cao, W. Zhou, M. Zang, D. An, Y. Feng and B. Yu, “MBANet: A 3D convolutional neural network with multi-branch attention for brain tumor segmentation from MRI images,” Biomed. Signal Process. Control, vol. 80, pp. 104296, Feb. 2023. doi: 10.1016/j.bspc.2022.104296. [Google Scholar] [CrossRef]
21. C. You et al., “Structurally-sensitive multi-scale deep neural network for low-dose CT denoising,” IEEE Access, vol. 6, pp. 41839–41855, 2018. doi: 10.1109/ACCESS.2018.2858196. [Google Scholar] [PubMed] [CrossRef]
22. H. Shan et al., “3-D convolutional encoder-decoder network for low-dose CT via transfer learning from a 2-D trained network,” IEEE Trans. Med. Imaging, vol. 37, no. 6, pp. 1522–1534, Jun. 2018. doi: 10.1109/TMI.2018.2832217. [Google Scholar] [PubMed] [CrossRef]
23. X. Yin et al., “Domain progressive 3D residual convolution network to improve low-dose CT imaging,” IEEE Trans. Med. Imaging, vol. 38, no. 12, pp. 2903–2913, Dec. 2019. doi: 10.1109/TMI.2019.2917258. [Google Scholar] [PubMed] [CrossRef]
24. M. Li, W. Hsu, X. Xie, J. Cong, and W. Gao, “SACNN: Self-attention convolutional neural network for low-dose CT denoising with self-supervised perceptual loss network,” IEEE Trans. Med. Imaging., vol. 39, no. 7, pp. 2289–2301, Jul. 2020. doi: 10.1109/TMI.2020.2968472. [Google Scholar] [PubMed] [CrossRef]
25. D. Gunduzalp, B. Cengiz, M. O. Unal, and I. Yildirim, “3D U-NetR: Low dose computed tomography reconstruction via deep learning and 3 dimensional convolutions,” arXiv preprint arXiv:2105.14130, 2021. [Google Scholar]
26. A. Vaswani et al., “Attention is all you need,” in Advances in Neural Information Processing Systems, vol. 30, 2017. [Google Scholar]
27. D. Wang, F. Fan, Z. Wu, R. Liu, F. Wang and H. Yu, “CTformer: Convolution-free Token2Token dilated vision transformer for low-dose CT denoising,” Phys. Med. Biol., vol. 68, no. 6, pp. 65012, Mar. 2023. doi: 10.1088/1361-6560/acc000. [Google Scholar] [PubMed] [CrossRef]
28. L. Zhu et al., “STEDNet: Swin transformer-based encoder-decoder network for noise reduction in low-dose CT,” Med. Phys., vol. 50, no. 7, pp. 4443–4458, Jan. 2023. doi: 10.1002/mp.16249. [Google Scholar] [PubMed] [CrossRef]
29. A. Kirillov et al., “Segment anything,” presented at the Int. Conf. Comput. Vis. (ICCV), Paris, France, Oct. 2023, pp. 4015–4026. [Google Scholar]
30. F. R. Verdun et al., “Image quality in CT: From physical measurements to model observers,” Phys. Med., vol. 31, no. 8, pp. 823–843, Dec. 2015. doi: 10.1016/j.ejmp.2015.08.007. [Google Scholar] [PubMed] [CrossRef]
31. K. Yang, A. L. Kwan, S. Huang, N. J. Packard, and J. M. Boone, “Noise power properties of a cone-beam CT system for breast cancer detection,” Med. Phys., vol. 35, no. 12, pp. 5317–5327, 2008. [Google Scholar] [PubMed]
32. F. Xu, L. Helfen, T. Baumbach, and H. Suhonen, “Comparison of image quality in computed laminography and tomography,” Opt. Express, vol. 20, no. 2, pp. 794–806, Jan. 2012. doi: 10.1364/OE.20.000794. [Google Scholar] [PubMed] [CrossRef]
33. Ö. Çiçek, A. Abdulkadir, S. S. Lienkamp, T. Brox, and O. Ronneberger, “3D U-Net: Learning dense volumetric segmentation from sparse annotation,” presented at the Med. Image Comput. Comput.-Assisted Interv. (MICCAI 2016), Athens, Greece, Oct. 2016, pp. 424–432. [Google Scholar]
34. J. Ho, N. Kalchbrenner, D. Weissenborn, and T. Salimans, “Axial attention in multidimensional transformers,” arXiv preprint arXiv:1912.12180, 2019. [Google Scholar]
35. K. He, X. Zhang, S. Ren, and J. Sun, “Deep residual learning for image recognition,” presented at the Conf. Comput. Vis. Pattern Recognit. (CVPR), Las Vegas, NV, USA, Jun. 2016, pp. 770–778. [Google Scholar]
36. G. Huang, Z. Liu, L. van der Maaten, and K. Q. Weinberger, “Densely connected convolutional networks,” presented at the Conf. Comput. Vis. Pattern Recognit. (CVPR), Honolulu, HI, USA, Jul. 2017, pp. 2261–2269. [Google Scholar]
37. Y. Zhang, Y. Tian, Y. Kong, B. Zhong, and Y. Fu, “Residual dense network for image super-resolution,” presented at the Conf. Comput. Vis. Pattern Recognit. (CVPR), Salt Lake City, UT, USA, Jun. 2018, pp. 2472–2481. [Google Scholar]
Cite This Article
 Copyright © 2024 The Author(s). Published by Tech Science Press.
This work is licensed under a Creative Commons Attribution 4.0 International License , which permits unrestricted use, distribution, and reproduction in any medium, provided the original work is properly cited.
 Downloads
 Citation Tools