
 Submit a Paper
 Propose a Special lssue
 Open Access
ARTICLE

Refined Anam-Net: Lightweight Deep Learning Model for Improved Segmentation Performance of Optic Cup and Disc for Glaucoma Diagnosis
Department of Computer Engineering, College of Computer and Information Sciences, King Saud University, P.O. Box 51178, Riyadh, 11543, Saudi Arabia
* Corresponding Author: Khursheed Aurangzeb. Email:
Computers, Materials & Continua 2024, 80(1), 1381-1405. https://doi.org/10.32604/cmc.2024.048987
Received 23 December 2023; Accepted 22 May 2024; Issue published 18 July 2024
 View Full Text
 Download PDF
Abstract
In this work, we aim to introduce some modifications to the Anam-Net deep neural network (DNN) model for segmenting optic cup (OC) and optic disc (OD) in retinal fundus images to estimate the cup-to-disc ratio (CDR). The CDR is a reliable measure for the early diagnosis of Glaucoma. In this study, we developed a lightweight DNN model for OC and OD segmentation in retinal fundus images. Our DNN model is based on modifications to Anam-Net, incorporating an anamorphic depth embedding block. To reduce computational complexity, we employ a fixed filter size for all convolution layers in the encoder and decoder stages as the network deepens. This modification significantly reduces the number of trainable parameters, making the model lightweight and suitable for resource-constrained applications. We evaluate the performance of the developed model using two publicly available retinal image databases, namely RIM-ONE and Drishti-GS. The results demonstrate promising OC segmentation performance across most standard evaluation metrics while achieving analogous results for OD segmentation. We used two retinal fundus image databases named RIM-ONE and Drishti-GS that contained 159 images and 101 retinal images, respectively. For OD segmentation using the RIM-ONE we obtain an f1-score (F1), Jaccard coefficient (JC), and overlapping error (OE) of 0.950, 0.9219, and 0.0781, respectively. Similarly, for OC segmentation using the same databases, we achieve scores of 0.8481 (F1), 0.7428 (JC), and 0.2572 (OE). Based on these experimental results and the significantly lower number of trainable parameters, we conclude that the developed model is highly suitable for the early diagnosis of glaucoma by accurately estimating the CDR.Keywords
One of the fundamental pre-processing steps in retinal vascular and optic cup and disk segmentation is contrast enhancement. For the enhancement of contrast, researchers have previously used Contrast limited adaptive histogram equalization (CLAHE) with default values [1,2]. Nevertheless, some fundus images may become noisy if the default parameters are applied to all of them, which would make it challenging to precisely segment the retinal vessels and optic cup and disk, which are required for diabetic retinopathy and Glaucoma diagnosis.
By determining the ideal settings for the clip limit and contextual regions of CLAHE, we were able to boost the contrast of retinal fundus images in our previous work in [3]. We recommended employing the modified particle swarm optimization (MPSO) technique to determine the ideal clip limit and contextual region parameter values. We evaluated its effectiveness with a range of cutting-edge assessment indicators. The contrast-enhanced retinal fundus images are then semantically segmented using a DL model. The combination of MPSO and CLAHE for contrast enhancement of retinal fundus images is shown in Fig. 1, which produces a substantial boost in the sensitivity of the deep learning model for semantic segmentation, as evidenced by the results.

Figure 1: MPSO based parameter optimization for contrast enhancement of retinal images [3]
Glaucoma is a prevalent eye disease that damages the optic nerve. The optic nerve is responsible for transmitting signals from the retina to the brain. It stands as a leading cause of permanent vision loss after cataracts [4]. It is characterized by the weakening of nerve fibers and often accompanied by increased intraocular pressure due to poor fluid drainage, leading to optic cup enlargement compared to the optic disc, known as cupping [5]. Additionally, glaucoma can cause parapapillary atrophy, resulting in thinning and distortion of the retinal pigment epithelium near the optic nerve. Early and accurate detection of glaucoma is crucial to prevent irreversible vision loss [6]. Glaucoma poses a significant challenge for early detection due to its initially asymptomatic nature. It has two main types: Closed-angle and open-angle. Closed-angle glaucoma is characterized by symptoms such as ocular pain, high intraocular pressure, eye redness, and sudden vision decline caused by obstructed fluid drainage. On the other hand, open-angle glaucoma, in its early stages, generally lacks noticeable symptoms as fluid flow remains unobstructed. Timely identification of glaucoma in its early stages is critical for initiating effective treatment interventions.
Motivation for our work:
The vast majority of glaucoma screening techniques currently in use segment OC and OD separately and typically rely on manually extracted visual clues from retinal images. The existence of vessel crossing and centerline reflex are some of the problems that make the OD/OC identification process more challenging. Furthermore, a number of other issues related to the retinal image acquisition technique exist, making the work of OD/OC identification challenging. These issues include camera calibration, picture brightness, and noise in the retinal images. These issues give rise to a number of additional difficulties in developing automated machine/deep learning-based systems for the diagnosis of eye diseases that are highly performant and efficient.
Additionally, several key components of the retinal images, such as the lesions, hard/soft exudates, optic cup, macula, and optic disc, elevate the level of difficulty for the automated vessel detection algorithm. Multiple challenges emerge for the computer-based automated approach for diagnosing eye illnesses. Machine learning has recently attained much higher efficiency in segmenting the vascular structure, and optic cup/disc, indicating their potential usage as learning engines in automated systems for diagnosing eye diseases. However, several important factors, such as computational complexity, memory overhead, and hyper-parameter tuning, were overlooked in the earlier investigations.
To address these challenges, we have developed a DNN Model that is based on modifications to Anam-Net, incorporating an anamorphic depth embedding block. To reduce computational complexity, we use a fixed filter size for all convolution layers in the encoder and decoder stages, which in turn considerably reduces the training time. With this tweak, the model becomes lightweight and suitable for resource-constrained applications by drastically reducing the number of trainable parameters.
Background information:
Traditional diagnostic procedures for glaucoma include tonometry, ophthalmoscopy, perimetry, pachymetry, and gonioscopy [7]. However, these procedures often require specialized expertise, are time-consuming, expensive, and susceptible to observer variability. In contrast, automated diagnostic systems have gained prominence due to their efficiency, reliability, and accuracy in detecting glaucoma.
Fundoscopy, an essential method for capturing retinal images, plays a significant role in glaucoma. By utilizing machine learning models, fundus images provide valuable structural information about the retina, including the OC, OD, retinal vessels, and lesions, enabling automated analysis of these retinal structures for objective disease classification. Evaluating the optic nerve head (ONH), which includes the OC and OD regions, proves highly effective and reliable for early glaucoma diagnosis [8,9].
Automated computer-based methods rely on the cup-to-disc ratio (CDR) as a key parameter for glaucoma detection. The CDR is defined as the ratio of the vertical diameter of the optic cup to the optic disc [5]. In healthy eyes, the optic cup contains a substantial number of nerve fibers. However, in glaucomatous eyes, elevated intraocular pressure leads to the expansion of these fibers, resulting in an increased CDR value. Typically, a CDR value below 0.6 is observed in healthy individuals, while values exceeding 0.6 indicate the presence of glaucoma. Nevertheless, it is crucial to acknowledge that some individuals may have larger optic cups due to genetic factors or myopia, rendering the CDR alone insufficient for reliable glaucoma detection [10].
Another important indicator in glaucoma assessment is the neuroretinal rim (NRR), which is a circular structure located between the optic cup and disc and consists of nerve fibers. The inferior, superior, nasal, and temporal (ISNT) rule is commonly employed in glaucoma screening. According to this rule, the neuroretinal rim is thickest in the inferior region, followed by the superior, nasal, and temporal regions in normal eyes. In glaucomatous eyes, this rule is often violated due to an enlarged optic cup and a reduced NRR region [11].
The segmentation of OC and OD remains a crucial and challenging task in glaucoma detection [12]. Fundoscopy often produces fundus images with issues such as varying illumination, low resolution, and poor contrast, significantly impacting the segmentation process [13]. Furthermore, these images may contain noise in the form of centerline reflexes and bright objects (exudates), which further complicate the accurate detection of OC and OD boundaries. Additionally, the presence of retinal vessels poses a challenge for precise OC boundary detection [12].
To overcome these challenges, researchers have incorporated pre-processing and post-processing steps in conjunction with the main segmentation algorithm. Some studies consider the localization of OD and OC as a prerequisite step before segmentation [14–17]. Recent research has focused on joint segmentation of OD and OC [18–21]. However, achieving high performance in these approaches often necessitates the optimization of multiple hyperparameters in ensemble models [21] or the utilization of generative adversarial networks [18,19]. Another study utilized the U-Net architecture, which has fewer parameters compared to other state-of-the-art approaches but yielded an average segmentation performance [22]. Despite being widely used in medical imaging segmentation, SegNet, a deep learning model, exhibits inferior performance compared to encoder-decoder-based architectures. This is mainly due to SegNet’s non-linear up-sampling technique, which relies on pooling indices from the encoder’s max-pooling step and may result in a loss of crucial contextual information, affecting the segmentation accuracy [23].
In this study, we propose a novel lightweight convolutional neural network (CNN) model for precise segmentation of the optic cup and disc in retinal fundus images. Our approach aims to address the limitations and computational costs commonly associated with existing state-of-the-art methods. Drawing inspiration from the Anam-Net model, which was recently developed for COronaVIrus Disease (COVID-19) detection in computed tomography (CT) images [24], we adapt and modify the basic Anam-Net architecture, resulting in a substantial reduction in the number of trainable parameters from 4.47 to 0.88 million.
The key novel features of our work are listed below:
• We incorporated some thought provoking modifications to the basic Anam-Net Model to make it computationally efficient, lightweight and optimized segmentation model for optic cup and disc.
• By applying the proposed modification to the basic Anam-Net architecture, which achieves high accuracy in detecting the boundaries of the optic cup and disc.
• In order to validate the model’s generalizability and robustness, its performance was evaluated on benchmark datasets, including DRISHTI-GS and RIMONE, showcasing consistent and reliable segmentation results across diverse retinal imaging scenarios.
• Based on publicly available retinal databases including DRISHTI-GS and RIMONE, the segmentation performance of the proposed modifications to the developed model are verified and compared with rivals from the state of the art.
The manuscript is structured as follows: Section 2 provides an overview of the related work on optic cup and disc segmentation, discussing existing state-of-the-art approaches. In Section 3, we present the implementation details and databases utilized in our study. Section 4 introduces the proposed method based on the modified Anam-Net architecture. A comprehensive quantitative and qualitative comparison with state-of-the-art methods, along with a discussion, is presented in Section 5. Finally, Section 6 concludes the paper with closing remarks.
In OC and OD segmentation, various image processing and machine learning methods have been extensively investigated. OC and OD segmentation is vital for calculating CDR, which is needed for glaucoma diagnosis. Among the two broad categories, the image-processing category includes adaptive thresholding approaches [25], Gaussian window-based methods [26], and thresholding combined with geometrical-based features [12]. The authors of [27] proposed a median, mean, and Otsu thresholding-based approach for segmentation, but the main issue in such a method is the color variation from patient to patient, which decreases the reliability and robustness of the diagnostics systems. Nonetheless, the main issue with thresholding-based approaches is its lower efficiency for images with low contrast [28].
Numerous authors have applied the region and edge-based approaches for OD and OC detection, where the regional features provide robustness and reliability contrast and intensity variations in the retinal images. For detecting the boundary of the cup, regional information along with the intensity normalization approach has been used by the authors [29]. In [30], authors applied different operations in order to eliminate parapapillary atrophy. Their method achieved better segmentation performance due to the elimination of non-disc structures. Numerous researchers applied the deformable algorithms along with the active contours-based methods for defining OC and OD boundaries, where they minimized the energy function. The authors of [31] developed an improved segmentation approach for OC and OD detection for calculating cup to disc area ratio (CAR) and CDR. In order to improve the classification errors, the authors of [32] proposed an adaptive deformable method for capturing irregularity and shape variation.
The authors presented an active contour-based technique for OD segmentation in [33]. However, the problem with the active contour-based approach is that it can stuck in local minima because of the various pathologies and the noise in the retinal. Additionally, the performance of these methods is highly reliant on the initialization of the contour model [28]. Numerous researchers applied super-pixel-based approaches for OD and OC extraction. For instance, the authors [34] developed a super-pixel-based classification approach for cup and disc segmentation. However, their model underestimated and overestimated the identification of the cup for large as well as small sizes.
Preprocessing is a good strategy, which some authors have adopted for enhancing the quality of the retinal images. The authors in [11] applied the preprocessing on the retinal images, for eliminating the illumination and noise problems. They selected a super-pixel-based approach along with simple linear iterative clustering (SLIC) algorithm for OC and OD detection. In their approach, they detected the super-pixels from the given retinal images. The detected super-pixels were classified into regions of background, OC, and OD. The observation of retinal nerve fiber layer (RNFL) structure has also been used as an indication of glaucoma [35]. The authors of [36] have proposed an approach for glaucoma classification based on statistical features, where they used the K-nearest neighbor for image classification.
Machine learning models have also been used in numerous studies for OD and OC segmentation. The author of [37] has developed an approach to accurately and reliably extract OD in noisy images. The authors [38] have proposed an automated regression model for obtaining the accurate boundary of OD and OC. The machine learning-based approaches are reliant on the handcrafted features, which are manually marked by experts for a specific database, which is time-consuming and quite tedious.
Recently, deep learning (DL) models have been studied and widely developed, which automatically learn various complex features embedded in the images through training on specialized hardware. The authors of [15] developed a CNN-based ensemble model for OC and OD segmentation. However, the method performs well in segmenting OC and OD, their model is complex involving a large number of free parameters. In [39], the authors proposed and developed a new version of the well-known U-Net architecture for the segmentation of optic cup and optic disc in retinal images. In their developed model, the retinal image is fed and propagated in the expansion and contracting layers, which resulted in increased dimensions of the given images. Despite the fact that their architecture is substantially lightweight, accurate optic cup segmentation remains a challenge with this method. In [40], the authors performed an analysis of applying off-the-shelf CNN-based models called visual geometry group (VGG)-S and over feat for extracting different features. They have also used some preprocessing tasks including vessel inpainting and contrast enhancement for enhancing the performance of the developed approach.
The authors of [7] have developed a CNN model (fully automated) having eighteen layers for the extraction of different features from the retinal images. In [13], the authors developed a fully convolutional neural network (FCN) for segmentation of OC and OD, where the VGG-16 based encoder-decoder architecture along with up sampling and skip connections were used. They applied a weighted loss with mask and filtering module for prioritizing pixels and cleaning OD and OC boundaries, respectively. The authors of [20] proposed and developed an M-Net-based DL model, for which they transformed the retinal images to the polar coordinate system by applying the polar transformation. The polar domain images were then fed into M-Net for producing the probability maps for OD and OC regions. Although this method considerably improves segmentation results, it did not take into account contextual semantic information, which is crucial for semantic segmentation. Furthermore, the M-Net retrieves complex features from the retinal images using a single-scale convolution module.
The modified FCN along with pre-processing was applied by the authors in [14] for joint segmentation of OC and OD. The authors in [16] for OD and OC segmentation developed an encoder-decoder-based model. They used the pre-trained ResNet-34 model as an encoder while for the decoder they selected the U-Net model. They evaluated their developed model based on the RIGA dataset. Fundus Images of bad quality have a detrimental effect on their proposed model performance. The authors of [17] developed a DL model based on FC-DenseNet for pixel-wise classification of retinal images. The computational complexity (training time) of this approach is quite high. Moreover, accurate optic cup segmentation remains a challenge with this method. The authors of [41] proposed and developed a CNN-based complex DL model having multiple layers for glaucoma diagnosis (both advanced and early-stage). The authors of [42] assessed ImageNet based on five different NN models for glaucoma detection. They achieved high sensitivity, accuracy, and specificity by evaluating the five different trained models on the datasets (publicly available). A modified U-Net-based DL model was developed by the authors in [43] for OC and OD segmentation. For OC segmentation, they cropped (also downscaled) the retinal images, which were then passed through the developed model (modified U-Net based). While for OD segmentation, they did not crop and scale down the retinal images. They evaluated the trained model based on RIM-ONE and Drishti-GS datasets.
Numerous researchers have selected the domain adaptation methods, where a generalized and trained DL model in one domain is applied in a different domain. The authors of [18] adopted such an approach, where they applied the patch-based Output Space Adversarial Learning architecture (pOSAL) model for OC and OD segmentation. In one other study of [19], the authors developed a multi-label DCNN GL-net based model. They used the skip connections in the generator for facilitating the mixture of high and low-level features. They evaluated their developed model based on the Drishti-GS dataset. A RACE-net-based RNN model has been developed for biomedical image segmentation in [44], where the authors modeled the boundaries (of the objects) as an evolving level set curve.
The authors presented a transfer learning based attention U-Net model in [45]. An attention gate was added between the encoder and decoder of the U-Net. The network was first trained on the DRIONS dataset and then on the DRISHTI-GS dataset. The computational complexity of their model is low. In [46], the authors developed a patch-based training strategy for their proposed model named GlaucoNet. Their approach differs from conventional CNN in two aspects: It uses a stack of convolution layers along with residual block as a bottleneck, and the input to the network is patch-level data rather than image-level data. They obtained good accuracy for optic cup segmentation of RIMONE images. However, for the DRISHTI-GS dataset, the segmentation accuracy is not good which limits the generalization ability of their model. In [47], the authors use the entropy sampling approach to enhance the information within the fundus image and feed the output to the U-Net model for OC and OD segmentation. They achieved good segmentation performance for OD on the RIMONE dataset, however their F1-score for OC is very low.
Despite the significant improvements in the accuracy of supervised learning models, there are still a number of challenges that need to be addressed by the research community. The widespread use of deep learning algorithms for autonomous large-scale screening processes is restricted by the earlier mentioned challenges. One such difficulty is the supervised machine/deep learning models’ costly preprocessing procedures, which raise not only development time but also model training and testing time. These pre-and post-processing capabilities are based on heuristic algorithms that need adjustments for noise, pathology, and other variables that affect retinal fundus images.
Furthermore, the previously investigated state-of-the-art methods ignored the memory overhead, and training/testing duration. The increased computational complexity of the available deep learning models along with lower sensitivity makes them unsuitable for large-scale autonomous screening processes. The generalizability of previous studies is limited due to poor segmentation performance for OC.
In this work, we aim to develop a deep learning model for segmenting OC and OD that should be lightweight, memory efficient and should not compromise on the evaluation metrics for segmentation. The focus has been on reducing the overall computational complexity of the developed model by reducing the number of trainable parameters using fixed filter size. In addition to that, we aim to achieve high segmentation accuracy for both OC and OD to prove the generalizability of the model.
Considering the challenges of high computational complexity and memory overhead of the deep neural network model, in this work we proposed a lightweight CNN-based deep neural network model. We selected an encoder-decoder architecture attributing AD-Block, where we introduced two modifications to the original Anam-Net DNN model. The first modification is to have a stack of two 3 × 3 layers (convolution) compared to a single convolution layer of 3 × 3 in the original for increasing receptive field. The second modification is to use a filter size of 64 (fixed) throughout the model compared to the increasing number of filters depth-wise in the original Anam-Net model.
These two novel modifications helped us in achieving enhanced segmentation performance in comparison to the best models from the literature in addition to significantly reducing the computational complexity and memory overhead of the DNN model for OD/OC segmentation. Furthermore, these modifications also helped decrease the number of trainable parameters significantly, which in turn reduced the training and testing time of the developed DNN model.
Our proposed model attributes AD-block both in the encoder and decoder sides. The 1 × 1 convolution filters are used for depth squeezing in the AD-block, which is followed by 3 × 3 convolution necessary for feature extraction from the processed images. Additionally, the final convolution is of size 1 × 1, which is required for depth-wise stretching. The AD-block is shown in Fig. 2.

Figure 2: The basic AD-block
The main aim of the AD-block is to squeeze the dimension of the feature space in a depth-wise manner. This step is followed by local feature extraction, which is performed by applying 3 × 3 convolution on the processed feature maps. The tasks accomplished using AD-block are described using the equation below, where h(x) is the output of the AD-block and can be expressed as,
where f(x; θ) denotes the sequence of convolution task parametrized by θ. The factor x in Eq. (1) denotes the feature maps, which is provided to the AD-block as input.
The details of AD-block based modification to the basic block are provided in Fig. 3. The input retinal image is given as input into a stack of two adjacent convolution layers, where each convolution layer has a filter size of 64. These two convolution layers perform a 3 × 3 convolution on the input image. The output is provided as input to the contiguous layers of batch normalization followed by the rectified linear unit (ReLU) activation layer. The maxpooling layer is used for performing down sampling, needed for dimensionality reduction with a factor of two. The maxpooling operation help in reducing the computational complexity of the DNN model. Then, the AD-block is included for vigorous feature learning. Each encoder and decoder stage in our system comprises three AD-blocks. The transpose convolution layer is used before the AD-block in the expansion path to upsample the feature map to the desired resolution. At the decoder stage, the learned features from the encoder are combined with the layers of the decoder path, allowing the model to learn at multiple scales. The layer-wise details of the proposed encoder-decoder based DNN model are disclosed in Table 1.
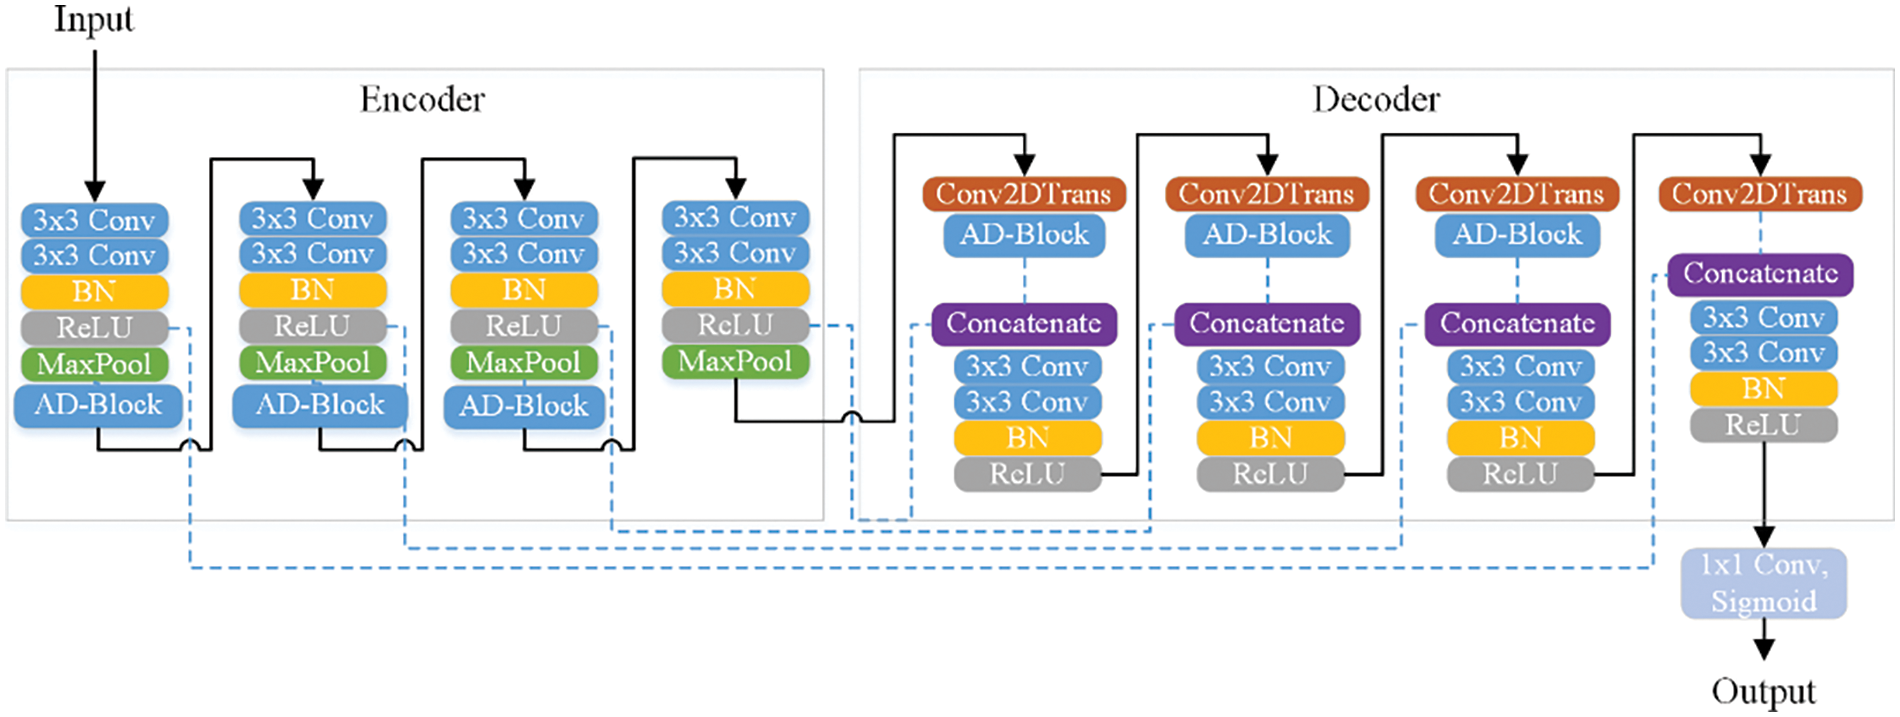
Figure 3: The details of the proposed model

The loss function usually has a significantly higher impact on the segmentation accuracy of the deep learning model. Much of the literature on medical image segmentation based on CNN models have used cross-entropy as a loss function. In the proposed model, we used a log dice loss as a loss function, which is more inclined towards less accurate labels [39]. The log dice loss function is provided in Eq. (2).
where
The workflow of our method for optic cup segmentation is shown in Fig. 4, while the workflow for optic disc segmentation is shown in Fig. 5. For both cases, the retinal fundus image and its corresponding ground truth image are selected from the database. For OC detection, initially, we crop the images using the bounding box of the optic disc. The remaining steps are similar for both OC and OD detection in our proposed method. The contrast limited adaptive histogram equalization (CLAHE) from our previous work in [3] is used for contrast enhancement, followed by data augmentation to generate enough images to prevent the model from overfitting. The proposed DNN model is then trained using these pools of augmented images.
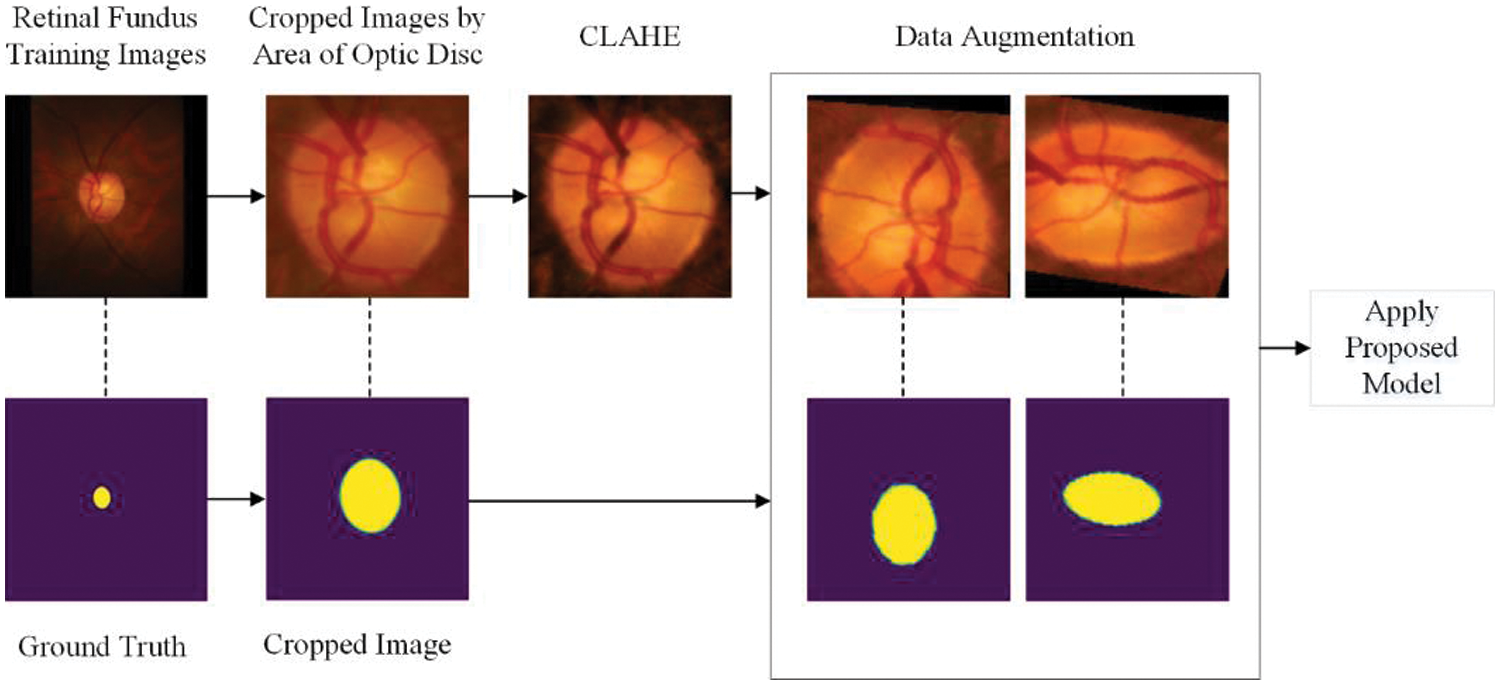
Figure 4: Pipeline of the proposed method for segmenting OC
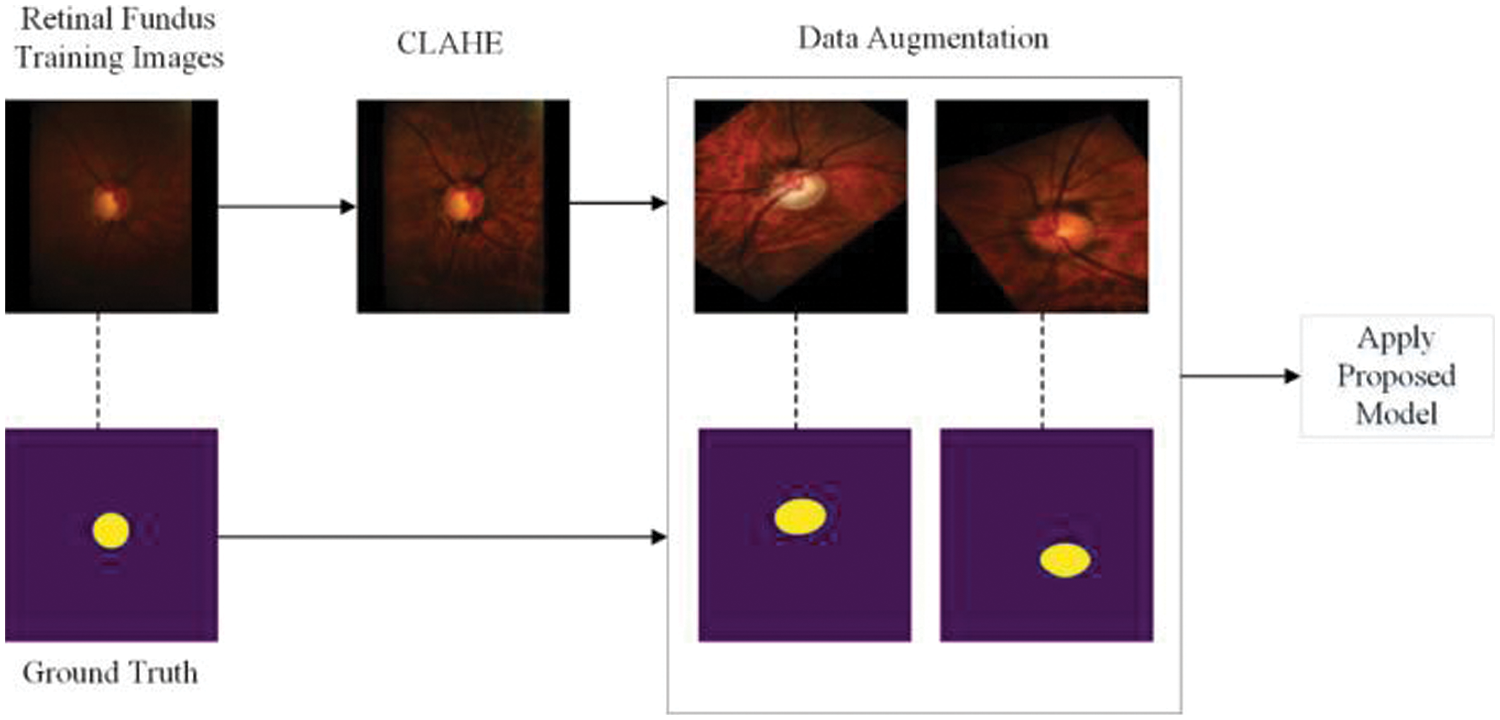
Figure 5: Pipeline of the proposed method for segmenting OD
Two images for each dataset are shown in Figs. 4 and 5 after data augmentation. Due to space limitations and the enormous amount of augmented images, we are unable to show all augmented images in the manuscript. We have provided the necessary reference to our previous work on data augmentation for such studies and databases [48].
4 Databases and Implementation Details
The databases, evaluation metrics used for the performance evaluation of the proposed DNN model, and implementation details are disclosed in the current section.
4.1 Retinal Fundus Image Databases
Most of the previous studies use RIMONE and DRISHTI-GS datasets for OC and OD segmentation. In order to compare our work with state-of-the-art methods, we used the same dataset.
The Drishti-GS retinal fundus database is composed of 101 retinal fundus images, which were annotated by an expert at Aravind Eye Clinic, Madurai, India. These retinal images have one resolution of 2896 × 1944, which was stored in PNG format without any compression.
The RIM-ONE is a publicly available retinal image database that contains 159 images and is usually used by researchers across the Globe for evaluating the performance of OD/OC segmentation DNN models. Among the available 159 retinal fundus images, 74 belong to glaucoma-infected patients whereas the other 85 images belong to healthy individuals. These 159 retinal images of RIM-ONE were captured at three Spanish hospitals and were graded by two expert ophthalmologists.
We used two retinal fundus image databases named RIM-ONE and Drishti-GS that contained 159 images and 101 retinal images, respectively. These datasets are limited in the number of retinal fundus images for training and testing of the developed DNN model. Achieving an acceptable level of accuracy of the DNN model using such small datasets is rather highly challenging. This compelled us to apply several data augmentation techniques mentioned below to increase the number of images for training and testing of the proposed model. These data augmentation techniques included but were not limited to: (1) Horizontal flipping (2) Vertical flipping (3) Cropping (4) Brightness change (5) Magnification (6) Contrast enhancement (7) Vertical translation (8) Horizontal translations.
We were able to generate 80 images for every available image, i.e., a total of 12,720 images for RIM-ONE and 8080 images for Drishti-GS database. Out of these, 10,176 and 6464 images for RIM-ONE and Drishti-GS were used for training the DNN model. The remaining images from both databases were used for validation purpose.
The standard evaluation metrics are used to evaluate the model performance for the task of OC and OD segmentation in retinal fundus images. The used evaluation metrics include sensitivity (SEN), specificity (SPE), accuracy (ACC), F1-score, JC, and OE. The OE is the ratio of the number of pixels in the intersection set of the segmentation mask and the ground truth to the number of pixels in the union set. The equations of the used evaluation metrics are provided below:
The Keras deep learning library is used for performing the end-to-end training and testing of the developed DNN model for OC and OD detection. The Adam optimizer is utilized, with a learning rate of 0.001. Our criterion is to see if validation loss improves after 10 consecutive epochs, and if it does not, we reduce the learning rate by 0.1. With a batch size of four, the developed DNN model is trained for 150 epochs. We used the early stopping criterion to prevent overfitting by assessing the validation loss.
Both of the retinal image databases have a limited number of images, which are not sufficient for the effective training of the DNN model. It is highly difficult to achieve better segmentation performance if the number of graded images for training the model is fewer. Hence, selected data augmentation procedures are used for increasing the number of images, which enhances the generalization capability of the DNN model. We applied the vertical flip, horizontal flip, random width and height shift (0, 0.15), random rotations (0, 360) degrees, as well as random magnification (0.3, 0.12).
We have used the IBEX platform (High-Performance Computing (HPC) facility of King Abdullah University of Sciences and Technology). We have used a single RTX 2080 Ti GPU of the IBEX for all the different experiments and analyses.
The proposed DNN model is evaluated using two well-known retinal image databases, i.e., RIM-ONE and Drishti-GS. In this section, we present our experimental results both quantitatively and qualitatively.
We were able to generate 80 images for every available image, i.e., a total of 12,720 images for RIM-ONE and 8080 images for Drishti-GS database. Out of these, 10,176 (80%) and 6464 images (80%) for RIM-ONE and Drishti-GS were used for training the DNN model. The remaining 2544 and 1616 images from RIM-ONE and Drishti-GS respectively were used for validation purpose. The validation of the developed DNN model is performed using the 20% images from the pool of images of both databases of RIM-ONE and Drishti-GS after performing different data augmentation procedures.
5.1 Comparison with the State-of-the-Art Methods
We used standard evaluation metrics such as sensitivity, specificity, accuracy, F1-score, Jaccard coefficient, and overlap error for comparing the performance of our proposed method with the rivals from the state-of-the-art. We used 5-fold cross-validation and the average score is listed in Tables 2–5 for OD and OC segmentation in the DRISHTI-GS and RIMONE datasets.


We have compared our proposed method with several state-of-the-art techniques for OD and OC segmentation using the DRISHTI-GS dataset and presented the results in Tables 2 and 3, respectively. These tables illustrate the comparative performance of our approach against existing methods. While the evaluation scores for optic cup segmentation may be lower compared to those for optic disc segmentation, our proposed method consistently achieves better segmentation accuracy for the optic cup when compared to other methods. This trend is also reflected in Tables 4 and 5, which present results on the RIMONE dataset.
The green and blue highlighted values in all these tables represent the best and second-best results, respectively.
Our obtained results based on the Drishti-GS dataset for OD and OC detection are presented in Tables 2 and 3, respectively. The results in Table 2 reveal that for the DRISHTI-GS dataset, our proposed method got the best score in four of the six evaluation metrics for OD segmentation. For the remaining two metrics, our model achieved the second-best score. Our method achieved the highest F1-score of 0.9728 among numerous other methods. Al-Bander et al. [17] proposed Dense FCN, which had the best specificity but had low sensitivity and F1-score compared to our proposed method.
The U-Net model proposed by Ronneberger et al. [22] achieved the second-best F1-score, Jaccard coefficient, overlapping error, and accuracy. However, a standard U-Net architecture has a large computational complexity, with nearly 34 million trainable parameters compared to our proposed model, which has just 0.88 million parameters. Zhao et al. [40] proposed PSPNet and obtained the best sensitivity among all other methods. However, none of their other evaluation metrics scores is in the top two. Furthermore, the number of trainable parameters for PSPNet is approx. 48 million which is one of the highest among all other methods. The fuzzy based learning system (FBLS) proposed by authors in [49] achieved competitive F1-score as shown in Tables 2 and 3. However, none of their other evaluation metrics are reported in their work.
As shown in Table 3, we ranked first in four out of six evaluation metrics for the optic cup segmentation for the DRISHTI-GS dataset. The proposed method has the highest F1-score and Jaccard coefficient among state-of-the-art methods, at 0.8938 and 0.8159, respectively. The Deeplabv3+ proposed by Chen et al. [42] is ranked first in terms of sensitivity but has the lowest F1-score, accuracy, and specificity among the other approaches. When compared to other state-of-the-art approaches, their proposed model has the highest overlapping error. For the DRISHTI-GS dataset, our proposed model achieved an overlapping error of 0.18 for optic cup segmentation, which is the lowest among the other approaches.
Our obtained results based on the RIM-ONE dataset for OD and OC detection are provided in Tables 4 and 5, respectively. In the RIM-ONE dataset, we outperformed all other methods in terms of specificity, Jaccard coefficient, and accuracy for optic disc segmentation, while the results for F1-score, sensitivity, and overlapping error are very close to the best score, as shown in Table 4. Chen et al. [42] is ranked first in terms of F1-score, sensitivity, and overlapping error. However, the computational complexity of their proposed model is too high, with approximately 41 million trainable parameters.
The optic cup segmentation of the RIM-ONE dataset is the most challenging task for which our proposed model outperformed all other methods in terms of sensitivity, Jaccard coefficient, overlapping error, and accuracy. DeepLabv3+ and PSPNet ranked first and second in terms of F1-score and overlapping error for optic disc segmentation of the RIM-ONE dataset.
However, these models had one of the lowest F1-score and overlapping error for the optic cup segmentation which limits their generalization ability. Our proposed model obtained an overlapping error of 0.2572 which is the lowest among all the state-of-the-art methods as shown in Table 5. The CE-Net model proposed by Gu et al. [44] ranked second for optic cup segmentation. However, for optic disc segmentation their performance is not in the top two which limits their generalization ability.
We can make one important observation from these tables that the average score of the Jaccard coefficient and F1 for optic cup segmentation for the RIM-ONE dataset is lower than for the DRISHTI-GS dataset across all models. The fundus images from the RIM-ONE dataset have a difficult optic cup boundary, which explains the low score.
The OD segmentation results for a few representative images from the Drishti-GS database are shown in Fig. 6.
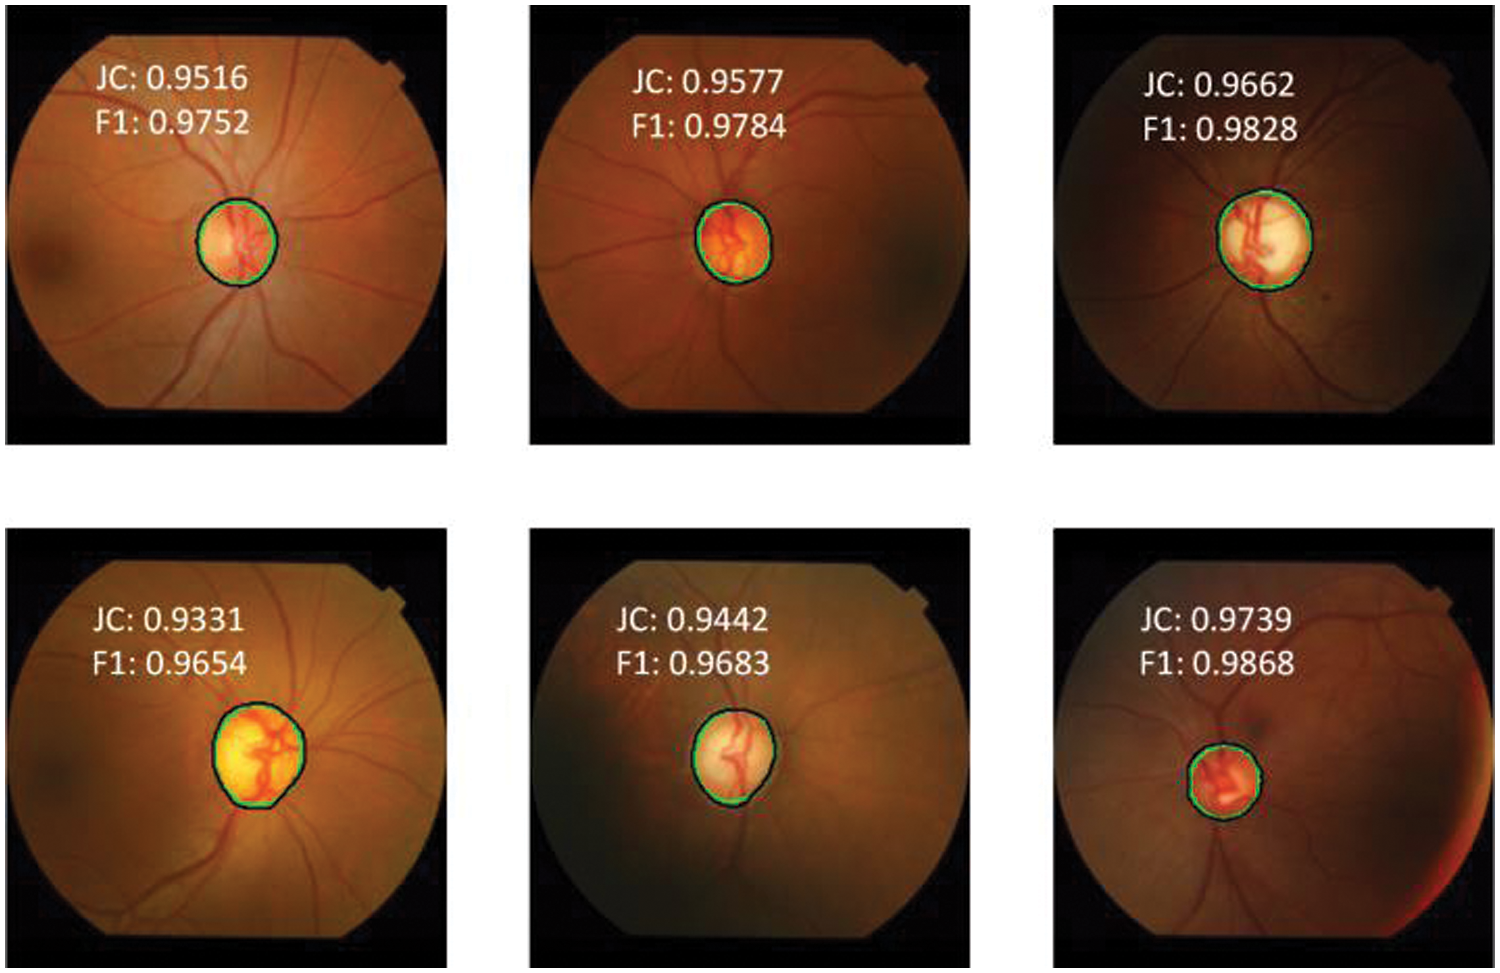
Figure 6: Model prediction vs. expert segmentation of optic disc boundary for DRISHTI-GS dataset
The black color represents the ground truth boundary, whereas the green color represents the boundary recognized by the proposed DNN model. The JC and the F1-score of the OD detection are overlaid on the respective retinal fundus images. The F1-score for the worst case (bottom-left) and best-case (bottom-right) is 0.9654 and 0.9868, respectively. The segmentation accuracy for OD is unaffected by contrast variation in fundus images, as seen in Fig. 6. The OC segmentation results for a few representative images from the Drishti-GS database are shown in Fig. 7. The worst case (bottom left) and best case (top left) F1-scores are 0.7855 and 0.9633, respectively. It can be observed that the black and green boundaries are quite close to each other for most of the cases of OC detection, which shows the high reliability and robustness of the DNN model.
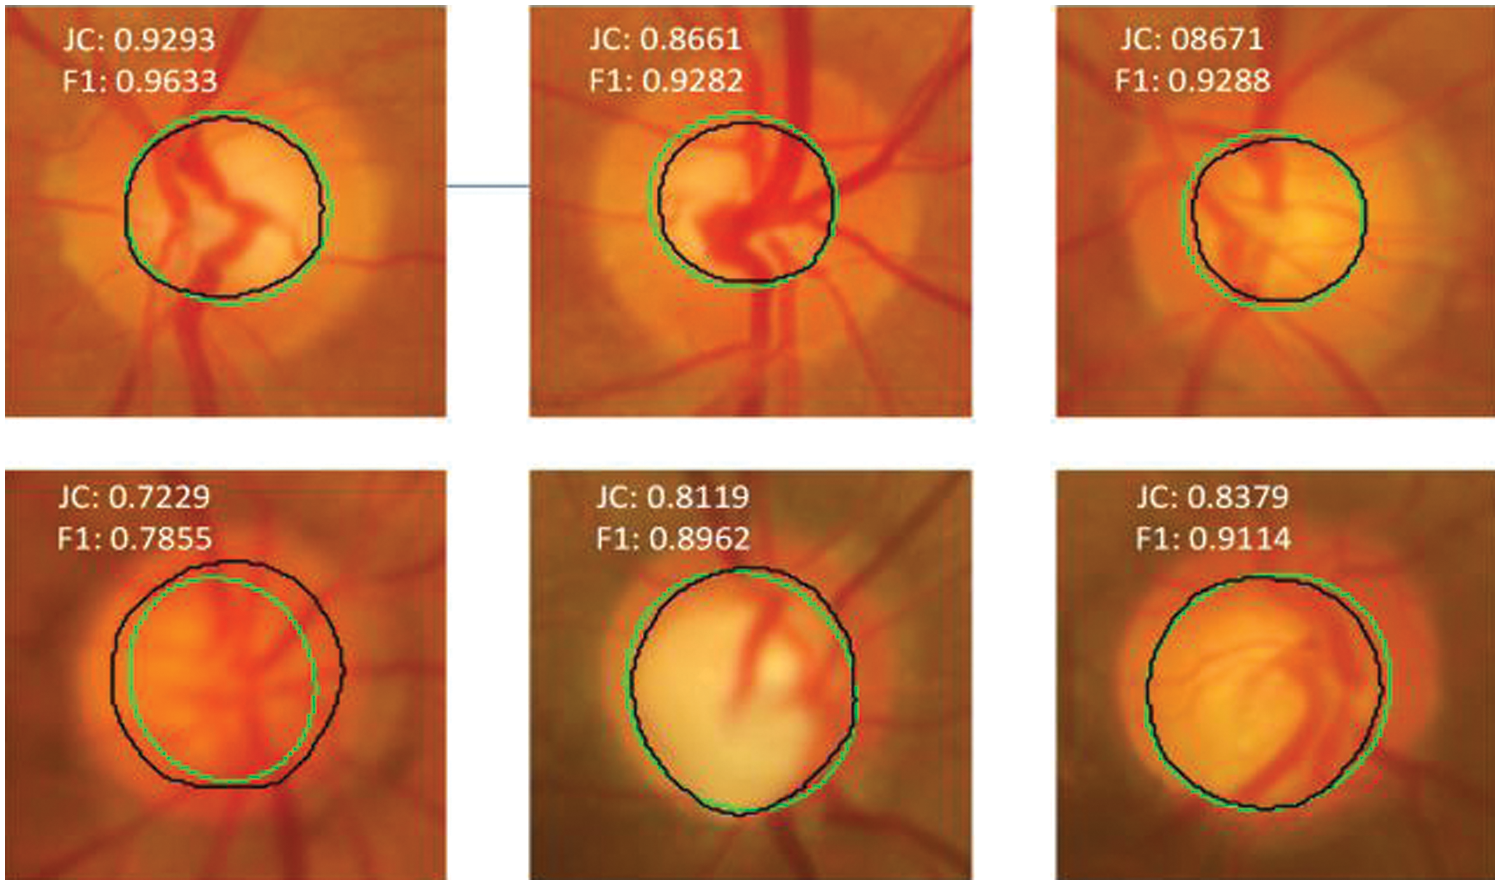
Figure 7: Model prediction vs. expert segmentation of optic cup boundary for DRISHTI-GS dataset
Figs. 8 and 9 show the optic disc and cup segmentation results for the RIM-ONE dataset, respectively. The worst-case (bottom left) and best case (bottom center) F1-scores for optic disc segmentation are 0.9351 and 0.9782, respectively whereas the worst case (top center) and best case (bottom right) F1-scores for optic cup segmentation are 0.7998 and 0.8923, respectively. Our model not only achieves a higher level of segmentation accuracy over state-of-the-art methods, but it also requires less time to reach a stable state during training.
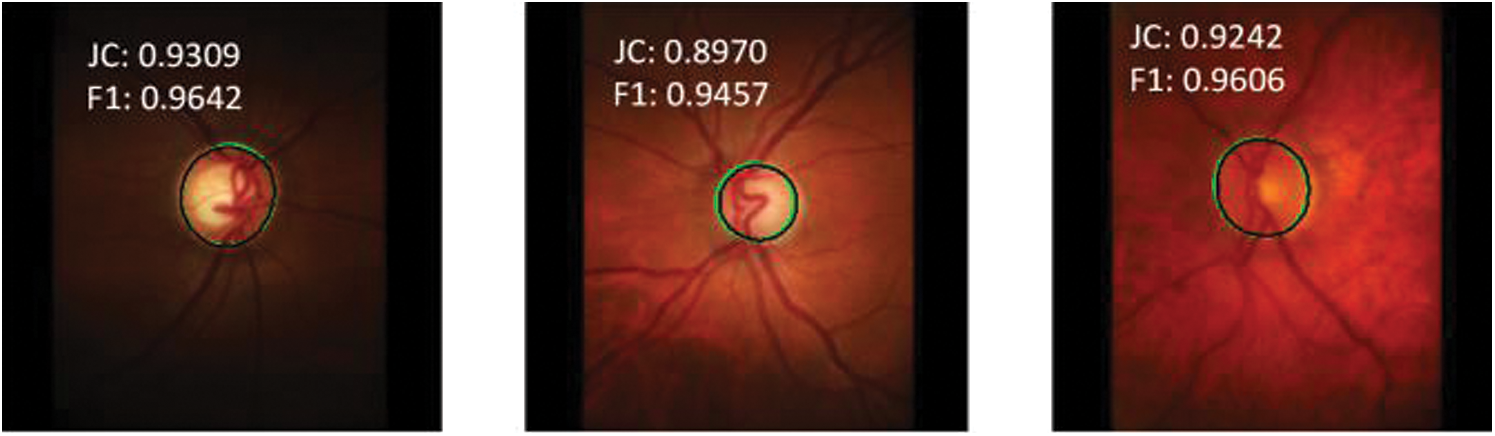

Figure 8: Model prediction vs. expert segmentation of the optic disc boundary for RIM-ONE dataset
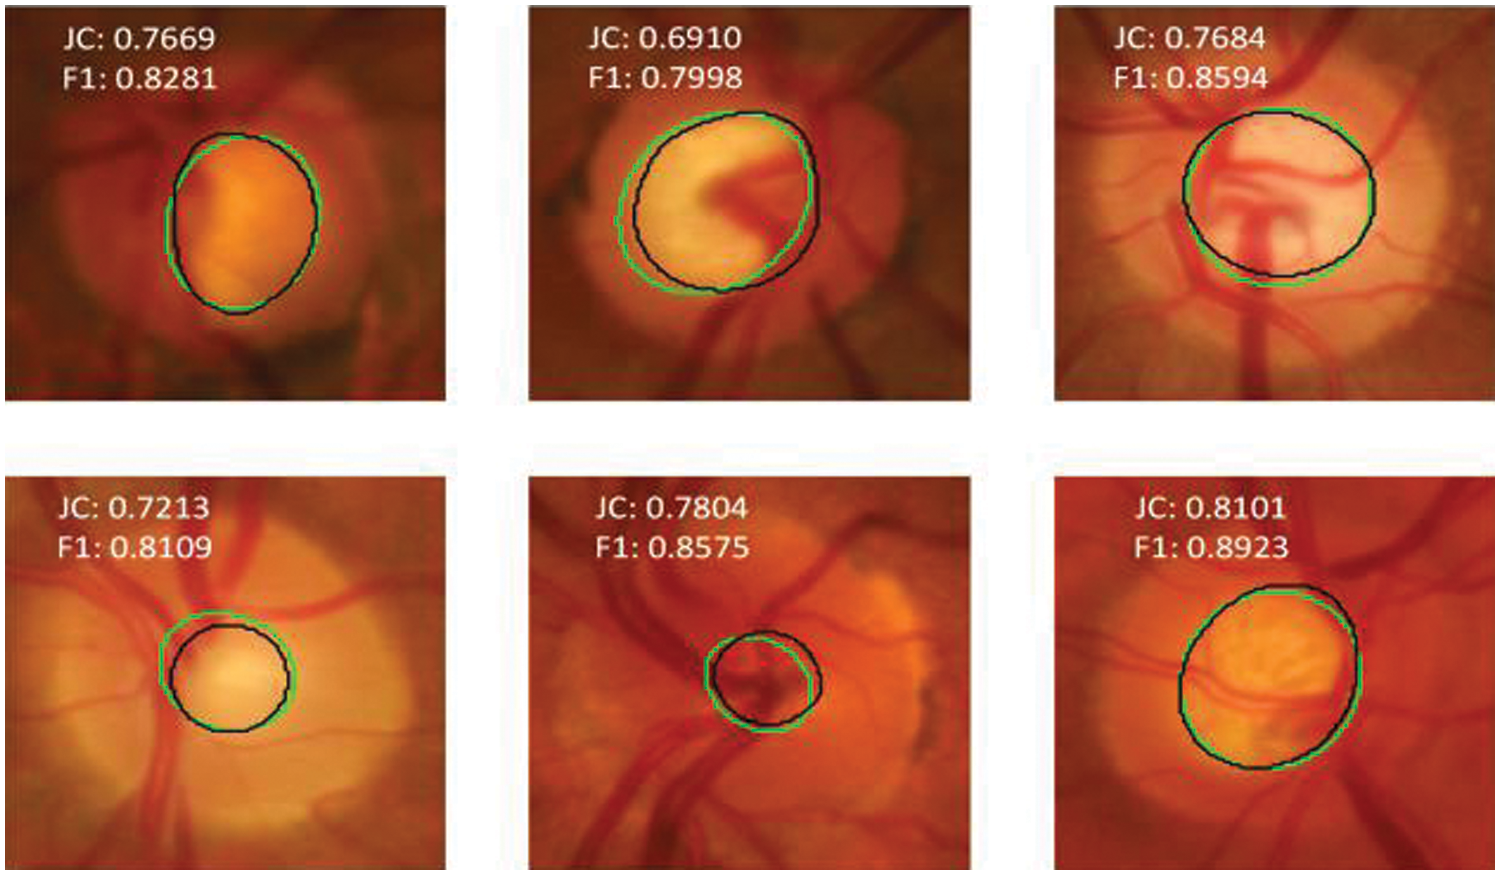
Figure 9: Model prediction vs. expert segmentation of the optic cup boundary for RIM-ONE dataset
The mean JC for the validation data of our proposed model based on images of both databases for OC and OD segmentation is shown in Figs. 10 and 11, respectively. As shown in Fig. 10, the mean JC value quickly rises to 0.75 after only around 15 training epochs. The blue line and orange line shows the mean JC values for OC segmentation where the model is trained on RIMONE and DRISHTI-GS datasets, respectively. The mean JC for RIMONE is slightly lower compared to the mean JC of DRISHTI-GS dataset which is reflected in the optic cup segmentation accuracies on both datasets. Fig. 11 shows how the mean JC value for the RIMONE dataset quickly rises to 0.90 after just around 5 training epochs. However, for the DRISHTI-GS dataset, the model reached a stable state after around 20 epochs.
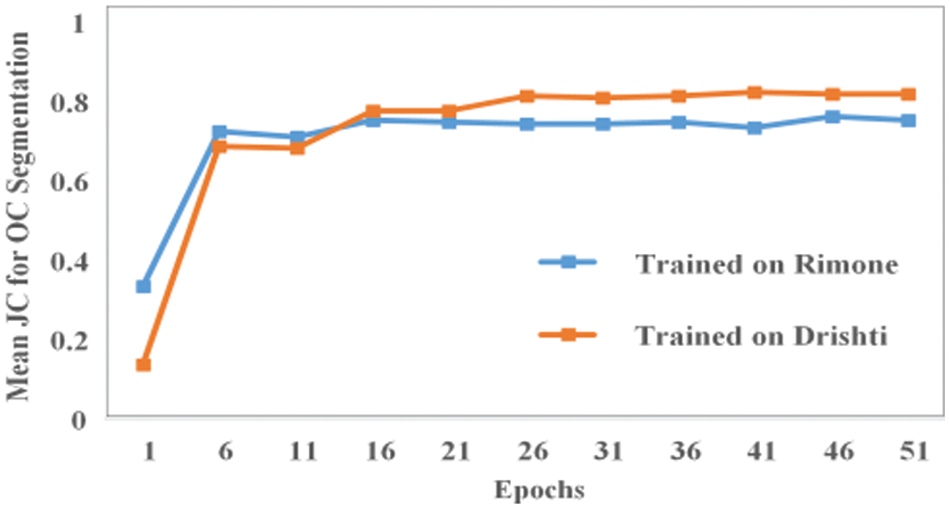
Figure 10: The mean JC values for OC segmentation
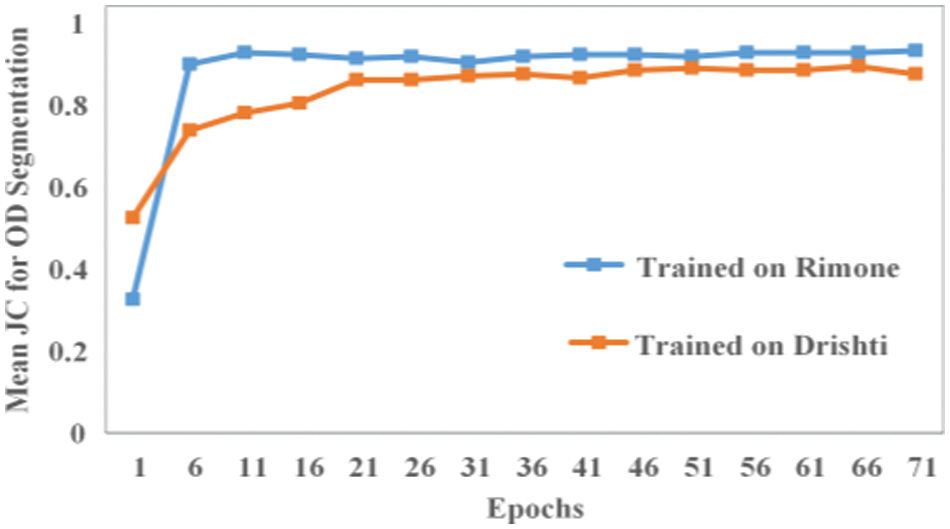
Figure 11: The mean JC values for OD segmentation
The average training time of our proposed model for optic cup segmentation is 45 and 36 min whereas for optic disc segmentation is 1 h 20 min and 1 h 06 min for DRISHTI-GS and RIMONE datasets, respectively. Al-Bander et al. [17] proposed the DenseFCN approach, which is computationally very expensive, with an average training time of about 15 h. Sevastopolsky [39] suggested a modified U-Net model with just 0.69 M trainable parameters that is exceptionally light-weight. However, on both datasets, his suggested model did not place in the top two for any of the evaluation metrics for OC/OD segmentation.
Zhao et al. [45] proposed an attention U-Net model with only 1.03 M trainable parameters. Except for specificity, their suggested model did not place in the top two for any of the evaluation metrics. Our proposed model ranked second in terms of being lightweight with 0.88 M trainable parameters as shown in Table 6. The generalization ability of our proposed model is justified from the segmentation results mentioned in Tables 2 to 5.
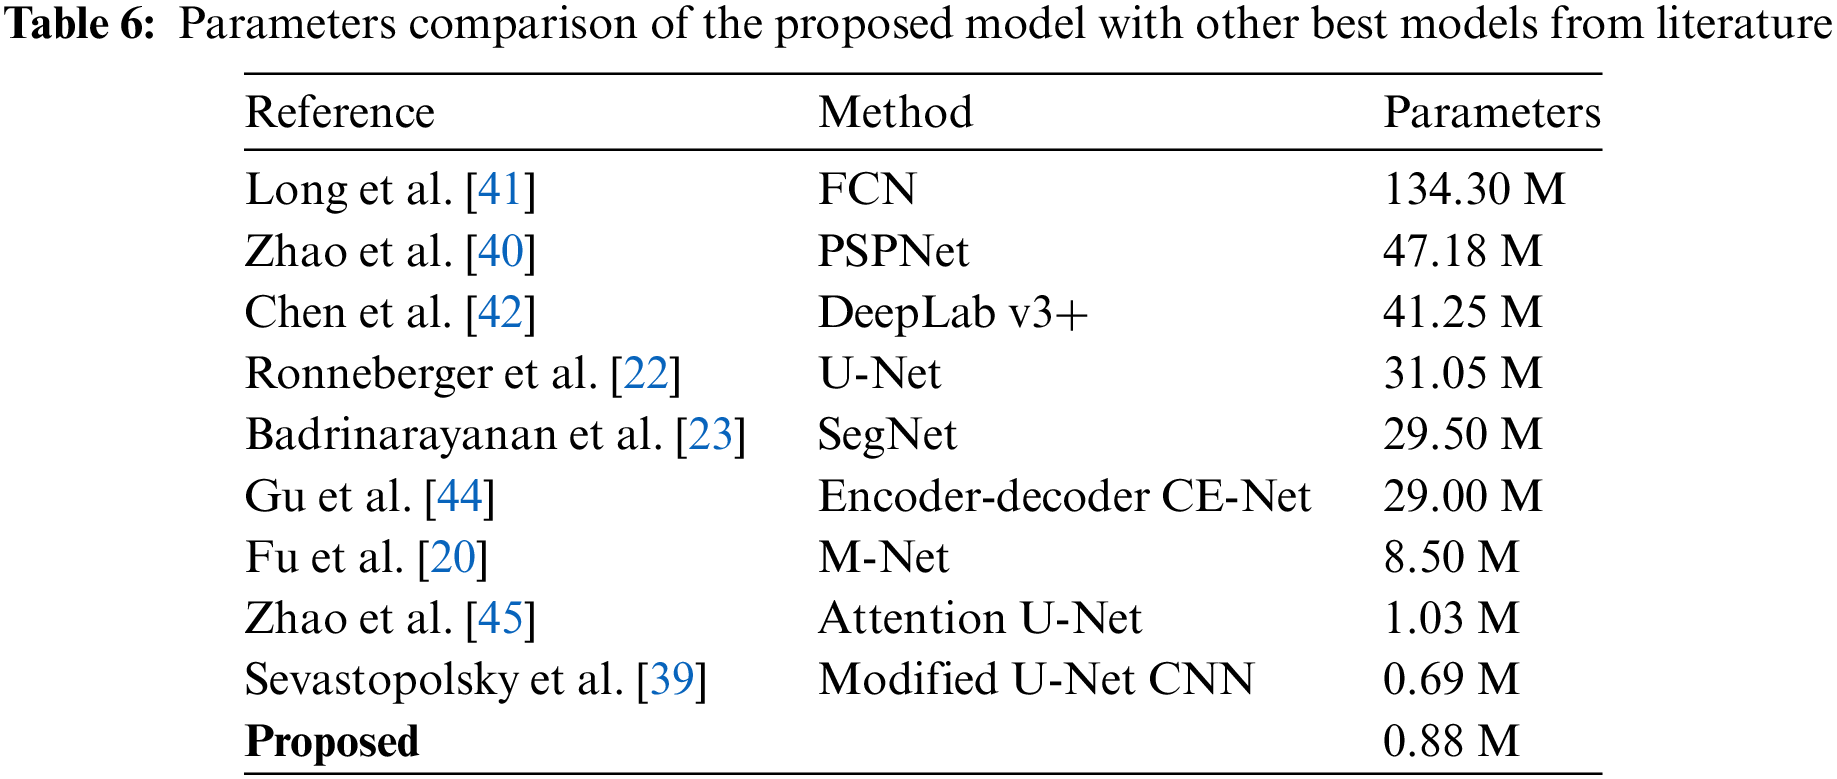
Table 6 indicate that the only method with fewar trainabale parameters than our proposed method is Modified U-Net CNN (Sevastopolsky [39]). However the results in Tables 2 to 5 indicate that none of its evaluation metrics received first, second or third place. On the other hand, our proposed method achieved second lowest computational complexity and memory overhead based on fewer trainable parameter and also achieved most of its evaluation metrics in the first, and second place. For both databases, none of the approaches except our suggested model were consistent with the segmentation of the optic cup and optic disc.
To summarize the results obtained by the proposed model in comparison to numerous state-of-the-art methods, we can say that our proposed model performed very well both in term of significantly improved evaluation metrics and second lowest memory overhead (lower trainable parameters). Hence, based on the the obtained results, we can generalize that our proposed DNN model can be used for early screening of glaucoma disease at the point of care in hospitals.
In this work, we developed a DNN model by introducing several modifications to the basic Anam-Net and demonstrated its effectiveness for the detection of OC and OD in retinal fundus images. The DNN model is applied to segment the OC and OD in two publicly available databases i.e., DRISHTI-GS and RIMONE. The modifications are introduced, where the focus has been on reducing the computational complexity of the model. The model is very lightweight, attributing 0.88 M trainable parameters in addition to its powerful generalization ability. Due to the attributes of being lightweight (lower trainable parameters), both the training and prediction time are significantly lower compared to other rivals from the state-of-the-art. We achieved a training time of approximately 45 mins and 1 h 20 mins for OC and OD, respectively. Furthermore, we achieved the lowest prediction time, which is approximately 0.05 s. Also, in terms of segmentation performance, our developed DNN model outperformed several other models for both optic cup and disc detection in several well-known evaluation metrics. The proposed model achieved lower sensitivity for a few images where the optic cup was small. Even though the results achieved using the proposed model are superior to those obtained using other methods, we believe there is still room for improvement in optic cup segmentation. The attribute of being lightweight makes our developed DNN model a better choice to be selected for front-end clinical settings. The achieved significantly impressive segmentation performance along with substantially lower computational complexity of our developed DNN model advocates for its deployment in apparatus used for patient care in general hospitals for early screening of eye diseases. We plan to improve the proposed model in the future to extend its application to various medical image segmentation such as lesion detection, and tumor detection.
Acknowledgement: None.
Funding Statement: This Research is funded by Researchers Supporting Project Number (RSPD2024R 553), King Saud University, Riyadh, Saudi Arabia.
Author Contributions: The authors confirm contribution to the paper as follows: Khursheed Aurangzeb and Syed Irtaza Haider were responsible for designing and implementing the DNN model, as well as analyzing the obtained results. Khursheed Aurangzeb performed the revision and assumed the role of corresponding author. Musaed Alhussein drafted and reviewed manuscript, suggested important revisions and supported the work financially. Both Khursheed Aurangzeb and Syed Irtaza Haider helped in drafting work and reviewed manuscript. Musaed Alhussein also revised the manuscript critically for highlighting the intellectual contents as well as helped in study design. All authors reviewed the results and approved the final version of the manuscript.
Availability of Data and Materials: Both of the used databases are publicly available for conducting experiments and for comparing results with other models. Both databases are openly available in a public repository.
Ethics Approval: The research conducted in this study used openly available retinal image databases, has been approved out in devotion to the highest ethical standards and practices. The openly available databases used in this work were used in proper compliance with licensing agreements set out by the particular data providers.
Conflicts of Interest: The authors declare that they have no conflicts of interest to report regarding the present study.
References
1. A. Khawaja, T. M. Khan, K. Naveed, S. S. Naqvi, N. U. Rehman and S. J. Nawaz, “An improved retinal vessel segmentation framework using Frangi filter coupled with the probabilistic patch based denoiser,” IEEE Access, vol. 7, pp. 164344–164361, 2019. doi: 10.1109/ACCESS.2019.2953259. [Google Scholar] [CrossRef]
2. K. Bahadar, A. A. Khaliq, and M. Shahid, “A morphological hessian based approach for retinal blood vessels segmentation and denoising using region based otsu thresholding,” PLoS One, vol. 11, no. 7, pp. 1–19, Jul. 2016. [Google Scholar]
3. K. Aurangzeb, S. Aslam, M. Alhussein, R. A. Naqvi, M. Arsalan and S. I. Haider, “Contrast enhancement of fundus images by employing modified PSO for improving the performance of deep learning models,” IEEE Access, vol. 9, pp. 47930–47945, 2021. doi: 10.1109/ACCESS.2021.3068477. [Google Scholar] [CrossRef]
4. H. A. Quigley and A. T. Broman, “The number of people with glaucoma worldwide in 2010 and 2020,” Br. J. Ophthalmol., vol. 90, no. 3, pp. 262–267, Mar. 2006. doi: 10.1136/bjo.2005.081224. [Google Scholar] [PubMed] [CrossRef]
5. Y. Hagiwara et al., “Computer-aided diagnosis of glaucoma using fundus images: A review,” Comput. Methods Programs Biomed., vol. 165, pp. 1–12, Oct. 2018. doi: 10.1016/j.cmpb.2018.07.012. [Google Scholar] [PubMed] [CrossRef]
6. M. I. Rizzo et al., “Glaucoma: Recent advances in the involvement of autoimmunity,” Immunol. Res., vol. 65, no. 1, pp. 207–217, Feb. 2017. doi: 10.1007/s12026-016-8837-3. [Google Scholar] [PubMed] [CrossRef]
7. U. Raghavendra, H. Fujita, S. V. Bhandary, A. Gudigar, T. J. Hong and R. Acharya, “Deep convolution neural network for accurate diagnosis of glaucoma using digital fundus images,” Inf. Sci., vol. 441, pp. 41–49, May 2018. doi: 10.1016/j.ins.2018.01.051. [Google Scholar] [CrossRef]
8. A. Almazroa, R. Burman, K. Raahemifar, and V. Lakshminarayanan, “Optic disc and optic cup segmentation methodologies for glaucoma image detection: A survey,” J. Ophthalmol., vol. 2015, pp. 1–28, 2015. doi: 10.1155/2015/180972. [Google Scholar] [PubMed] [CrossRef]
9. M. Naveed, A. Ramzan, and M. U. Akram, “Clinical and technical perspective of glaucoma detection using oct and fundus images: A review,” in 2017 1st Int. Conf. Next Gen. Comput. Appl. (NextComp), Mauritius, Africa, 2017, pp. 157–162. doi: 10.1109/NEXTCOMP.2017.8016192. [Google Scholar] [CrossRef]
10. W. Ruengkitpinyo, W. Kongprawechnon, T. Kondo, P. Bunnun, and H. Kaneko, “Glaucoma screening using rim width based on isnt rule,” in 6th Int. Conf. Inform. Commun. Technol. Embed. Syst. (IC-ICTES), Hua Hin, Thailand, 2015, pp. 1–5. [Google Scholar]
11. N. A. Mohamed, M. A. Zulkifley, W. M. D. W. Zaki, and A. Hussain, “An automated glaucoma screening system using cup-to-disc ratio via simple linear iterative clustering superpixel approach,” Biomed. Signal Process. Control, vol. 53, pp. 1–17, Aug. 2019. doi: 10.1016/j.bspc.2019.01.003. [Google Scholar] [CrossRef]
12. M. Soorya, A. Issac, and M. K. Dutta, “An automated and robust image processing algorithm for glaucoma diagnosis from fundus images using novel blood vessel tracking and bend point detection,” Int. J. Med. Inform., vol. 110, pp. 52–70, Feb. 2018. doi: 10.1016/j.ijmedinf.2017.11.015. [Google Scholar] [PubMed] [CrossRef]
13. V. G. Edupuganti, A. Chawla, and A. Kale, “Automatic optic disk and cup segmentation of fundus images using deep learning,” in 25th IEEE Int. Conf. Image Process. (ICIP), Athens, Greece, 2018, pp. 2227–2231. [Google Scholar]
14. P. Qin, L. Wang, and H. Lv, “Optic disc and cup segmentation based on deep learning,” in IEEE 3rd Inform. Technol., Netw., Electron. Autom. Control Conf. (ITNEC), Chengdu, China, 2019, pp. 1835–1840. [Google Scholar]
15. J. Zilly, J. M. Buhmann, and D. Mahapatra, “Glaucoma detection using entropy sampling and ensemble learning for automatic optic cup and disc segmentation,” Comput. Med. Imaging Graph, vol. 55, pp. 28–41, Jan. 2017. doi: 10.1016/j.compmedimag.2016.07.012. [Google Scholar] [PubMed] [CrossRef]
16. S. Yu, D. Xiao, S. Frost, and Y. Kanagasingam, “Robust optic disc and cup segmentation with deep learning for glaucoma detection,” Comput. Med. Imaging Graph, vol. 74, pp. 61–71, Jun. 2019. doi: 10.1016/j.compmedimag.2019.02.005. [Google Scholar] [PubMed] [CrossRef]
17. B. Al-Bander, B. M. Williams, W. Al-Nuaimy, M. A. Al-Taee, H. Pratt and Y. Zheng, “Dense fully convolutional segmentation of the optic disc and cup in colour fundus for glaucoma diagnosis,” Symmetry, vol. 10, no. 4, pp. 1–16, 2018. doi: 10.3390/sym10040087. [Google Scholar] [CrossRef]
18. S. Wang, L. Yu, X. Yang, C. Fu, and P. Heng, “Patch-based output space adversarial learning for joint optic disc and cup segmentation,” IEEE Trans. Med. Imaging, vol. 38, no. 11, pp. 2485–2495, 2019. doi: 10.1109/TMI.2019.2899910. [Google Scholar] [PubMed] [CrossRef]
19. Y. Jiang, N. Tan, and T. Peng, “Optic disc and cup segmentation based on deep convolutional generative adversarial networks,” IEEE Access, vol. 7, pp. 64483–64493, 2019. doi: 10.1109/ACCESS.2019.2917508. [Google Scholar] [CrossRef]
20. H. Fu, J. Cheng, Y. Xu, D. W. K. Wong, J. Liu and X. Cao, “Joint optic disc and cup segmentation based on multi-label deep network and polar transformation,” IEEE Trans. Med. Imaging, vol. 37, no. 7, pp. 1597–1605, 2018. doi: 10.1109/TMI.2018.2791488. [Google Scholar] [PubMed] [CrossRef]
21. H. Fu et al., “Disc-aware ensemble network for glaucoma screening from fundus image,” IEEE Trans. Med. Imaging, vol. 37, no. 11, pp. 2493–2501, 2018. doi: 10.1109/TMI.2018.2837012. [Google Scholar] [PubMed] [CrossRef]
22. O. Ronneberger, P. Fischer, and T. Brox, “U-Net: Convolutional networks for biomedical image segmentation,” in N. Navab, J. Hornegger, W. Wells, A. Frangi (Eds.Medical Image Computing and Computer-Assisted Intervention–MICCAI 2015, Cham: Springer, 2015, vol. 9351, pp. 234–241, doi: 10.1007/978-3-319-24574-4_28. [Google Scholar] [CrossRef]
23. V. Badrinarayanan, A. Kendall, and R. Cipolla, “SegNet: A deep convolutional encoder-decoder architecture for image segmentation,” IEEE Trans. Pattern Anal. Mach. Intell., vol. 39, no. 12, pp. 2481–2495, 2017. doi: 10.1109/TPAMI.2016.2644615. [Google Scholar] [PubMed] [CrossRef]
24. N. Paluru et al., “Anam-Net: Anamorphic depth embedding-based lightweight CNN for segmentation of anomalies in COVID-19 chest CT images,” IEEE Trans. Neural Netw. Learn. Syst., vol. 32, no. 3, pp. 932–946, 2021. doi: 10.1109/TNNLS.2021.3054746. [Google Scholar] [PubMed] [CrossRef]
25. A. Agarwal, S. Gulia, S. Chaudhary, M. K. Dutta, C. M. Travieso and J. B. Alonso-Hernández, “A novel approach to detect glaucoma in retinal fundus images using cup-disk and rim-disk ratio,” in 4th Int. Work Conf. Bioinspired Intell. (IWOBI), San Sebastian, Spain, 2015, pp. 139–144. [Google Scholar]
26. A. Issac, M. Parthasarthi, and M. K. Dutta, “An adaptive threshold based algorithm for optic disc and cup segmentation in fundus images,” in 2nd Int. Conf. Signal Process. Integr. Netw. (SPIN), Noida, India, 2015, pp. 143–147. [Google Scholar]
27. T. Khalil, M. U. Akram, S. Khalid, and A. Jameel, “Improved automated detection of glaucoma from fundus image using hybrid structural and textural features,” IET Image Process., vol. 11, no. 9, pp. 693–700, 2017. doi: 10.1049/iet-ipr.2016.0812. [Google Scholar] [CrossRef]
28. N. Thakur and M. Juneja, “Survey on segmentation and classification approaches of optic cup and optic disc for diagnosis of glaucoma,” Biomed. Signal Process. Control, vol. 42, pp. 162–189, Apr. 2018. doi: 10.1016/j.bspc.2018.01.014. [Google Scholar] [CrossRef]
29. G. D. Joshi, J. Sivaswamy, K. Karan, and S. R. Krishnadas, “Optic disk and cup boundary detection using regional information,” in IEEE Int. Symp. Biomed. Imaging: From Nano to Macro, Rotterdam, Netherlands, 2010, pp. 948–951. [Google Scholar]
30. J. Cheng et al., “Automatic optic disc segmentation with peripapillary atrophy elimination,” in Annu. Int. Conf. IEEE Eng. Med. Biol. Soc., Boston, MA, 2011, pp. 6224–6227. [Google Scholar]
31. G. D. Joshi, J. Sivaswamy, and S. R. Krishnadas, “Optic disk and cup segmentation from monocular color retinal images for glaucoma assessment,” IEEE Trans. Med. Imaging, vol. 30, no. 6, pp. 1192–1205, 2011. doi: 10.1109/TMI.2011.2106509. [Google Scholar] [PubMed] [CrossRef]
32. M. S. Haleem et al., “A novel adaptive deformable model for automated optic disc and cup segmentation to aid glaucoma diagnosis,” J. Med. Syst., vol. 42, no. 1, pp. 1–18, Dec. 2017. [Google Scholar]
33. J. R. H. Kumar, A. K. Pediredla, and C. S. Seelamantula, “Active discs for automated optic disc segmentation,” in IEEE Glob. Conf. Signal Inform. Process. (GlobalSIP), Orlando, FL, 2015, pp. 225–229. [Google Scholar]
34. J. Cheng et al., “Superpixel classification based optic disc and optic cup segmentation for glaucoma screening,” IEEE Trans. Med. Imaging, vol. 32, no. 6, pp. 1019–1032, 2013. doi: 10.1109/TMI.2013.2247770. [Google Scholar] [PubMed] [CrossRef]
35. A. Septiarini, A. Harjoko, R. Pulungan, and R. Ekantini, “Automated detection of retinal nerve fiber layer by texture-based analysis for glaucoma evaluation,” Healthc Inform. Res., vol. 24, no. 4, pp. 335–345, 2018. doi: 10.4258/hir.2018.24.4.335. [Google Scholar] [PubMed] [CrossRef]
36. A. Septiarini, D. M. Khairina, A. H. Kridalaksana, and H. Hamdani, “Automatic glaucoma detection method applying a statistical approach to fundus images,” Healthc Inform. Res., vol. 24, no. 1, pp. 53–60, 2018. doi: 10.4258/hir.2018.24.1.53. [Google Scholar] [PubMed] [CrossRef]
37. K. Akyol, B. Sen, and S. Bayır, “Automatic detection of optic disc in retinal image by using keypoint detection, texture analysis, and visual dictionary techniques,” Comput. Math. Methods Med., vol. 2016, pp. 1–10, 2016. doi: 10.1155/2016/6814791. [Google Scholar] [PubMed] [CrossRef]
38. S. Sedai, P. K. Roy, D. Mahapatra, and R. Garnavi, “Segmentation of optic disc and optic cup in retinal fundus images using shape regression,” in 38th Annu. Int. Conf. IEEE Eng. Med. Biol. Soc. (EMBC), Orlando, FL, 2016, pp. 3260–3264. [Google Scholar]
39. A. Sevastopolsky, “Optic disc and cup segmentation methods for glaucoma detection with modification of U-Net convolutional neural network,” Pattern Recognit. Image Anal., vol. 27, no. 3, pp. 618–624, Jul. 2017. doi: 10.1134/S1054661817030269. [Google Scholar] [CrossRef]
40. H. Zhao, J. Shi, X. Qi, X. Wang, and J. Jia, “Pyramid scene parsing network,” in 30th IEEE Conf. Comput. Vis. Pattern Recognit., Honolulu, HI, 2017, pp. 6230–6239. [Google Scholar]
41. J. Long, E. Shelhamer, and T. Darrell, “Fully convolutional networks for semantic segmentation,” in IEEE Conf. Comput. Vis. Pattern Recognit., Boston, MA, 2015, pp. 3431–3440. [Google Scholar]
42. L. C. Chen, G. Papandreou, F. Schroff, and H. Adam, “Rethinking atrous convolution for semantic image segmentation,” arXiv:1706.05587, 2017. [Google Scholar]
43. J. Son, S. J. Park, and K. H. Jung, “Towards accurate segmentation of retinal vessels and the optic disc in fundoscopic images with generative adversarial network,” J. Digit. Imaging, vol. 32, no. 3, pp. 499–512, 2019. doi: 10.1007/s10278-018-0126-3. [Google Scholar] [PubMed] [CrossRef]
44. Z. Gu et al., “CE-Net: Context encoder network for 2D medical image segmentation,” IEEE Trans. Med. Imaging, vol. 38, no. 10, pp. 2281–2292, 2019. doi: 10.1109/TMI.2019.2903562. [Google Scholar] [PubMed] [CrossRef]
45. X. Zhao, S. Wang, J. Zhao, H. Wei, M. Xiao and N. Ta, “Application of an attention U-Net incorporating transfer learning for optic disc and cup segmentation,” Signal, Image Video Process., vol. 15, no. 5, pp. 913–921, 2021. doi: 10.1007/s11760-020-01815-z. [Google Scholar] [CrossRef]
46. R. Panda, N. B. Puhan, B. Mandal, and G. Panda, “GlaucoNet: Patch based residual deep learning network for optic disc and cup segmentation towards glaucoma assessment,” SN Comput. Sci., vol. 2, pp. 1–17, 2021. doi: 10.1007/s42979-021-00491-1. [Google Scholar] [CrossRef]
47. A. Chowdhury, R. Agarwal, A. Das, and D. Nandi, “U-Net based optic cup and disk segmentation from retinal fundus images via entropy sampling” in Advanced Computational Paradigms and Hybrid Intelligent Computing. Advances in Intelligent Systems and Computing. Singapore: Springer, 2021, vol. 1373, pp. 479–489. [Google Scholar]
48. K. Aurangzeb, R. S. Alharthi, S. I. Haider, and M. Alhussein, “Systematic development of AI-enabled diagnostic systems for glaucoma and diabetic retinopathy,” IEEE Access, vol. 11, pp. 105069–105081, 2023. doi: 10.1109/ACCESS.2023.3317348. [Google Scholar] [CrossRef]
49. R. Ali et al., “Optic disk and cup segmentation through fuzzy broad learning system for glaucoma screening,” IEEE Trans. Ind. Inform., vol. 17, no. 4, pp. 2476–2487, 2021. doi: 10.1109/TII.2020.3000204. [Google Scholar] [CrossRef]
50. S. Tadisetty, R. Chodavarapu, R. Jin, R. J. Clements, and M. Yu, “Identifying the edges of the optic cup and the optic disc in glaucoma patients by segmentation,” Sensors, vol. 23, no. 10, pp. 4668, 2023. doi: 10.3390/s23104668. [Google Scholar] [PubMed] [CrossRef]
51. S. Feng et al., “CPFNet: Context pyramid fusion network for medical image segmentation,” IEEE Trans. Med. Imaging, vol. 39, no. 10, pp. 3008–3018, 2020. doi: 10.1109/TMI.2020.2983721. [Google Scholar] [PubMed] [CrossRef]
52. L. Mou et al., “CS2-Net: Deep learning segmentation of curvilinear structures in medical imaging,” Med. Imaging Anal., vol. 67, pp. 101874, 2021. doi: 10.1016/j.media.2020.101874. [Google Scholar] [PubMed] [CrossRef]
53. X. Zhang, J. Song, C. Wang, and Z. Zhou, “Convolutional autoencoder joint boundary and mask adversarial learning for fundus image segmentation,” Front. Hum. Neurosci., vol. 16, pp. 490, 2022. doi: 10.3389/fnhum.2022.1043569. [Google Scholar] [PubMed] [CrossRef]
Cite This Article
 Copyright © 2024 The Author(s). Published by Tech Science Press.
This work is licensed under a Creative Commons Attribution 4.0 International License , which permits unrestricted use, distribution, and reproduction in any medium, provided the original work is properly cited.
 Downloads
 Citation Tools