
 Submit a Paper
 Propose a Special lssue
 Open Access
ARTICLE

Research on Multi-Scale Feature Fusion Network Algorithm Based on Brain Tumor Medical Image Classification
1 Graduate School, China Academy of Engineering Physics, Beijing, 100000, China
2 Department of Computational Mathematics, Beijing Institute of Applied Physics and Computational Mathematics, Beijing, 100000, China
3 National Key Laboratory of Computational Physics, Beijing, 100088, China
4 Shanghai Zhangjiang Institute of Mathematics, Shanghai, 201203, China
* Corresponding Author: Junping Yin. Email:
(This article belongs to the Special Issue: Deep Learning in Computer-Aided Diagnosis Based on Medical Image)
Computers, Materials & Continua 2024, 79(3), 5313-5333. https://doi.org/10.32604/cmc.2024.052060
Received 21 March 2024; Accepted 11 May 2024; Issue published 20 June 2024
 View Full Text
 Download PDF
Abstract
Gliomas have the highest mortality rate of all brain tumors. Correctly classifying the glioma risk period can help doctors make reasonable treatment plans and improve patients’ survival rates. This paper proposes a hierarchical multi-scale attention feature fusion medical image classification network (HMAC-Net), which effectively combines global features and local features. The network framework consists of three parallel layers: The global feature extraction layer, the local feature extraction layer, and the multi-scale feature fusion layer. A linear sparse attention mechanism is designed in the global feature extraction layer to reduce information redundancy. In the local feature extraction layer, a bilateral local attention mechanism is introduced to improve the extraction of relevant information between adjacent slices. In the multi-scale feature fusion layer, a channel fusion block combining convolutional attention mechanism and residual inverse multi-layer perceptron is proposed to prevent gradient disappearance and network degradation and improve feature representation capability. The double-branch iterative multi-scale classification block is used to improve the classification performance. On the brain glioma risk grading dataset, the results of the ablation experiment and comparison experiment show that the proposed HMAC-Net has the best performance in both qualitative analysis of heat maps and quantitative analysis of evaluation indicators. On the dataset of skin cancer classification, the generalization experiment results show that the proposed HMAC-Net has a good generalization effect.Keywords
Brain tumors are one of the most common diseases in the world. During 2019–2020, China’s national brain tumor registry research platform registered an average of 12,768 brain tumor patients annually, about ten times the number of cases reported in the previous decade [1]. Tumors are caused by mutations in cell function, which result in a loss of the cell’s ability to accept programmed cell death. Although brain tumors rarely spread to other parts of the body, they can still be dangerous. Brain tumors can proliferate and damage brain tissue as they spread to nearby areas. Brain tumor growth compresses brain tissue and can cause complications even if the cancer is benign. Brain tumors account for about 2.17% of all cancer deaths, and 5-year survival rates are low.
Magnetic resonance imaging (MRI) contains multiple sequences and is the most used and accurate test for diagnosing brain tumors. Commonly used MRI sequences include T1-weighted imaging (T1WI), T1-weighted gadolinium enhanced imaging (T1Gd), T2-weighted imaging (T2WI), and fluid-attenuated inversion recovery (FLAIR). The sequence anatomy and bleeding of T1WI were precise, with few artifacts, but the lesions were not displayed [2]. The contrast between blood vessels and brain tissue in the T1Gd sequence is more prominent, and cerebral vessels and lesions can be more clearly displayed [3]. T2WI sequences can provide a more precise diagnosis of lesions and edema, especially for brain tumors [4]. FLAIR sequences can be used to determine the boundaries of edema around tumors [5]. Different MRI sequences are used to examine different anatomical structures. Although the imaging time is longer, it has been widely used in clinical practice because of its non-invasive and high accuracy.
Medical image classification is a process that uses machine learning algorithms to analyze medical images to extract the diagnostic features of diseases and make diagnoses. Medical image classification algorithms are divided into two categories: Traditional medical image classification algorithms and deep learning-based medical image classification algorithms. Traditional medical image classification algorithms combine manual feature extraction and classification algorithms to realize medical image classification. Since 2006, deep learning has emerged as a branch of machine learning. In recent years, deep learning has made breakthroughs in computer vision, natural language processing, bioinformatics, and other fields. Deep learning methods are modeled on human brain neural networks. Combining multiple non-linear processing layers, the original data is abstracted layer by layer to obtain features in the data for target detection, classification, or segmentation. The advantage of deep learning is that it replaces manual feature acquisition with efficient algorithms for unsupervised or semi-supervised feature learning and hierarchical feature extraction [6].
In clinical diagnosis, the doctor should consider the global and local characteristics of the lesion. Take brain tumors, for example. Local features help judge tumor edema information, and global features help judge tumor location information. The medical image classification algorithm based on convolutional neural network (CNN) focuses on extracting global features for image classification [7], while the medical image classification algorithm based on transformer focuses on extracting local features for image classification [8]. The effective combination of CNN and transformer is conducive to the comprehensive classification of medical images from the perspective of global features and local features. However, the biggest problem with select global features is that for every predicted value generated by the model, a concerning mechanism must be calculated using all previous historical states, which is very expensive to calculate the inverse gradient propagation of the model. Effectively combining CNN and transformer to reduce computing costs is particularly important.
Aiming at the above problems in the medical image classification algorithm, this paper proposes a hierarchical multi-scale attention feature fusion medical image classification network: HMAC-Net. The proposed network consists of four blocks: Global feature extraction block, local feature extraction block, feature fusion block, and iterative multi-scale classification block. This paper makes the following contributions:
1) The network has three parallel layers: Global feature extraction, local feature extraction, and feature fusion. At each level, with the forward propagation of the network, the advantages of the transformer and CNN can be combined in multiple scales to improve the performance of medical image classification.
2) It aims to address the problem of information redundancy caused by the global attention mechanism, and a global feature extraction block has been designed. The block consists of a linear encoder and a sparse backtracking attention mechanisms (SAB) block, which retains essential features and reduces the computational cost of gradient backward propagation. Construct a local feature extraction block. The block includes layer normalization and a bilateral local attention mechanism (BLA) block, feature extraction of local neighborhoods in the same slice, and feature extraction of local spatial domains between adjacent slices that can be realized simultaneously. The Channel attention feature fusion (CAFF) block is proposed. The block consists of a convolutional attention mechanism and residual-reverse multilayer sensing unit, which can realize the effective fusion of multi-scale global features and local features.
3) The network constructs a two-branch iterative multi-scale classification fusion (MCFC) block composed of two-branch up-sampling, global average pooling layer, and layer normalization. The features at different scales are analyzed through multiple iterations of forward and backward propagation to improve the final medical image classification effect.
4) Different modal brain glioma datasets verified the validity of the algorithm, and skin cancer datasets verified the algorithm’s generalization. Compared with the most advanced algorithms, the performance of HMAC-Net has been effectively improved in both qualitative and quantitative analysis.
The research and application of deep learning methods in image processing, such as image segmentation, image recognition, image classification, image annotation, and image generation, are developing rapidly. In image classification, Hinton et al. designed the AlexNet [9] network structure in 2012; the accuracy rate reached 83.6%, and they won the championship in ImageNet image classification, so deep learning has been widely used. DeepMind’s VGGNet [10] achieved 92.7% accuracy in ImageNet image classification. Given the shortcomings of CNN in the requirement of fixed input size, He et al. proposed the spatial pyramid pooling (SPP) model to enhance the robustness of input data [11]. Given the possible model degradation problem, He proposed the residual network ResNet and continuously promoted the deep learning technology [12].
With the continuous development of deep learning, medical image classification algorithms based on attention mechanisms also keep appearing. Medical image classification algorithms based on attention mechanisms can combine the information in the image and add attention mechanisms such as space or location into the network framework, which is conducive to improving image classification accuracy. Nagarani et al. [13] proposed a progressive generative adversarial network based on a self-attention mechanism and momentum search optimization for brain tumor classification on MRI images. By combining texture features with generative adversarial network, the accuracy of MRI image classification for benign and malignant brain tumors was 88.23%. Waghere et al. [14] proposed a dense convolutional autoencoder based on dual attention to identifying brain tumors in MRI images. The algorithm uses Kapur’s threshold for segmentation, directional gradient pyramid histogram, and grayscale run matrix to extract the shape and texture features of the segmented MRI. Gliomas, pituitary tumors, and meningiomas were classified by shape and texture features. The classification accuracy of this algorithm is 97.28%. Tabatabaei et al. [15] introduced a branch-parallel model, which integrated a transformer block, self-attention mechanism unit, and CNN to classify brain tumors in MRI images. The classification accuracy of brain tumor MRI was 98.59%, which realized rapid and accurate diagnosis. The medical image classification algorithm based on the transformer can capture the global dependence. However, in combination with clinical, local information is also needed. The medical image classification algorithm based on CNN can improve the existing problems in transformer.
There are currently medical image classification algorithms based on CNN and transformer. Liu et al. [16] proposed a hybrid and efficient medical image classification network based on CNN and transformer, which uses a few parameters to classify images of pneumonia, colon cancer, and skin diseases quickly and accurately. However, since this method is based on the analysis of white light images combined with image visualization discovery, white light medical photos make it easier to find lesions than MRI medical images, and the algorithm’s accuracy is relatively high. Wu et al. [17] proposed a new hybrid deep learning model. The algorithm uses the multi-label multi-attention enhancement feature block to explore the implicit correlation between the labels, the multi-branch residual block to optimize the model, and the information interaction block to strengthen the information transmission between the multi-branches. This framework is more competitive than the previous research. Its strong generalization ability makes it suitable for multi-label image classification tasks. In the multi-branch structure of this network, the influence of the shallow features of a single branch on the final classification task is not considered. Combining shallow features and deep features is conducive to improving the classification effect. Yan et al. [18] combined transformer and CNN to extract long-term and short-term dependencies by using transformer and CNN and mining richer and heterogeneous image attributes from these two branches. In the two-branch structure of the network, the association between the two branches was not considered. This leads to the fact that although global and local features are extracted, the correlation between features is not considered. Huo et al. [19] proposed a three-branch hierarchical multi-scale feature fusion network structure (HiFuse). The network framework uses a parallel hierarchical structure to extract global and local features without destroying the framework of CNN and transformer. At the same time, the correlation between features is considered, and the feature fusion block is used for information synthesis. In the global feature select branch of HiFuse, the network uses a global attention mechanism for feature extraction. However, from the view of feature extraction, more features do not mean better results. Extracting features with high importance is more conducive to improving the network effect, and at the same time, it can reduce the computation time of the network. Given the problems in related work, this paper combines CNN with transformer to complete the extraction and fusion of global and local features under the three-branch parallel network structure. The shallow and deep features were integrated to achieve iterative multi-scale classification.
To improve the accuracy of the medical image classification model, it is necessary to combine local and global features at different levels. For hierarchical feature fusion, a parallel network structure HMAC-Net is designed in this paper, and its network structure is shown in Fig. 1. The network structure is composed of three hierarchies: The local feature extraction level is used to extract the local features of the image, the global feature extraction layer is used to extract the global features of the image, and the feature fusion level is used to fuse the multi-scale local features and global features.

Figure 1: HMAC-Net network framework
In the global feature extraction layer, the patch is taken as the primary computing unit, and each patch comprises 4 × 4 pixels. The advantage of this approach is that it speeds up the calculation and makes it easy to extract global features. The data processed by the patch is input into the global feature extraction block, which consists of a linear encoder and SAB block. The linear encoder achieves feature dimension reduction while maintaining the global linear feature. The SAB block performs feature extraction in forward propagation and screening critical features in backward propagation. In the feature extraction process, texture information is extracted from a shallow network, and semantic information is extracted from a deep network. The input and output of each global feature extraction block were fused in series to preserve the texture information as much as possible and improve the classification effect of brain tumors.
In the local feature extraction layer, the image is preprocessed by two-dimensional convolution. The obtained data is input into the local feature extraction block consisting of layer normalization and the BLA block. The purpose of layer normalization is to find a “semantic center” and then set the features related to the classification results of the semantic center so that the correlation between the features will not be destroyed. The BLA block extracts and clusters local features to ensure the correlation between the output features. At the same time, the BLA block can realize local neighborhood feature extraction of the same slice and local spatial feature extraction between adjacent slices. As with the global branch, the input and output of the local feature extraction block are fused to preserve texture information as much as possible.
Considering the correlation between local and global features at the same level, the CAFF block is used for feature fusion. The features obtained from the global feature extraction level, local feature extraction level, and feature fusion level are processed by the MCFC block to achieve the purpose of medical image classification.
Medical images contain rich anatomical structure information, among which the acquisition of global context information is significant because it can focus on semantic-level features. The attention mechanism mimics the human visual perception system, is a complex cognitive ability that helps classification models focus on crucial information and remove redundant information. Often, when we want to focus on a particular object in some scene, we will focus on the area of interest and ignore other objects outside the area of interest. Similarly, in deep learning, information extracted at different levels flows backward. If some prior information about brain tumors and edema is known, this information can be used to suppress the flow of ineffective details to preserve important information. In this way, attention mechanisms can help deep learning models better process complex information, quickly screen out high-value content from large amounts of information and improve classification performance and information processing efficiency. Unlike the global attention mechanisms of sequential processing, organisms or humans generally do not recall all information sequentially but specific discrete pieces of information and related fragments [20]. Therefore, this structure considers introducing SAB block into the global feature extraction hierarchy [21].
SAB block includes forward propagation process (Fig. 2) and backward propagation process (Fig. 3). During forward propagation, a recurrent neural network (RNN) structure is first defined as a memory unit. A memory unit can be represented as:

Figure 2: SAB block forward propagation framework
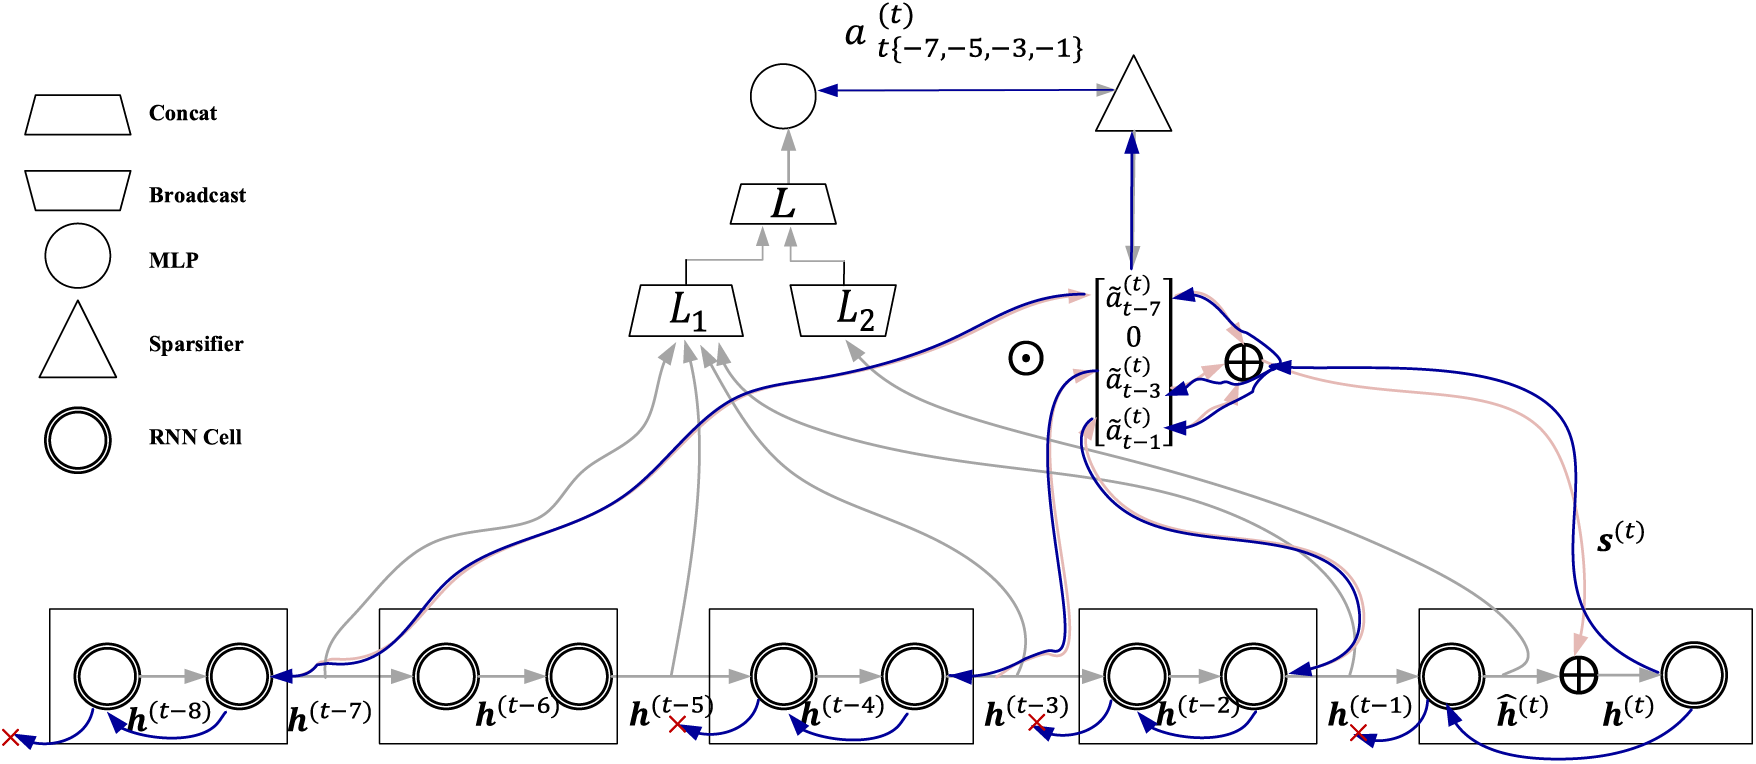
Figure 3: SAB block backward propagation framework
where,
The backward propagation process is shown in Fig. 3. Backward propagation of SAB block is a direct form of information distribution, which avoids the competition of limited information for sequential path computing power and finds a balance between the high computing power required to retain valuable information and the low computing power required to obtain limited information. In the backward propagation process, the parameter
As shown in Fig. 4, BLA block [22] is composed of image-space local attention, feature-space local attention, MLP and layer normalization. Let the input set be
where,
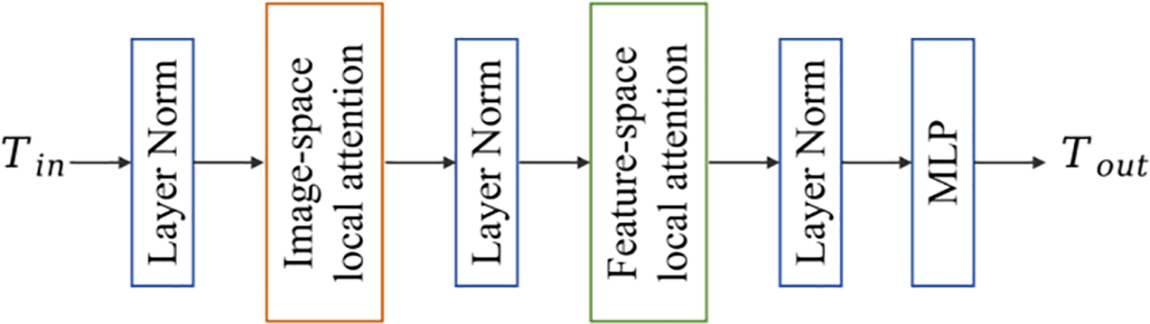
Figure 4: BLA block framework

Figure 5: Linear swin transformer and linear swin transformer block
The Swin Transformer Block is shown in Fig. 5b. The sliding window-based windows multi-head self-attention (W-MSA) mechanism is designed to limit the computation of attention to a single sliding window so that the computational complexity increases linearly as the image size increases. Shifted windows multi-head self-attention (SW-MSA) overcomes the drawback of W-MSA focusing only on features within a single sliding window. SW-MSA makes cross-connection between different Windows, enhances the extraction of global features, and improves the model’s performance.
The feature-space local attention (FSLA) block computes a self-attention mechanism between tokens close in the feature space, which complements the ISLA block. The FSLA block formula can be expressed as:
where,
where,
The CAFF block can adaptively fuse local features of different levels, global representations, and semantic information of the previous level after fusion according to input features, as shown in Fig. 6.
where,
where,
where,
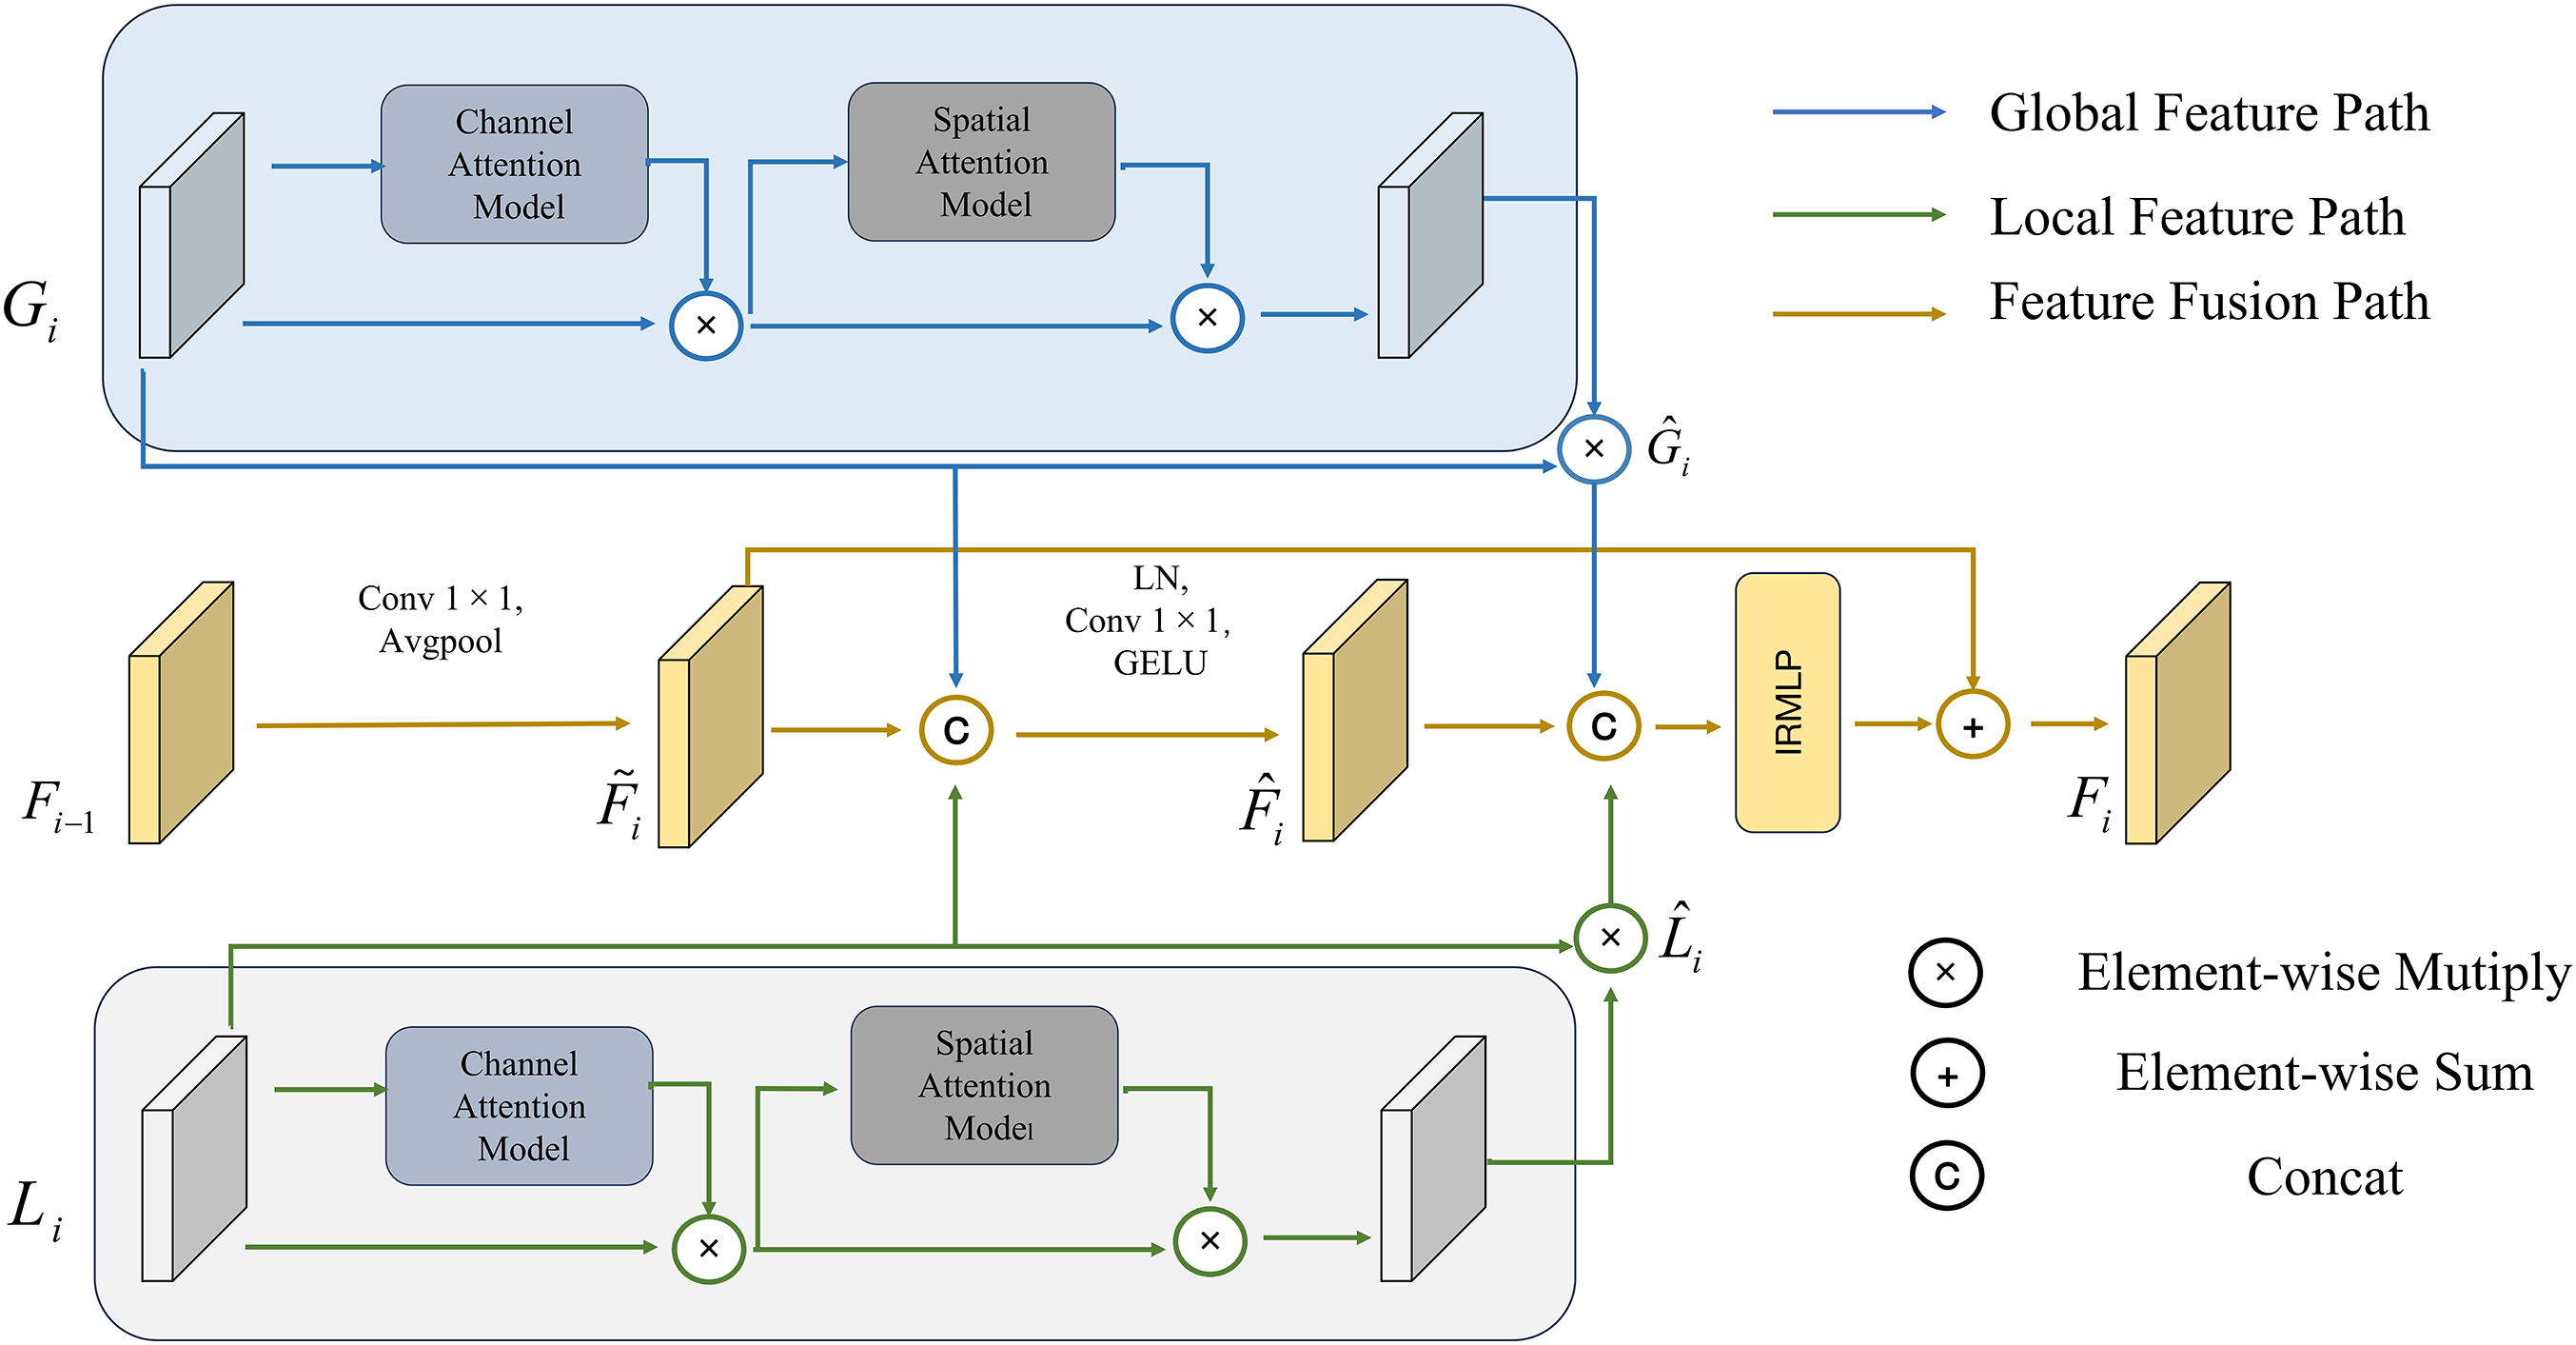
Figure 6: CAFF block
To effectively utilize the feature information of each layer of CAFF and prevent the loss of task-related information, a two-branch iterative multi-scale fusion classification block is introduced before the classifier. MCFC to fuse multi-layer feature information. The feature fusion process is as follows, and the model is shown in Fig. 7.

Figure 7: MCFC block
where,
This section will provide a comparative analysis of HMAC-Net and several state-of-the-art methods for medical image classification based on MRI images. These experiments include qualitative and quantitative comparisons using publicly available datasets. In addition, ablation studies were conducted to investigate the performance and components of the method in depth.
Brain Tumor Segmentation Challenge 2021 (BraTS2021) [24] is a large-scale public glioma dataset provided by the International Society for Medical Image Computing and Computer-Aided Intervention (MICCAI). A total of 2040 patients’ MRI images were collected in this dataset, divided into two categories: High-risk and low-risk. For better processing, we transformed the image into 256 × 256 png format data by slice processing and normalization. The MRI data of 1251 non-participants were used for image classification, which was split into training sets (876 cases), validation sets (250 cases), and test sets (125 cases) according to the ratio of 7:2:1.
Atlas navigator neoplastic clinical whole brain (AANLIB) [25] is a publicly available dataset provided by Harvard University, which covers data from neuroanatomy-related studies. The glioma images of 216 patients were collected using this data and divided into high-risk and low-risk categories. We preprocessed the dataset by rotation and inversion while transforming the images to 256 × 256. The available data from 432 preprocessed cases were used for image classification, which was split into training sets (302 cases), validation sets (86 cases), and test sets (44 cases) according to the ratio of 7:2:1.
International Students Innovation Competition 2018 (ISIC2018) [26] is a large-scale public skin pathology dataset provided by the International Society for MICCAI. The dataset contains a total of 12,500 chapters of images divided into seven categories. We selected two categories: Melanoma and benign keratosis. Convert the image to 256 × 256 png format data. In this study, 2112 image data were used to verify the generalization.
4.2 Experimental Details and Evaluation Indexes
All experiments were conducted using PyTorch on a Windows workstation installed with an Intel®Core™i9-10900X CPU and an NVIDIA Geforce GTX Titan A100 GPU. The network model is implemented based on the PyTorch framework, Torch version 1.10.2, cuda version 11.3. AdamW optimizer was used for training, Adam parameters
where,
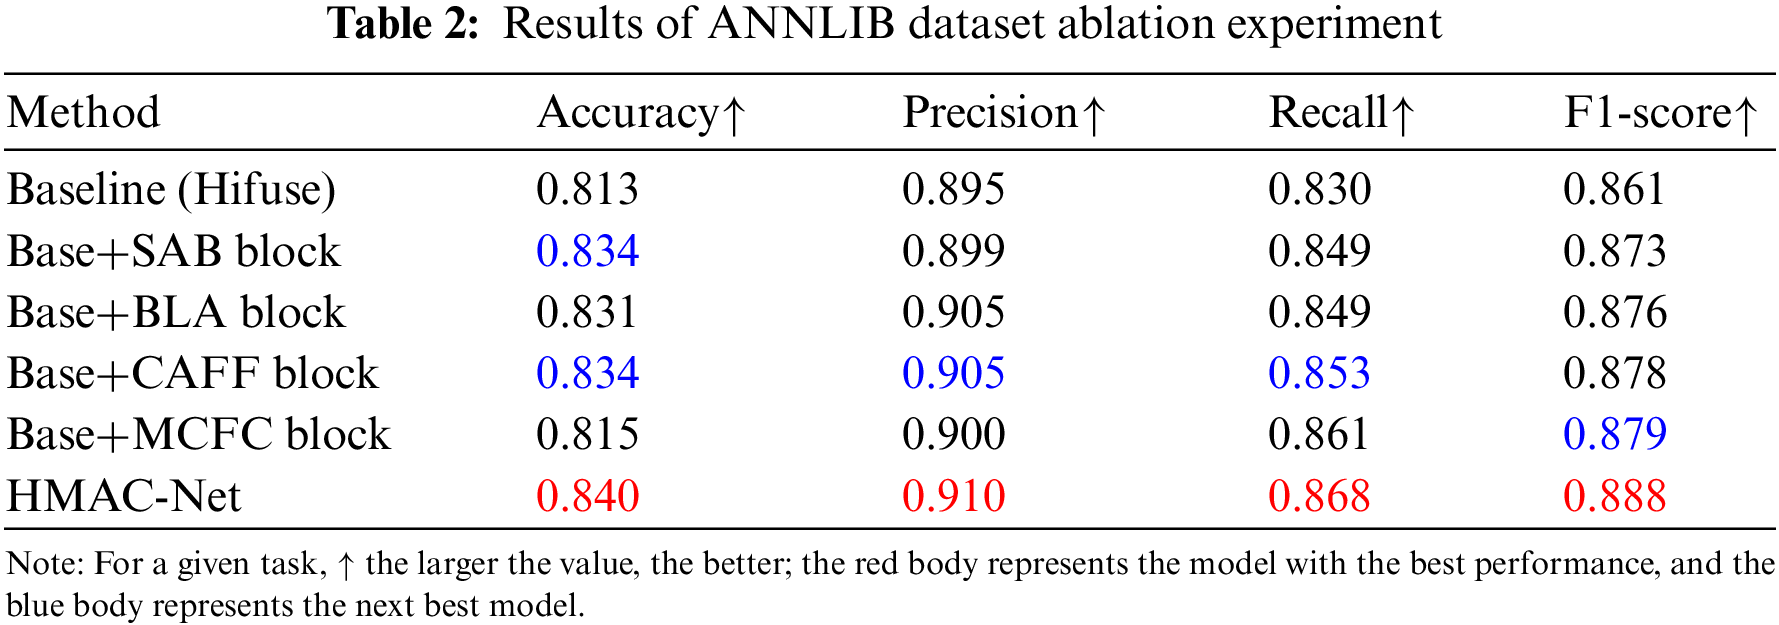
To study the effects of the SAB, BLA, CAFF, and MCFC blocks on the performance of the HMAC-Net model designed in this paper, ablation experiments were conducted on BraTs2021 and ANNLIB datasets, respectively.
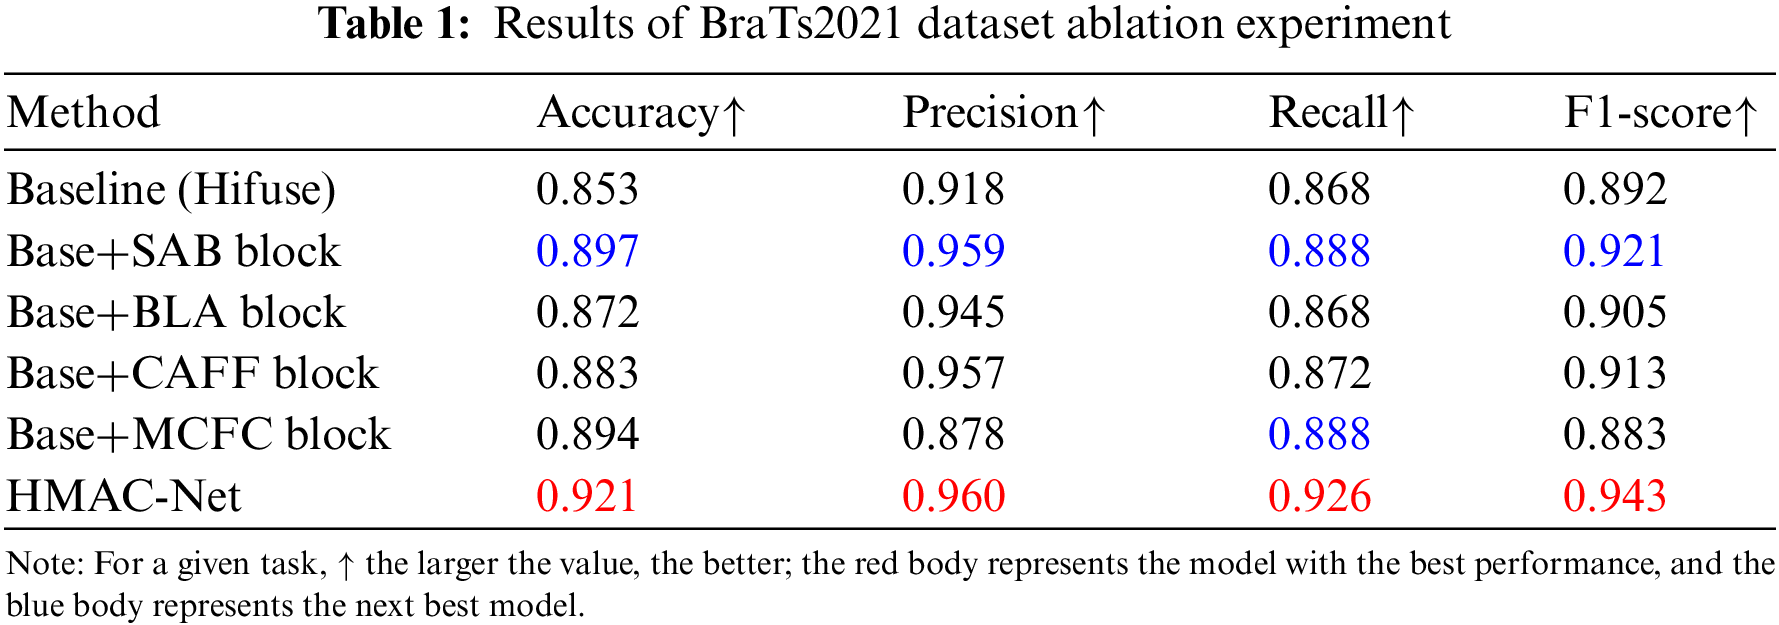
As shown in Table 1, the impact of each block on the model was evaluated on the BraTs2021 dataset. SAB, BLA, CAFF, and MCFC blocks are added to form the HMAC-Net model. After adding the SAB block, the accuracy, precision, recall, and F1-score improved by 4.4%, 4.1%, 2.0%, and 2.9%, respectively, indicating that the SAB block improved the overall performance of the network while reducing information redundancy. After adding the BLA block, the above four indicators increased by 1.9%, 2.7%, 0.0%, and 1.3%, respectively, and the accuracy of the BLA block was higher than that of the baseline model for high-risk and low-risk patients with brain glioma. After adding the CAFF block, the four indexes increased by 3.0%, 3.9%, 0.4%, and 2.1% successively, which indicates that the CAFF block can effectively integrate global features and local features of different scales to achieve accurate improvement of network classification effect. After adding the MCFC block, the accuracy and recall are significantly improved. However, the accuracy and F1-score are decreased, mainly because the effect of the iteration of the MCFC block depends on the feature extraction of other blocks, and the addition of the MCFC block alone will lead to the decline of indicators. The final HMAC-Net model combined with four blocks improved the accuracy, precision, recall, and F1-score by 6.8%, 4.2%, 5.8%, and 5.1%, respectively. The results show that HMAC-Net can effectively improve the classification of high-risk and low-risk glioma patients and prevent the missed detection and misdiagnosis of lesions.
To further illustrate that the HMAC-Net model can effectively capture the feature information of the region of interest in medical images, the last layer, other than the linear layer, is visualized and will be rendered as a heat map in the model. Fig. 8 shows the glioma heat map of the BraTs2021 dataset. The area closer to red is the area of more significant concern obtained by the experiment, and it can be verified whether it is the region of interest.

Figure 8: Visualization results of ablation experiments
As can be seen from Fig. 8, the color region of the heat map of the SAB block is more concentrated near the tumor, and it presents a better effect than the baseline model, which further verifies that it can effectively reduce information redundancy and improve the network effect. The heat map of the BLA block has less color in the non-tumor area. It is more excellent in tone, which is more concentrated near the tumor, and the visualized results are more concentrated compared to the baseline model. The CAFF block further pinpoints the location of the tumor. Although the quantitative analysis results of the MCFC block are relatively reduced, the visual results show that the block can focus well on the target area near the tumor. The HMAC-Net model integrated with four blocks reflected a higher heat value of the lesion area and covered the lesion area more accurately. The qualitative results of these visualizations show that HMAC-Net can better integrate global-local features at different levels, helping the model to identify more key features and thus focus more on diseased areas of the brain tumor.
According to the results of qualitative and quantitative analysis of ablation experiments, the SAB block, BLA block, CAFF block, and MCFC block can improve the network performance compared with the baseline model, but there are still some differences. For example, the SAB block can concentrate the information related to the target task near the tumor. However, it still contains some redundant information. The combination of the four blocks can realize the extraction and fusion of global features and local features and, in the iterative process, constrain the expansion of redundant information, improve the overall performance of the network, and effectively prevent the occurrence of misclassification and missing detection.
To further verify the effectiveness of block settings, as shown in Table 2. The HMAC-Net model is still formed by adding the SAB, BLA, CAFF, and MCFC blocks on the Hifuse baseline network. After the SAB block is added, the accuracy, precision, recall, and F1-score increase by 2.1%, 0.4%, 1.9%, and 1.2%, respectively, and the accuracy rate reaches 83.4% as the second best, which indicates that SAB block can effectively improve the accuracy of classification. After adding the BLA block, the above four indicators increased by 1.8%, 1.0%, 1.9% and 1.5%, respectively. After adding the CAFF block, the four indicators were increased by 2.1%, 1.0%, 2.3%, and 1.7%, respectively, among which the accuracy, precision, and recall all reached sub-optimal. The F1-score was also very close to sub-optimal, which indicates that the CAFF block can effectively improve the classification effect. After adding the MCFC block, the four indicators increased by 0.2%, 0.5%, 3.1%, and 1.8%, respectively. Compared with the other three blocks, the improvement of the MCFC block is relatively low. The main reason for this phenomenon is that the block needs to combine the other three blocks to improve the overall effect. The four indicators of the HMAC-Net model formed by combining four blocks reached 84.0%, 91.0%, 86.8%, and 88.8%, respectively, which increased by 2.7%, 1.5%, 3.8%, and 2.7% compared with the baseline model. Unlike the results obtained in BraTs2021, the effect of the CAFF block on this dataset is better than that of the SAB block. The reason is that the storage format of the two datasets is different, and there is a specific deviation between the data distribution. However, the HMAC-Net model combined with four blocks has a better image classification effect.
To verify the performance of the proposed network, a comparison experiment was conducted with the recent advanced medical image classification methods: High-resolution network (HRNet) [27], residual multi-layer perceptron (ResMLP) [28], medical vision transformer (MedViT) [29], robust vision transformer (RVT) [30], and HiFuse.
The results on the BraTs2021 dataset after multimodal fusion are shown in Table 3, indicating that the proposed HMAC-Net model has advantages in medical image classification. Compared to HiFuse, HMAC-Net improved its accuracy, precision, recall, and F1-score by 6.8%, 4.2%, 5.8%, and 5.1%, respectively. Like HiFuse, HMAC-Net constructs a hierarchical structure to improve the feature representation ability of neural networks at different scales. The difference is that HMAC-Net adopts a sparse backtracking attention mechanism in the global feature hierarchy to retain critical information. This shows that reducing information redundancy is beneficial to improving image classification performance. Compared with the sub-optimal MedViT, HMAC-Net’s four indicators improved by 4.1%, 2.2%, 3.8% and 3.1%, respectively. Like MedViT, HMAC-Net also builds a combination of CNN and transformer. However, HMAC-Net additionally designs a multi-scale fusion of global and local features to improve the effect of image classification further.
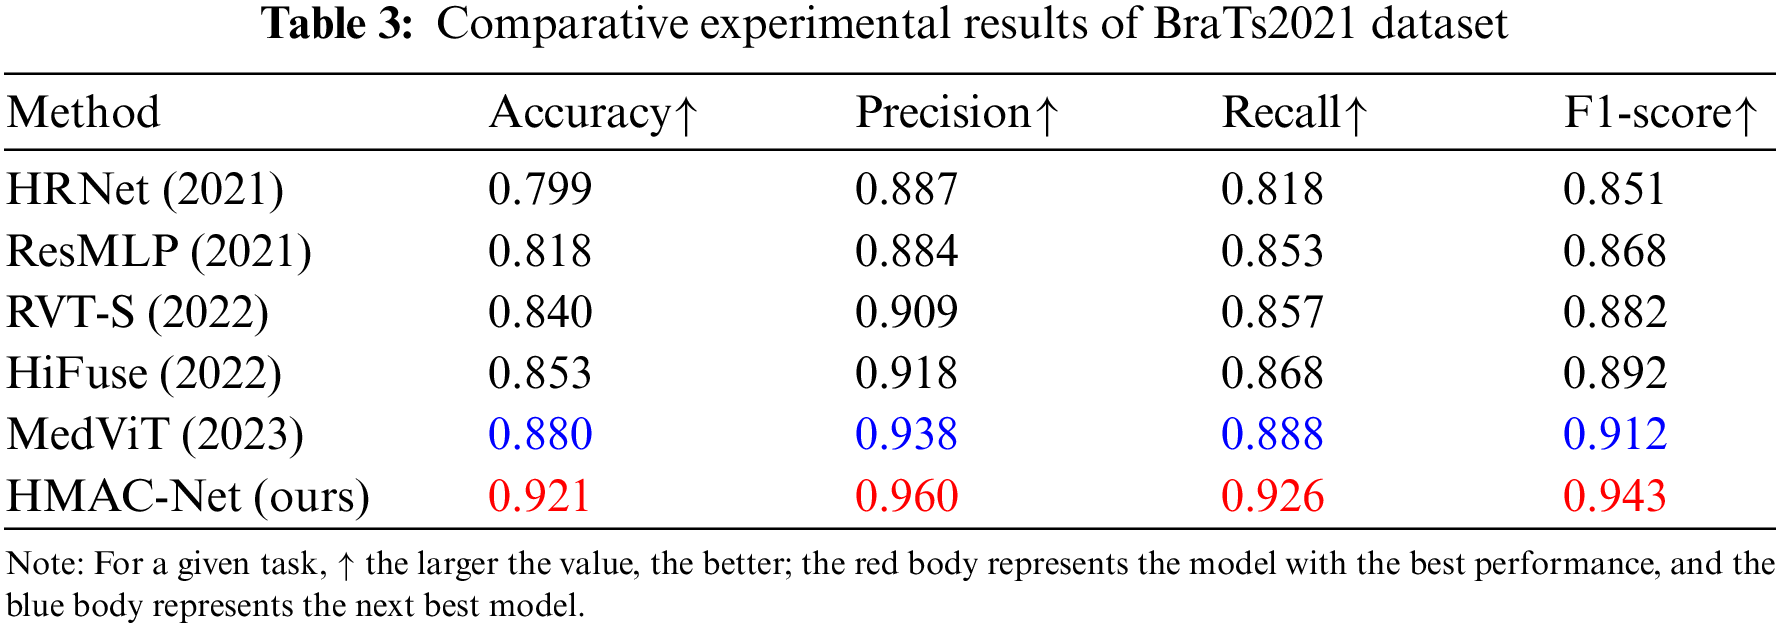
To further illustrate, the HMAC-Net model performs better than some classification algorithms. Fig. 9 shows the regions of interest for gliomas on the BraTs2021 dataset under comparison experiments. Like HRNet, HMAC-Net also sets the residual connection mode. However, the difference is that HMAC-Net is a residual connection mode used for fusion at different scales, which can improve the fusion effect of global features and local features. HRNet can also find regions of interest through heat maps but also introduces too many redundant areas. Compared with MedViT, the HMAC-Net model considers both global features and local features. The heat map shows that MedViT is closest to HMAC-Net’s region of interest. However, when considering local features, HMAC-Net considers not only local neighborhood features within the same slice but also local spatial features between adjacent slices, which improves local feature extraction capability and final classification effect to a certain extent. Unlike all comparison methods, HMAC-Net also covers iterative constraints, eliminating redundant information. Through visualization results, it is found that although there is still a tiny amount of information unrelated to tumors in the heat map, the information redundancy has reached the lowest level compared with other methods.

Figure 9: Visualization results of comparative experiments
Combined with the qualitative and quantitative analysis of the comparative experiment on the BraTs2021 dataset, it is found that the four blocks of HMAC-Net can realize information redundancy and effectively combine the advantages of CNN and transformer. Feature fusion at different scales also ensures the extraction and retention of information directly related to the target task, and the performance of the model is significantly improved through iterative classification and maximum constraint on redundant information.
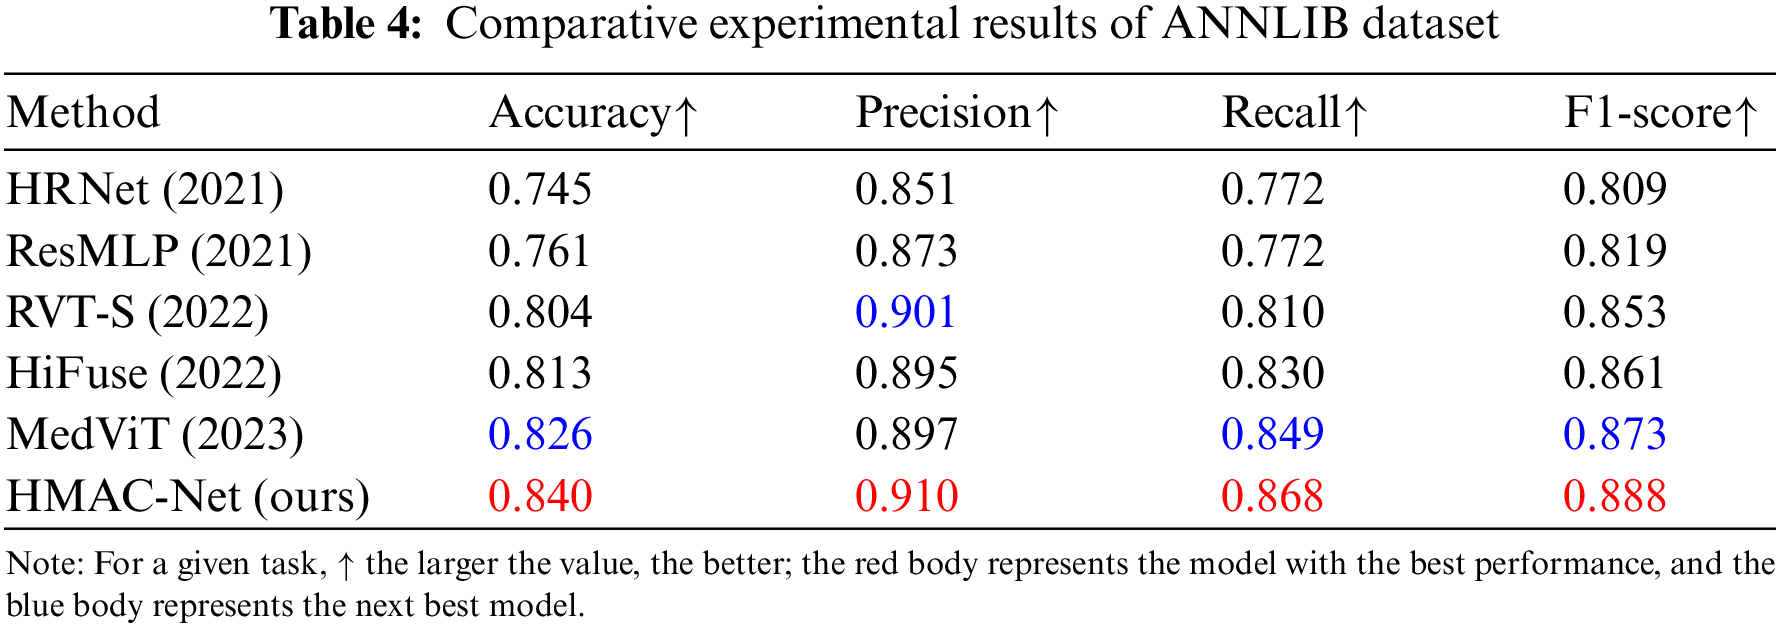
To further verify the effectiveness of the HMAC-Net algorithm, the model and some classification algorithms in the HMAC-Net were also evaluated on the ANNLIB dataset, and the quantitative results are shown in Table 4. As can be seen from the table, HMAC-Net has significant advantages in medical image classification. Like HiFuse, we build hierarchies to improve the feature representation capability of neural networks at different scales. However, compared to HiFuse, the proposed network showed higher accuracy, precision, recall, and F1-score. The network combined with HiFuse will find that the fusion of shallow and deep features is more conducive to improving the model effect. At the same time, reducing information redundancy can enhance the impact of classification and extract global features. Compared with MedViT, the four indexes are improved by 1.4%, 1.3%, 1.9%, and 1.5%, respectively, further verifying the overall performance advantage of HMAC-Net algorithm classification.
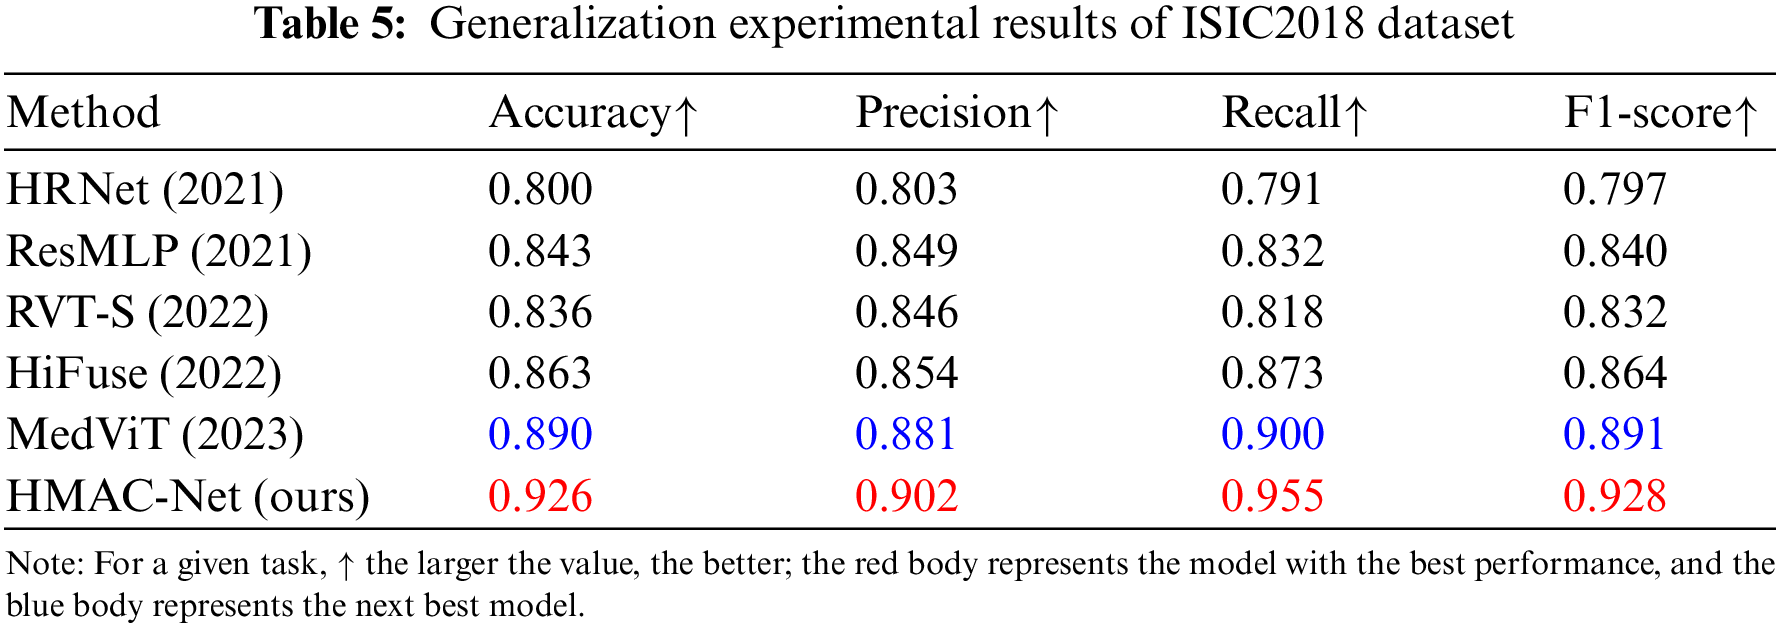
To verify the generalization ability of the proposed algorithm, an image category dataset that is significantly different from brain tumor MRI is selected in this section, namely, the ISIC2018 skin tumor dataset, which is a white light skin image with different image types and formats from BraTs2021. Table 5 shows the generalization results of the proposed HMAC-Net model and the new classification algorithm on the ISIC2018 skin tumor dataset. As can be seen from the table, HMAC-Net has significant advantages in medical image classification. Compared with the comparison algorithm, the accuracy, precision, recall and F1-score of HMAC-Net are significantly improved. The classification accuracy of HMAC-Net for skin tumors reached 92.6%, and the overall classification performance was the best. The recall reached 95.5%, and the tumor detection rate was the highest, effectively preventing the occurrence of a missing detection rate. The classification results further verify that the proposed model has good generalization ability.
The pre-experiment accuracy curve was drawn, as shown in Fig. 10. It is found that the accuracy of HMAC-Net improves significantly when the Epoch is about 15. The accuracy curve tends to flatten out when the Epoch is close to 50. In the curve where the accuracy changes with the Epoch, the accuracy of HMAC-Net is always higher than that of the comparison algorithm.

Figure 10: Accuracy curve. The abscissa is the number of epochs, and the ordinate is the accuracy rate
We also draw the training loss curve of the pre-experiment and find that the training loss of HMAC-Net decreases rapidly when the Epoch is about 10, and the loss function curve tends to flatten when the Epoch is close to 50. In the curve where the loss function changes with the Epoch, HMAC-Net converges the fastest. Combined with the results of Figs. 10 and 11, Epoch 50 is selected for the formal experiment.

Figure 11: Loss curve. The abscissa is the number of epochs, and the ordinate is the loss function value
Compared with CNN, transformer has the feature of global feature extraction, which can excavate the long dependency relationship between pixels and has more critical generalization ability. Many experiments show that local spatial features are equally important in medical image processing. Based on the above problems, this paper combines CNN and transformer to design a multi-level and multi-scale attention feature fusion medical image classification network. The multi-scale feature fusion is realized through the global feature extraction level, local feature extraction level, and feature fusion level, and the classification of medical images is further realized. In the classification task based on the BraTs2021 dataset, the accuracy, precision, recall, and F1-score four indexes improved by 6.8%, 4.2%, 5.8%, and 5.1%, respectively, and all indexes reached the optimal level. In the classification task of the ANNLIB dataset, this method improves by 2.7%, 1.5%, 3.8%, and 2.7%, respectively, in the above four indicators, and all indicators reach the optimal level. In the generalization task based on the ISIC2018 dataset, the method improved by 3.6%, 2.1%, 5.5%, and 3.8% on the four indicators, respectively, and all indicators improved significantly. The ablation experiment, comparison experiment, and generalization experiment further verified the effectiveness of the SAB block, BLA block, CAFF block, and MCFC block and the whole model’s learning ability and generalization ability.
At the same time, through thermal map visualization analysis, it is found that the SAB block proposed in this paper balances information redundancy and classification results in global feature extraction, the BLA block strengthens inter-sequence feature extraction in local feature extraction, the CAFF block effectively fuses information at different scales, and MCFC block has constrained information redundancy. Centralize information relevant to the target task and improve the effectiveness of classification.
Although the models proposed in this chapter focus on medical image classification tasks, the ideas adopted can provide researchers with new ideas for the fusion of global and local features. The proposed model can be further refined in future research: According to the specific situation of the task, combined with information entropy, the shallow and deep features of different stages are fused to make the network lighter. Construct sparse attention mechanisms of different scales to find a balance between preserving essential information and enhancing network effects.
This paper proposes a multi-level and multi-scale fusion classification model HMAC-Net. The modular design has rich scalability and linear computational complexity. In HMAC-Net, the global feature layer realizes the extraction of global features, the local feature layer realizes the extraction of local features, and the fusion feature layer fuses global features and local features at different scales and further optimizes the classification results through iterative classification blocks. The algorithm can mine shallow, deep, international, and local information well. Experiments show that the proposed method achieves robustness and validates the model’s effectiveness on two medical image datasets. The generalization of the model is verified on another dataset.
Acknowledgement: Thanks to the authors of this article for their contributions to this article. Thanks to Professor Li Yang for his help in the process of revising the paper.
Funding Statement: Major Program of National Natural Science Foundation of China (NSFC12292980, NSFC12292984); National Key R&D Program of China (2023YFA1009000, 2023YFA1009004, 2020YFA0712203, 2020YFA0712201); Major Program of National Natural Science Foundation of China (NSFC12031016); Beijing Natural Science Foundation (BNSFZ210003); Department of Science, Technology and Information of the Ministry of Education (8091B042240).
Author Contributions: Study conception and design: Y. Zhou, J. Yin; data collection: S. Liu; analysis and interpretation of results: Y. Zhou, X. Yang; draft manuscript preparation: Y. Zhou, X. Yang. All authors reviewed the results and approved the final version of the manuscript.
Availability of Data and Materials: The publicly available data used in this study can be downloaded at the following link. BraTs2021: https://www.kaggle.com/datasets/dschettler8845/brats-2021-task1. ANNLIB: https://www.med.harvard.edu/AANLIB/home.html. ISIC2018: https://www.kaggle.com/datasets/tschandl/isic2018-challenge-task1-data-segmentation.
Conflicts of Interest: The authors declare that they have no conflicts of interest to report regarding the present study.
References
1. D. Xiao et al., “National brain tumour registry of China (NBTRC) statistical report of primary brain tumours diagnosed in China in years 2019–2020,” Lancet Reg. Health-West. Pac., vol. 34, no. 10, pp. 713–715, May. 2023. doi: 10.1016/j.lanwpc.2023.100715. [Google Scholar] [PubMed] [CrossRef]
2. L. L. Dang and R. Liu, “To analyze the diagnosis of white matter lesions in patients with cerebral small vessel disease based on MRI automatic image segmentation algorithm,” (in ChineseChinese J. CT MRI, vol. 21, no. 9, pp. 31–32, Sep. 2023. doi: 10.3969/j.issn.1672-5131.2023.09.011. [Google Scholar] [CrossRef]
3. H. Zhong, “To compare the application of different contrast injection methods in head and neck CT angiography,” (in ChineseChinese For. Med. Res., vol. 19, no. 34, pp. 96–99, Jan. 2022. doi: 10.14033/j.cnki.cfmr.2021.34.026 [Google Scholar] [CrossRef]
4. J. Huang and Y. B. Ding, “Application of MR susceptibility weighted imaging in brain diseases,” World Latest Med. Inform., vol. 2020, no. 6, pp. 2, Apr. 2020. doi: 10.3969/j.issn.1671-3141.2020.06.098. [Google Scholar] [CrossRef]
5. M. Y. Su and Z. P. Zhou, “Application progress of T2WI-FLAIR enhanced sequence in the diagnosis of brain diseases,” (in ChineseGuangdong Med., vol. 42, no. 6, pp. 490–493, Jun. 2020. doi: 10.13820/j.cnki.gdyx.20202100. [Google Scholar] [CrossRef]
6. L. Deng and Y. Dong, “Deep learning: Methods and applications,” Found. Trends Signal Process., vol. 7, no. 3, pp. 197–387, Jan. 2013. doi: 10.1561/2000000039 [Google Scholar] [CrossRef]
7. S. Vidhya, M. Balaji, and V. Kamaraj, “Satellite image classification using CNN with particle swarm optimization classifier,” Procedia Comput. Sci., vol. 233, no. 3, pp. 979–987, Apr. 2024. doi: 10.1016/j.procs.2024.03.287. [Google Scholar] [CrossRef]
8. Y. H. Qing, W. Y. Liu, L. Y. Feng, and W. J. Gao, “Improved transformer net for hyperspectral image classification,” Remote Sens., vol. 13, no. 11, pp. 16–22, Jun. 2021. doi: 10.3390/rs13112216 [Google Scholar] [CrossRef]
9. A. Krizhevsky, I. Sutskever, and G. Hinton, “ImageNet classification with deep convolutional neural networks,” in Advances in Neural Information Processing Systems, Jan. 2012. [Google Scholar]
10. C. Szegedy et al., “Going deeper with convolutions,” in 2015 IEEE Conf. Comput. Vis. Pattern Recog., Boston, USA, 2015, pp. 1–9. [Google Scholar]
11. K. Simonyan and A. Zisserman, “Very deep convolutional networks for large-scale image recognition,” in Int. Conf. Learn. Rep., London, USA, 2015, pp. 10–18. [Google Scholar]
12. K. M. He, X. Y. Zhang, S. Q. Ren, and J. Sun, “Spatial pyramid pooling in deep convolutional networks for visual recognition,” IEEE Trans. Pattern Anal. Mach. Intell., vol. 37, no. 9, pp. 1904–1916, Jan. 2015. doi: 10.1109/TPAMI.2015.2389824. [Google Scholar] [PubMed] [CrossRef]
13. N. Nagarani, R. karthick, M. Sandra Carmel Sophia, and M. Binda, “Self-attention based progressive generative adversarial network optimized with momentum search optimization algorithm for classification of brain tumor on MRI image,” Biomed Signal Proces, vol. 88, no. 64, pp. 105–117, Feb. 2024. doi: 10.1016/j.bspc.2023.105597. [Google Scholar] [CrossRef]
14. S. S. Waghere and J. P. Shinde, “A robust classification of brain tumor disease in MRI using twin-attention based dense convolutional auto-encoder,” Biomed Signal Proces., vol. 92, no. 10, pp. 88–106, Jun. 2024. doi: 10.1016/j.bspc.2024.106088 [Google Scholar] [CrossRef]
15. S. Tabatabaei, K. Rezaee, and M. Zhu, “Attention transformer mechanism and fusion-based deep learning architecture for MRI brain tumor classification system,” Biomed. Signal Process., vol. 86, no. 1, pp. 105–119, Sep. 2023. doi: 10.1016/j.bspc.2023.105119 [Google Scholar] [CrossRef]
16. S. L. Liu, L. J. Wang, and W. W. Yue, “An efficient medical image classification network based on multi-branch CNN, token grouping transformer and mixer MLP,” Appl. Soft Comput., vol. 153, no. 10, pp. 10–16, Feb. 2024. doi: 10.1016/j.asoc.2024.111323. [Google Scholar] [CrossRef]
17. X. Wu et al., “CTransCNN: Combining transformer and CNN in multilabel medical image classification,” Knowl.-Based Syst., vol. 281, no. 111, pp. 10–16, Oct. 2023. doi: 10.1016/j.kn.osys.2023.111030 [Google Scholar] [CrossRef]
18. X. G. Yan, F. Shao, H. W. Chen, and Q. P. Jiang, “Hybrid CNN-transformer based meta-learning approach for personalized image aesthetics assessment,” J. Vis. Commun. Image R., vol. 98, pp. 104044, Feb. 2024. doi: 10.1016/j.jvcir.2023.104044. [Google Scholar] [CrossRef]
19. X. Z. Huo et al., “HiFuse: Hierarchical multi-scale feature fusion network for medical image classification,” Biomed. Signal Process., vol. 87, pp. 105534, 2024. doi: 10.1016/j.bspc.2023.105534. [Google Scholar] [CrossRef]
20. E. Ciaramelli, C. L. Grady, and M. Moscovitch, “Top-down and bottom-up attention to memory: A hypothesis (AtoM) on the role of the posterior parietal cortex in memory retrieval,” Neuropsychol., vol. 46, no. 7, pp. 1828–1851, Mar. 2008. doi: 10.1016/j.neuropsychologia.2008.03.022 [Google Scholar] [CrossRef]
21. N. R. Ke et al., “Sparse attentive backtracking: Temporal credit assignment through reminding,” in 32nd Conf. Neural Inf. Process. Syst., Montreal, Canada, Nov. 22–26, 2018. [Google Scholar]
22. T. Yu, G. Zhao, P. Li, and Y. Yu, “BOAT: Bilateral local attention vision transformer,” in Brit. Mach. Vis. Conf., Macau, China, Dec. 4–8, 2022. [Google Scholar]
23. Z. Liu et al., “Swin transformer: Hierarchical vision transformer using shifted windows,” in 2021 IEEE Int. Conf. Comput. Vis., Montreal, QC, Canada, 2021, pp. 9992–10002. [Google Scholar]
24. B. H. Menzey et al., “The multimodal brain tumor image segmentation benchmark (BRATS),” IEEE Trans. Med. Imaging., vol. 34, no. 10, pp. 1993–2024, Oct. 2014. doi: 10.1109/TMI.2014.2377694. [Google Scholar] [PubMed] [CrossRef]
25. D. Summers, “Harvard Whole Brain Atlas: www.med.harvard.edu/AANLIB/home.html,” J. Neurol. Neurosurg. Psychiatry, vol. 73, no. 3, pp. 288, Mar. 2003. doi: 10.1136/jnnp.74.3.288. [Google Scholar] [CrossRef]
26. N. Codella et al., “Skin lesion analysis toward melanoma detection 2018: A challenge hosted by the international skin imaging collaboration (ISIC),” in 2018 IEEE 15th Int. Symp. Biomed. Imag., Washington DC, USA, 2018, pp. 168–172. [Google Scholar]
27. J. Wang et al., “Deep high-resolution representation learning for visual recognition,” IEEE Trans. Pattern Anal., vol. 43, no. 10, pp. 3349–3364, Oct. 2021. doi: 10.1109/TPAMI.2020.2983686 [Google Scholar] [CrossRef]
28. H. Touvron et al., “ResMLP: Feedforward networks for image classification with data-efficient training,” IEEE Trans. Pattern Anal., vol. 45, no. 4, pp. 5314–5321, Apr. 2023. doi: 10.1109/TPAMI.2022.3206148 [Google Scholar] [CrossRef]
29. K. Hemalatha, V. Vetrisevi, M. Dhandapani, and A. Gladys, “Cervix fuzzy fusion for cervical cancer cell image classification,” Biomed. Signal Process., vol. 85, pp. 104920, Aug. 2023. doi: 10.1016/j.bspc.2023.104920 [Google Scholar] [CrossRef]
30. X. Mao et al., “Towards robust vision transformer,” in 2022 IEEE Conf. Comput. Vis. Pattern Recog., New Orleans, LA, USA, 2022, pp. 12032–12041. [Google Scholar]
Cite This Article
 Copyright © 2024 The Author(s). Published by Tech Science Press.
This work is licensed under a Creative Commons Attribution 4.0 International License , which permits unrestricted use, distribution, and reproduction in any medium, provided the original work is properly cited.
 Downloads
 Citation Tools