
 Submit a Paper
 Propose a Special lssue
 Open Access
ARTICLE

Multiscale Simulation of Microstructure Evolution during Preparation and Service Processes of Physical Vapor Deposited c-TiAlN Coatings
State Key Laboratory of Powder Metallurgy, Central South University, Changsha, 410083, China
* Corresponding Authors: Jing Zhong. Email: ; Lijun Zhang. Email:
(This article belongs to the Special Issue: Multiscale Computational Methods for Advanced Materials and Structures)
Computers, Materials & Continua 2024, 79(3), 3435-3453. https://doi.org/10.32604/cmc.2024.051629
Received 11 March 2024; Accepted 09 May 2024; Issue published 20 June 2024
 View Full Text
 Download PDF
Abstract
Physical Vapor Deposited (PVD) TiAlN coatings are extensively utilized as protective layers for cutting tools, renowned for their excellent comprehensive performance. To optimize quality control of TiAlN coatings for cutting tools, a multi-scale simulation approach is proposed that encompasses the microstructure evolution of coatings considering the entire preparation and service lifecycle of PVD TiAlN coatings. This scheme employs phase-field simulation to capture the essential microstructure of the PVD-prepared TiAlN coatings. Moreover, cutting simulation is used to determine the service temperature experienced during cutting processes at varying rates. Cahn-Hilliard modeling is finally utilized to consume the microstructure and service condition data to acquaint the microstructure evolution of TiAlN coatings throughout the cutting processes. This methodology effectively establishes a correlation between service temperature and its impact on the microstructure evolution of TiAlN coatings. It is expected that the present multi-scale numerical simulation approach will provide innovative strategies for assisting property design and lifespan prediction of TiAlN coatings.Keywords
PVD c-TiAlN coatings are among the most widely utilized hard metal nitride coatings, serving as protective layers for tools, molds, and machine elements, owing to their high hardness, exceptional wear resistance, thermostable performance, and oxidative stability. A hallmark of these coatings is their aging-hardening capability, stemming from the spinodal decomposition into metastable cubic(c) TiN-rich and cubic(c) AlN-rich domains at elevated temperatures [1–3]. The microstructure of these raw coatings predominantly determines the performance of PVD coatings, while performance responses under service conditions for the coatings are influenced by the observed microstructure evolution. Enhancing the service performance of coatings [4,5] necessitates a thorough understanding of the coatings’ microstructure, which is influenced by specific process parameters, and developing robust methodologies to monitor the patterns of microstructure evolution during the service process. Challenges are likely encountered in converting, merging, and transferring information across different scales because the transfer of multi-scale information is required to characterize the complete preparation and service processes, which are both time-intensive and costly.
Numerous experiment and simulation studies have been conducted to analyze the microstructure of PVD c-TiAlN coatings, as illustrated in Fig. 1. Initially, an enhanced understanding of fundamental phenomena and principles has been significantly advanced by experimental characterization techniques [6]. Various experimental methods have been employed to investigate the microstructure, including X-ray diffraction (XRD) [7], differential scanning calorimetry analysis (DSC) [8], scanning electron microscope (SEM) [9], transmission electron microscope (TEM) [10], small angle X-ray scattering (SAXS) [11] and atomic probe (APT) [12]. These techniques have provided crucial observations, such as composition distribution, crystal structure, grain size, and coating orientation, offering vital insights for designing and optimizing coatings. Generally, multiple experimental methods are necessary to completely comprehend the evolution of the microstructure of coatings during preparation and service, as the microstructure features are dynamic and polymorphic.

Figure 1: Comparative diagram of experimental research [7–12] on TiAlN coatings and simulation studies on TiAlN coatings during the preparation [13–17] and service process [18–21]
Numerical simulation is advantageous for capturing dynamic evolution results and even vivid three-dimensional visualizations. Stewart et al. [16] devised a phase-field model to simulate the changes in the microstructure of polycrystalline thin films throughout the preparation process. Their investigation explored the model parameters that control grain evolution and porosity. This model was subsequently adopted by Yang et al. [14] and successfully applied to establish a correlation between model parameters and deposition rate, thereby analyzing the impact of deposition rate on the surface roughness and microstructure of the metal thin films. Dai et al. [13] employed a series of phase-field simulations for TiN coatings to establish relationships between process parameters and model parameters, enabling the identification of optimal processing parameter windows.
Beyond the processing process, simulation efforts also extend to studying the microstructure of PVD TiAlN coatings under thermal treatment. Mayrhofer et al. [2] created a kinetic model to describe the decomposition process of Ti1-xAlxN coatings, supplemented by Ab initio calculations. Zhou et al. [18,22] constructed the phase diagram of metastable pseudo-binary system c–TiN/c-AlN of Ti1-xAlxN coatings. Additionally, based on quantitative phase-field simulation results, the influence of composition fluctuation on the microstructure of TiAlN coatings was analyzed. More recently, Zhang et al. [20] established an automated framework driven by Pareto optimization for quantitative Cahn-Hilliard simulations of spinodal decomposition and succeeded in fine-tuning model parameters to obtain quantitative simulation results for Ti1-xAlxN coatings. These studies demonstrate the feasibility of achieving quantitative numerical simulations of microstructure evolution under static service conditions. However, it is important to note that these studies do not provide temperature response information during the service process. In this context, the work of Afrasiabi et al. [23] and other modeling and simulation efforts targeting cutting processes can provide valuable temperature data during the service process.
This work introduces a multi-scale simulation framework for PVD c-TiAlN coatings that offers a quantitative description of microstructure evolution throughout the entire preparation and service processes. For the PVD process, we integrate a phase-field model and strive to achieve quantitative simulation by aligning simulated microstructure features with experimental observations. For the cutting service process, the thermo-mechanically coupled modeling strategy developed by Afrasiabi et al. [23] is employed to simulate the temperature response during the cutting process. The microstructure evolution of the spinodal decomposition process is then simulated using Cahn-Hilliard modeling based on the temperature response data. For clarity, the models used are introduced in Section 2, with detailed explanations of governing equations and implementation. The strategy for coupling multi-scale simulations is outlined in Section 3.1. Results from various simulation models are presented in the remainder of Section 3, accompanied by a discussion that includes the introduction of different simulation and validation results. The conclusions are presented in Section 4.
2.1 Modeling of Physical Vapor Deposition Process
The phase-field model of interface growth has the potential to describe the kinetics behavior and microstructure evolution during the thin-film growth in the PVD process of TiAlN films. Utilizing this model enables the effective identification and analysis of critical physical processes occurring during the preparation process of coatings, including (1) formation of random surface structure, (2) surface tensile and diffusion phenomena, and (3) non-local shadowing effects. Two field variables, i.e.,
Eq. (1) includes the first two terms that depict a double-well potential, symbolizing the solid and vapor phases in bulk, and the third term that addresses the energy contribution from the solid-vapor interface, with
where Eq. (2) demonstrates the film growth process, while Eq. (3) addresses the transportation of incident vapor. In Eq. (2), the first element represents the Cahn-Hilliard evolution expression, which facilitates the formation of arbitrary surfaces and captures the diffusion phenomenon. The second element combines Eq. (2) and Eq. (3), resulting in the film growth at the cost of consuming the incident vapor phase.
Additionally, surface fluctuations, denoted as
2.2 Modeling of Cutting Process
Modeling the cutting process, which facilitates a broad spectrum of metalworking operations, is crucial for achieving efficient and precise manufacturing and plays a significant role in optimizing the cutting process. Numerical models can be utilized to evaluate process variables that are difficult to measure experimentally in the metal-cutting process. Consequently, the corresponding imitated results can provide a more comprehensive understanding of cutting temperature, tool geometries, and other factors. Additionally, the derived information, such as temperature variations, can be conveyed to subsequent simulation models to examine more complex physical processes in depth. This work focuses on the simple cutting process by simplifying the process to an orthogonal cutting scenario. However, it is crucial to retain essential factors of the cutting process to accurately represent the service conditions of cutting tools and their coatings.
The mathematical description of cutting processes primarily involves the equilibrium condition of continuum mechanics and its corresponding boundary conditions. Simultaneously, the Fourier heat equation is specified with its boundary conditions. To describe plastic deformation, the constitutive equations utilizing a flow rule and a hardening law are employed, whereas elastic deformation is governed by Hooke’s law. As a consequence, it is necessary to solve a set of equations simultaneously to establish a thermo-mechanically coupled model. The three conservation laws of mass, momentum, and energy for solid mechanics are encapsulated within the following set of equations:
The constitutive and kinematic equations are presented as Eq. (5) and Eq. (6), respectively.
where
Beyond the governing equations mentioned above, models for contact forces and the specific strategy for constitutive modeling are also necessary, although further details are aligned with the optimized Johnson-Cook material model as refined by Sima and Ozely [24].
Overall, the corresponding equations can be solved numerically with smoothed particle hydrodynamics (SPH) method or finite element method (FEM). In this work, the SPH method is preferred due to its advantages in managing mesh distortion during significant deformations, thus avoiding additional measures to ensure the stability of the numerical solution. More specifically, the implementation by Afrasiabi et al. [23] is currently adopted, and the single low-resolution model is employed due to computation efficiency.
2.3 Cahn-Hilliard Modeling for Spinodal Decomposition
The Cahn-Hilliard model, employed for decades, simulates the microstructure evolution during the spinodal decomposition process [21]. The following equation governs the evolution of the composition field:
where M represents chemical mobility, and F denotes the total free energy functional is given by
where
where
where
3.1 Coupling Strategy for Multi-Scale Simulation
TiAlN coatings are commonly used for cutting tools, with their microstructure significantly influenced by process parameters and subjected to ambient temperature and applied forces, such as friction during the cutting process. Initially, the performance of coatings is closely tied to their microstructure, including porosity, surface roughness, grain size, and other properties. These properties are predominantly determined by PVD processes. To optimize these properties, PVD process parameters must be carefully adjusted to produce dense and smooth coatings, though composition fluctuations are inevitably implanted in the prepared coatings. After that, loaded cutting tools with coatings undergo thermal and mechanical shock, which results in the microstructure evolution of corresponding base materials and the coatings of the cutting tools. Taking c-TiAlN coatings as an example, the potential formation of the w-AlN phase is considered an indicator of coating degradation [27]. Effective control over coating quality is crucial to ensuring the performance of cutting tools and enhancing the standard of the machined workpieces. To manage the quality control of TiAlN coatings effectively, a multi-scale simulation approach is proposed that addresses the microstructure evolution throughout the entire preparation and service life of PVD TiAlN coatings, as illustrated in Fig. 2. For clarity, the simulation of PVD processes and spinodal decomposition is conducted using a proprietary code developed by the current authors. Code implementation is employed to simulate cutting processes based on the work of Afrasiabi et al. [23]. Furthermore, the open-source software Paraview is used for the visualization and post-processing of the simulated microstructures.

Figure 2: Presently proposed framework for multi-scale simulation of microstructure evolution during preparation and service process in PVD c-TiAlN coatings
The preparation of TiAlN coatings primarily relies on extensive nanoscale numerical simulations and critical experimental results to characterize the initial microstructural information of deposited coatings on target tool components. The growth rate of the coatings evolves at ~1 nm per second, while the entire deposition processes lead to a coating layer of hundreds of nanometers. Initially, these processes are governed by corresponding PVD process parameters, although model parameters of PVD phase-field simulation still require direct assessment based on these process parameters. In this study, the quantification strategy proposed by Dai et al. [13] is utilized. Key experimental results are integrated to correlate the phase-field model with process parameters, thereby facilitating quantitative simulation results for PVD processes. This approach enables the screening of feasible processing windows that yield the most optimal performance properties of PVD coatings, such as deposition rate, surface roughness, and porosity, while accurately producing the corresponding microstructure.
During the cutting processes, the evolution of microstructure and temperature occurs at different scales: Nanoscale for microstructure and macroscale for temperature. Heat accumulation due to friction causes the temperature to rise rapidly. As a result of temperature fluctuations, cutting tools experience thermal shock, while the coatings on the tool surface undergo significant microstructure evolution due to elevated temperatures. Although temperature changes rapidly, notable microstructure degradation occurs only after hundreds of cutting process cycles. In this study, a thermo-mechanically coupled method is utilized to simulate the cutting process on a macroscopic scale, capturing the temperature response during the service process. Correlation between cutting rates, service temperatures, and the corresponding fluctuation degrees can be established and fed forward for microstructure evolution simulation.
Based on the cutting simulation results, the Cahn-Hilliard equation is solved to quantitatively simulate the microstructure evolution during the spinodal decomposition of TiAlN coatings. At this stage, integrating the PVD-prepared microstructure of coatings with the temperature response observed during service processes is essential. The PVD-prepared structure could be sharpened and shaped to the size Cahn-Hilliard modeling needs. Furthermore, the temperature response from cutting processes is abstracted, considering metrics such as expected values and variances of temperature. Due to limited computational resources, direct use of temperature response sequences from cutting simulations is currently avoided. Instead, the cutting simulation is presently restricted to constrained cutting feed, and the average and variance of temperature during the steady stage of cutting processes are used as input information for the simulation of spinodal decomposition.
Overall, this work provides a comprehensive framework for understanding and evaluating the entire preparation and service process of PVD TiAlN coatings. Specifically, it attempts to link service conditions with induced microstructural changes in PVD TiAlN coatings, which can be beneficial for helping the industrial design of coating materials or the tuning of corresponding processing parameters of cutting.
3.2 Phase-Field Simulation of PVD Process
The process of physical vapor deposition is influenced by several factors, including the velocity of the incident vapor, the surface diffusion of solid regions, and the interfacial gradient coefficient. To align simulation results with experimental findings, it is crucial to quantify the model parameters accurately. The parameter B, referred to as the gas-solid transition velocity in Eqs. (2) and (3), controls the transition rate between vapor and condensed coatings around the interfacial regions. The parameter C, known as the noise amplitude coefficient, introduces surface noise to facilitate the formation of surface turbulence. Parameter D, the diffusion coefficient, governs vapor diffusion near the film surfaces. Parameter A represents the incident vapor vector, which includes incident vapor and angle (i.e., A = Ar). In the current simulation, the incident vapor is directed perpendicularly to the substrate (i.e., A = A

To execute the three-dimensional simulation of the physical vapor deposition process, a planar substrate is initially established within the simulation domain, spanning the entirety of the x-y plane, with the substrate’s thickness deliberately kept to less than one-tenth of the z-axis grid point. Assuming the space above the initial substrate is a vacuum, variables

Figure 3: Microstructure and surface height evolution of TiAlN due to the 3D phase-field simulations with different deposition rates corresponding to the different incident vapor rate (A) and the vapor-solid transition velocity (B) : (a), (d) R = 0.109 nm s−1, A = −0.14 nm s−1 and B = 0.30 nm2 s−1, (b), (e) R = 0.137 nm s−1, A = −0.18 nm s−1 and B = 0.38 nm2 s−1, (c), (f) R = 0.115 nm s−1, A = −0.29 nm s−1 and B = 0.25 nm2 s−1
As illustrated in Fig. 3, deposition rates vary significantly based on the model parameters selected. Initially, the microstructure of the coatings is characterized by a dense structure with a smooth surface, appearing predominantly as small islands. As deposition time increases, the surface of the coatings develops distinct columnar features. Additionally, coatings deposited at higher deposition rates display more pronounced columnar characteristics, as detailed in Fig. 3b. The heat maps of surface height for coatings deposited at various deposition rates are depicted in Figs. 3d–3f. These heat maps are analogous to atomic force microscopy (AFM) images used in experimental analysis of surface roughness. The surface heights of TiAlN coatings initially rise over a deposition time from 10 min to 60 min, then stabilize without significant changes for durations extending from 60 min to 120 min. This stabilization occurs because the growth of the coatings reaches a stable state at 60 min. Notably, the surface heights of coatings deposited at a rate of 0.137 nm s−1 surpass those of coatings deposited at lower rates.
The relationship between model parameters and productivity (e.g., deposition rate) and properties (e.g., roughness) is established through a quantitative relationship derived from extensive simulation results. Fig. 4a displays the surface roughness (Ra) of TiAlN coatings analyzed using the phase-field simulation results under the varing incident vapor rate (A) and the vapor-solid transition velocity (B). Contours indicated by dashed lines correspond to different deposition rates. The analysis reveals a decrease in surface roughness as the incident vapor rate increases and the vapor-solid transition velocity decreases. Notably, the influence of the vapor-solid transition velocity on surface roughness is more pronounced compared to the incident vapor rate. This influence becomes particularly significant at lower incident vapor rates, where it emerges as the primary factor affecting surface roughness. The optimal conditions, yielding the lowest surface roughness, occur at the highest incident vapor rate coupled with low vapor-solid transition velocity. As the vapor-solid transition velocity rises, the vapor is rapidly consumed upon contact with the film surface, leading to the development of a thin film. This rapid consumption exacerbates the height differences between peaks and valleys on the surface, resulting in increased surface roughness due to the higher vapor collection capability at peaks. Fig. 4b presents the deposition rates calculated through phase-field simulations across various incident vapor rates and vapor-solid transition velocities. The deposition rate diminishes as both the incident vapor rate and the vapor-solid transition velocity decrease, with the highest deposition rates occurring under conditions of maximal incident vapor rate and vapor-solid transition velocity. At high incident vapor rates, the influence of the vapor-solid transition velocity on the deposition rate becomes more pronounced. Additionally, simulations indicate that identical deposition rates can be achieved with varying combinations of incident vapor rate and vapor-solid transition velocity. When maintaining a constant deposition rate, the incident vapor rate decreases as the vapor-solid transition velocity increases.
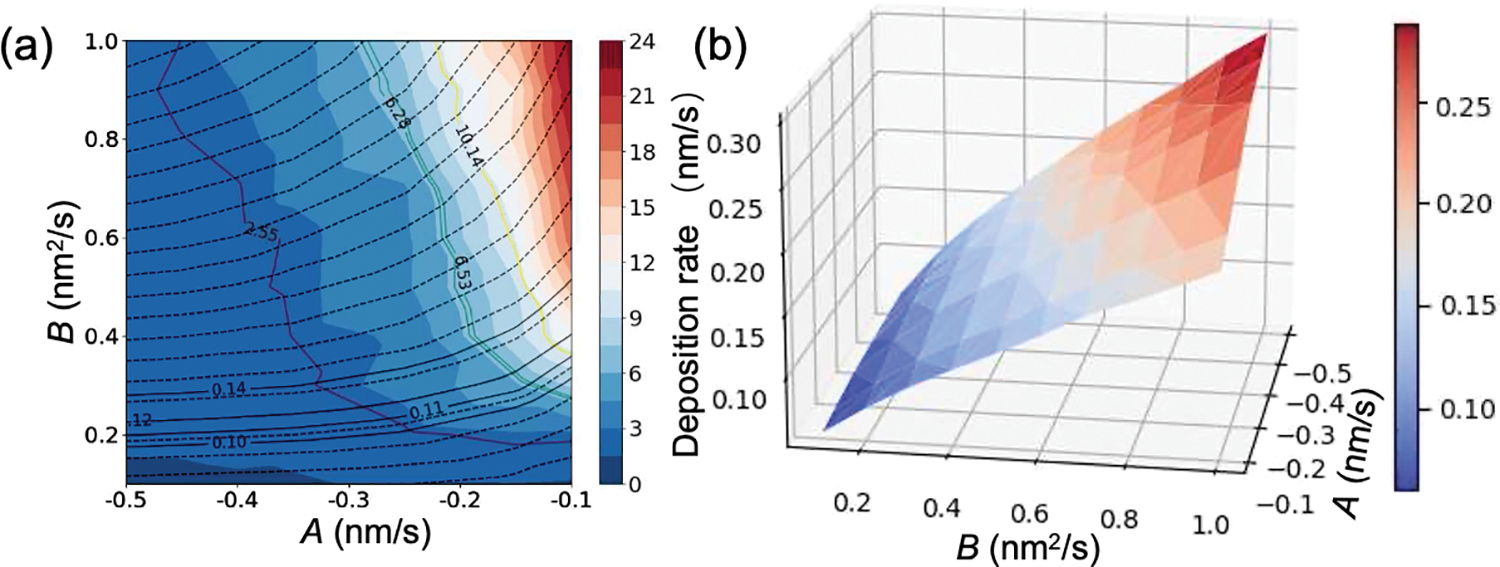
Figure 4: (a) Calculated roughness (Ra) and deposition rates of TiAlN coatings based on the phase-field simulation results with incident vapor rate (A) and the vapor-solid transition velocity (B). (b) 3D surface graph of deposition rate
In order to establish the relationship between model parameters and process parameters, our phase-field simulation results have been rigorously compared with the experimental investigations conducted by Elmkhah et al. [28]. This comparison enables the establishment of a relationship between phase-field simulation outcomes and experimental data on deposition rates for TiAlN coatings, as depicted in Fig. 5a. The bias voltage holds a pivotal position in affecting the intensity of ion bombardment on the substrate surface, which in turn significantly influences the microstructure and properties of the TiAlN coatings. The deposition rate of the coatings is initially increased by an elevation in bias voltage, attributed to the enhanced attraction of sputtered ions toward the substrate, leading to an increased incident vapor rate. However, as the bias voltage continues to rise, a re-sputtering effect occurs, accompanied by a decrease in the vapor-solid transition velocity, which results in a reduced deposition rate. These insights are derived from a combination of experimental results and extensive phase-field simulations, allowing for a precise comparison of deposition rates aligned with experimental process parameters. This comparison has enabled the accurate determination of model parameters that describe the deposition rate under varying bias voltages. Specifically, at a bias voltage of –50 V, the model parameters A and B are determined to be −0.29 nm s−1 and 0.25 nm2 s−1, respectively, the incident vapor rate (A) and the vapor-solid transition velocity (B) are measured as −0.18 nm s−1 and 0.38 nm2 s−1 respectively when the bias voltage is set as −100 V; and the model parameters corresponding to a bias voltage of −150 V are A = −0.14 nm s−1 and B = 0.30 nm2 s−1.
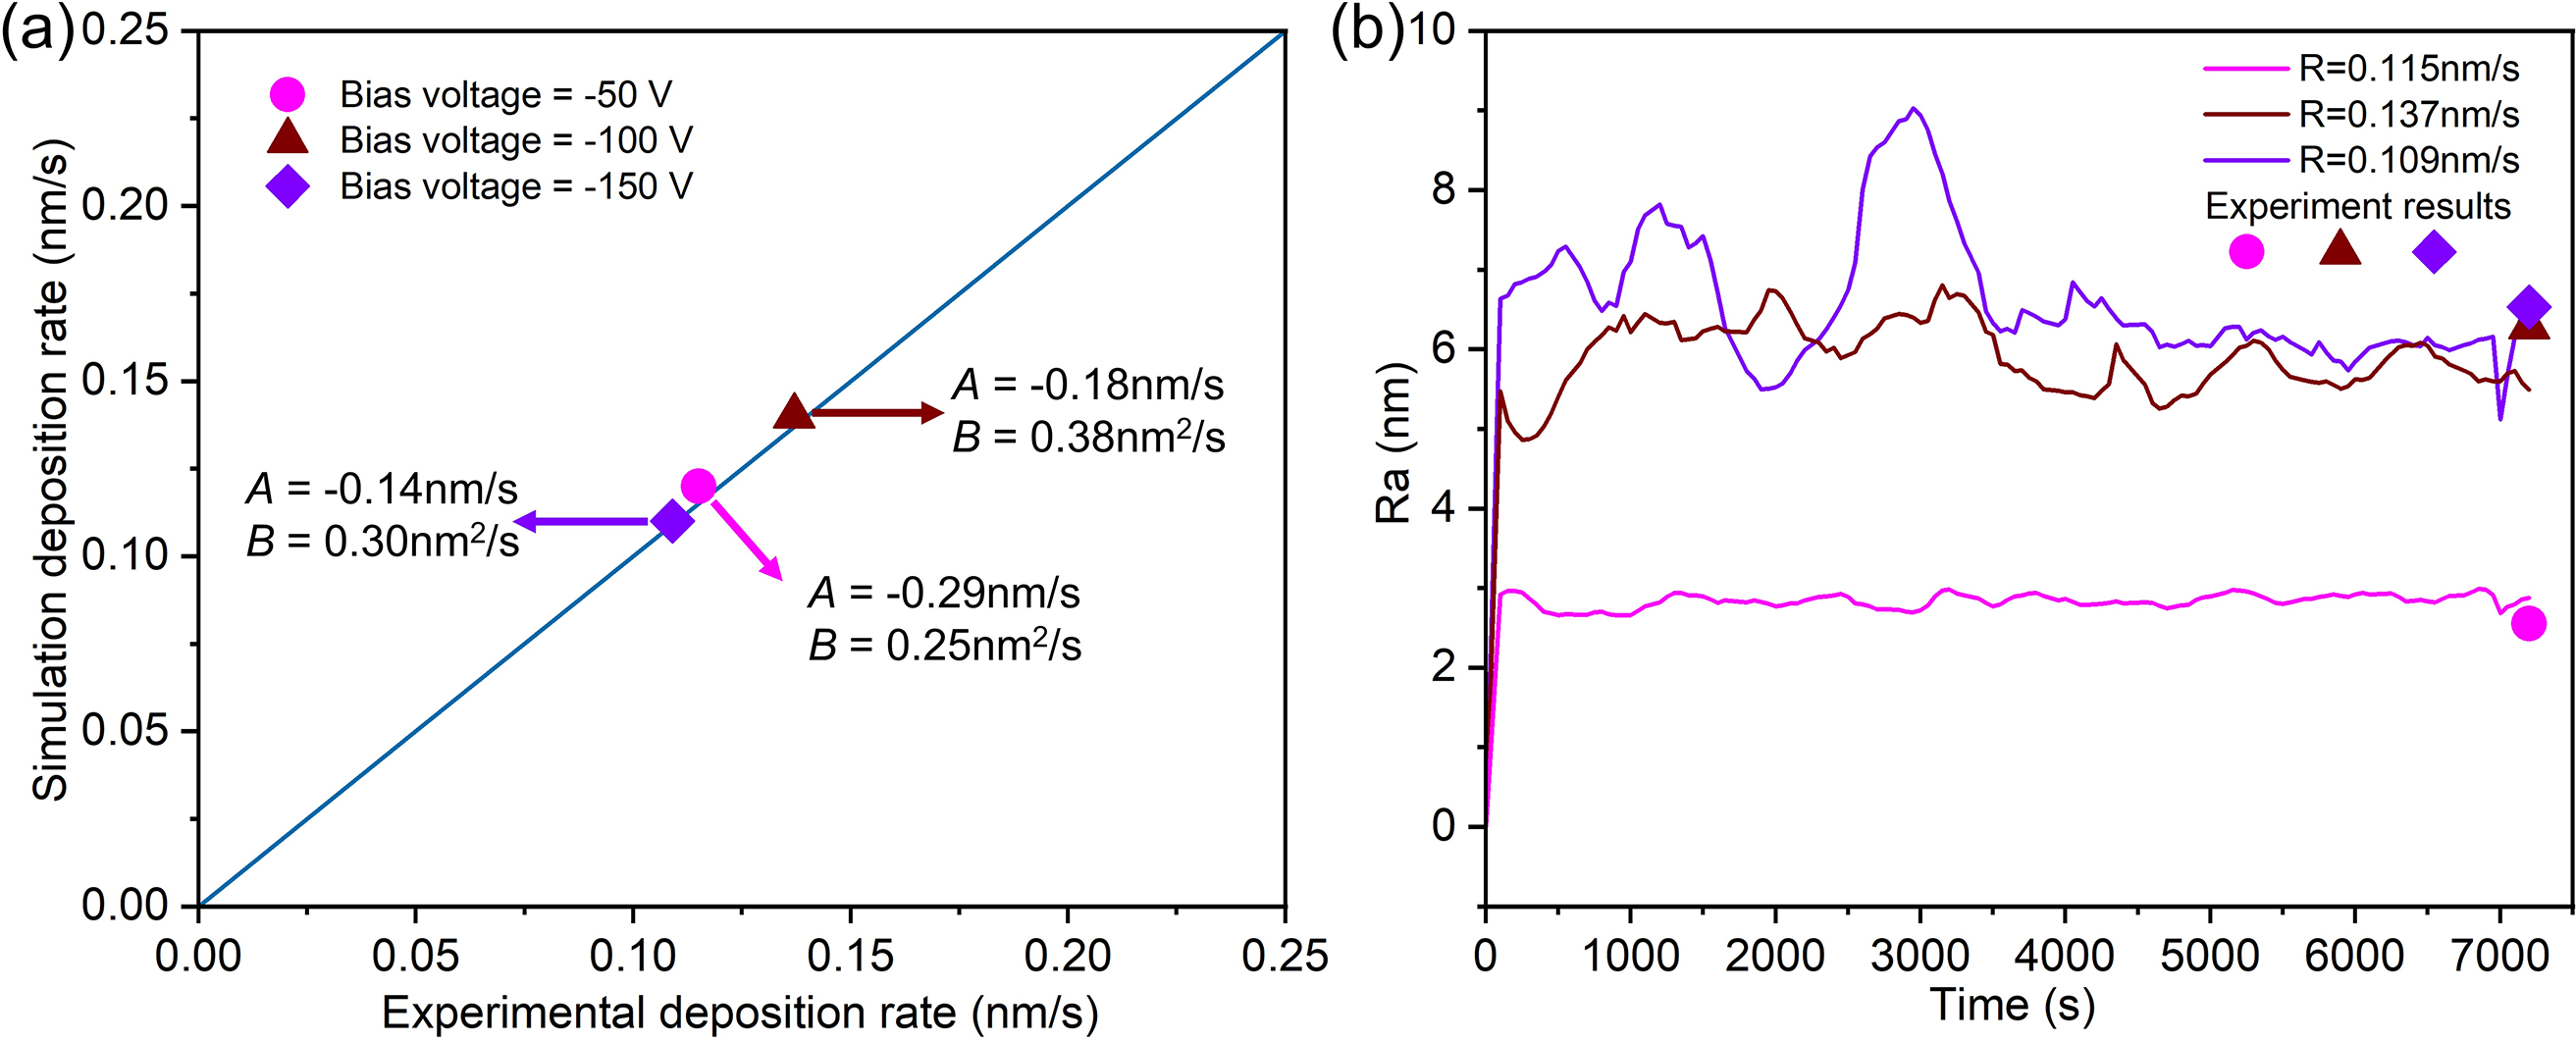
Figure 5: (a) Comparison of the deposition rate of TiAlN coatings between the simulations results during the PVD process with corresponding incident vapor rate (A) and the vapor-solid transition velocity (B) and experimental results with various voltages. (b) Comparison of the surface roughness of TiAlN coatings between the simulation results at different deposition rate and the experimental data
Moreover, it has been observed that the simulation results align closely with the experimental results, thus confirming the consistent correlation trend between the model parameters and process parameters in this study. Fig. 5b illustrates the variation in surface roughness over the deposition time of TiAlN coatings based on phase-field simulations and includes comparisons with experimental data. In the initial stages of deposition, there is a rapid increase in surface roughness. As deposition time progresses, the surface roughness tends to fluctuate within a defined range. Furthermore, with the rise of bias voltage from −50 V to −100 V, which results in an increase in the deposition rate from 0.109 nm s−1 to 0.137 nm s−1, there is a notable increase in surface roughness from 2.55 nm to 6.28 nm. This increase can be attributed to intensified ion bombardment at higher bias voltages. Additionally, the consistency of surface roughness across different bias voltages in the simulation results compared to experimental outcomes, as depicted in Fig. 5b, confirms the accurate reproduction of roughness evolution patterns. It demonstrates that the selected combination of model parameters A and B for varying bias voltages successfully reproduces the trends in deposition rates and accurately captures the corresponding surface morphology features.
3.3 Relationship between Cutting Rate and Service Temperature of Coatings
Attributed to a mismatch of scale between heat conduction and microstructure evolution, the proposed coupling strategy is regarded as one weakly correlated. Consequently, the acquisition of temperature and the simulation results of the microstructure evolution for PVD coatings are conducted in sequence. In this section, details about the acquisition of temperature responses under various operating conditions are demonstrated. For clarity, only the cutting rate is considered, with the cutting processes simplified to an orthogonal cutting scenario. The metal-cutting model and implementation utilized in this work were developed by Afrasiabi et al. [23]. A two-dimensional metal cutting simulation is conducted, featuring a fixed cutting tool and a TiAl6V4 workpiece securely fastened at its lower surface. The simulation adheres to the initial configuration detailed in the literature to validate the replicability of the proposed mesh-free solver. The target cutting length is set to be =1mm, representing 50% of the total workpiece length. Seven distinct cutting rates are respectively set to examine the variation in cutting temperature under different cutting rates, i.e.,

Cutting speed significantly influences the temperature generated at the tool-chip interface during the service process. The snapshot of temperature distribution during the cutting process at a rate of 300 m/min is depicted in Figs. 6a–6c for t = 0.07 ms, t = 0.13 ms, and t = 0.2 ms. These snapshots reveal that an increase in cutting time leads to thermal softening, which results in a serrated chip shape. Heat transfers from the shear bands to the chip during cutting, causing elevated temperatures around the shear band. Fig. 6d displays the dynamic variation of cutting temperature over time under different cutting speeds. As the cutting rate increases, the cutting temperature rises steadily. At the commencement of the cutting process (around 0 s), the temperature surges rapidly and intensifies with higher cutting rates before stabilizing and fluctuating within a narrow range.
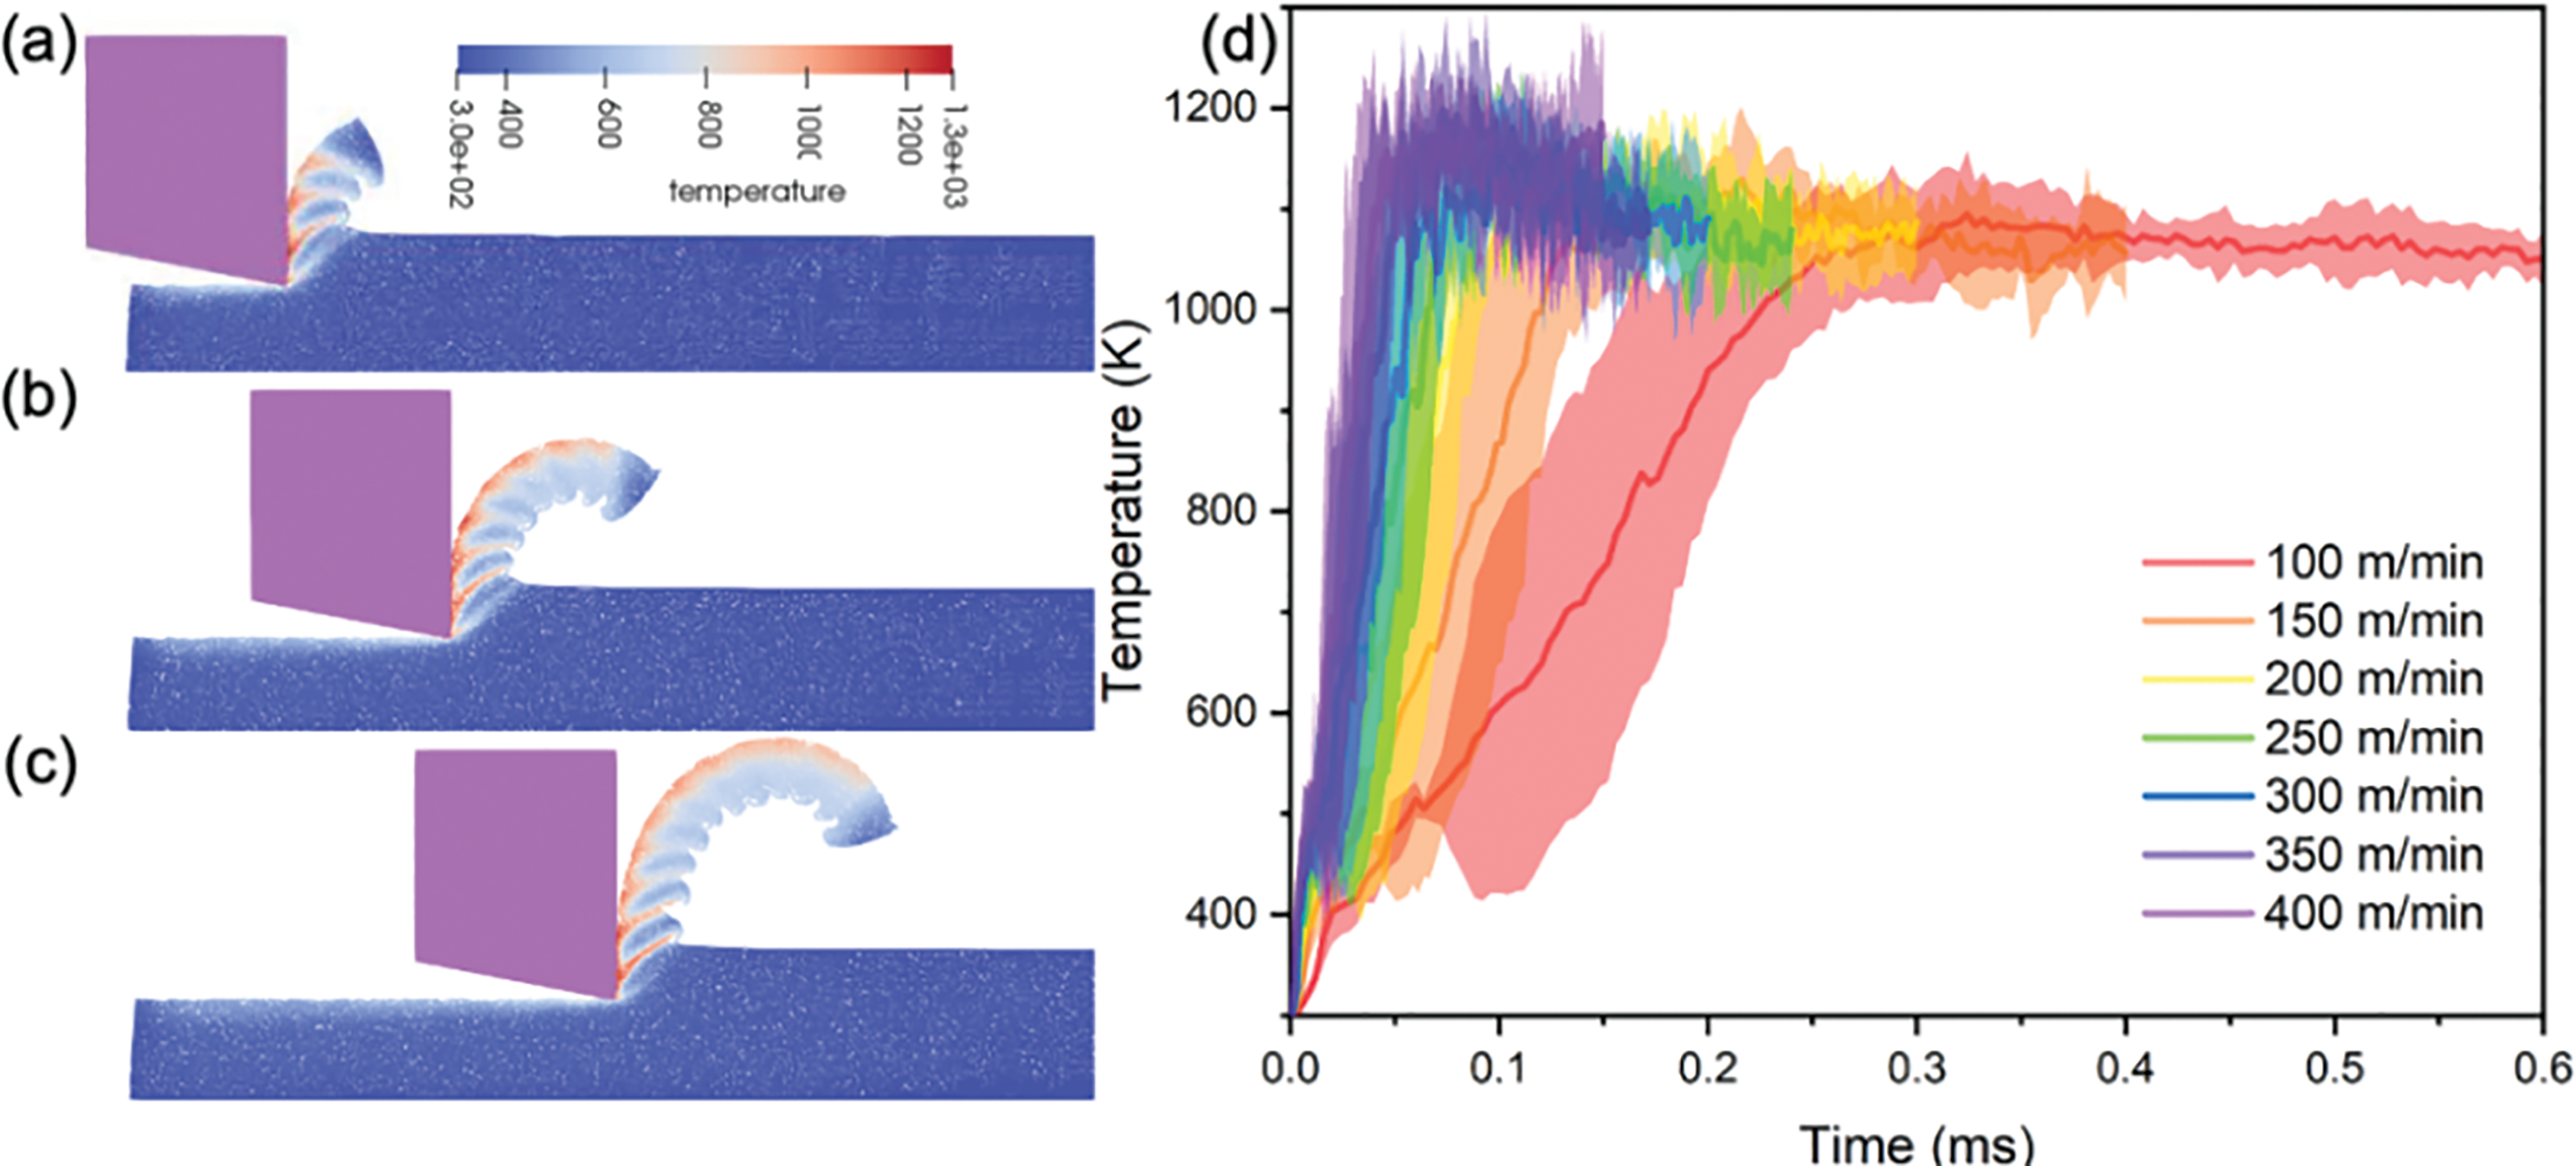
Figure 6: Snapshots of cutting process temperature distribution (a) t = 0.07 ms (b) t = 0.13 ms (c) t = 0.2 ms (d) variations of cutting temperature over time at different cutting rates (100 m/min, 150 m/min, 200 m/min, 250 m/min, 300 m/min, 350 m/min and 400 m/min)
Fig. 7 presents detailed data on cutting temperatures for various speeds, including average and maximum temperatures. The average cutting temperature is calculated as the mean of the temperatures recorded at different points within the cutting tool edge region at various time. The maximum cutting temperature refers to the peak temperature observed in the cutting tool edge area. As the cutting speed increases, the average cutting temperatures show a gradual increase. For instance, at a cutting rate of 150 m/min, the maximum cutting temperature reaches 1265.63 K while the average temperature is 1081.28 K. These results are compared with those obtained through the FEM by Paiva et al. [29], where the FEM-simulated maximum cutting temperature at 150 m/min is 951°C (1224.15 K), closely aligning with our simulation results. Notably, the maximum temperature is typically observed early in the temperature sequence. Consequently, the average temperature around the steady state of the temperature sequence is used as the representative temperature relative to the corresponding cutting rates. To address temperature fluctuations, the variance around the steady stage is also calculated, and both average temperatures and their variances are advanced for further analysis.
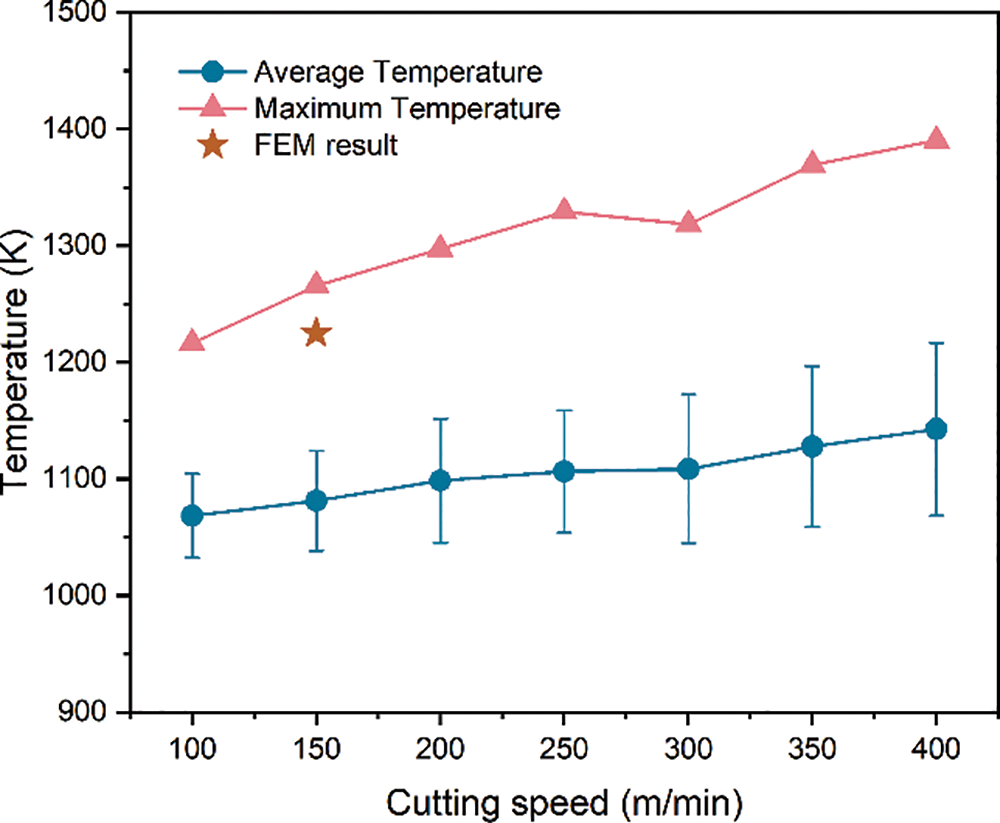
Figure 7: Comparison of simulated average cutting temperature and maximum cutting temperature at different cutting speeds and FEM maximum cutting temperature
3.4 Simulation of Spinodal Decomposition of TiAlN Coatings during Cutting Process
The simulation of spinodal decomposition in TiAlN coatings during the cutting processes requires integrating information from both PVD simulation and cutting simulations. Under the weak coupling strategy proposed, the temperature response is used to replicate cutting conditions, and the shaped PVD-simulated microstructure serves as the initial condition for solving the Cahn-Hilliard equation. Composition noise from PVD preparation is applied to the initial microstructure with a proposed noise level of 0.01 at. For clarity, simulation settings and physical parameters necessary for spinodal decomposition are detailed in Table 3. To closely approximate actual cutting conditions and accurately replicate microstructure evolution, we calculate the average cutting temperature and conduct numerical simulations introducing temperature fluctuations to study spinodal decomposition in Ti0.55Al0.45N, Ti0.46Al0.54N, and Ti0.33Al0.67N coatings at cutting speeds of 100 m/min, 200 m/min, and 400 m/min. Specifically, the corresponding temperatures are 1068.27 K (

The simulation results under varying service temperature conditions are depicted in Fig. 8. Figs. 8a, 8d and 8g present the microstructure evolution results of three coatings with differing compositions (i.e., Ti0.55Al0.45N, Ti0.46Al0.54N, and Ti0.33Al0.67N) maintained at a constant cutting rate. At an average cutting temperature of 1068.27 K, Ti0.55Al0.45N (Fig. 8a) and Ti0.46Al0.54N (Fig. 8d) exhibit a distinct two-phase structure with slightly deepened coloration, indicating a progressive increase in the concentration of c-TiN and c-AlN regions. Conversely, for the Ti0.33Al0.67N (Fig. 8g) coatings, the microstructure remains close to the initial state with subtle composition fluctuations, where no prominent spinodal decomposition-induced two-phase structure appears. As the temperature reaches 1142.58 K (Fig. 8i), the signs of spinodal decomposition become more pronounced. For Ti0.55Al0.45N and Ti0.46Al0.54N coatings, as the cutting temperature rises from 1098.39 K to 1142.58 K (Figs. 8c,8f), the c-TiN phase in the Ti0.55Al0.45N and Ti0.46Al0.54N coatings begins to grow and distribute uniformly within the c-AlN rich phase, while the number of c-TiN particles decreases. With an increase in cutting rates, the corresponding temperature rises across a wide range. At higher temperatures, atoms exhibit faster thermal movement and diffusion rates, which further accelerates particle growth and leads to larger c-TiN phase particles, resulting in a significant increase in the component wavelength.
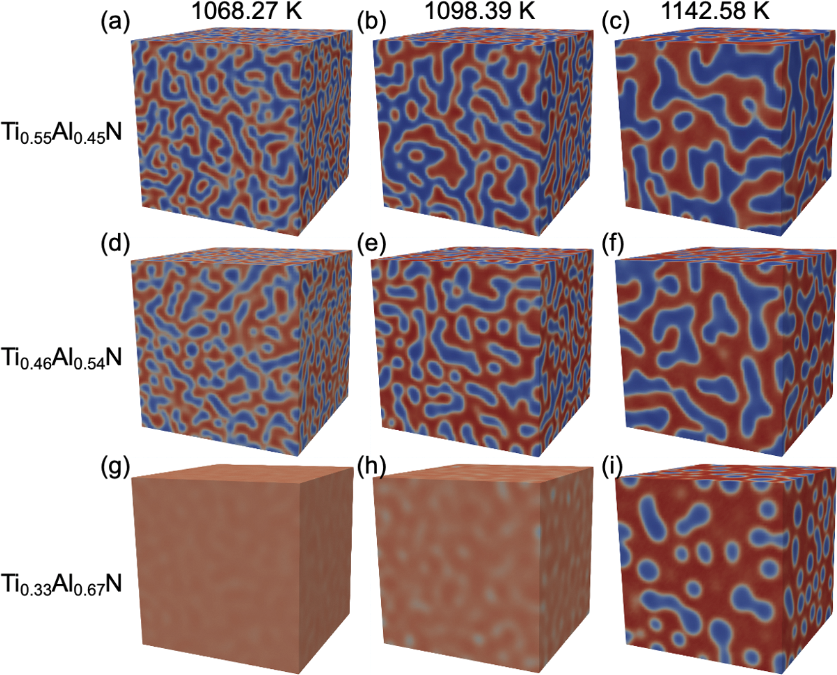
Figure 8: Microstructure evolution during spinodal decomposition at 600 s for different compositions: (a, b, c) Ti0.55Al0.45N (d, e, f) Ti0.46Al0.54N (g, h, i) Ti0.33Al0.67N at different average cutting temperature (1068.27 K, 1098.39 K, 1142.58 K)
For the sake of validation, a comparison is conducted between the simulated microstructure features, such as spinodal wavelength, and experimental results. Due to the limited availability of direct experimental observations, experimental data are compared under similar annealing conditions. Fig. 9 illustrates the comparison of the numerically simulated wavelengths against the experimental data obtained by Knutsson et al. [19] for Ti0.33Al0.67N coating annealed at 850˚C for various durations. As the annealing time increases, there is a noticeable growth in the component wavelength. Specifically, the simulated wavelengths for Ti0.33Al0.67N annealed for 20 min and 40 min are 3.65 nm and 4.66 nm, respectively, aligning closely with the experimental findings obtained by Knutsson et al. [19] extracted from the SAXS measurements, which report wavelengths of 3.8 nm and 4.4 nm. Given this agreement, the simulation results for spinodal decomposition are deemed valid and serve as a robust basis for further studies on the impact of cutting rates on microstructure evolution.
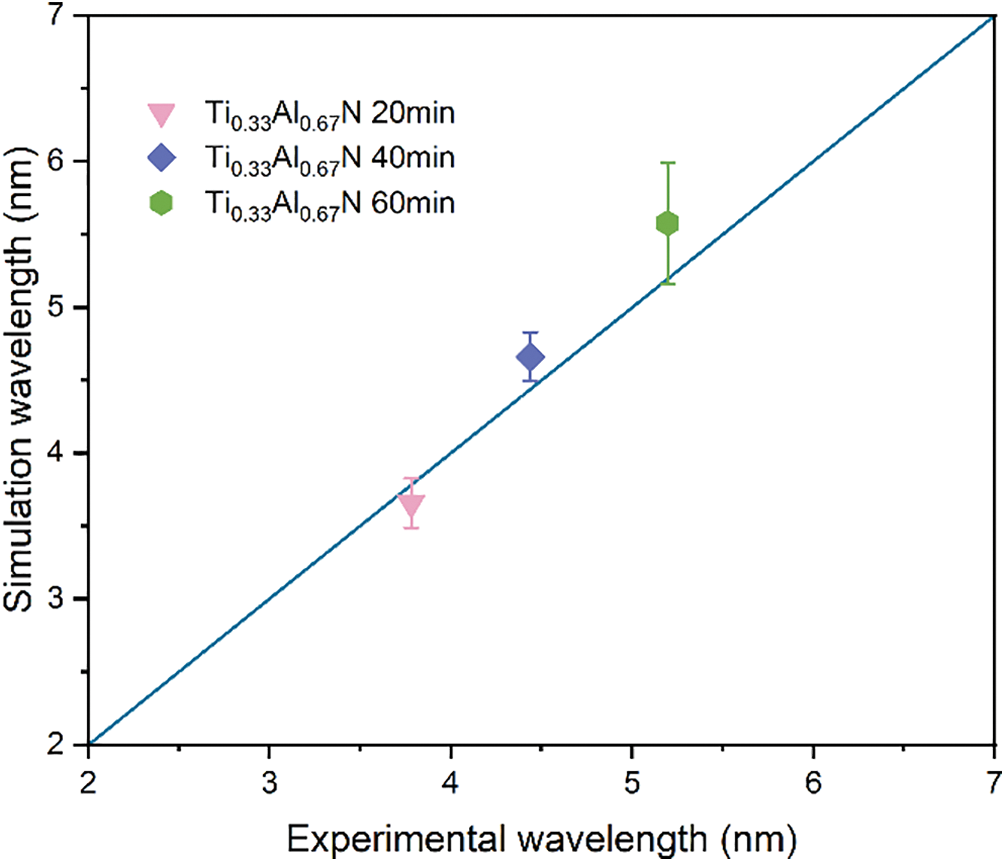
Figure 9: Simulated wavelength of the Ti0.33Al0.67N coatings at 850 ˚C for various annealing times, compared with the experimental results
Furthermore, the analysis of the microstructure of spinodal decomposition, based primarily on morphological assessments, yields indirect results. To derive more quantitative insights, the wavelengths of coatings with different compositions subjected to variable cutting temperatures are measured and depicted in Fig. 10. The wavelength evolution at a temperature of 1142.58 K for the three different compositions of TiAlN coatings exhibits a markedly faster rate compared to other recorded cutting temperatures, with component wavelengths increasing more substantially over the same annealing time. The Ti0.33Al0.67N coating (Fig. 10 c), at 1142.58 K, in the initial stage of the cutting process (up to 50 s), shows a swift increase in average wavelength, followed by a short period of stability before reaching 500 s, after which there is a gradual rise in the component wavelength. This trend is attributed to the coarsening of the c-(Ti, Al)N and c-(Al, Ti)N grains formed through spinodal decomposition, with the diffusion process predominantly governing the coarsening rate.
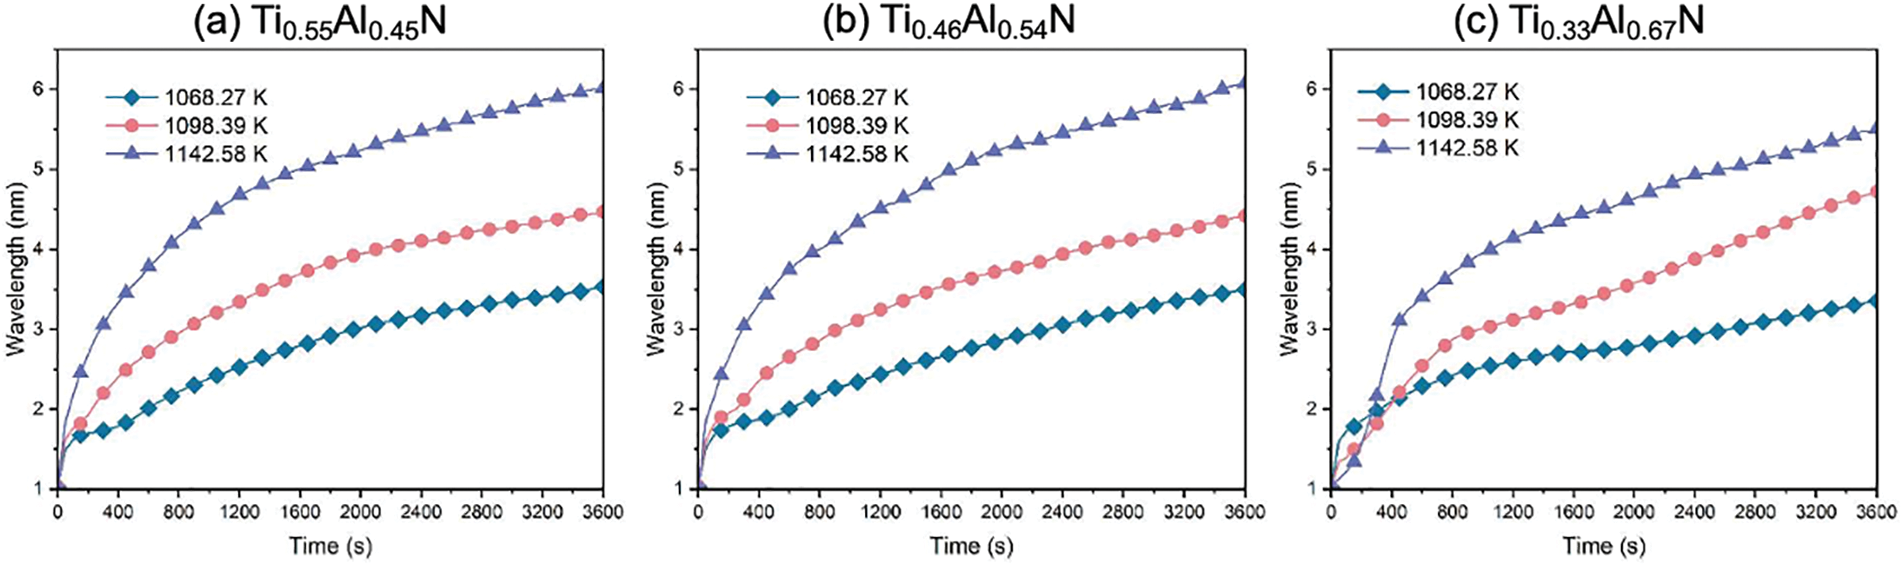
Figure 10: Evolution of the simulated composition wavelengths in the (a) Ti0.55Al0.45N (b) Ti0.46Al0.54N (c) Ti0.33Al0.67N coatings during spinodal decomposition at different average cutting 1068.27 K, 1098.39 K and 1142.58 K
Overall, simulations of microstructure evolution throughout the preparation and service processes of PVD c-TiAlN coatings have been successfully conducted. Nevertheless, further efforts are essential for achieving more accurate predictions concerning the lifespan control of cutting tools coated with PVD c-TiAlN coatings. A significant aspect involves the thermal-mechanical coupling phenomenon during the cutting process, where the applied force generated by friction undoubtedly contributes to the degradation of coatings. However, the precise impact of this force, whether beneficial or detrimental, warrants further investigation. Another mission is to introduce phase-field simulation beyond Cahn-Hilliard modeling to make precise inference results towards the phase transition of the c-AlN to the w-AlN phase. While these efforts have not yet commenced, it is hoped that this work will inspire further research in similar applications.
In this study, we present a multi-scale simulation approach to accommodate the microstructure evolution of coatings, considering the whole process of preparation and service periods of PVD TiAlN coatings. This study successfully establishes a linkage between operational parameters of the cutting process and the corresponding service temperature and explores its effect on the microstructure evolution of TiAlN coatings prepared by PVD.
• Through meticulous alignment of simulation outcomes with empirical data, we establish a quantitative nexus among model parameters, process variables (e.g., bias voltage), and coating attributes. Our calculated surface roughness (Ra) values for TiAlN coatings evince commendable concordance with experimental observations, reflecting the fidelity of our model across disparate deposition rates.
• Furthermore, by employing numerical simulations, we interrogate the interplay between cutting rate and resultant cutting temperature in metal machining operations, thereby acquiring detailed temperature profiles for cutting tools. Our analyses quantitatively unveil a direct correlation between cutting rate increments and ensuing temperature escalation and qualitatively obtain average temperature and corresponding fluctuations for the coatings in service.
• Lastly, leveraging microstructural data derived from PVD simulations and operational parameters from cutting simulations, we conduct numerical investigations into the spinodal decomposition of TiAlN coatings during service. Our findings reveal a pronounced acceleration in decomposition kinetics under elevated cutting rates, accompanied by conspicuous wavelength evolution dynamics.
Acknowledgement: The authors would like to express their heartfelt gratitude to the editors and reviewers for their detailed review and insightful advice.
Funding Statement: The financial support from Youth Fund of the National Natural Science Foundation of China (Grant No. 52101028), China Postdoctoral Science Foundation (Grant No. 2021M703628), and Natural Science Foundation of Hunan Province (Grant No. 2022JJ40629) is acknowledged.
Author Contributions: The authors confirm contribution to the paper as follows: Study conception and design: Lijun Zhang, Jing Zhong, Li Chen; data collection: Yehao Long; analysis and interpretation of results: Yehao Long, Tongdi Zhang; draft manuscript preparation: Yehao Long. All authors reviewed the results and approved the final version of the manuscript.
Availability of Data and Materials: The data and codes that support the findings of this study are available from the corresponding authors upon reasonable request.
Conflicts of Interest: The authors declare that they have no conflicts of interest to report regarding the present study.
References
1. L. Chen, J. Paulitsch, Y. Du, and P. H. Mayrhofer, “Thermal stability and oxidation resistance of Ti–Al–N coatings,” Surf. Coat. Technol., vol. 206, no. 11, pp. 2954–2960, 2012. doi: 10.1016/j.surfcoat.2011.12.028. [Google Scholar] [PubMed] [CrossRef]
2. P. H. Mayrhofer, F. D. Fischer, H. J. Böhm, C. Mitterer, and J. M. Schneider, “Energetic balance and kinetics for the decomposition of supersaturated Ti1−xAlxN,” Acta Mater., vol. 55, no. 4, pp. 1441–1446, 2007. doi: 10.1016/j.actamat.2006.09.045. [Google Scholar] [CrossRef]
3. M. Moser, P. H. Mayrhofer, L. Székely, G. Sáfrán, and P. B. Barna, “Influence of bipolar pulsed DC magnetron sputtering on elemental composition and micro-structure of Ti–Al–Y–N thin films,” Surf. Coat. Technol., vol. 203, no. 1, pp. 148–155, 2008. doi: 10.1016/j.surfcoat.2008.08.042. [Google Scholar] [CrossRef]
4. B. Meng, J. Wang, M. Chen, S. Zhu, and F. Wang, “Study on the oxidation behavior of a novel thermal barrier coating system using the nanocrystalline coating as bonding coating on the single-crystal superalloy,” Corros. Sci., vol. 225, pp. 111591, 2023. doi: 10.1016/j.corsci.2023.111591. [Google Scholar] [CrossRef]
5. N. Xue et al., “Comparison of cold-sprayed coatings of copper-based composite deposited on AZ31B magnesium alloy and 6061 T6 aluminum alloy substrates,” Materials, vol. 16, no. 14, pp. 5120, 2023. doi: 10.3390/ma16145120. [Google Scholar] [PubMed] [CrossRef]
6. S. Zhu et al., “Ablation behavior and mechanisms of high-entropy rare earth titanates (Y0.2Gd0.2Ho0.2Er0.2Yb0.2)2Ti2O7 coating deposited by plasma spraying technology,” Surf. Coat. Technol., vol. 478, pp. 130414, 2024. doi: 10.1016/j.surfcoat.2024.130414. [Google Scholar] [CrossRef]
7. H. Riedl et al., “Phase stability, mechanical properties and thermal stability of Y alloyed Ti–Al–N coatings,” Surf. Coat. Technol., vol. 235, pp. 174–180, 2013. doi: 10.1016/j.surfcoat.2013.07.030. [Google Scholar] [CrossRef]
8. M. J. Brova, E. Alat, M. A. Pauley, R. Sherbondy, A. T. Motta and D. E. Wolfe, “Undoped and ytterbium-doped titanium aluminum nitride coatings for improved oxidation behavior of nuclear fuel cladding,” Surf. Coat. Technol., vol. 331, no. 6, pp. 163–171, 2017. doi: 10.1016/j.surfcoat.2017.09.076. [Google Scholar] [CrossRef]
9. R. Qiu et al., “CVD TiAlN coatings with tunable nanolamella architectures,” Surf. Coat. Technol., vol. 413, pp. 127076, 2021. doi: 10.1016/j.surfcoat.2021.127076. [Google Scholar] [CrossRef]
10. P. Tai et al., “Microstructure evolution and nanohardness of nanostructured TiAlN coating under N+ ion irradiation,” Surf. Coat. Technol., vol. 441, no. 11, pp. 128494, 2022. doi: 10.1016/j.surfcoat.2022.128494. [Google Scholar] [CrossRef]
11. N. Norrby, L. Rogström, M. P. Johansson-Jõesaar, N. Schell, and M. Odén, “In situ X-ray scattering study of the cubic to hexagonal transformation of AlN in Ti1−xAlxN,” Acta Mater., vol. 73, pp. 205–214, 2014. doi: 10.1016/j.actamat.2014.04.014. [Google Scholar] [CrossRef]
12. R. Qiu, H. Aboulfadl, O. Bäcke, D. Stiens, H. O. Andrén and M. Halvarsson, “Atom probe tomography investigation of 3D nanoscale compositional variations in CVD TiAlN nanolamella coatings,” Surf. Coat. Technol., vol. 426, pp. 127741, 2021. doi: 10.1016/j.surfcoat.2021.127741. [Google Scholar] [CrossRef]
13. R. Dai et al., “High-throughput screening of optimal process parameters for PVD TiN coatings with best properties through a combination of 3-D quantitative phase-field simulation and hierarchical multi-objective optimization strategy,” Front. Mater., vol. 9, pp. 924294, 2022. doi: 10.3389/fmats.2022.924294. [Google Scholar] [CrossRef]
14. S. Yang, J. Zhong, M. Chen, and L. Zhang, “A parametric three-dimensional phase-field study of the physical vapor deposition process of metal thin films aiming at quantitative simulations,” Coatings, vol. 9, no. 10, pp. 607, 2019. doi: 10.3390/coatings9100607. [Google Scholar] [CrossRef]
15. P. Panjan, A. Drnovšek, N. Mahne, M. Čekada, and M. Panjan, “Surface topography of PVD hard coatings,” Coatings, vol. 11, no. 11, pp. 1387, 2021. doi: 10.3390/coatings11111387. [Google Scholar] [CrossRef]
16. J. A. Stewart and D. E. Spearot, “Phase-field simulations of microstructure evolution during physical vapor deposition of single-phase thin films,” Comput. Mater. Sci., vol. 131, pp. 170–177, 2017. doi: 10.1016/j.commatsci.2017.01.034. [Google Scholar] [CrossRef]
17. P. Keblinski, A. Maritan, F. Toigo, R. Messier, and J. R. Banavar, “Continuum model for the growth of interfaces,” Phys. Rev. E, vol. 53, no. 1, pp. 759–778, 1996. doi: 10.1103/PhysRevE.53.759. [Google Scholar] [PubMed] [CrossRef]
18. J. Zhou et al., “Phase equilibria, thermodynamics and microstructure simulation of metastable spinodal decomposition in c-Ti1−xAlxN coatings,” Calphad, vol. 56, pp. 92–101, 2017. doi: 10.1016/j.calphad.2016.12.006. [Google Scholar] [CrossRef]
19. A. Knutsson et al., “Microstructure evolution during the isostructural decomposition of TiAlN—A combined in-situ small angle x-ray scattering and phase field study,” J. Appl. Phys., vol. 113, no. 21, pp. 213518, 2013. doi: 10.1063/1.4809573. [Google Scholar] [CrossRef]
20. T. Zhang, J. Zhong, and L. Zhang, “Pareto optimal driven automation framework for quantitative microstructure simulation towards spinodal decomposition,” MRS Commun., vol. 13, no. 5, pp. 877–884, 2023. doi: 10.1557/s43579-023-00429-z. [Google Scholar] [CrossRef]
21. J. W. Cahn, “On spinodal decomposition,” Acta Metall., vol. 9, no. 9, pp. 795–801, 1961. doi: 10.1016/0001-6160(61)90182-1. [Google Scholar] [CrossRef]
22. J. Zhou, L. Zhang, and L. Chen, “Effect of Cr on metastable phase equilibria and spinodal decomposition in c-TiAlN coatings: A CALPHAD and Cahn-Hilliard study,” Surf. Coat. Technol., vol. 311, pp. 231–237, 2017. doi: 10.1016/j.surfcoat.2017.01.007. [Google Scholar] [CrossRef]
23. M. Afrasiabi, M. Roethlin, H. Klippel, and K. Wegener, “Meshfree simulation of metal cutting: An updated Lagrangian approach with dynamic refinement,” Int. J. Mech. Sci., vol. 160, no. 3, pp. 451–466, 2019. doi: 10.1016/j.ijmecsci.2019.06.045. [Google Scholar] [CrossRef]
24. M. Sima and T. Özel, “Modified material constitutive models for serrated chip formation simulations and experimental validation in machining of titanium alloy Ti–6Al–4V,” Int. J. Mach. Tools Manuf., vol. 50, no. 11, pp. 943–960, 2010. doi: 10.1016/j.ijmachtools.2010.08.004. [Google Scholar] [CrossRef]
25. L. Zhang et al., “Thermodynamic properties of the Al–Fe–Ni system acquired via a hybrid approach combining calorimetry, first-principles and CALPHAD,” Acta Mater., vol. 57, no. 18, pp. 5324–5341, 2009. doi: 10.1016/j.actamat.2009.07.031. [Google Scholar] [CrossRef]
26. S. Hu and L. Chen, “A phase-field model for evolving microstructures with strong elastic inhomogeneity,” Acta Mater., vol. 49, no. 11, pp. 1879–1890, 2001. doi: 10.1016/S1359-6454(01)00118-5. [Google Scholar] [CrossRef]
27. Y. Kong et al., “Microstructure and mechanical properties of Ti-Al-Cr-N films: Effect of current of additional anode,” Appl. Surf. Sci., vol. 483, pp. 1058–1068, 2019. doi: 10.1016/j.apsusc.2019.04.023. [Google Scholar] [CrossRef]
28. H. Elmkhah, T. F. Zhang, A. Abdollah-zadeh, K. H. Kim, and F. Mahboubi, “Surface characteristics for the TiAlN coatings deposited by high power impulse magnetron sputtering technique at the different bias voltages,” J. Alloys Compd., vol. 688, pp. 820–827, 2016. doi: 10.1016/j.jallcom.2016.07.013. [Google Scholar] [CrossRef]
29. J. M. Paiva et al., “Tribological and wear performance of carbide tools with TiB2 PVD coating under varying machining conditions of TiAl6V4 aerospace alloy,” Coatings, vol. 7, no. 11, pp. 187, 2017. doi: 10.3390/coatings7110187. [Google Scholar] [CrossRef]
Cite This Article
 Copyright © 2024 The Author(s). Published by Tech Science Press.
This work is licensed under a Creative Commons Attribution 4.0 International License , which permits unrestricted use, distribution, and reproduction in any medium, provided the original work is properly cited.
 Downloads
 Citation Tools