
 Submit a Paper
 Propose a Special lssue
 Open Access
ARTICLE

Learning Vector Quantization-Based Fuzzy Rules Oversampling Method
School of Mathematics and Physics, Hebei University of Engineering, Handan, 056038, China
* Corresponding Author: Litao Ma. Email:
Computers, Materials & Continua 2024, 79(3), 5067-5082. https://doi.org/10.32604/cmc.2024.051494
Received 06 March 2024; Accepted 09 May 2024; Issue published 20 June 2024
 View Full Text
 Download PDF
Abstract
Imbalanced datasets are common in practical applications, and oversampling methods using fuzzy rules have been shown to enhance the classification performance of imbalanced data by taking into account the relationship between data attributes. However, the creation of fuzzy rules typically depends on expert knowledge, which may not fully leverage the label information in training data and may be subjective. To address this issue, a novel fuzzy rule oversampling approach is developed based on the learning vector quantization (LVQ) algorithm. In this method, the label information of the training data is utilized to determine the antecedent part of If-Then fuzzy rules by dynamically dividing attribute intervals using LVQ. Subsequently, fuzzy rules are generated and adjusted to calculate rule weights. The number of new samples to be synthesized for each rule is then computed, and samples from the minority class are synthesized based on the newly generated fuzzy rules. This results in the establishment of a fuzzy rule oversampling method based on LVQ. To evaluate the effectiveness of this method, comparative experiments are conducted on 12 publicly available imbalance datasets with five other sampling techniques in combination with the support function machine. The experimental results demonstrate that the proposed method can significantly enhance the classification algorithm across seven performance indicators, including a boost of 2.15% to 12.34% in Accuracy, 6.11% to 27.06% in G-mean, and 4.69% to 18.78% in AUC. These show that the proposed method is capable of more efficiently improving the classification performance of imbalanced data.Keywords
As one of the important research directions of machine learning, classification is a key technology for extracting useful information from massive data. However, the imbalance in data distribution affects the accuracy and effectiveness of classification, so it is a major challenge. Imbalanced datasets are datasets in which the number of samples in one class is significantly different from the number of samples in other classes [1]. Such datasets are frequently encountered in real-world scenarios including fault detection [2], medical intelligent diagnosis [3], and text categorization [4]. Traditional classification algorithms, such as decision tree, neural networks and support vector machines (SVM), etc., typically operate under the assumption of a balanced data set where the number of samples for each category is roughly equal. Nevertheless, when encountering imbalanced data, algorithms tend to prioritize accuracy by favoring the majority class, leading to misclassification of the minority class. Therefore, it is crucial to address the issue of imbalanced data distribution effectively in order to successfully accomplish tasks such as classification.
There are two primary approaches for addressing imbalanced data classification: One at the algorithm level and the other at the data processing level. At the algorithm level, modifications are made to algorithms to address the limitations of classifiers in handling imbalanced data, allowing them to better handle classification issues related to imbalanced data. These algorithmic modifications typically involve cost-sensitive learning [5], feature selection and extraction [6], ensemble learning [7], among others. The cost-sensitive analysis seeks to reduce the expense associated with misclassification, specifically the high cost of misclassifying a minority class as a majority class. However, this approach may not always be feasible. Feature selection and extraction involve selecting a subset of features based on predefined rules to enhance the classification accuracy of the classifier, but this process may result in information loss. Ensemble learning can improve the generalizability of classifiers, but often at the expense of increased time complexity. On the other hand, techniques at the data processing level concentrate on adjusting the distribution of training samples to reduce the imbalance within datasets, which is a straightforward approach to achieving balance. A typical data-oriented approach is the resampling method that mainly encompasses the undersampling [8] and the oversampling techniques [9]. Oversampling is frequently preferred over other data-level methods due to its capacity to improve classification accuracy by augmenting the minority class instances. Conversely, undersampling may lead to the elimination of crucial information during the reduction process, consequently diminishing the classifier’s ability to generalize effectively.
At present, significant advancements have been achieved in the research methodologies for imbalanced data, with sampling techniques displaying promising potential. The data-level sampling approach functions independently of the classifier, providing greater applicability and improved suitability. In particular, oversampling methods create new minority class samples without sacrificing important information from the original data. Nonetheless, only a limited number of studies have explored leveraging the correlation between attributes in fuzzy rules during data preprocessing. Liu et al. [10] introduced the fuzzy rules based oversampling technique (FRO), which considers the attribute correlation and yields better results for imbalanced data. However, the generation of fuzzy rules in FRO relies on expert knowledge leading to subjectivity.
In order to tackle this issue, the current study endeavors to develop a novel fuzzy rule-based oversampling technique that leverages the correlation among attributes and maximizes the utilization of label information in training data to minimize the influence of expert subjectivity. The key contributions of this research are as follows:
• An improved method for generating fuzzy rules is proposed to learn the distribution of training data and effectively protect the information of minority instances.
• Utilizing the learning vector quantization (LVQ) algorithm, the data attribute interval is dynamically partitioned, leveraging the label information from the training data to mitigate the influence of expert subjectivity.
• By utilizing the correlation between attributes demonstrated by fuzzy rules, the minority class data is synthesized based on the guidance of fuzzy rules to guarantee the generation of new data within a rational range.
• The introduction of the support function machine, comparison experiments carried out on 12 publicly accessible imbalanced datasets against 5 other sampling methods demonstrate that the proposed method significantly enhances the classification performance of imbalanced data.
The remainder of this paper is structured as follows: In Section 2, previous studies relevant to this paper are discussed. Section 3 introduces the details of the proposed method. Section 4 presents the comparison experiments results and analysis. Section 5 summarizes the paper and suggests potential avenues for future research.
2.1 Sampling Techniques for Imbalanced Data
Random under sampling (RUS) [11] is a nonheuristic method that randomly selects a subset of the majority class and removes the remaining samples to balance the class distribution. A study investigating the application of RUS on tweet data to address class imbalances demonstrated its effectiveness [12]. However, it is important to note that this method may result in the loss of crucial information and potentially lead to underfitting. To address this issue, a clustering technique was integrated into the undersampling approach. Considering the computational complexity, Ofek et al. [13] proposed an undersampling method based on fast clustering to effectively manage class imbalances while achieving a balance between computational efficiency and classification performance.
Oversampling methods alleviate the negative effects of imbalanced distribution by augmenting the number of instances in the minority class while maintaining the size of the majority class constant. Random oversampling (ROS) [11] is a methodology utilized to address imbalanced datasets by replicating instances from minority classes, however, there exists a potential danger of over-fitting. Chawla et al. [14] introduced the synthetic minority oversampling technique (SMOTE) which is based on the concept of K-nearest neighbors. SMOTE generates new instances of the minority class by brief linear interpolating between existing positive samples and their K-nearest neighbors, without considering the majority class sample distribution. Han et al. [15] introduced the borderline SMOTE technique to enhance the minority class samples near the decision boundary, resulting in an improvement in recall performance compared to the traditional SMOTE method. Adaptive synthetic sampling (ADASYN) was introduced by He et al. [16] to address the density distribution of data, automatically assigning different weights to positive samples based on their surrounding context. Borderline SMOTE and ADASYN took into account the distribution of majority class samples in order to minimize the generation of noisy samples. However, these methods had not effectively addressed the issue of increased overlap between classes. Barua et al. [17] proposed the majority weighed minority (MWM) oversampling method, utilizing the Euclidean distance between majority and minority class samples to assign weights to minority class samples, ensuring that the newly created samples fall within the distribution of minority samples in order to mitigate the growth of overlap.
2.2 Fuzzy Methods with Class Imbalance Problem
If-Then fuzzy rules, as a crucial component of fuzzy set theory research, are effective in illustrating data distribution and causal characteristics. They have been employed to tackle the classification challenges associated with imbalanced datasets. Xu et al. [18] expanded upon the fuzzy classification algorithm based on If-Then fuzzy rules, resulting in a significant enhancement in classification performance by minimizing the impact of imbalanced data. Alshomrani et al. [19] introduced a classification system leveraging If-Then fuzzy rules to improve classification accuracy by smoothing the boundary region through feature weighting, particularly in cases of class overlap within imbalanced datasets. Fernández et al. [20] explored various configurations of fuzzy rule-based classification systems and preprocessing methods, demonstrating synergies that highlight the positive impact of applying data sampling techniques to imbalanced datasets in generating If-Then fuzzy rules.
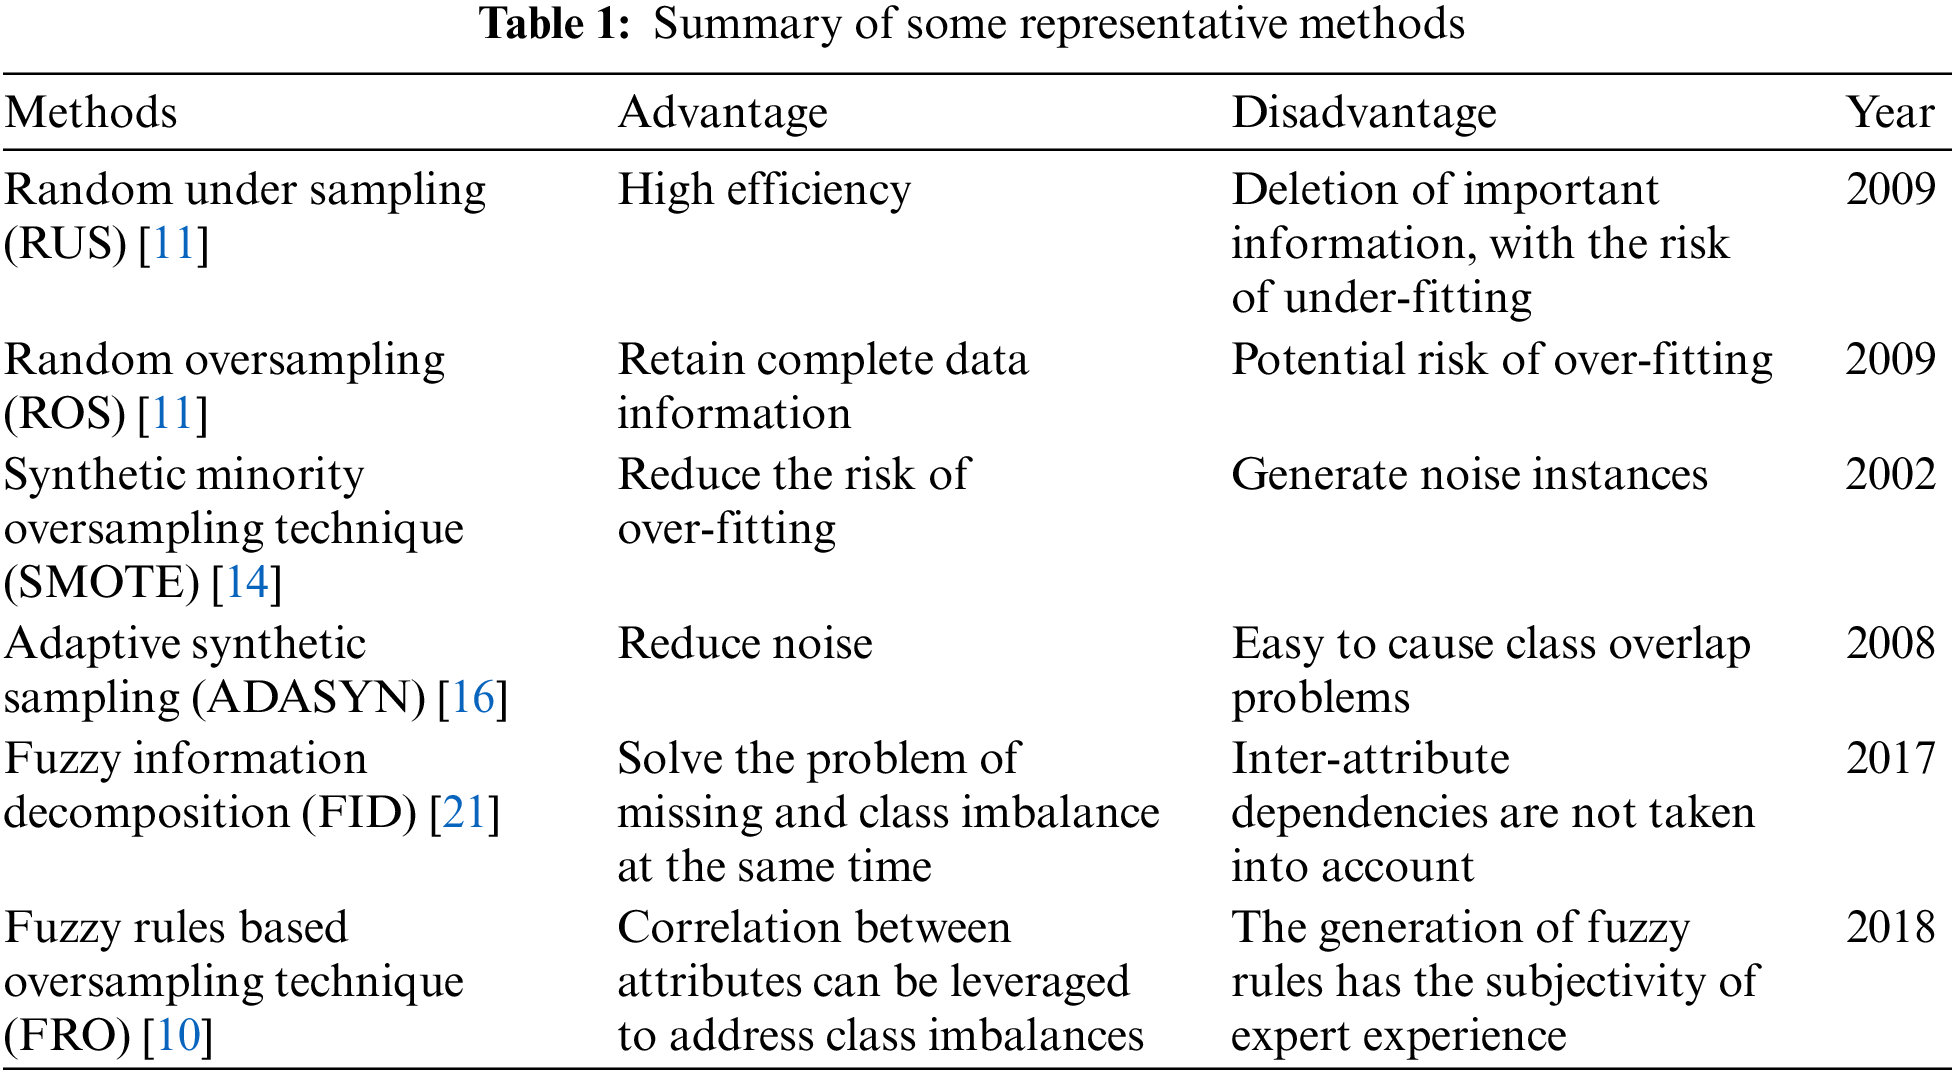
Nevertheless, the effectiveness of the relationship between characteristics demonstrated in the fuzzy rule has not been extensively applied to the data preprocessing phase. Liu et al. [21] introduced the fuzzy information decomposition (FID) method, which effectively utilizes fuzzy information to address class imbalance. However, the method does not fully exploit the attribute correlation issue. Therefore, Liu et al. [10] further proposed an FRO method based on If-Then fuzzy rule to effectively tackle class imbalance. Table 1 presents a summary of the advantage and disadvantage of several traditional methods for addressing class imbalances as discussed earlier.
3 Learning Vector Quantization-Based Fuzzy Rule Oversampling Method (LVQFRO)
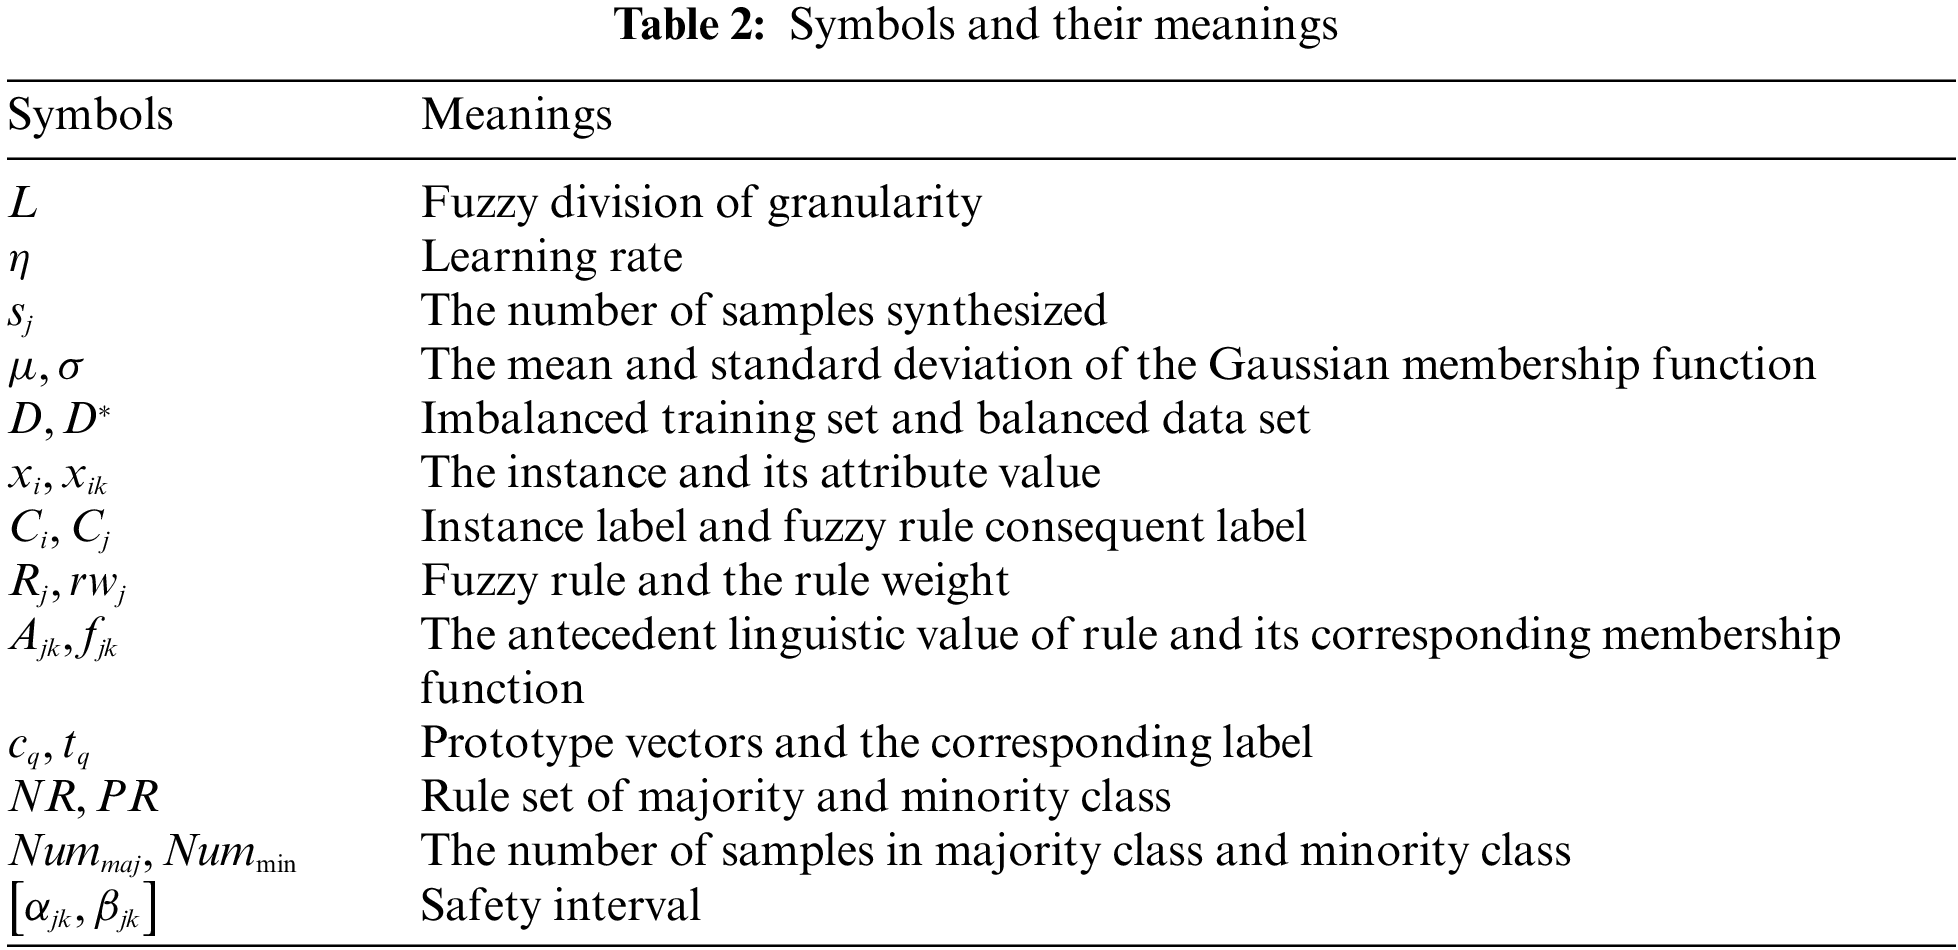
The symbols and the corresponding meanings utilized in this article are presented in Table 2.
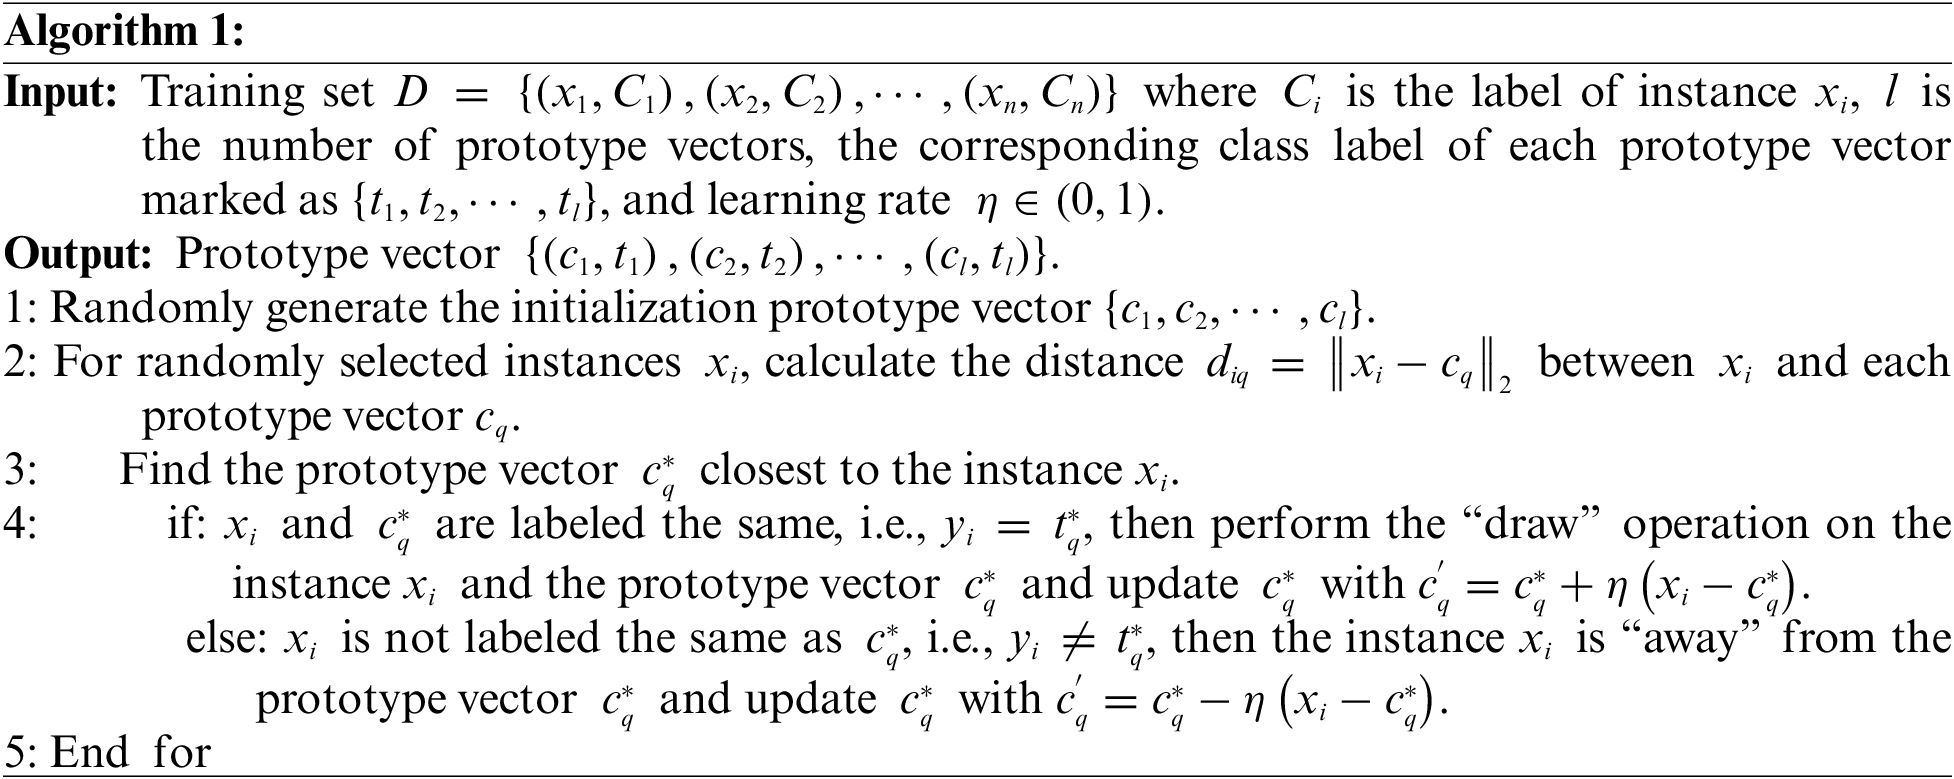
LVQ [22] operates as a prototype clustering algorithm, in contrast to alternative prototype clustering approaches like the K-means algorithm, LVQ makes use of labeled training data. The prototype vectors are adjusted using the label information in order to establish a set of prototype vectors, which act as the centers of each cluster. Each sample point
In previous research [10], the authors utilized the Gaussian membership function as a basis for generating If-Then fuzzy rules. They divided the instance attribute intervals uniformly and assigned the middle value of each interval as the center of the Gaussian membership function
• Utilize the K-means algorithm to create the initial prototype vector, which serves as the centroid of the cluster.
• Based on the label information of the data set, the cluster center will be adjusted using LVQ and the instance attribute intervals will be dynamically partitioned.
• The attribute intervals are represented by fuzzy linguistic values, and a membership function is calculated for each interval.
The Gaussian membership function is employed for its wide-ranging support characteristic, which prevents the membership function value from being zero across the entire domain. This feature ensures the fuzzy completeness of the If-Then fuzzy rule, which can be expressed as Eq. (1).
where the parameters
• Divide the instance attribute values into intervals with the highest membership degree, identify the antecedents of If-Then fuzzy rules, incorporate the consequents, and subsequently construct the If-Then fuzzy rule set
Fuzzy rule typically appears as Eq. (2), in the context of fuzzy rules, the
• Calculate the rule weights
where
3.2 Synthetic Minority Samples
In the case of imbalanced binary data with
• Extract the fuzzy rule
For
• Calculate the number of samples
The generation of more minority class samples under the fuzzy rule with reduced weight, thereby enhancing the protection of the minority class samples in the surrounding area.
• Calculate the safety interval
Suppose that the three consecutive Gaussian membership functions are arranged in sequence:
the safety interval
then we have
• Simulate random numbers within the safe interval and synthesize minority data.
The
When applying the inverse transformation method to generate random numbers, the fuzzy membership function
According to the theorem of the inverse transformation method, the corresponding distribution function
then we have:
• Denormalize the simulated random number.
where
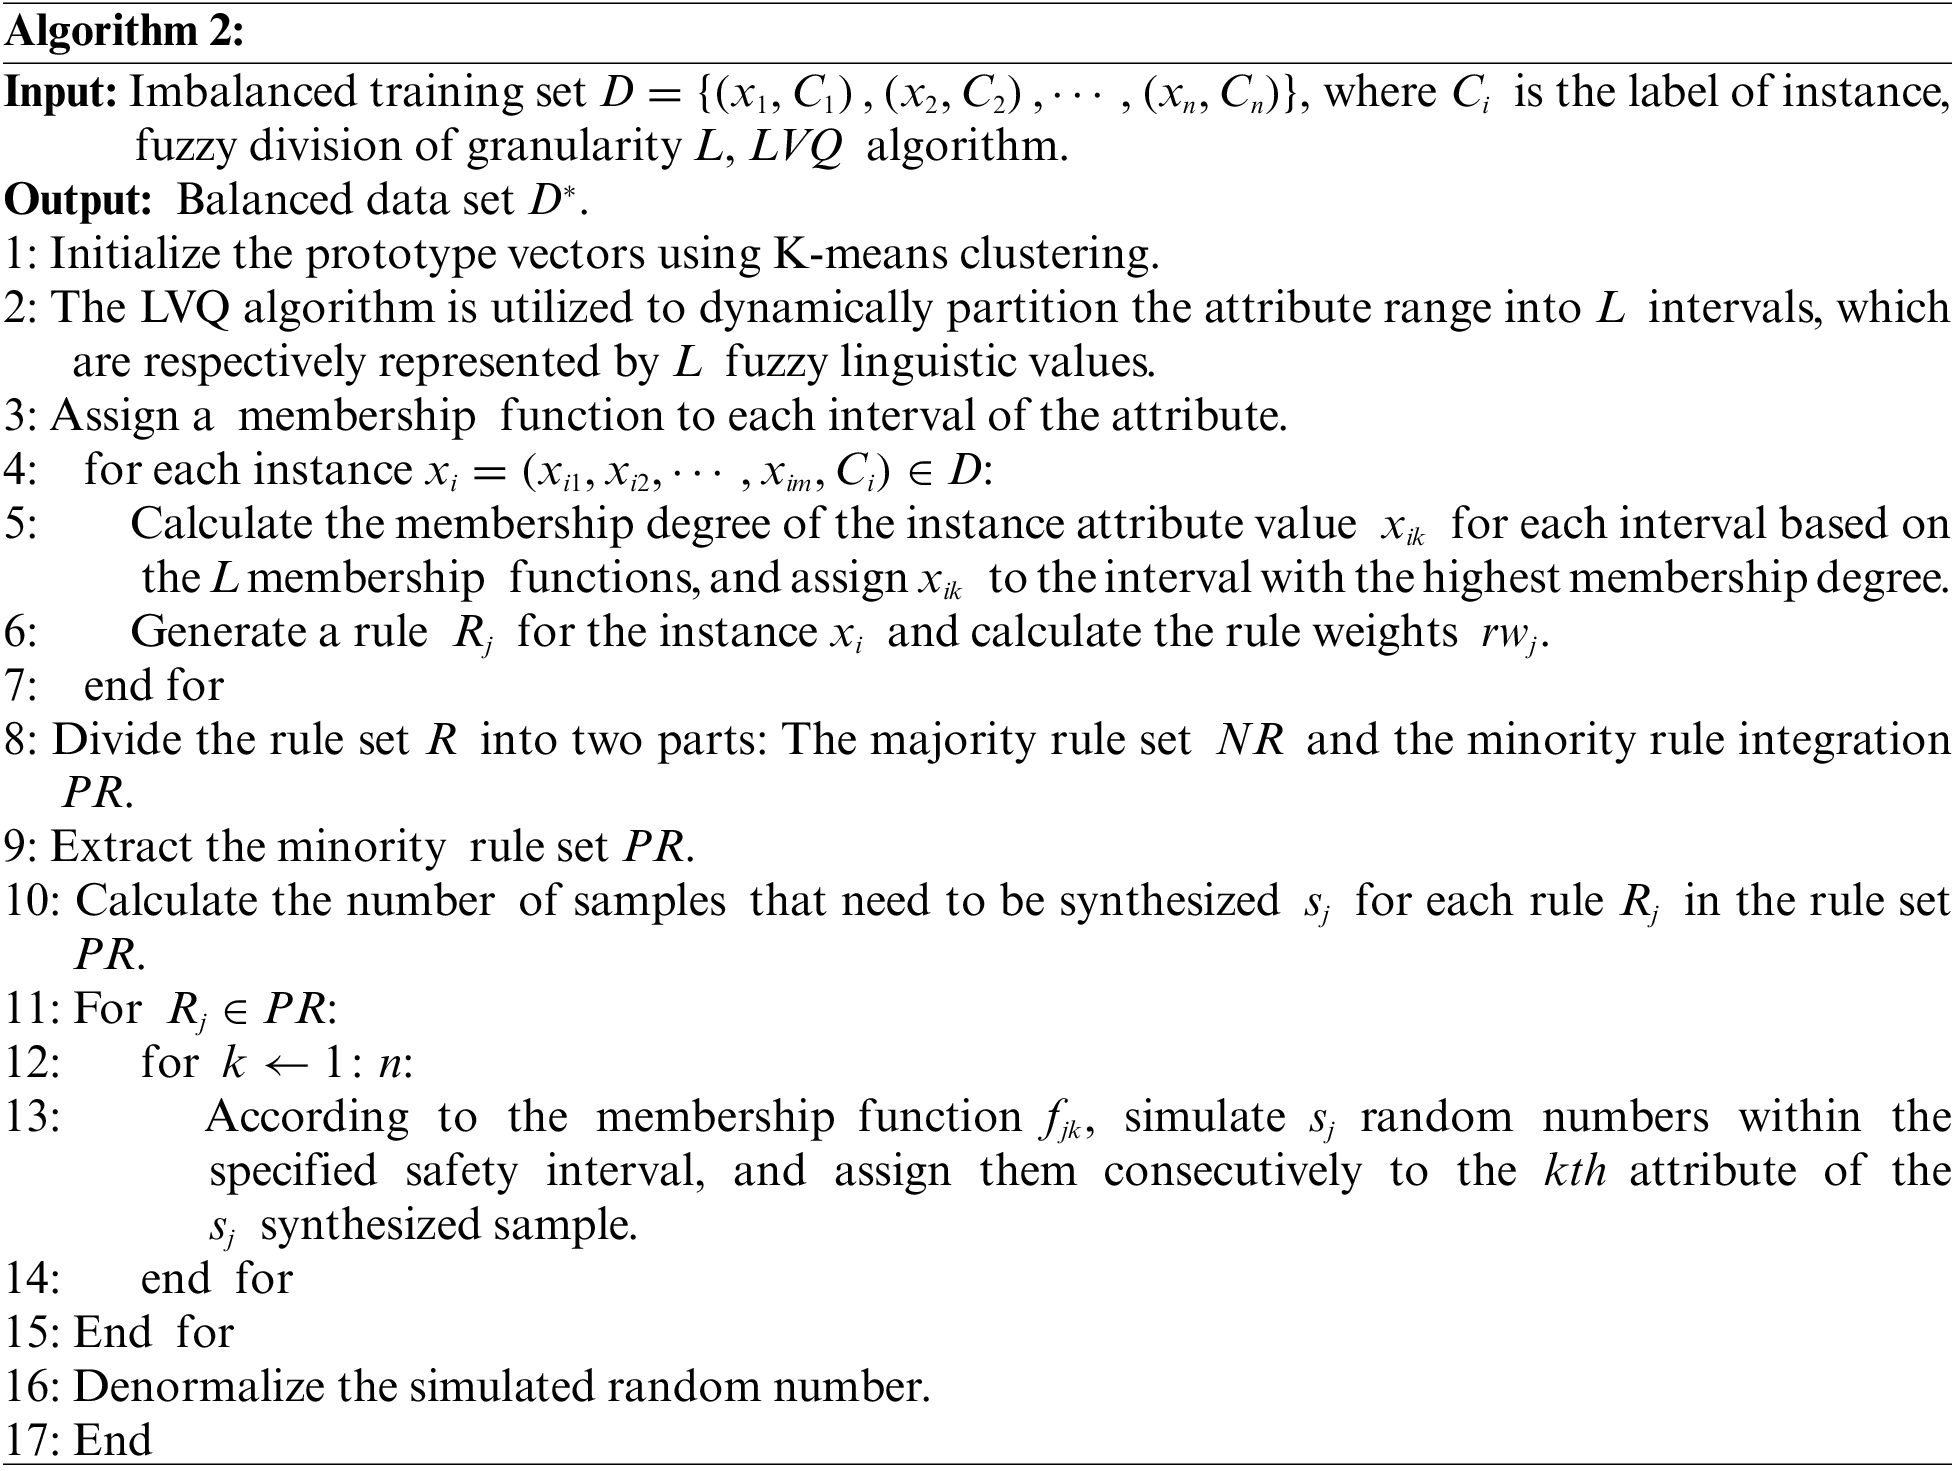
The specific process of the LVQFRO is shown in Algorithm 2.
Considering that support function machine (SFM) [23] serves as an effective generalization of SVM, it not only transforms the distribution of the original datasets but also preserves all the essential information within the initial data. Therefore, this section will assess the efficacy of the LVQFRO algorithm by conducting comparative experiments on publicly accessible datasets, leveraging the capabilities of SFM.
To ensure the generalizability of the method, all experiments in this study are conducted on a PC servers. The hardware configuration included an Intel i5-1240P processor running at 1.70 GHz and 16 GB of memory. The software environment consisted of a 64-bit Windows 11 operating system, the Pycharm experimental platform, and Python 3.10.
In this study, 12 public datasets for binary classification from the KEEL database are chosen for experimental validation These datasets exhibit variations in attributes, sample sizes, and imbalance ratios (IR). Detailed information regarding the datasets can be found in Table 3. To quantify the level of imbalance in the selected datasets, IR is defined by the following Eq. (11):
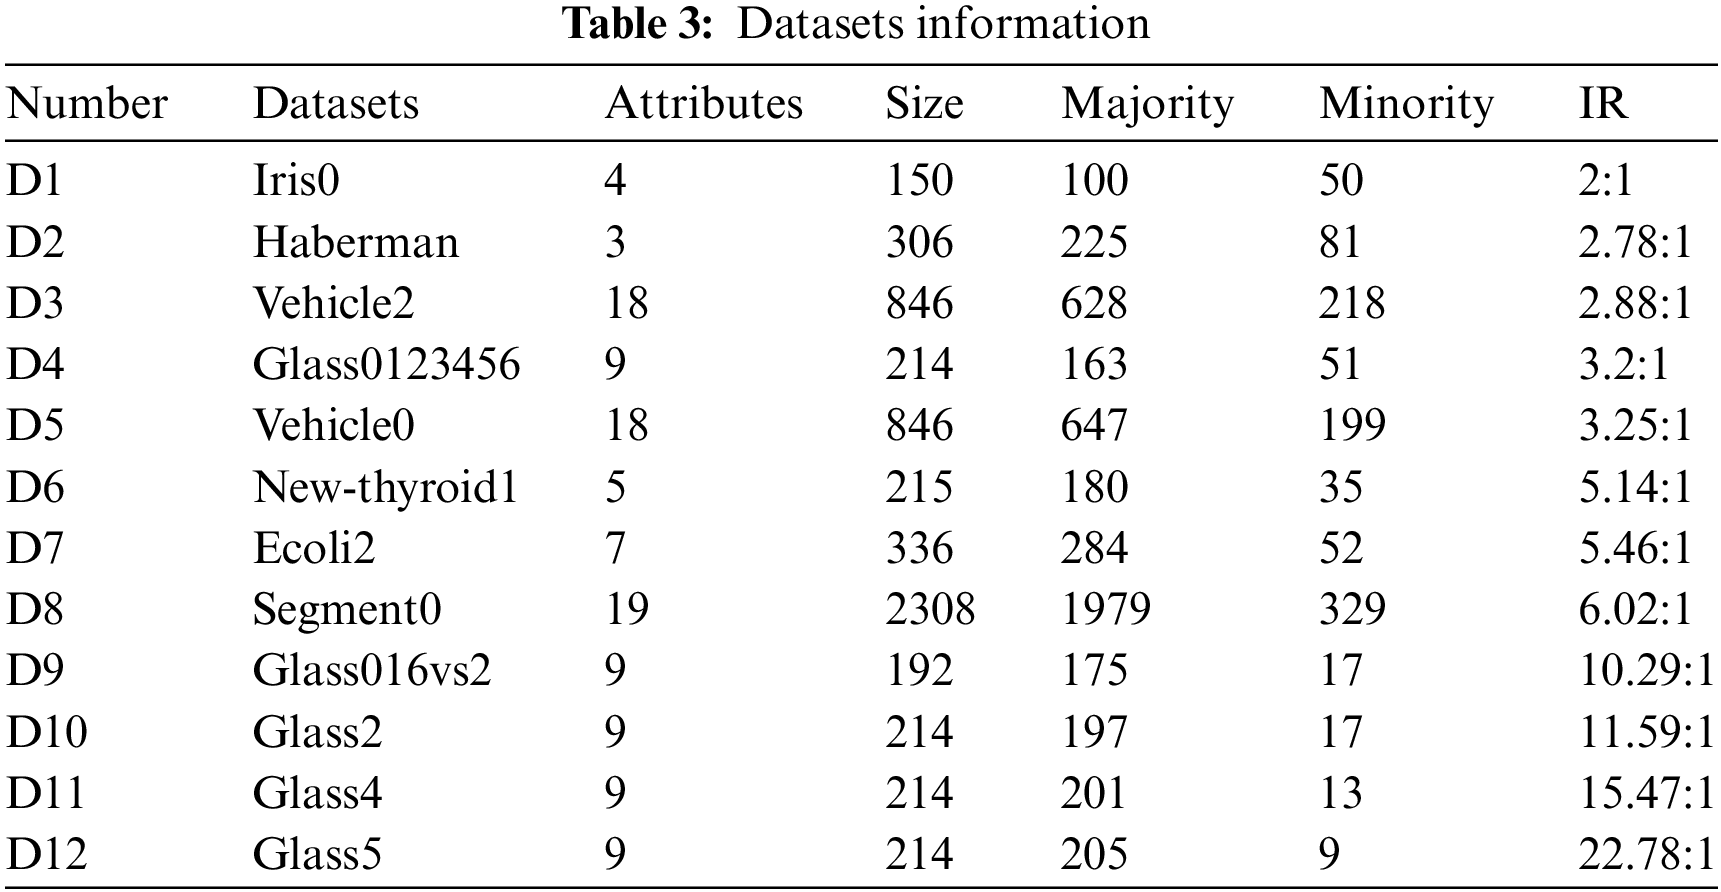
where
In the case of imbalanced datasets, seven performance metrics are employed in this study as the evaluation criteria for various methods: Accuracy, Precision, Specificity, Recall, F1-score, G-mean (Geometric mean), and AUC (Area under curve).
In addition to this study also employs three comprehensive evaluation metrics, F1-measure, G-mean and AUC to evaluate the effectiveness of approaches for addressing imbalanced data classification. The formulas for calculating these metrics are as Eqs. (14)–(16). F1-measure considers both precision and recall, calculating a harmonic average of the two to provide a comprehensive evaluation of the classifier’s ability to identify minority classes. G-mean takes into account both Recall and Specificity, and representing the overall performance of the classifier. A higher AUC value indicates a ROC curve closer to the upper left corner, allowing for a simultaneous evaluation of the classifier’s ability to classify both classes and providing a reasonable assessment of its classification performance.
4.4 Granularity Analysis of Fuzzy Partitions
This section concentrates on the granularity of fuzzy partitioning in order to facilitate performance comparison with other algorithms. For LVQ, the granularity of fuzzy partitions affects the value of evaluation indexes to a certain extent. A smaller granularity, indicating fewer divisions, results in wider fuzzy regions. This increases the likelihood of synthetic minority class samples overlapping with the majority class sample region. Conversely, a larger granularity of fuzzy partitions may lead to overfitting issues.
By leveraging the granularity of fuzzy partitions 5, 6, 7, 8, and 9 [10], which are widely accepted division values for LVQ, Table 4 presents the performance metrics of F1-measure, G-mean, and AUC when employing SFM across five distinct fuzzy granularities. These results are derived from experiments conducted on 12 imbalanced public datasets.
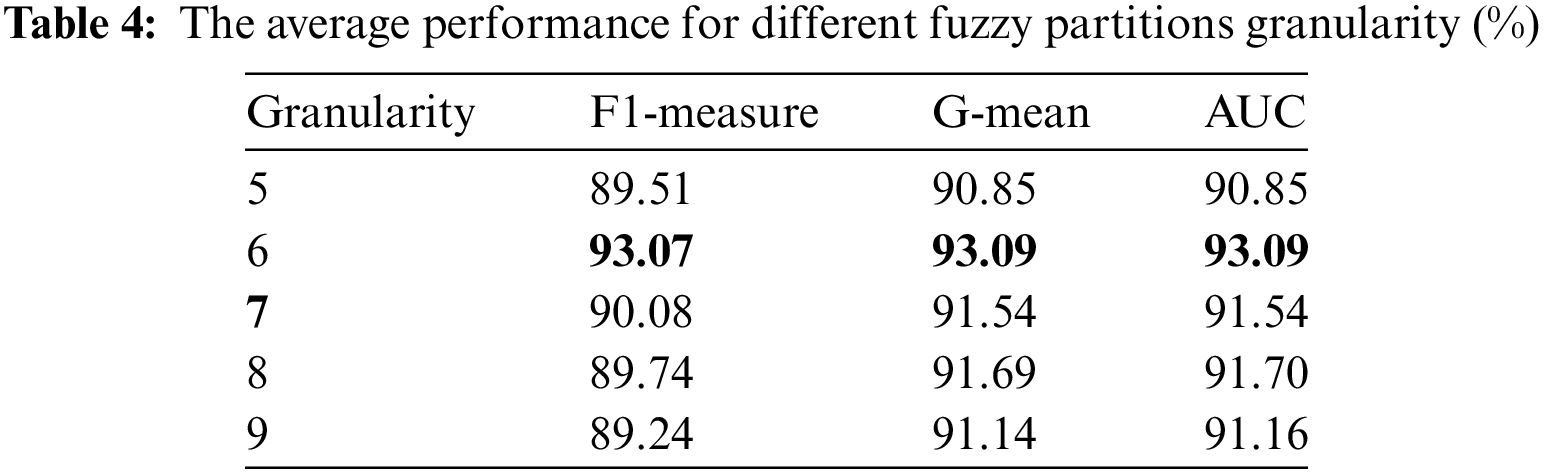
In the LVQFRO method, the parameter for the granularity of fuzzy partitions increases from 5 to 6, resulting in an increase in the average values of F1-measure, G-mean, and AUC. These values reach their peak at a granularity of 6, with percentages of 93.07%, 93.09%, and 93.09%, respectively. These values represented increases of 3.56%, 2.24%, and 2.24% compared to a granularity of 5. As the fuzzy partition granularity increases, there is a decreasing trend in each evaluation metrics, leading to a decline in classifier performance. Specifically, the performance indicators saw increases of 3.33%, 1.38%, and 1.37% with respect to a granularity of 8%, and 3.83%, 1.93%, and 1.91% with respect to a granularity of 9. In conclusion, the best classification outcomes are observed at a granularity of 6. Therefore, the LVQFRO algorithm with a fuzzy partition granularity of 6 is chosen to preprocess the imbalanced datasets.
To assess the efficacy of the LVQFRO method constructed in this study, it is compared with four sampling techniques, RUS [11], SMOTE [14], FID [21], FRO [10], and the original dataset (ORI) [21] using the SFM method in a series of comparative experiments. The parameter configurations of each sampling technique remain consistent with those outlined in the original text. Specifically, the SMOTE algorithm utilizes a nearest neighbor count of 5, the FRO algorithm operates with a granularity value of 7, and the LVQFRO algorithm employs a granularity value of 6. Furthermore, the oversampling rate for all oversampling algorithms in the study is established at 1.
To objectively assess the generalization capability of various algorithms and mitigate the impact of randomness on experimental outcomes, this study employs an 80%–20% training-test split and five folds cross-validation methodology. The experiments are iterated five times to ensure unbiased results, with the final outcome being the average of the experimental results.
Fig. 1 presents the Accuracy values for each algorithm. LVQFRO achieves the best results on more than half of the 12 imbalanced public datasets (including a tie for first place), with an average accuracy improvement of 9.97% compared to the benchmark ORI, 12.34%, 8.24%, 8.24%, 2.98% and 2.15% compared to ORI, RUS, SMOTE, FID and FRO, respectively. These findings suggest that the LVQFRO algorithm developed in this study effectively enhances the overall accuracy of imbalanced datasets and demonstrates strong classification performance.
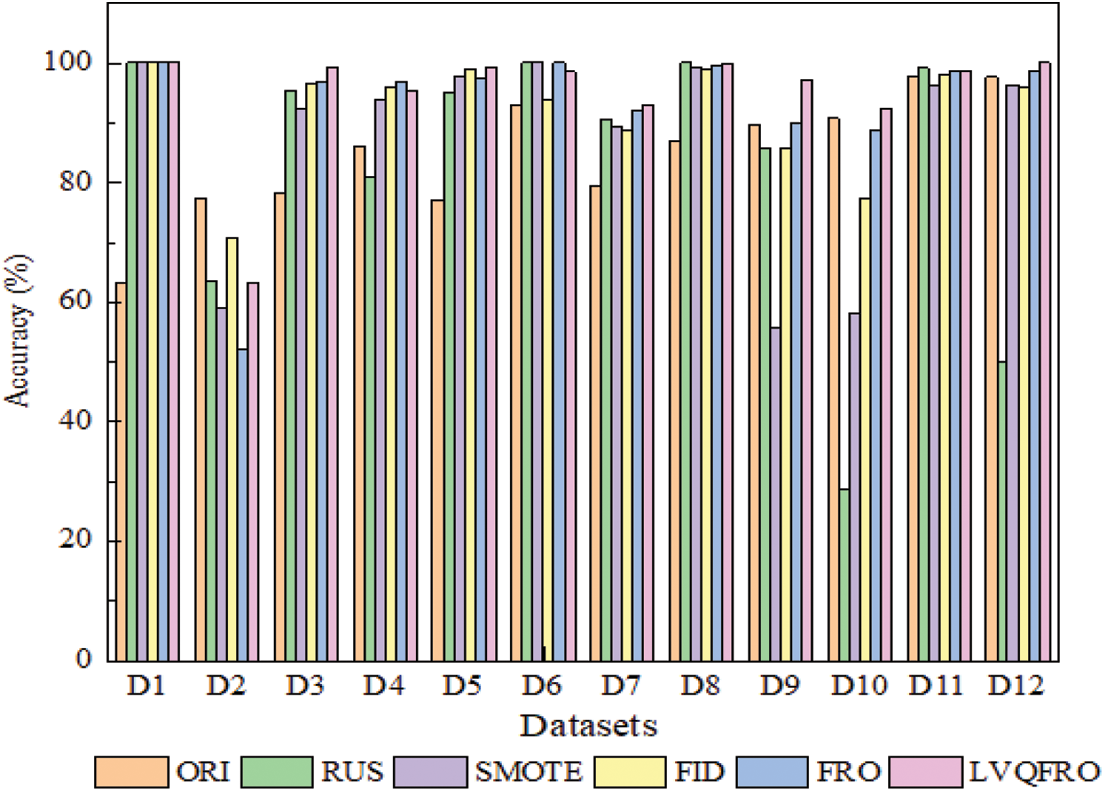
Figure 1: Comparative results for accuracy with different methods
Figs. 2 and 3a display the Precision, Specificity and Recall outcomes for each algorithm. Precision evaluates the predictive model’s capability to detect positive class samples, with the LVQFRO algorithm demonstrating the highest Precision across 9 datasets (including a tie for first place), showcasing an average enhancement of 11.04% compared to the ORI benchmark, 13.16% compared to RUS, 7.42% compared to SMOTE, 5.37% compared to FID, and 6.55% compared to the FRO algorithm. Specificity measures the accuracy in classifying negative samples, and the LVQFRO oversampling approach exhibits superior Specificity results across 10 of the 12 datasets, with at least a 2.34% improvement over other sampling methods. Recall represents the accuracy in classifying positive class samples, with LVQFRO achieving significant values on 7 datasets (including a tie for first place), surpassing the ORI, RUS, SMOTE, FID, and FRO algorithms by 10.70%, 9.59%, 6.54%, 5.90%, and 4.99%, respectively. These findings indicate that LVQFRO outperforms other sampling techniques in classification outcomes across most datasets, particularly in scenarios with high data imbalance. This method enhances the detection of minority samples while ensuring high classification accuracy across majority classes, emphasizing high recall and specificity characteristics.
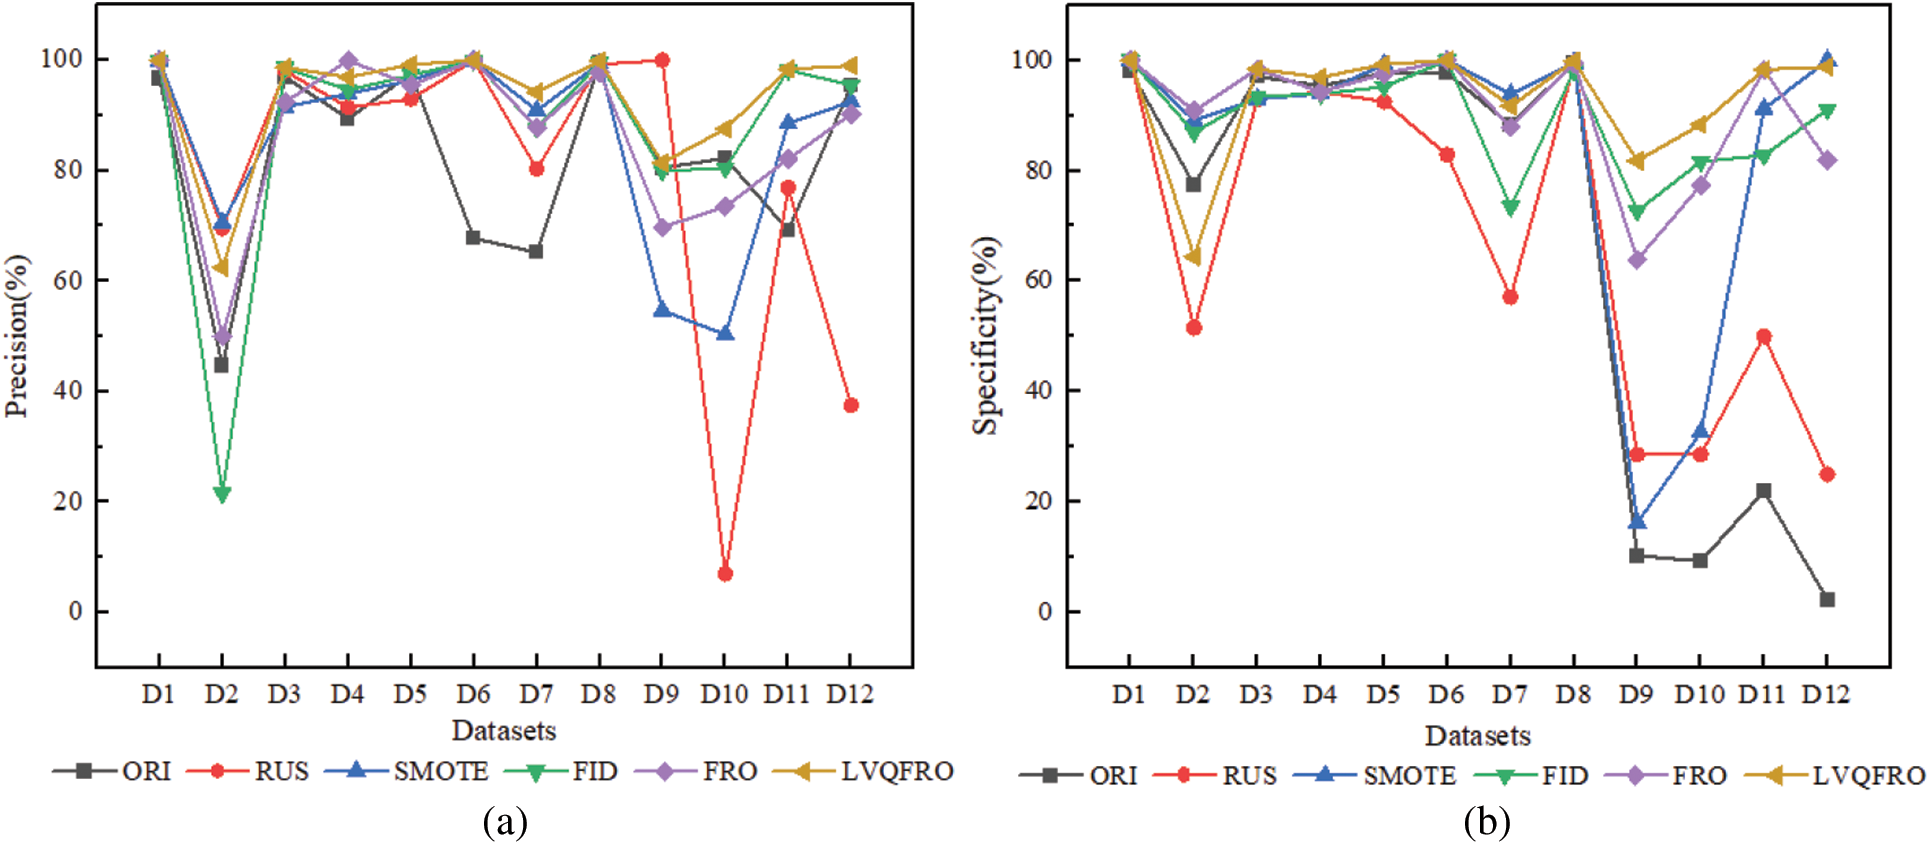
Figure 2: (a) Precision and (b) specificity comparison of different algorithms
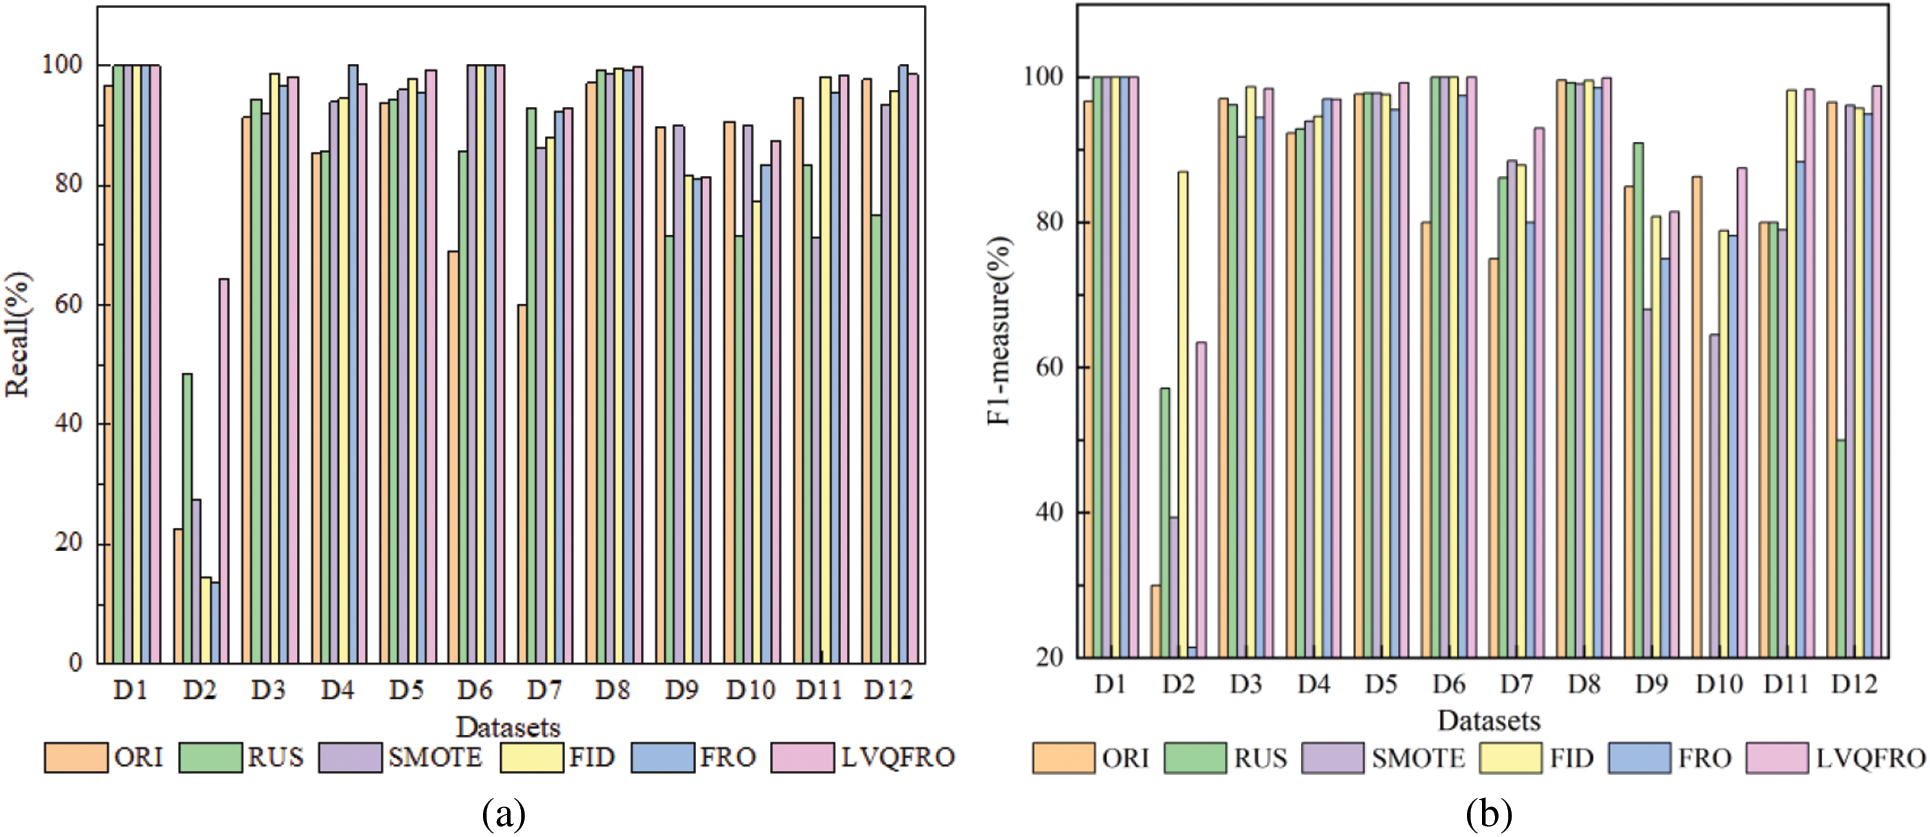
Figure 3: (a) Recall and (b) F1-measure comparison of different algorithms
Figs. 3b and 4 present a summary of the F1-measure, G-mean, and AUC index values for each algorithm across 12 public datasets. Among these datasets, LVQFRO demonstrates the best F1-measure performance on 8 datasets (including a tie for first place). Additionally, its performance on the remaining 3 datasets is also strong, with only a small gap separating it from the optimal results. The LVQFRO sampling method demonstrate superior performance compared to other methods in terms of G-mean. Specifically, 11 datasets (including a tie for first place) achieve high values , that is only slightly below the FID of 0.27% observed in the Vehicle2 data set, with insignificant difference between them. In comparison to the other five sampling methods, LVQFRO achieve the highest AUC values on 10 datasets (including a tie for first place), showing increases of 27.06%, 19.56%, 10.01%, 6.40%, and 6.11% on G-mean, and 18.78%, 17.90%, 6.95%, 4.92%, and 4.96% on AUC, respectively. In terms of the F1-measure, there are varying degrees of improvement ranging from 8.01% to 12.82%.
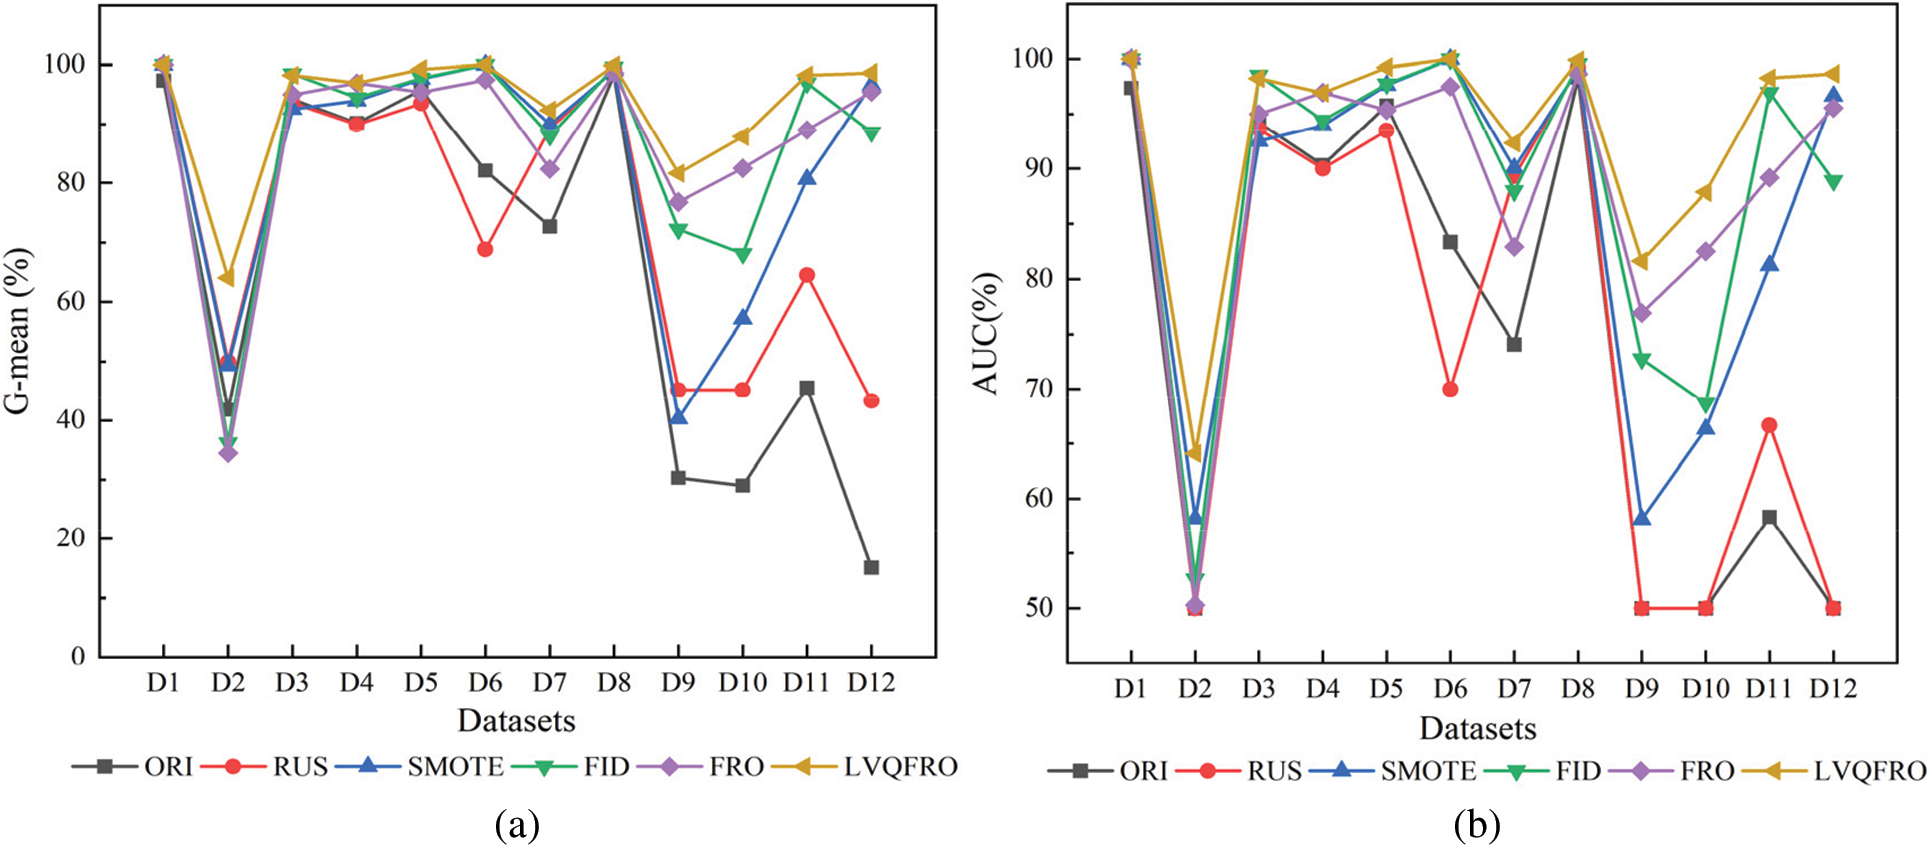
Figure 4: (a) G-mean and (b) AUC comparison of different algorithms
In conclusion, LVQFRO enhances the recognition rate of minority samples, and improves classification accuracy. On datasets with high class imbalance ratios, such as Glass016vs2, Glass2, Glass4, and Glass5, the original performance is subpar or even invalid. LVQFRO mitigates classification bias stemming from imbalanced data, exhibits strong generalization capabilities, and yields superior classification outcomes.
Table 5 displays the comparison of LVQFRO with other five algorithms. In this comparison, symbol ‘+’ denotes an improvement in the evaluation index of LVQFRO compared to the current algorithm, while symbol ‘–’ indicates a decrease in the index value. In comparison to the ORI benchmark, LVQFRO shows an average increase of 27.06% in G-mean, 26.92% in Specificity, and 8.41% in F1-measure. When compared to RUS, LVQFRO exhibits improvements of 12.34%, 13.16%, 9.59%, 26.28%, 12.82%, 19.56% and 17.90% in different metrics. Additionally, LVQFRO shows improvements ranging from 6.54% to 10.01% in the seven indicators compared to the SMOTE algorithm. In comparison to the FID and FRO algorithms, LVQFRO’s improvements are relatively small, with the lowest average increase at 2.15% and the highest at 8.01%. On the F1-measure, LVQFRO is only 0.17% lower than the FID algorithm, indicating insignificant differences in performance.
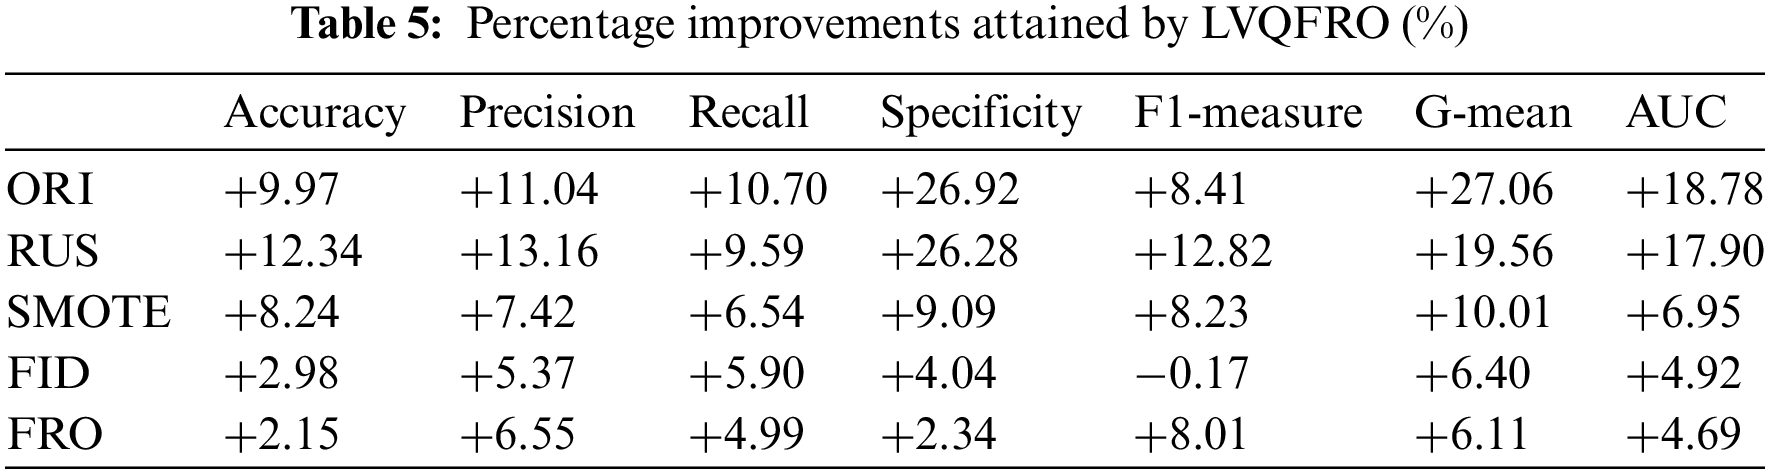
In conclusion, LVQFRO demonstrates superior classification performance across various datasets with different IR. The evaluation metrics show significant improvements compared to other oversampling algorithms, highlighting the effectiveness of dynamically partitioning attribute intervals and generating minority samples within the safe interval, and rational in addressing imbalanced data, ensuring the algorithm’s comprehensiveness and stability.
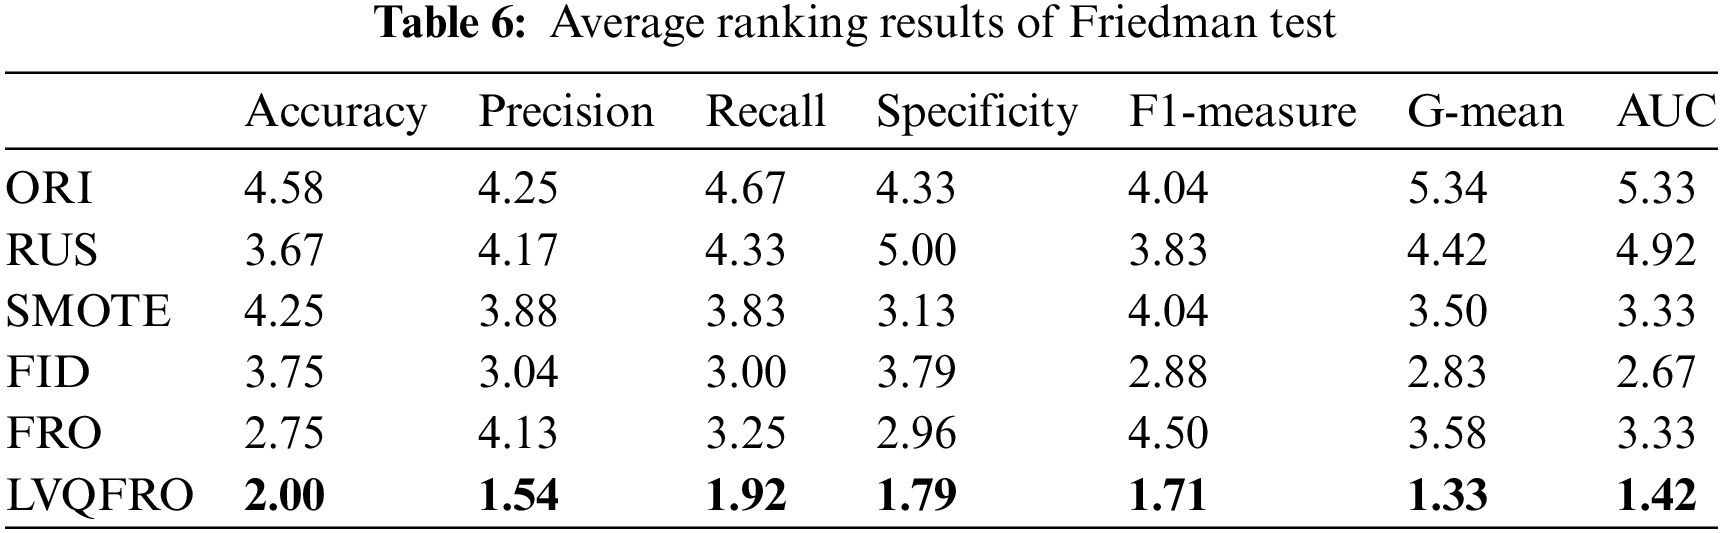
To further illustrate the statistical properties of the experimental results, LVQFRO is selected as the primary control method and a Friedman test [24] is conducted in comparison to five other methods. Table 6 presents the average rankings obtained from the Friedman test on seven evaluation criteria. The findings reveal that LVQFRO consistently achieves the highest rankings, suggesting that LVQFRO performs exceptionally well and consistently in comparison to the other methods, and demonstrates superior statistical significance.
In order to address the issue of imbalanced data classification more effectively, this study introduces a novel fuzzy rule oversampling technique called LVQFRO based on LVQ. LVQFRO determines the antecedents of If-Then fuzzy rules by taking into account the label information of training samples and dynamically dividing data attribute intervals using LVQ. This method helps to eliminate the subjective nature of expert experience in rule construction. Additionally, LVQFRO utilizes the correlation between data attributes to generate minority samples based on fuzzy rules, thus mitigating class imbalance issues. Experimental results on 12 datasets with varying imbalance ratios, in conjunction with the SFM classifier, demonstrate that the LVQFRO method yields superior classification performance. Furthermore, statistical analysis indicates that this method exhibits greater stability. This paper presents a new approach for binary-class classification of imbalanced data, showing improved performance. However, the extension of this method to multi-class imbalanced data classification warrants further investigation.
Acknowledgement: The authors wish to express their appreciation to the reviewers for their helpful suggestions which greatly improved the presentation of this paper.
Funding Statement: This work is funded by the National Science Foundation of China (62006068), Hebei Natural Science Foundation (A2021402008), Natural Science Foundation of Scientific Research Project of Higher Education in Hebei Province (ZD2020185, QN2020188), and 333 Talent Supported Project of Hebei Province (C20221026).
Author Contributions: The authors confirm contribution to the paper as follows: Study conception and design: Jiqiang Chen, Litao Ma; data collection: Ranran Han, Dongqing Zhang; analysis and interpretation of results: Jiqiang Chen, Ranran Han, Litao Ma; draft manuscript preparation: Jiqiang Chen, Ranran Han, Litao Ma. All authors reviewed the results and approved the final version of the manuscript.
Availability of Data and Materials: The data that support the findings of this study are openly at: https://sci2s.ugr.es/keel/datasets.php.
Conflicts of Interest: The authors declare that they have no conflicts of interest to report regarding the present study.
References
1. J. Dou, Y. Song, G. Wei, and Y. Zhang, “Fuzzy information decomposition incorporated and weighted relief-f feature selection: When imbalanced data meet incompletion,” Inf. Sci., vol. 584, no. 9, pp. 417–432, 2022. doi: 10.1016/j.ins.2021.10.057. [Google Scholar] [CrossRef]
2. L. Lan, X. Liu, and Q. Wang, “Fault detection and classification of the rotor unbalance based on dynamics features and support vector machine,” Meas. Control, vol. 56, no. 5–6, pp. 1075–1086, 2022. doi: 10.1177/00202940221135917. [Google Scholar] [CrossRef]
3. G. Fu, J. Wang, and W. Lin, “An adaptive loss backward feature elimination method for class-imbalanced and mixed-type data in medical diagnosis,” Chemometr. Intell. Lab. Syst., vol. 236, no. 1–4, pp. 104809, 2023. doi: 10.1016/j.chemolab.2023.104809. [Google Scholar] [CrossRef]
4. T. Cai and X. Zhang, “Imbalanced text sentiment classification based on multi-channel BLTCN-BLSTM self-attention,” Sensors, vol. 23, no. 4, pp. 2257, 2023. doi: 10.3390/s23042257. [Google Scholar] [PubMed] [CrossRef]
5. S. Zhang and L. Xie, “Penalized least squares classifier: Classification by regression via iterative cost-sensitive learning,” Neural Process. Lett., vol. 55, no. 7, pp. 8809–8828, 2023. doi: 10.1007/s11063-023-11178-4. [Google Scholar] [CrossRef]
6. R. P. Septiani and M. A. Anggorowati, “Comparative study of combination of preprocessing, n-gram feature extraction, feature selection, and classification method in Indonesian sentiment analysis with imbalanced data,” International Journal of Mathematics Computation, vol. 30, no. 2, pp. 36–49, 2019. [Google Scholar]
7. R. R. Far, M. F. Zanajni, B. Wang, M. Saif, and S. Chakrabarti, “Imputation-based ensemble techniques for class imbalance learning,” IEEE Trans. Knowl. Data Eng., vol. 33, no. 5, pp. 1988–2001, 2019. [Google Scholar]
8. S. N. Almuayqil, M. Humayun, N. Z. Jhanjhi, M. F. Almufareh, and N. A. Khan, “Enhancing sentiment analysis via random majority under-sampling with reduced time complexity for classifying tweet reviews,” Electron., vol. 11, no. 21, pp. 3624–3644, 2022. doi: 10.3390/electronics11213624. [Google Scholar] [CrossRef]
9. T. Wongvorachan, S. He, and O. Bulut, “A comparison of undersampling, oversampling, and smote methods for dealing with imbalanced classification in educational data mining,” Information, vol. 14, no. 1, pp. 54, 2023. doi: 10.3390/info14010054. [Google Scholar] [CrossRef]
10. G. Liu, Y. Yang, and B. Li, “Fuzzy rule-based oversampling technique for imbalanced and incomplete data learning,” Knowl. -Based Syst., vol. 158, no. 5, pp. 154–174, 2018. doi: 10.1016/j.knosys.2018.05.044. [Google Scholar] [CrossRef]
11. H. He and E. A. Garcia, “Learning from imbalanced data,” IEEE Trans. Knowl. Data Eng., vol. 21, no. 9, pp. 1263–1284, 2009. doi: 10.1109/TKDE.2008.239. [Google Scholar] [CrossRef]
12. R. Barandela, R. M. Valdovinos, J. S. Sanchez, and F. J. Ferri, “The imbalanced training sample problem: Under or over sampling?” Struct. Syn. Stat. Pattern Recognit., pp. 806–814, 2004. [Google Scholar]
13. N. Ofek, L. Rokach, R. Stern, and A. Shabtai, “Fast-CBUS: A fast clustering-based undersampling method for addressing the class imbalance problem,” Neurocomputing, vol. 243, no. 2–3, pp. 88–102, 2017. doi: 10.1016/j.neucom.2017.03.011. [Google Scholar] [CrossRef]
14. N. V. Chawla, K. W. Bowyer, L. O. Hall, and W. P. Kegelmeyer, “SMOTE: Synthetic minority oversampling technique,” J. Artif. Intell. Res., vol. 16, no. 1, pp. 321–357, 2002. doi: 10.1613/jair.953. [Google Scholar] [CrossRef]
15. H. Han, W. Wang, and B. Mao, “Borderline-SMOTE: A new over-sampling method in imbalanced data sets learning,” in Proc. of ICIC, Hefei, China, 2005, pp. 878–887. [Google Scholar]
16. H. He, Y. Bai, E. A. Garcia, and S. Li, “ADASYN: Adaptive synthetic sampling approach for imbalanced learning,” in Proc. IEEE Int. Joint Conf. Neural Netw. (IEEE World Congr. Comput. Intell.), Hong Kong, China, 2008, pp. 1322–1328. [Google Scholar]
17. S. Barua, M. M. Islam, X. Yao, and K. Murase, “MWMOTE-majority weighted minority oversampling technique for imbalanced data set learning,” IEEE Trans. Knowl. Data Eng., vol. 26, no. 2, pp. 405–425, 2014. doi: 10.1109/TKDE.2012.232. [Google Scholar] [CrossRef]
18. L. Xu, M. Y. Chow, and L. S. Taylor, “Power distribution fault cause identification with imbalanced data using the data mining-based fuzzy classification $E$-algorithm,” IEEE Trans. Power Syst., vol. 22, no. 1, pp. 164–171, 2007. doi: 10.1109/TPWRS.2006.888990. [Google Scholar] [CrossRef]
19. S. Alshomrani, A. Bawakid, S. O. Shim, A. Fernández, and F. Herrera, “A proposal for evolutionary fuzzy systems using feature weighting: Dealing with overlapping in imbalanced datasets,” Knowl. -Based Syst., vol. 73, no. 5, pp. 1–17, 2015. doi: 10.1016/j.knosys.2014.09.002. [Google Scholar] [CrossRef]
20. A. Fernández, S. García, M. J. del Jesus, and F. Herrera, “A study of the behavior of linguistic fuzzy rule based classification systems in the framework of imbalanced data-sets,” Fuzzy Sets Syst., vol. 159, no. 18, pp. 2378–2398, 2008. doi: 10.1016/j.fss.2007.12.023. [Google Scholar] [CrossRef]
21. S. Liu, J. Zhang, Y. Xiang, and W. Zhou, “Fuzzy-based information decomposition for incomplete and imbalanced data learning,” IEEE Trans. Fuzzy Syst., vol. 25, no. 6, pp. 1476–1490, 2017. doi: 10.1109/TFUZZ.2017.2754998. [Google Scholar] [CrossRef]
22. H. Jiang, Y. Chen, L. Kong, G. Cai, and H. Jiang, “An LVQ clustering algorithm based on neighborhood granules,” J. Intell. Fuzzy Sys., vol. 43, no. 5, pp. 6109–6122, 2022. doi: 10.3233/JIFS-220092. [Google Scholar] [CrossRef]
23. J. Chen, Q. Hu, X. Xue, M. Ha, and L. Ma, “Support function machine for set-based classification with application to water quality evaluation,” Inf. Sci., vol. 388–389, no. 8, pp. 48–61, 2017. doi: 10.1016/j.ins.2017.01.001. [Google Scholar] [CrossRef]
24. J. Demšar, “Statistical comparisons of classifiers over multiple data sets,” J. Mach. Learn. Res., vol. 7, pp. 1–30, 2006. [Google Scholar]
Cite This Article
 Copyright © 2024 The Author(s). Published by Tech Science Press.
This work is licensed under a Creative Commons Attribution 4.0 International License , which permits unrestricted use, distribution, and reproduction in any medium, provided the original work is properly cited.
 Downloads
 Citation Tools