
 Submit a Paper
 Propose a Special lssue
 Open Access
ARTICLE

Exploring Multi-Task Learning for Forecasting Energy-Cost Resource Allocation in IoT-Cloud Systems
1 Department of Computer Engineering and Information, College of Engineering, Prince Sattam Bin Abdulaziz University, Wadi Al-Dawasir, 11991, Saudi Arabia
2 Department of Computer Engineering, College of Computer Science and Engineering, Taibah University, Madinah, 42353, Saudi Arabia
3 Department of Creative Technologies, Air University Islamabad, Islamabad, 44000, Pakistan
* Corresponding Author: Mohammad Aldossary. Email:
Computers, Materials & Continua 2024, 79(3), 4603-4620. https://doi.org/10.32604/cmc.2024.050862
Received 20 February 2024; Accepted 22 April 2024; Issue published 20 June 2024
 View Full Text
 Download PDF
Abstract
Cloud computing has become increasingly popular due to its capacity to perform computations without relying on physical infrastructure, thereby revolutionizing computer processes. However, the rising energy consumption in cloud centers poses a significant challenge, especially with the escalating energy costs. This paper tackles this issue by introducing efficient solutions for data placement and node management, with a clear emphasis on the crucial role of the Internet of Things (IoT) throughout the research process. The IoT assumes a pivotal role in this study by actively collecting real-time data from various sensors strategically positioned in and around data centers. These sensors continuously monitor vital parameters such as energy usage and temperature, thereby providing a comprehensive dataset for analysis. The data generated by the IoT is seamlessly integrated into the Hybrid TCN-GRU-NBeat (NGT) model, enabling a dynamic and accurate representation of the current state of the data center environment. Through the incorporation of the Seagull Optimization Algorithm (SOA), the NGT model optimizes storage migration strategies based on the latest information provided by IoT sensors. The model is trained using 80% of the available dataset and subsequently tested on the remaining 20%. The results demonstrate the effectiveness of the proposed approach, with a Mean Squared Error (MSE) of 5.33% and a Mean Absolute Error (MAE) of 2.83%, accurately estimating power prices and leading to an average reduction of 23.88% in power costs. Furthermore, the integration of IoT data significantly enhances the accuracy of the NGT model, outperforming benchmark algorithms such as DenseNet, Support Vector Machine (SVM), Decision Trees, and AlexNet. The NGT model achieves an impressive accuracy rate of 97.9%, surpassing the rates of 87%, 83%, 80%, and 79%, respectively, for the benchmark algorithms. These findings underscore the effectiveness of the proposed method in optimizing energy efficiency and enhancing the predictive capabilities of cloud computing systems. The IoT plays a critical role in driving these advancements by providing real-time data insights into the operational aspects of data centers.Keywords
Cloud computing has gained popularity as a storage option in the age of rapidly developing technology, providing businesses with the opportunity to reduce hardware and acquisition costs [1]. The need for data centers has grown significantly as a result of this change, which is being caused by the exponential expansion in data consumption. However, rising demand for data centers comes at a price: These establishments currently account for a sizeable 3% of global energy usage. The logistics industry is carefully investigating how distributed computing, virtualization, and the IoT could boost efficiency as companies navigate this new environment.
Virtualized servers utilize up to 30% of their available resources, whereas non-virtualized servers’ function at a meager 6%–15% of their capability [2]. Data center operators intentionally distribute their facilities over many sites to guarantee dependability, employing replication techniques to ensure smooth operations. The integration of IoT sensors in data centers becomes imperative to actively monitor critical parameters like energy usage and temperature, providing a comprehensive dataset for informed decision-making. Researchers are addressing the need for sustainable practices in the face of swift advancements in technology [3]. They investigate various methods, such as determining the cost of installing servers in various places and arranging nodes and data transmission routes optimally. Energy forecasting and model planning are critical applications of machine learning, which uses techniques like random forest, naive bayes, and decision trees. The utilization of IoT-generated real-time data seamlessly integrated into machine learning models enhances the accuracy of predictions and aids in optimizing energy efficiency.
Large-scale cloud data center construction is becoming increasingly prevalent in the logistics sector, where big data, cloud computing, and the Internet of Things (IoT) play pivotal roles. However, the high energy consumption associated with these institutions poses a significant environmental challenge. Scholars are currently exploring various approaches to mitigate energy usage while maintaining peak efficiency and reliability. One area of research focuses on Virtual Machine (VM) consolidation, which seeks to reduce energy consumption by consolidating idle virtual machines onto fewer servers. Despite its potential benefits, the effectiveness of this approach varies depending on the nature of the workload and may encounter challenges in unforeseen circumstances [4].
Another innovation aimed at reducing energy consumption in data centers is Dynamic Voltage and Frequency Scaling (DVFS), which adjusts processor voltage and frequency in real-time. However, accurately evaluating the characteristics of each workload remains a challenging task. Energy-efficient job arranging seeks a balance between resource needs and utilization reduction. Suggested algorithms include particle swarm optimization and genetic algorithms [5]. Researchers investigate innovative uses such as distributed fault-tolerant storage, VM consolidation, energy-conscious task organization, and learning algorithms for data centers in clouds that are adaptable. By using the linkages between handling resources and energy price estimation activities, multi-task learning in conjunction with IoT is a viable method for improving performance [6]. The development of novel energy-saving strategies becomes critical given the increasing need for computing services. In the face of fluctuating deregulated energy costs, cloud providers, entrusted with achieving government requirements and profit objectives via service level agreements, oversee the intricacies of energy utilization [7]. To lower data center operating costs and take advantage of energy price variations, researchers are investigating Machine Learning (ML) techniques.
In this work, we have developed a complete framework intended to improve data center energy efficiency and save power costs by integrating incoming IoT data strategically. Our study is a leading contribution to the area as it highlights how important IoT-generated data is to enhancing data center operating efficiency and obtaining a significant reduction in power costs.
1. IoT-driven data integration: Our work stands out for actively integrating IoT data through strategically placed sensors around data centers. This unique approach allows us to monitor energy usage and temperature, providing a foundational basis for optimizing energy efficiency and elevating predictive capabilities.
2. Innovative Hybrid TCN-GRU-NBeat (NGT) model: We present the NGT model, a novel framework adept at handling diverse data and optimizing storage in data center environments. By seamlessly integrating TCN, GRU, and N-Beat capabilities, NGT emerges as a powerful solution for efficient data processing.
3. Optimization with Seagull Optimization Algorithm (SOA): Notably, we fine-tune NGT parameters using SOA. This optimization process maximizes the potential of incoming IoT data, significantly enhancing NGT’s performance in data centers, forecasting, and electricity consumption reduction.
4. Exceptional performance results: Through active IoT monitoring and NGT data processing, our approach achieves a remarkable 2.83% reduction in MAE error and a 5.33% reduction in MSE error. This translates to an impressive 24.87% average reduction in electricity expenses. Importantly, these outcomes surpass existing literature models by 10% to 15%, validating the efficacy of our proposed methodology in optimizing energy efficiency and predictive capabilities.
Energy consumption and its environmental impact have become a growing concern, driven by the increasing focus on sustainability across various industries. This study provides a concise review of previous approaches to electricity demand prediction, acknowledging their limitations and aiming to overcome them through the application of a Neural Network with Multi-Layer (MLNN) model [8]. The study utilizes an ensemble method, combining several ML models to improve the precision of power load and total consumption of electricity projections in logistics processes by utilizing the capabilities of the IoT. The IoT-based method has issues with lengthier processing cycles and notable loss rates in actual testing, despite its competitive accuracy.
In a hybrid approach named EPNet, combining Convolutional Neural Network (CNN) and Long Short Term Memory (LSTM) models, presented in [9], energy price prediction is explored with a reliance on the IoT infrastructure. While the models required substantial processing power for real-time predictions and exhibited significant error rates, they produced favorable outcomes. However, the model’s applicability to real-time data was limited due to extensive dataset standardization. Another model in [9], incorporating support vector regression with various optimization techniques, reported a 6.82 MAE but faced significant computational costs and limited reliability for forecasts beyond one day. In [10], an assessment of methods that use deep learning for calculating electricity and green energy consumption was carried out. Although the results were competitive, the real-time applications resulted from high computational costs and testing losses. An inventive hybrid strategy for electricity price forecasting, merging SVM and Kernel Principal Component Analysis (KPCA), showed promise with low error rates [11]. However, its application to large datasets posed challenges and incurred substantial processing costs.
In the logistics area, the suggested approach considers seasonal and regional fluctuations in energy costs, utilizing NN-based and autoencoder models, as well as location-specific data gathering [12]. Harnessing the capabilities of the IoT, despite promising results, sophisticated deep learning methods discussed in [13] face challenges with relatively high MAE and MSE values, leaving room for improvement. A model in [14] employed dimension reduction to overcome over-fitting issues but encountered difficulties in accurately estimating electricity costs. Strategies including DVFS and the relocation of inactive VMs on lesser number of servers are used in the pursuit of energy-efficient cloud data centers [15]. Nevertheless, there are issues with these methods, such is the curvilinear link that connects the workload’s rate and voltage parameters.
With multi-task learning showing potential to enhance accuracy and efficiency, researchers explore ML-based techniques for cutting energy use [16]. Feature selection-focused models, like the one, achieved an MAE of 3.18 but were limited to offline prediction using a large dataset.
Studies combining power cost estimation and energy demand prediction with different algorithms, such as Artificial Bee Colony and SVM [17], weighted kernel hybrid methodology [18], and Artificial NN based strategy [19], have embraced the integration of the IoT in their methodologies. These studies, while advancing the field, encountered challenges like computational costs, imprecise forecasts, and inefficiency for real-time applications. Despite the abundance of research on energy price prediction, most existing approaches are not computationally cost-effective for real-time application and struggle to yield good results for the entire market with low error rate. Researchers emphasize the need for ongoing research to precision improvement, effectiveness, and application of energy consumption forecasting models in real-time scenarios [20].
3 Theoretical Framework and Methodological Approach
This section encapsulates the core concepts that underpin our research projects, elucidating the systematic approaches employed in conducting our investigations. The theoretical foundations serve as guiding principles, facilitating our comprehension as we delve into the realms of cloud computing, virtualization, content distribution delivery networks, intelligent systems, and the IoT. Simultaneously, our methodology delineates the techniques applied to unravel the intricacies inherent in these technological fields, as illustrated in Fig. 1.
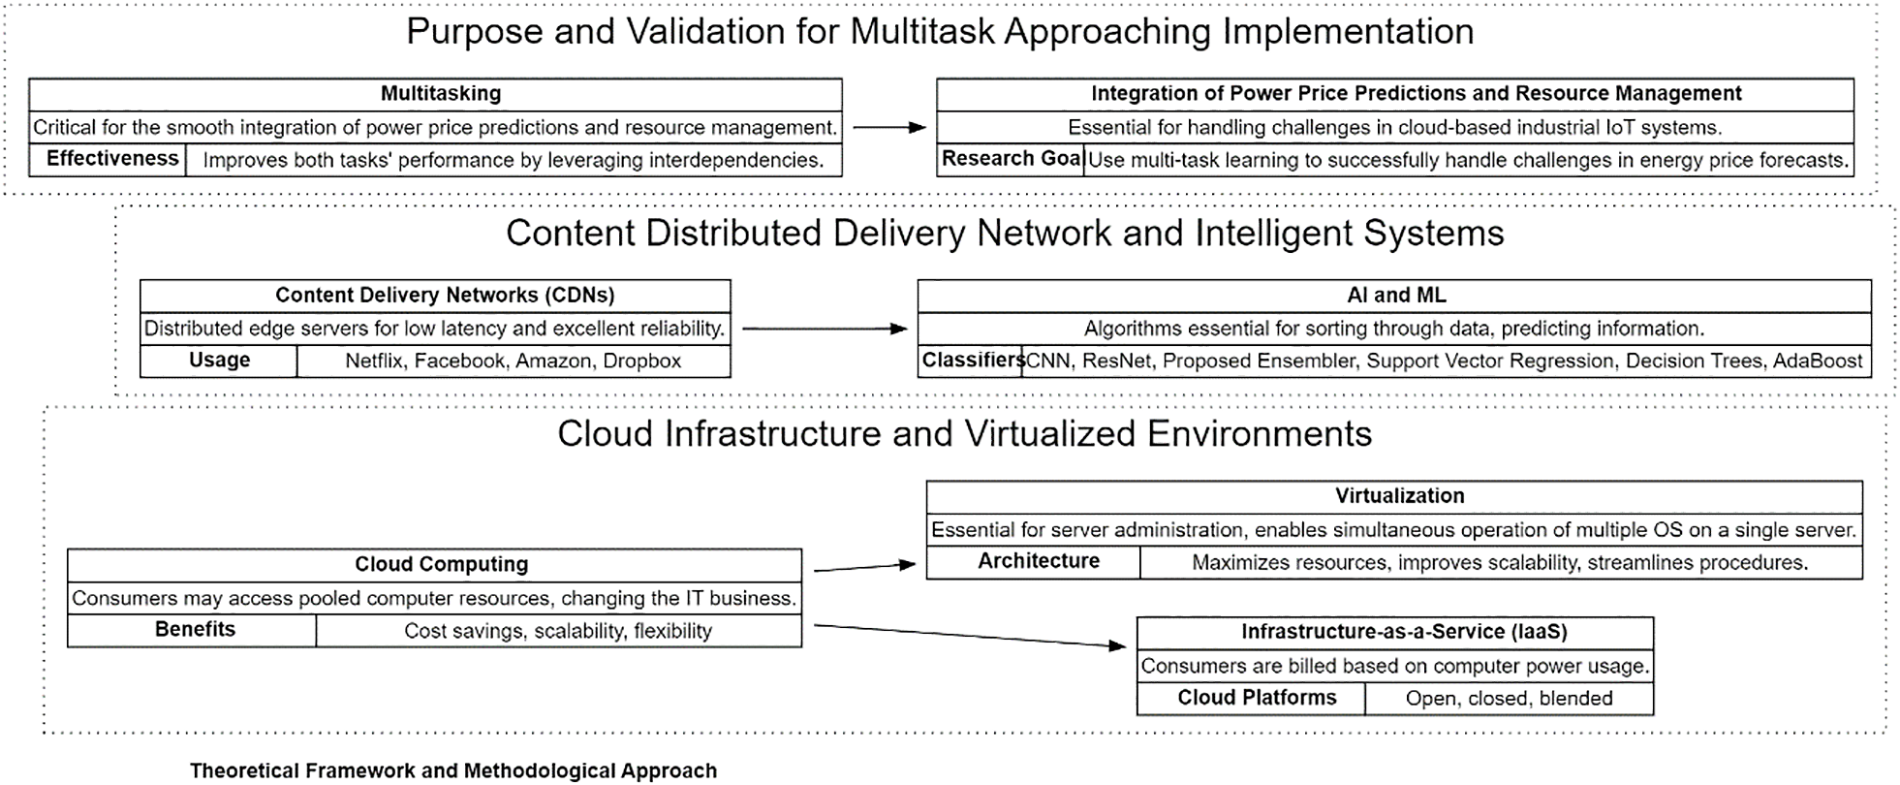
Figure 1: Theoretical framework: a visual representation
3.1 Cloud Infrastructure and Virtualized Environments
With cloud computing, users can access pooled computing resources, revolutionizing the IT industry. This paradigm enables rapid allocation and deallocation of resources with minimal management overhead. Departing from the traditional reliance on local servers, cloud computing offers on-demand access to configurable resources, resulting in cost savings, scalability improvements, and enhanced flexibility in resource allocation [21]. This shift in focus from capital expenditures to pay-as-you-go models based on actual usage contributes to reduced server expenses. Furthermore, the integration of the Internet of Things (IoT) further amplifies the transformative potential of cloud computing in the modern technological landscape. To meet the demands of today’s data-driven businesses, data center organizations must continuously enhance their processing capabilities, software programs, and data processing capabilities while incorporating IoT functionalities to keep pace with evolving technological demands. The integration of IoT and cloud computing, particularly in Infrastructure as a Service (IaaS), revolutionizes infrastructure management. IaaS billing is tied to computing power usage, and various cloud platforms, such as open, closed, and mixed types (e.g., VMware and Nutanix), offer diverse infrastructure approaches [22]. Mixed-data centers, blending private and public cloud services, demonstrate efficiency by seamlessly integrating resources. Hybrid data centers, which integrate IoT with shared and private clouds, enhance data processing and communication. In shared data centers, where multiple organizations utilize shared resources, IoT optimizes resource allocation with real-time usage data, promoting efficient sharing. In private data centers dedicated to a single organization, IoT enhances security, monitors equipment health, and optimizes energy usage, thereby improving overall performance. Hybrid data centers, combining shared and private elements, benefit from IoT’s comprehensive approach, enabling seamless communication and data processing across the hybrid environment [23,24]. This results in an adaptive, efficient model that combines the advantages of both setups.
Virtualization streamlines server management by allowing multiple operating systems to run concurrently, thereby improving efficiency. Collaborative IoT integration into the NGT model optimizes energy efficiency and resource allocation in cloud computing, leading to significant cost reductions. The IoT’s role involves collecting real-time data from strategically placed sensors to inform decisions, enhancing predictive capabilities, and optimizing energy usage.
3.2 Content Distributed Delivery Network (CDN), Intelligent Systems, and Multi-Task Approaching Implementation
Content Distributed Delivery Network (CDN) and Intelligent Systems: CDNs are integral for optimizing data delivery, strategically placing edge servers to reduce latency and enhance reliability. Major platforms like Netflix and Amazon leverage CDNs, efficiently managing bandwidth costs through clever algorithms. In cloud-based industrial IoT systems, integrating power price predictions and resource management is crucial. Multi-tasking proves beneficial, enhancing performance by collaboratively addressing dependencies, reducing training time, computing complexity, and improving resilience [25]. The research focuses on leveraging multi-task learning to navigate energy price forecast complexities in cloud-based industrial IoT systems, demonstrating its effectiveness in handling real-world occurrences. The study explores integrating ML and deep learning skills in cloud computing to anticipate future electricity prices and improve energy management. Neural network classifiers and primary ML classifiers are evaluated, highlighting the potential of Artificial Intelligence (AI) and ML techniques in addressing challenges in diverse scenarios.
This section discusses the application of forecasting methods for hourly and day-ahead power price forecasting, employing single and hybrid models, as illustrated in Fig. 2. The Nord Pool spot market, a crucial data source, provides hourly time series data, collected through IoT devices [26]. An in-depth data examination focuses on understanding information properties, with a particular emphasis on insights derived from IoT-generated data. The testing and training process involves meticulous data selection, incorporating the enriched dataset from IoT sources. Various ML models, both single and hybrid, are deployed for evaluation, leveraging IoT-enhanced data to enhance model robustness. Section 4 briefly covers the study of each model, highlighting the pivotal role of IoT-generated data in advancing power price forecasting accuracy.
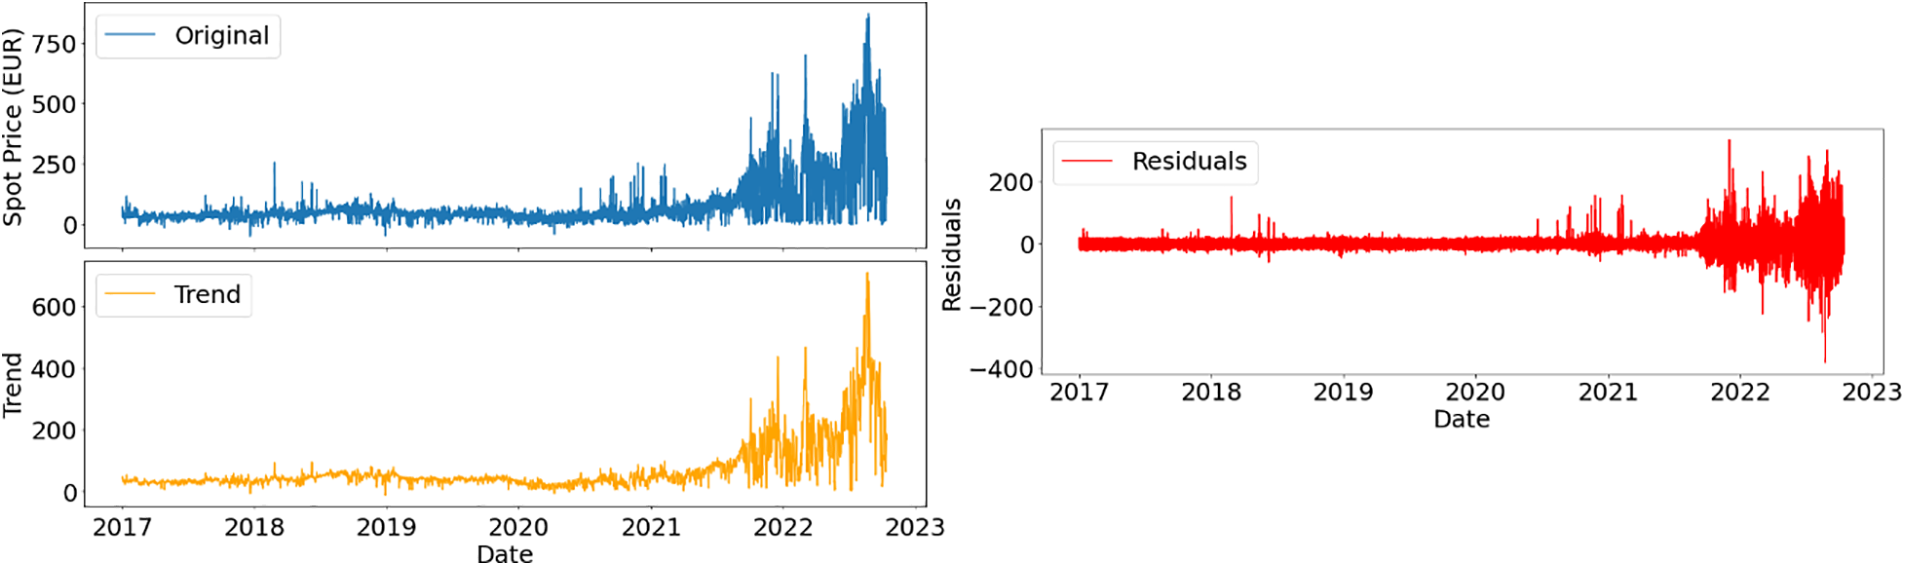
Figure 2: Data components of the time series data used
4.1 Dataset Description (Time Series Price Data)
The dataset under consideration, crucial for energy price forecasting (EPF) in Denmark and surrounding nations, is acquired through IoT devices, enhancing its relevance and richness. It adheres to a time series structure, with consecutive observations grouped chronologically at regular intervals, such as hourly or daily readings. Fig. 2 portrays the decomposition of a time series dataset representing spot prices in Euros (EUR) into its essential components: Trend and residuals. At the top of the plot, the original time series data is depicted, showcasing the observed spot prices over time without any decomposition. This visual representation offers insights into the fluctuations in spot prices across different periods. Moving to the middle plot, the trend component is illustrated. This component reflects the underlying long-term behavior or tendency in the data, smoothing out short-term fluctuations to reveal the overall direction of spot prices over time. In the bottom plot, the residuals are displayed. These residuals capture the variability or randomness in the original data after removing the trend and any seasonal patterns, highlighting the unexplained fluctuations or noise present in the dataset. By examining these residuals, analysts can gain deeper insights into the random elements influencing spot price fluctuations.
The historical time series dataset encompasses hourly averages of day-ahead spot prices in both DKK and EUR, with timestamps presented in Danish and UTC time zones. Geographical boundaries, categorized by pricing regions (DK1 and DK2) based on the Great Belt, make this dataset notable [26,27]. Its significance lies in its pivotal role in EPF, influencing decisions within the energy industry over the last fifteen years. The dataset elements encompass Hour DK and Hour UTC, representing time intervals in Danish and UTC time zones, respectively, and the integration of IoT data further enriches its potential applications in energy analytics and forecasting.
These prices represent the fragile equilibrium between demand and supply in the market. This dataset is a significant source for in-depth analysis of time series and multivariate single and multistep power price forecasting because it has a huge count of 50,000 instances. The abundance of cases opens the possibility to a thorough investigation of patterns, developments, and variances, providing a deep understanding of the dynamic retail energy market environment.
N-Beats Component: The N-Beats component is constructed as a collection of fully connected blocks, each adept at capturing diverse temporal patterns across different time scales. The core equation governing the output of a single block is articulated as follows [28]:
where,
In essence, the N-Beats component exhibits a modular and adaptive structure, with each block contributing to the overall prediction by capturing patterns specific to different temporal contexts. This adaptability makes the N-Beats component highly effective for forecasting tasks in time series analysis.
Gated Recurrent Unit (GRU) Component : A particular kind of Recurrent Neural Network (RNN) called the GRU is made to successfully capture temporal relationships while overcoming issues like vanishing gradients and computing efficiency. The GRU achieves this through the incorporation of an update gate, a reset gate, and a memory cell, facilitating a dynamic balance between retaining past information and adapting to new input [29].
Update Gate
Reset Gate
New Memory Content
Update State_Hidden
This equation illustrates how the GRU selectively updates and retains information over sequential data, with the weight matrices WU, WR and WM being trainable parameters optimized during the training process to enhance the model’s performance on specific tasks.
TCN Component: At the core of the NGT model lies the Temporal Convolutional Network (TCN), a crucial component that utilizes causal dilated convolutions for robust temporal dependency modeling. The TCN generates the output
where ReLU introduces non-linearity through the Rectified Linear Unit (ReLU) activation function.
• Convolution Operation (∗): This operation involves sliding a filter (
• Number of Layers (L): L signifies the depth or the count of convolutional layers within the TCN. Each layer captures distinct levels of temporal information.
• Learnable Convolutional Filters (
• Dilation Factors (
The TCN component amplifies the NGT model’s proficiency in modeling prolonged dependencies, capturing intricate temporal patterns in input data. Thoughtful adjustments to dilation factors and the layer count contribute to the model’s prowess in understanding temporal dynamics, offering adaptability across diverse time series forecasting scenarios.
Integrated NGT Model (A Fusion of Strengths): The Integrated NGT model brings together three powerful components—N-Beats, GRU and TCN—to create a robust forecasting framework for electricity prices. This integration is a strategic decision aimed at harnessing the unique strengths of each component.
• N-Beats Contribution: In the energy price period series, the N-Beats component performs exceptionally well at identifying relationships over time and worldwide trends. Its predictions
• GRU’s Temporal Insights: GRU, focusing on temporal dynamics, provides contextual information through its hidden state (
• TCN’s Local Feature Extraction: TCN, with its strong ability to extract local features, contributes the output (
The integration function, denoted as
Crucial Benefits of Integration: The success of integrated NGT lies in its ability to capture a broad spectrum of patterns. This integration allows the model to address both overarching trends and subtle local features, leading to superior forecasting performance. The integrated NGT model stands as a testament to the power of integration, combining diverse components into a unified and potent forecasting tool. This model is designed to provide accurate and robust predictions for electricity price forecasting.
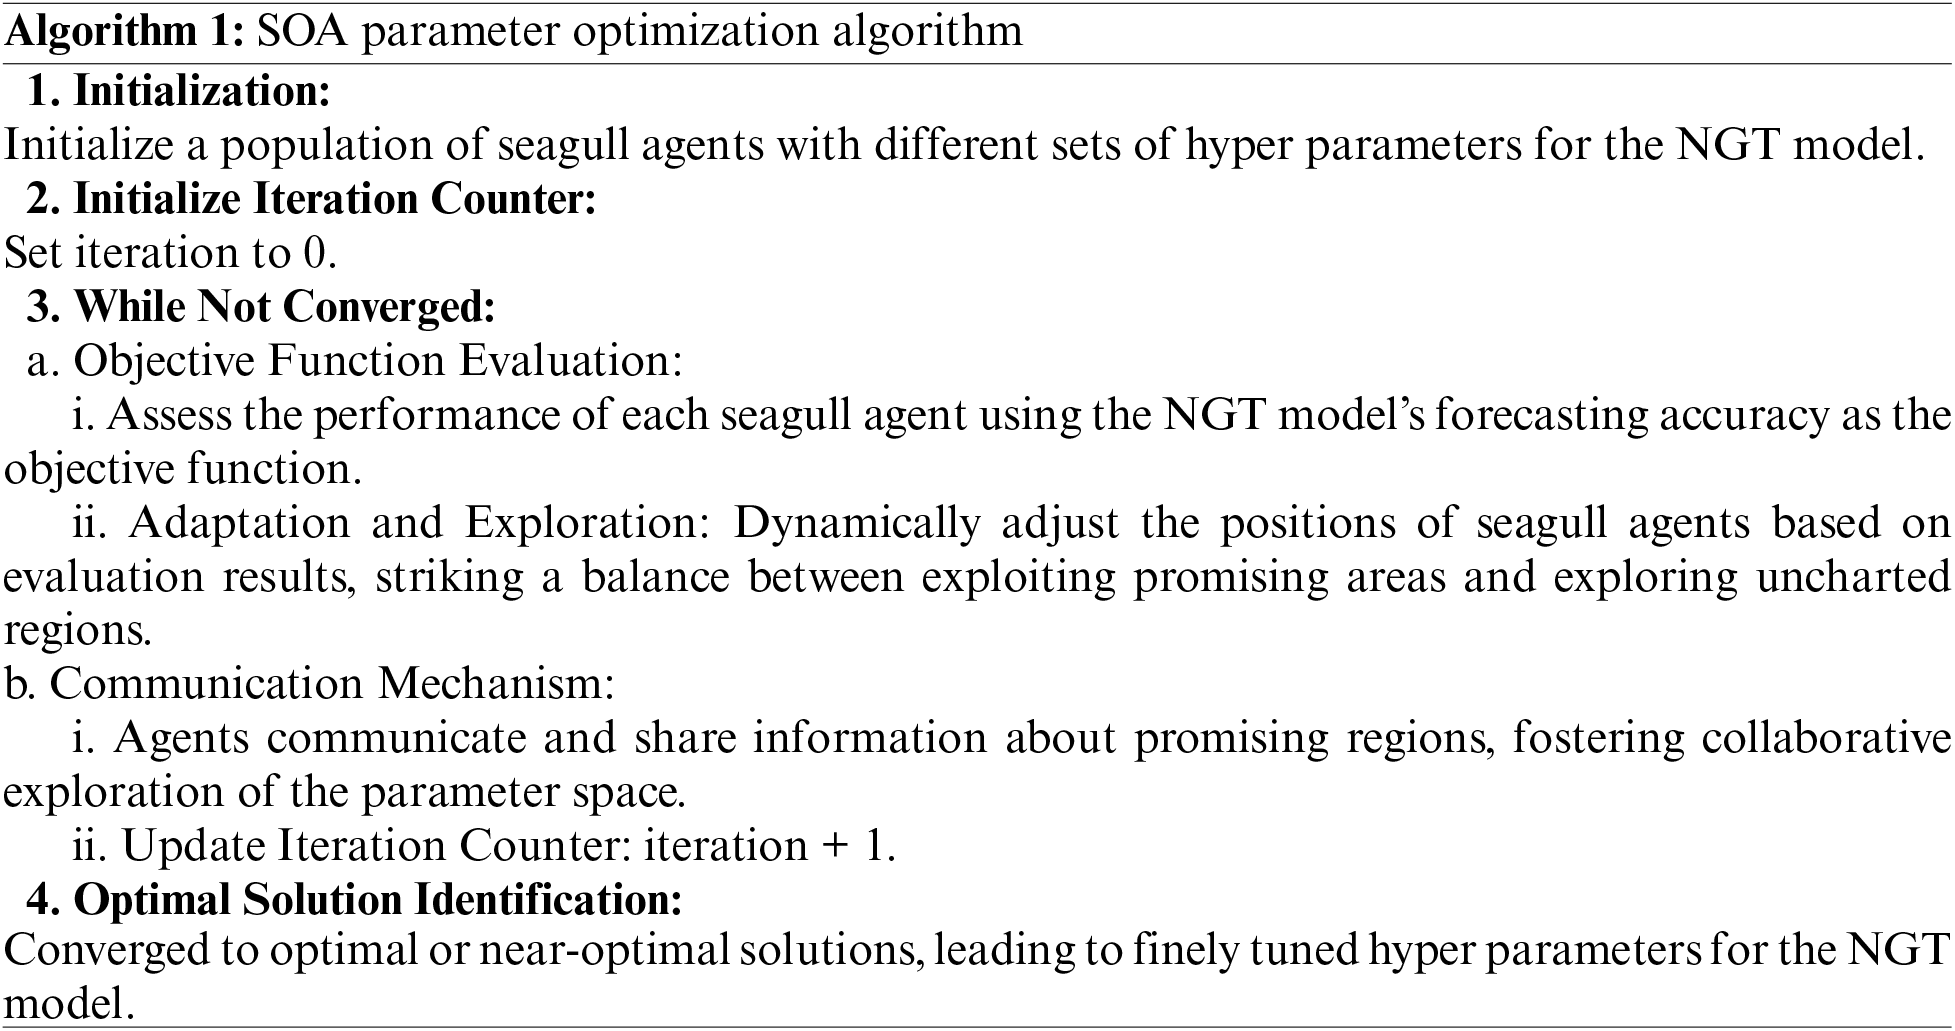
4.4 Optimizing Parameters with Seagull Optimization Algorithm (SOA)
In our integrated NGT model, fine-tuning hyperparameters and optimizing parameters are crucial for peak forecasting performance. The SOA [15], inspired by seagulls’ foraging behavior, excels in navigating intricate solution spaces, proving effective in various optimization tasks. SOA mimics seagulls’ strategic foraging, adapting search patterns based on resource availability. Integrated with the NGT model, SOA becomes vital in exploring the hyperparameter space, employing a population of seagull agents to represent potential solutions, as in Algorithm 1.
4.5 Benefits of SOA in Parameter Optimization
• Global Search Capability: SOA’s exploration strategy enables a global search in the hyper parameter space, avoiding local minima.
• Adaptability: The approach to searching of the algorithm is continually adjusted, enabling it to explore complicated and dynamic solution spaces with efficiency.
• Convergence Speed: SOA often demonstrates faster convergence to optimal solutions compared to traditional optimization algorithms.
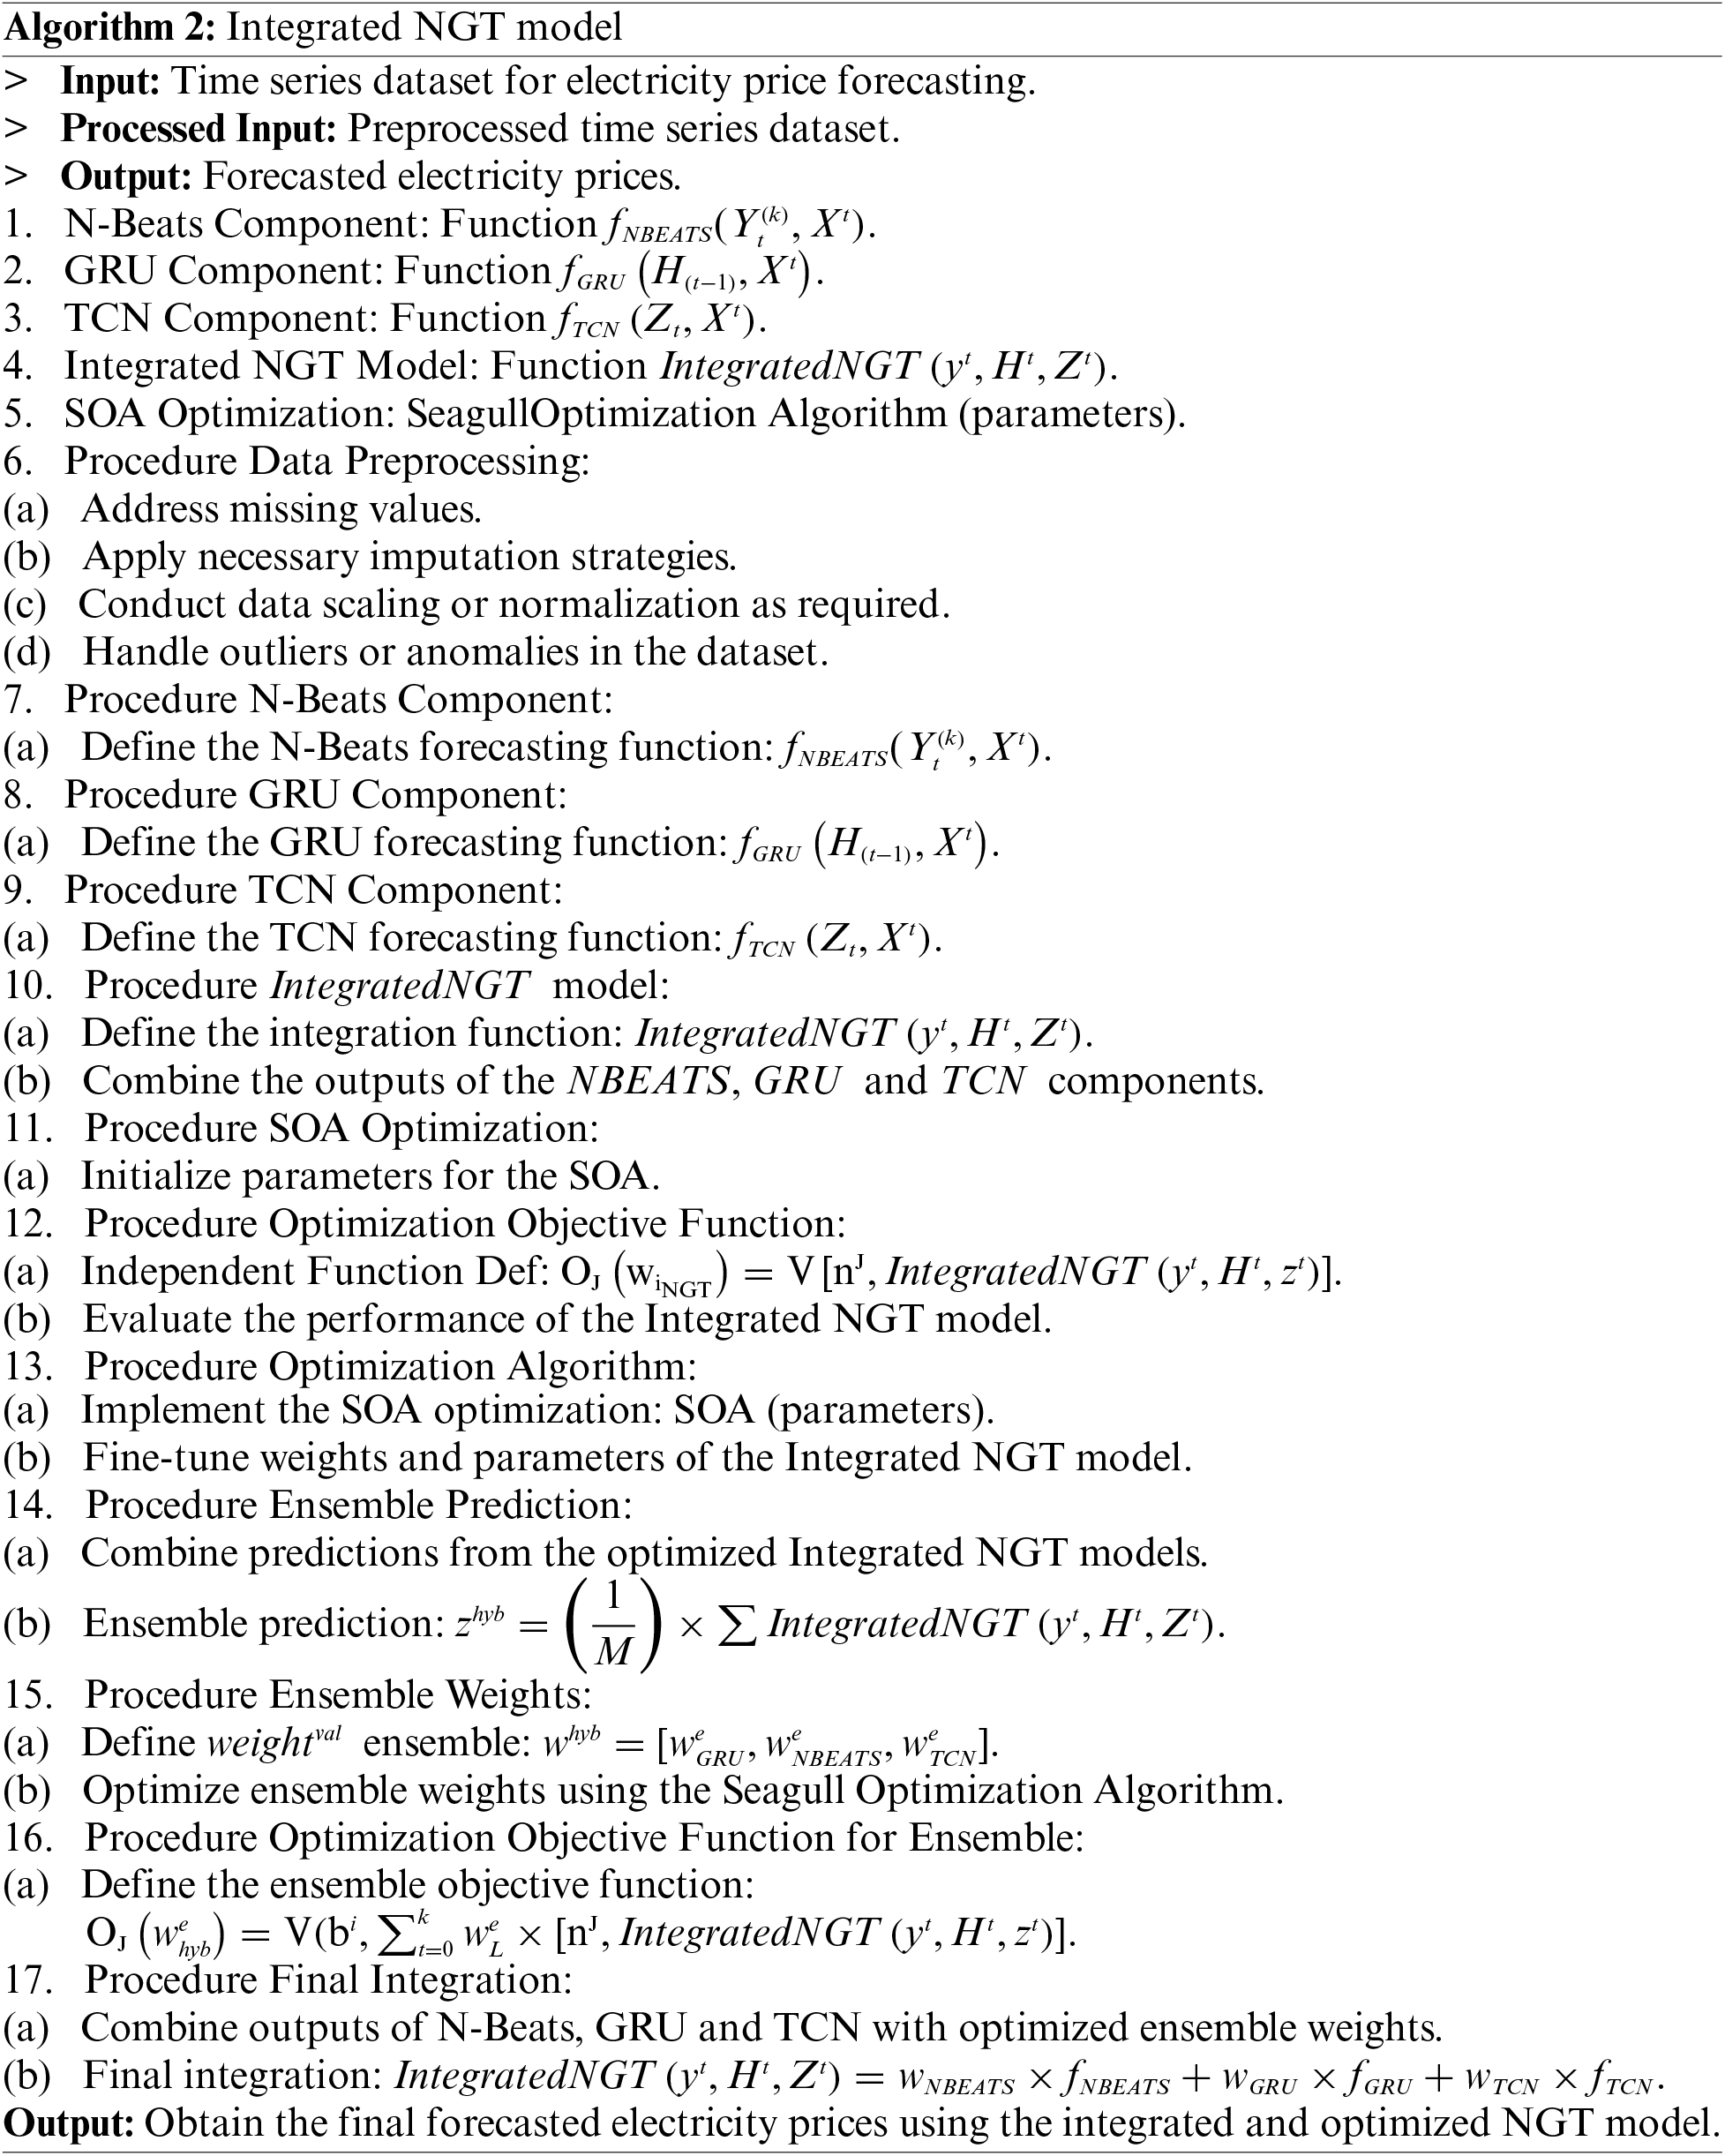
The incorporation of the Seagull Optimization Algorithm (SOA) in parameter optimization enhances the overall performance of the NGT model, contributing to its accuracy and robustness in electricity price forecasting. The proposed framework process is shown in Algorithm 2.
5 Cost-Effective Data Center Management
This paper examines, considering varying node measurements, the economic value of capacity discharge to nodes inside one data center system. Data downloads to nodes are constantly more economical than other options, as demonstrated by hourly energy cost analysis. Updates to the model can be accommodated by adding additional data sources, such as message traffic from widely utilized social networks. Using a cell phone as an input device, the technique mimics real-world settings; Fig. 3 illustrates the framework’s cost-effective setup and adaptability.
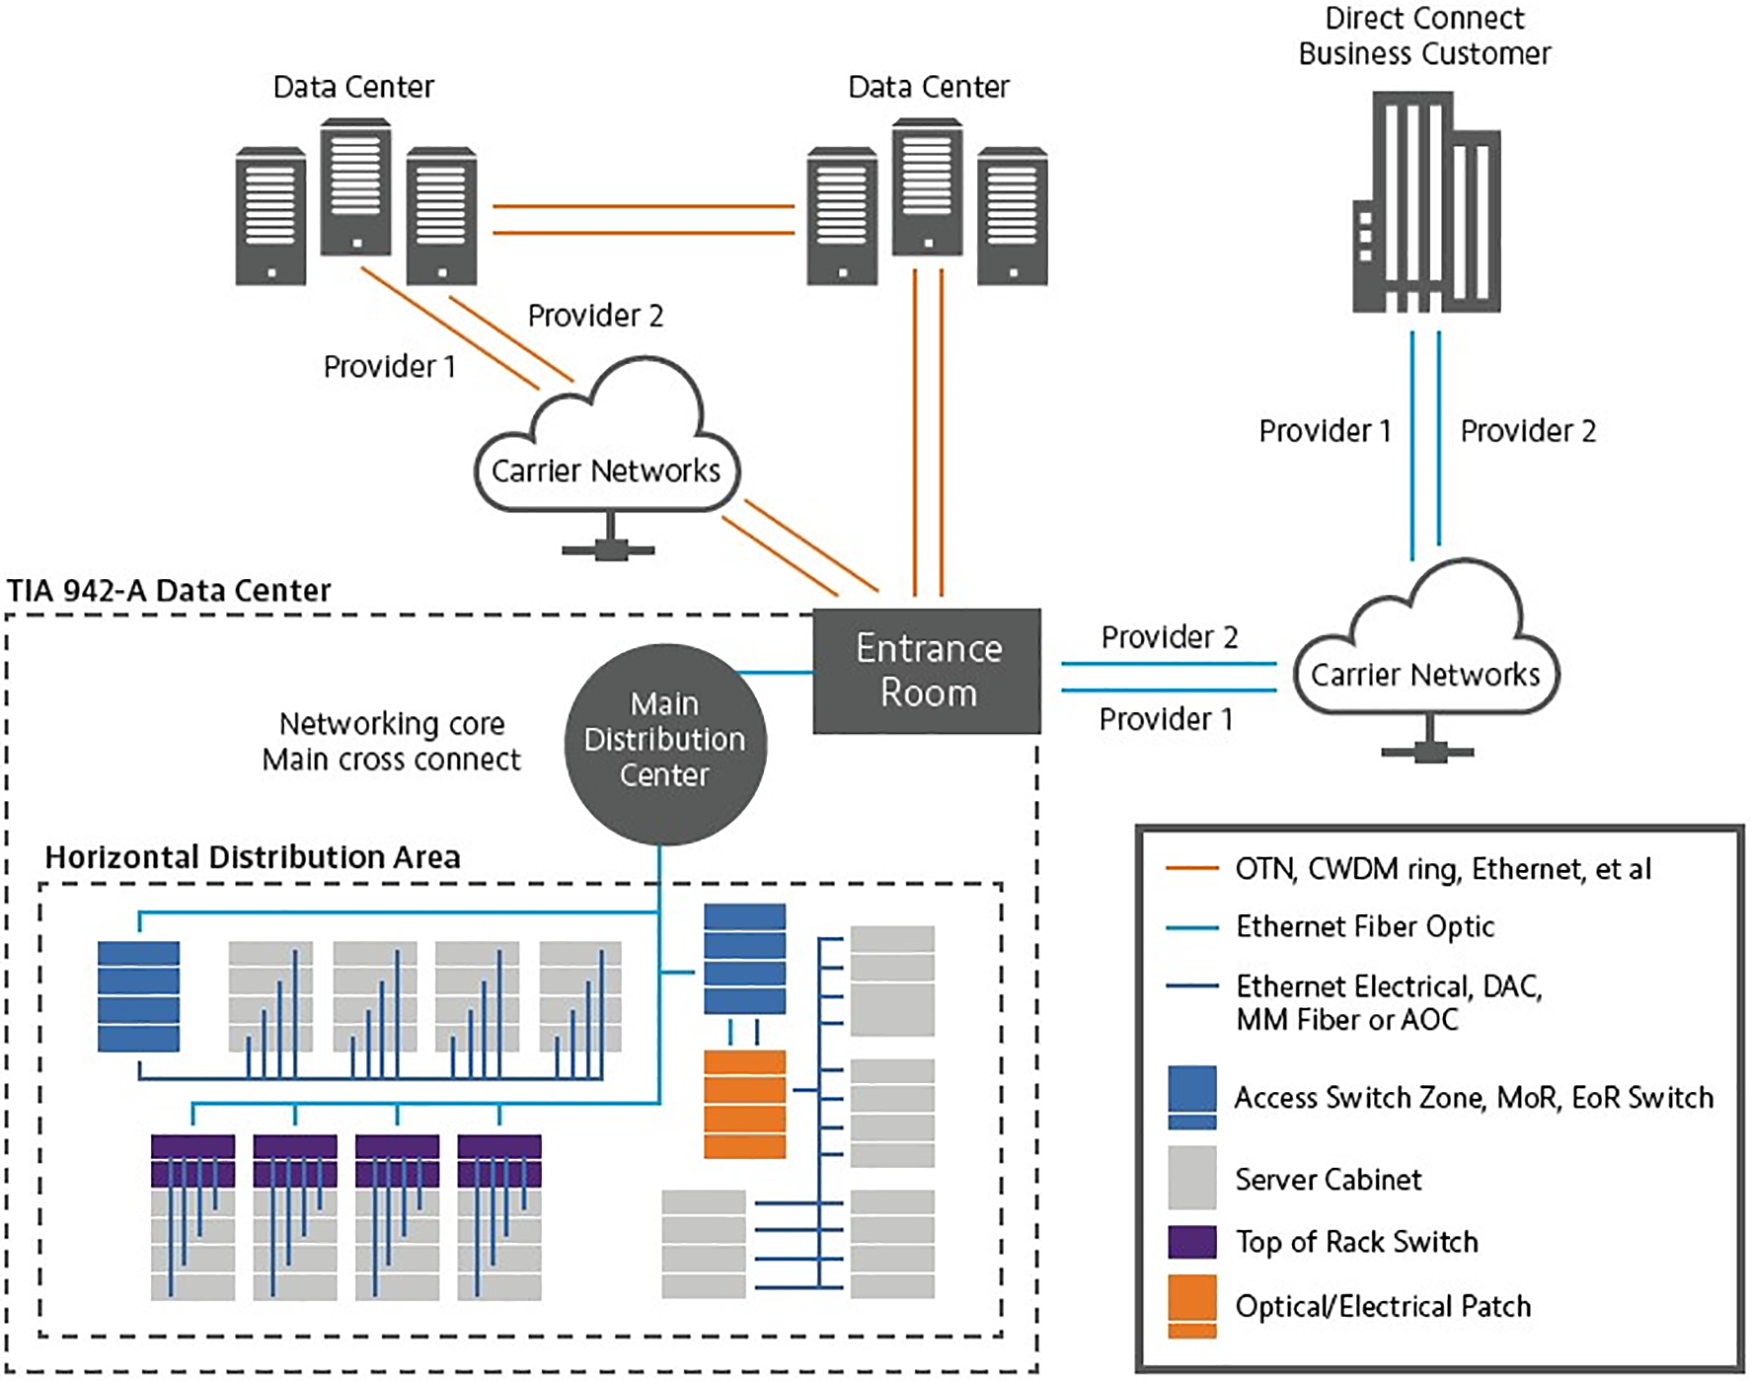
Figure 3: Interconnection of data centers on cloud
Eq. (7) describes constraints related to server data storage capacity and offloading data volume to nodes, considering integer and decimal values, respectively. Eq. (8) represents the objective function for minimizing overall costs, ensuring the server data storage capacity matches predefined values. Constraints involve offloading data to nodes with specified integer (
The energy usage of a server every hour per P2 space on the server is represented by the symbol Γ in Eq. (9), where electricity denotes the modified cost in EUR. To make comparisons with the hourly price of electricity in EUR/MWh easier, Γ is converted to EUR/Wh.
A set of metrics and visuals is employed in the performance assessment for the regression analysis conducted on time series information to gauge the forecasting models’ accuracy and efficacy. The goal is to assess the models’ ability to accurately represent the temporal trends and variances in the power price time series. The performance evaluation metrics are shown in Fig. 4.
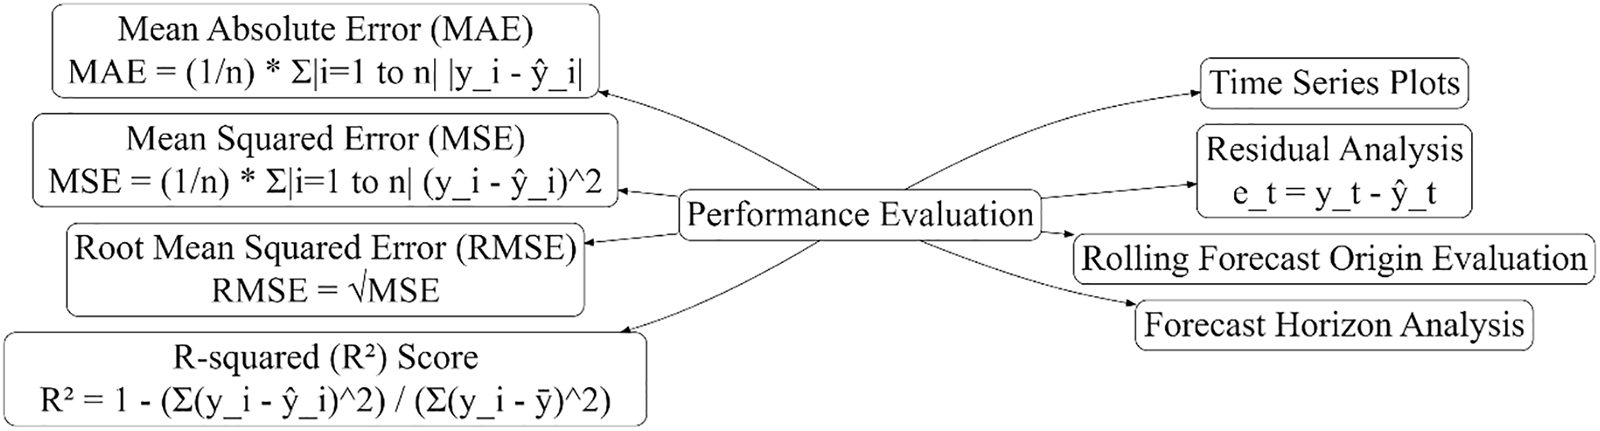
Figure 4: Performance metrics formulas used for evaluation the proposed model
This section details the analysis conducted to achieve the stated objective and describes the comprehensive experimental setup. The experiments executed using Python on the Google Colab platform aimed to assess the efficiency of parallel execution of task for resource management and power price predictions in fog based industrialized mechanism with IoT real-time data. Employing a time series dataset from Nord Pool Spot market data, with 50,000 instances of hourly power price observations in DKK and EUR. The collection of data was divided between 20% testing and 80% training samples in a chronological order. The NGT architecture that is integrated, incorporating N-Beats, GRU, and TCN components, was implemented based on the proposed hybrid model, with hyperparameters and configurations outlined in Table 1.
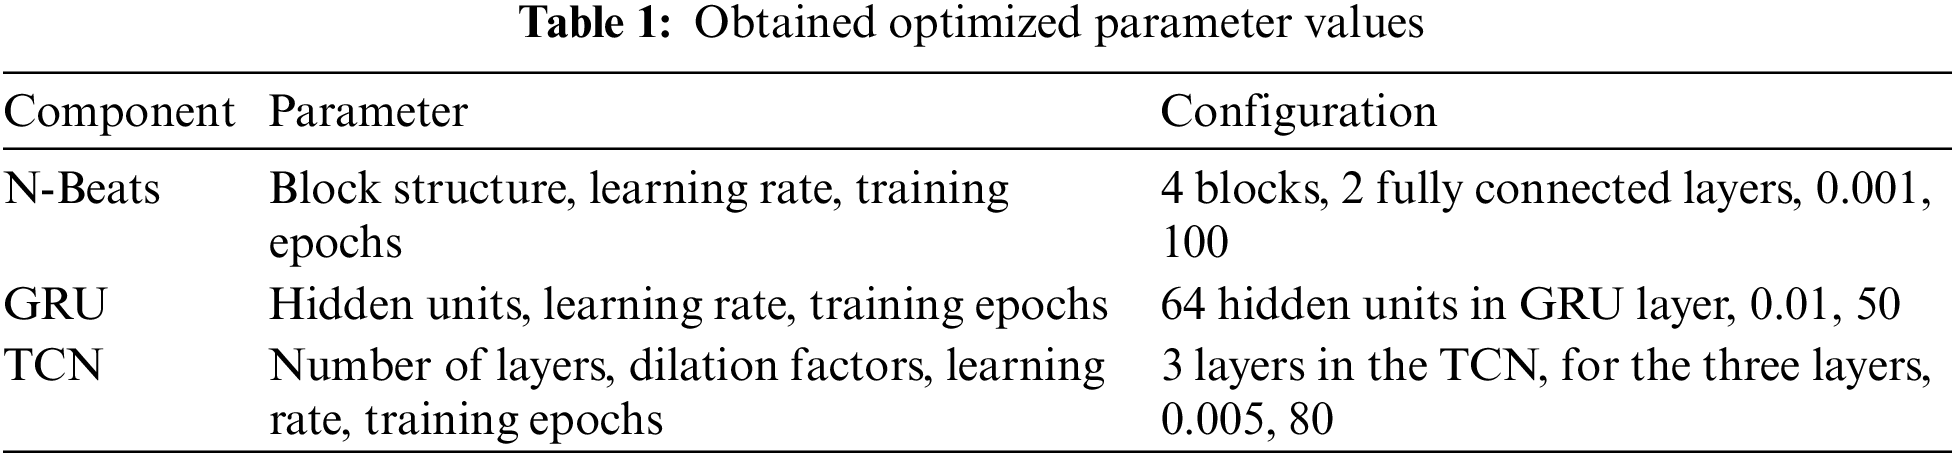
The Seagull Optimization Algorithm (SOA) fine-tuned the model’s hyperparameters with a population size of 20, terminating at a convergence threshold of 0.001. Ensuring robustness, experiments were repeated around ten times, introducing new parameter sets and dataset shuffles in each iteration, capturing inherent variability for statistically significant conclusions. An individual CSV file including data from the past from 2017 to 2022 had been generated for data analysis, and Fig. 5 shows the combined data as a time sequence, forming the basis for a three-stage study involving data investigation, price prediction, and process optimization.
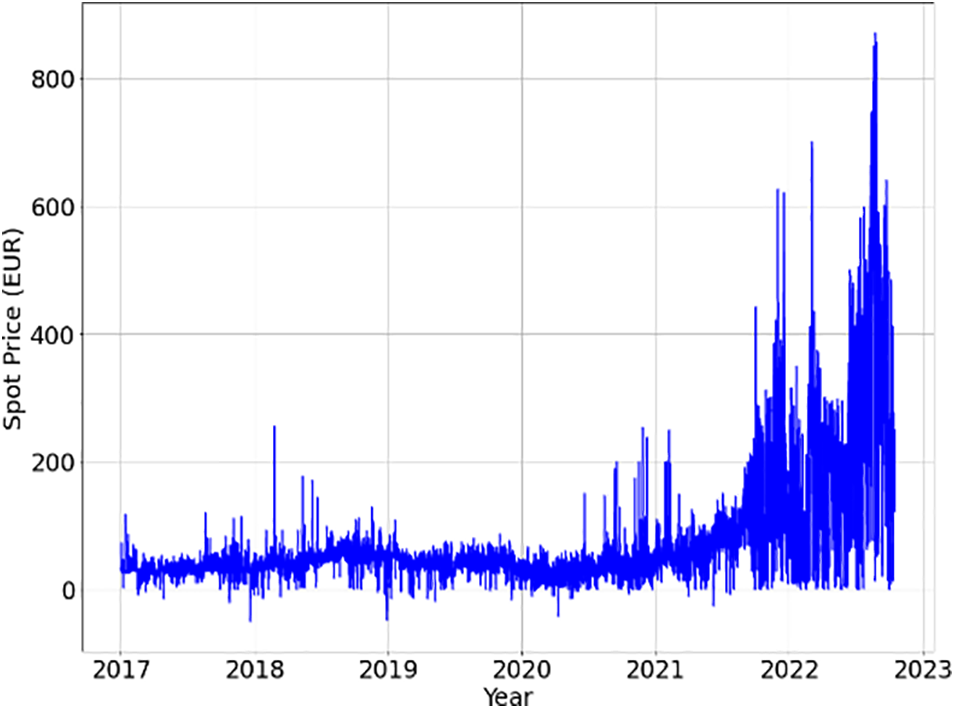
Figure 5: Data distribution 2017 to 2022
Key dataset stats: Mean 69.84, std. dev. 89.55, min −50.00, max 871.00. Fig. 5 depicts price trends, emphasizing forecasting utility and pricing volatility. Occasional spikes above 871 EUR suggest data storage outsourcing opportunities during lower power cost periods. Examining power price behavior stresses optimizing storage offloading for cost savings. The heatmap in Fig. 6 identifies closely connected factors, emphasizing the model’s effectiveness in forecasting a single hour based on date-related variables.
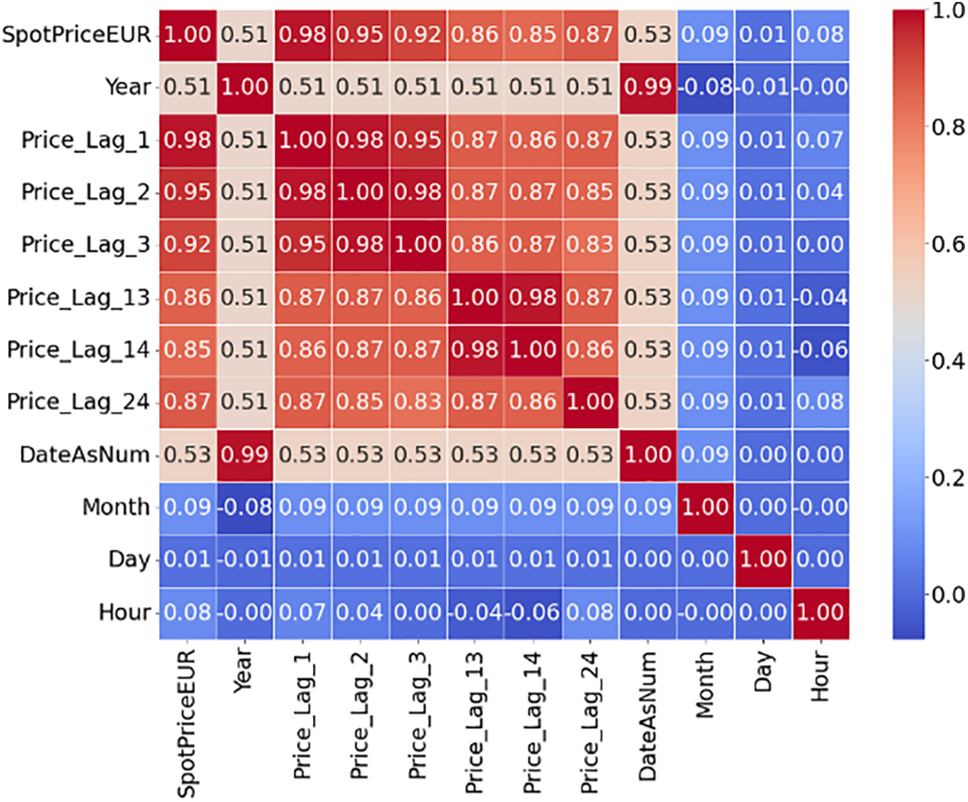
Figure 6: Autocorrelation of the dataset lags
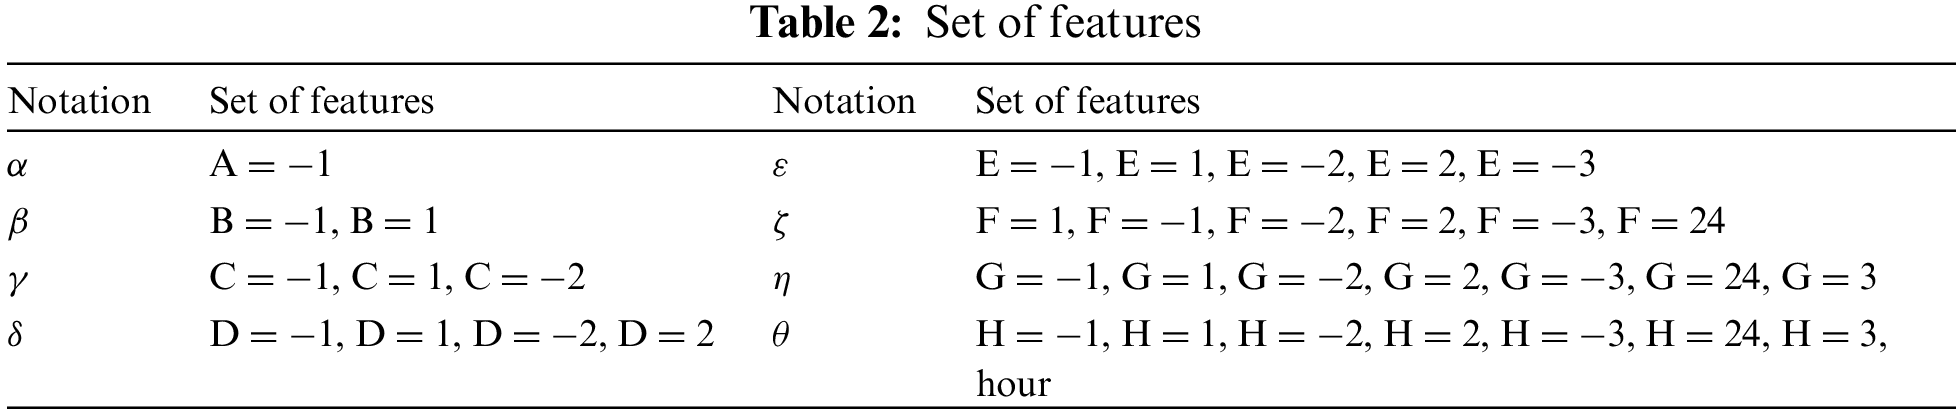
Price Forecasting Results: Initially, the most important characteristic that was found that it was used to build the model repeatedly. While the data sets in the next section show the results of choosing the feature method, Table 2 summarizes the various feature sets employed in the study [26,28]. Table 2 uses the notation R for the matching attribute and Spn, which stands for the lag. The time interval that allows the following task to start before the previous one is finished is known as the negative lag. Tasks that would normally be sequential can overlap or be combined using this approach if they would not otherwise be incompatible.
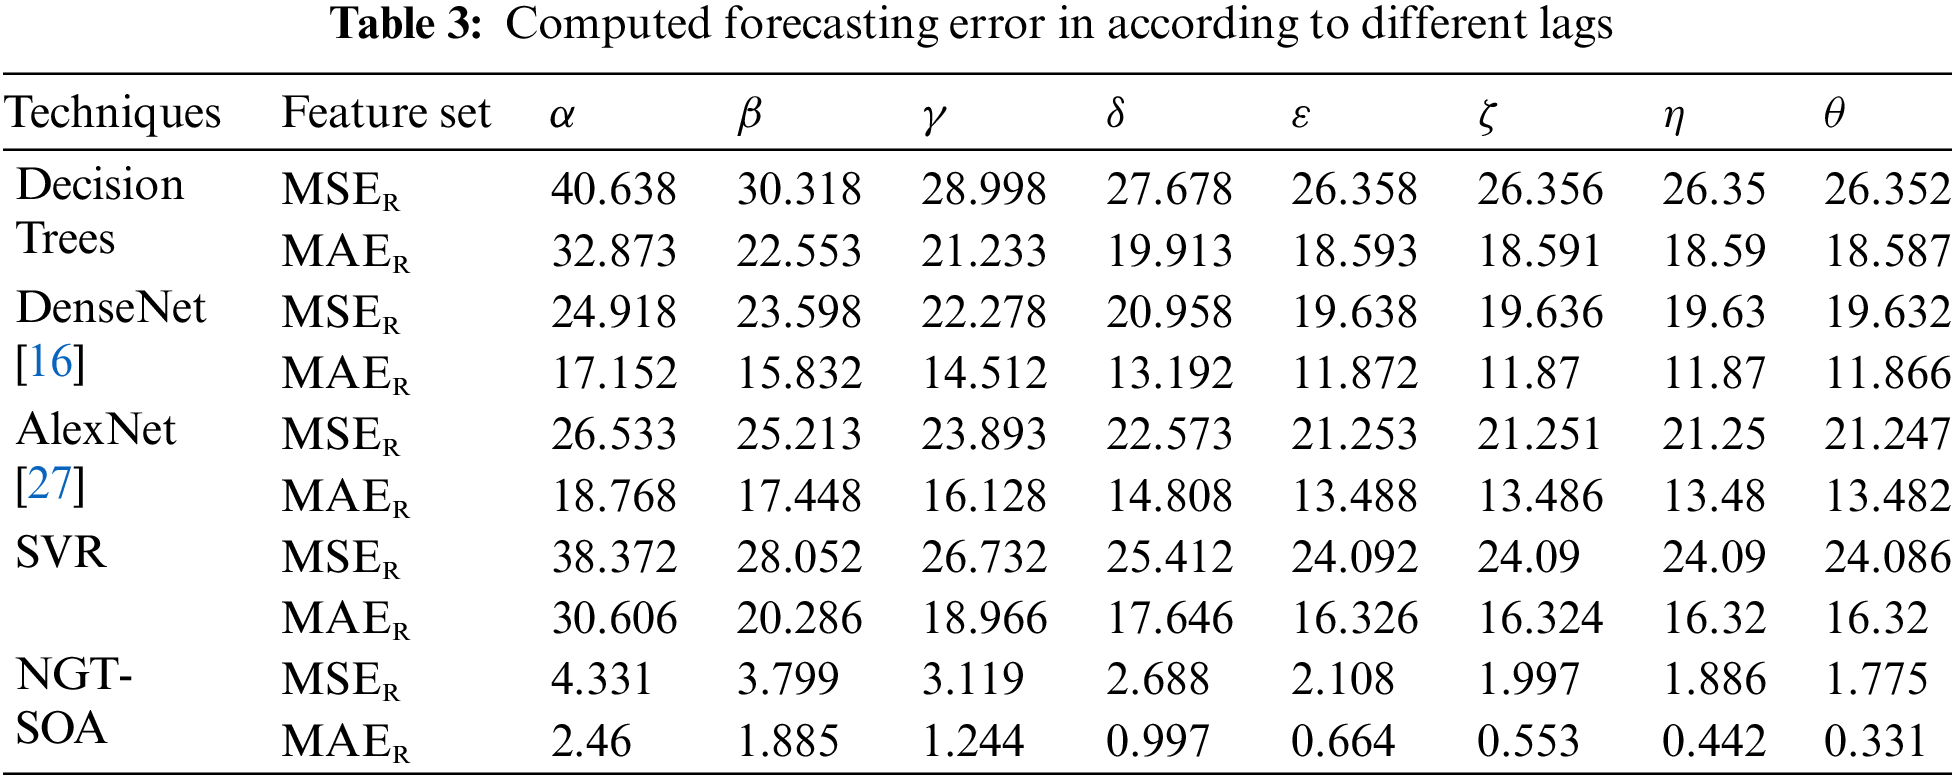
Enhanced functionality is not always a guarantee of better model performance. More features from set A are added to set B in NGT, which raises Mean Squared Error (MSER) but decreases Mean Absolute Error (MAER) as shown in Table 3. Hours and delays are important characteristics of the best options for set H. Different from SVR and DenseNet, NGT-SOA demonstrates that many times adding more features does not improve accuracy. When NGT-SOA is optimized using the SOA, the fewest characteristics often yield the best results. Our model shows better accuracy when compared to existing approaches.
This study employed Decision trees, DenseNet, AlexNet, Support Vector Regression (SVR), and other power price forecasting methods. The NGT-SOA model, with optimized parameters, displayed accurate forecasts as seen in Fig. 7 for December 2023. Fig. 8 compares various regression techniques, highlighting NGT-SOA’s consistent superiority with higher R2, lower MAE and MSE values, and improved accuracy and recall. These results affirm the effectiveness of NGT-SOA in providing precise and reliable hourly spot price forecasts.
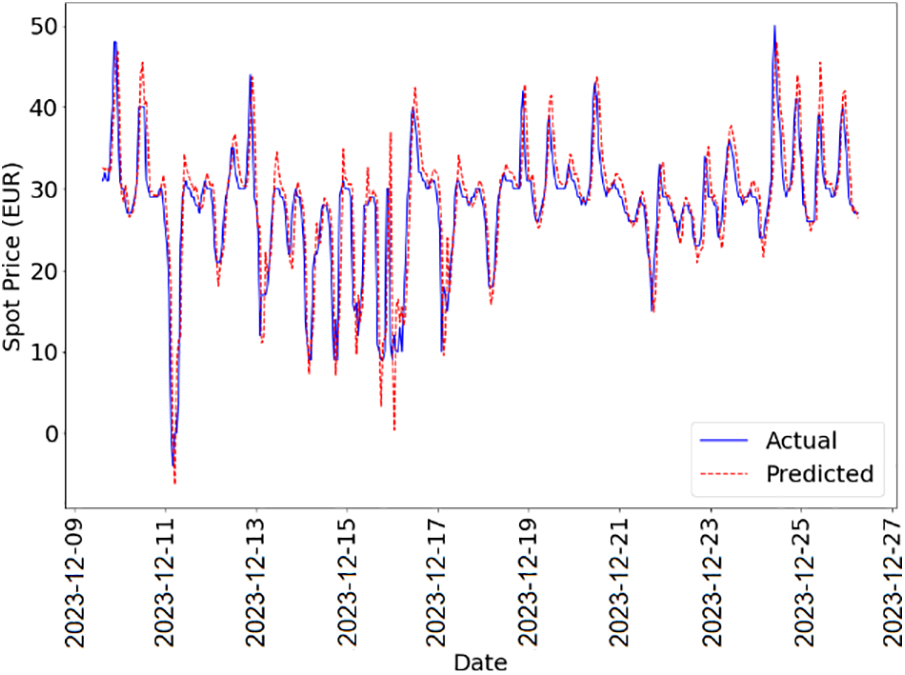
Figure 7: Forecasted price of last month of 2023
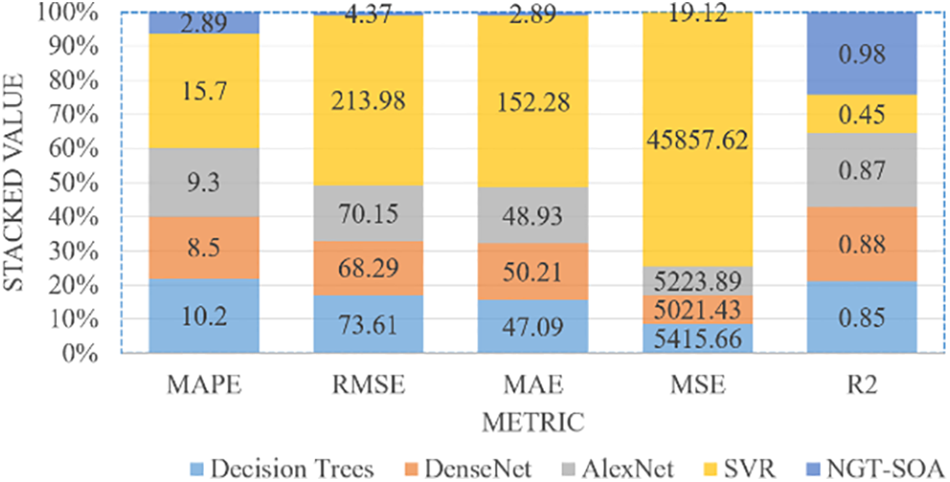
Figure 8: Performance metrics results
Optimization of Cloud Datacenters: Our cost-saving model, employing NGT-SOA and incorporating the IoT real-time data, achieved a notable 25.31% reduction (CAD 1805.66). The model introduced randomness in server and node capacities, implementing a One-and-Off strategy for efficient server shutdowns during downloads. TN(4.2) GB capacity nodes, optimized for energy efficiency, were utilized. The analysis excluded data execution and transfer costs, underscoring the importance of a comprehensive understanding of cost savings through storage offloading. Despite limitations, our results demonstrated better-than-expected outcomes, yielding up to 24.21% cost savings over two weeks for a four-server data center. Scaling to larger data centers (4,000 servers) could potentially result in annual savings of CAD 48.3 million, accounting for potential alterations in actual energy usage. Our findings underscore the impact of increasing server size on computation time in large data centers, discouraging node and server rescaling as it would not significantly influence outcomes. Maintaining consistent power consumption during data download is crucial for reducing storage-related power consumption. Reducing nodes does not change estimated expenses or savings but ensures high throughput. For example, with Ji TN(2,1) and YN = 3 and ji YN(910,20), a 25.21% cost savings of CAD $1,000 was achieved, emphasizing the efficiency gains facilitated by IoT integration.
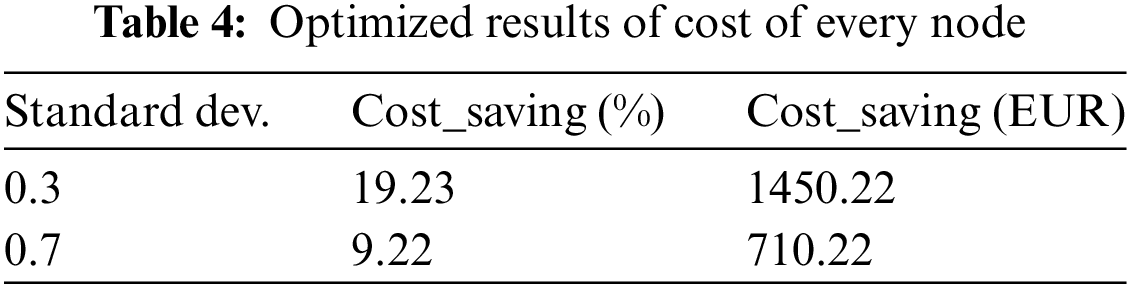
Table 4 demonstrates the effectiveness of offloading storage to specific nodes, exploring varying storage node prices and emphasizing potential cost savings. Our research suggests that increasing standard deviation (std.) leads to significant cost savings. For instance, increasing it from 0.2 to 0.5 removed roughly a half of the resources that were saved. The NGT-SOA technique, proposed here, holds substantial potential, especially in logistics and industrial IoT, benefiting sectors like manufacturing, transportation, and energy with real-time electricity price forecasting for optimized operations and informed decisions. The scalable model offers a promising future for cloud-based resource management systems.
This study introduces a specialized deep learning model for predicting energy prices in Oslo’s unique Norwegian energy market, incorporating the transformative potential of the IoT. The focus is on using the upward trajectory of power expenses to enhance energy efficiency in cloud data centers through strategic data offloading. Addressing the challenges posed by fluctuating power prices in the Nord Pool market, the study estimates Ontario’s power revenues, specifically the typical spot price, for 2016–2023. Our cost-saving model, rigorously tested in various default settings, demonstrates a significant 65% cost reduction. Innovative data storage technologies, coupled with IoT real-time data integration, yield accurate price projections (MAE 5.42, MSE 2.89), resulting routinely in energy cost reductions of up to 29.66% in data centers. While these outcomes are from a smaller-scale platform, they suggest even higher savings in a larger scenario. Our framework will evolve by incorporating additional variables and addressing shortcomings, enhancing its applicability to a broader range of real-world situations. Including load and energy forecasts, particularly leveraging IoT data, holds potential to further enhance forecasting performance in future iterations.
Acknowledgement: The authors would like to thank the Deanship of Scientific Research, Prince Sattam bin Abdulaziz University, Al-Kharj, Saudi Arabia, for supporting this research.
Funding Statement: The authors extend their appreciation to Prince Sattam bin Abdulaziz University for funding this research work through the Project Number (PSAU/2023/01/27268).
Author Contributions: The authors confirm contribution to the paper as follows: Study conception and design: M.A, H.A.A, and N.A; data collection: N.A; analysis and interpretation of results: M.A, H.A.A, and N.A; draft manuscript preparation: M.A, H.A.A, and N.A. All authors reviewed the results and approved the final version of the manuscript.
Availability of Data and Materials: The authors confirm that the data supporting the findings of this study are available within the article.
Conflicts of Interest: The authors declare that they have no conflicts of interest to report regarding the present study.
References
1. A. A. Almazroi and N. Ayub, “Multi-task learning for electricity price forecasting and resource management in cloud-based industrial IoT systems,” IEEE Access, vol. 1, no. 1, pp. 1–10, 2023. doi: 10.1109/ACCESS.2023.3280857. [Google Scholar] [CrossRef]
2. H. Shukur, S. Zeebaree, R. Zebari, D. Zeebaree, O. Ahmed and A. Salih, “Cloud computing virtualization of resources allocation for distributed systems,” J. Appl. Sci. Technol. Trends., vol. 1, no. 3, pp. 98–105, 2020. doi: 10.38094/jastt1331. [Google Scholar] [CrossRef]
3. N. R. Moparthi, G. Balakrishna, P. Chithaluru, M. Kolla, M, and M. Kumar, “An improved energy-efficient cloud-optimized load-balancing for IoT frameworks,” Heliyon, vol. 9, no. 11, pp. 1–13, 2023. doi: 10.1016/j.heliyon.2023.e21947. [Google Scholar] [PubMed] [CrossRef]
4. Y. Saadi and S. El Kafhali, “Energy-efficient strategy for virtual machine consolidation in cloud environment,” Soft. Comput., vol. 24, no. 19, pp. 14845–14859, 2020. [Google Scholar]
5. A. G. Gad, “Particle swarm optimization algorithm and its applications: A systematic review,” Arch. Comput. Methods Eng., vol. 29, no. 5, pp. 2531–2561, 2022. doi: 10.1007/s11831-021-09694-4. [Google Scholar] [CrossRef]
6. S. Albahli, M. Shiraz, and N. Ayub, “Electricity price forecasting for cloud computing using an enhanced machine learning model,” IEEE Access, vol. 8, pp. 200971–200981, 2020. doi: 10.1109/ACCESS.2020.3035328. [Google Scholar] [CrossRef]
7. N. Ayub et al., “Big data analytics for short and medium-term electricity load forecasting using an AI techniques ensembler,” Energies, vol. 13, no. 19, pp. 5193, 2020. doi: 10.3390/en13195193. [Google Scholar] [CrossRef]
8. M. Mishra, J. Nayak, B. Naik, and A. Abraham, “Deep learning in electrical utility industry: A comprehensive review of a decade of research,” Eng. Appl. Artif. Intell., vol. 96, pp. 104000, 2020. doi: 10.1016/j.engappai.2020.104000. [Google Scholar] [CrossRef]
9. H. Hamdoun, A. Sagheer, and H. Youness, “Energy time series forecasting—Analytical and empirical assessment of conventional and machine learning models,” J. Intell. Fuzzy Syst., vol. 40, no. 6, pp. 12477–12502, 2021. doi: 10.3233/JIFS-201717. [Google Scholar] [CrossRef]
10. P. W. Khan et al., “Machine learning-based approach to predict energy consumption of renewable and nonrenewable power sources,” Energies, vol. 13, no. 18, pp. 4870, 2020. doi: 10.3390/en13184870. [Google Scholar] [CrossRef]
11. X. Zhao et al., “A novel short-term load forecasting approach based on kernel extreme learning machine: A provincial case in China,” IET Renew. Power Gener., vol. 16, no. 12, pp. 2658–2666, 2022. doi: 10.1049/rpg2.12373. [Google Scholar] [CrossRef]
12. B. D. Dimd, S. Völler, U. Cali, and O. M. Midtgård, “A review of machine learning-based photovoltaic output power forecasting: Nordic context,” IEEE Access, vol. 10, pp. 26404–26425, 2022. doi: 10.1109/ACCESS.2022.3156942. [Google Scholar] [CrossRef]
13. R. Wazirali, E. Yaghoubi, M. S. S. Abujazar, R. Ahmad, and A. H. Vakili, “State-of-the-art review on energy and load forecasting in microgrids using artificial neural networks, machine learning and deep learning techniques,” Elect. Power Syst. Res., vol. 225, pp. 109792, 2023. doi: 10.1016/j.epsr.2023.109792. [Google Scholar] [CrossRef]
14. N. Abbasabadi, M. Ashayeri, R. Azari, B. Stephens, and M. Heidarinejad, “An integrated data-driven framework for urban energy use modeling (UEUM),” Appl. Energy, vol. 253, no. 1, pp. 113550, 2019. doi: 10.1016/j.apenergy.2019.113550. [Google Scholar] [CrossRef]
15. M. Noshy, A. Ibrahim, and H. A. Ali, “Optimization of live virtual machine migration in cloud computing: A survey and future directions,” J. Netw. Comput. Appl., vol. 110, pp. 1–10, 2018. doi: 10.1016/j.jnca.2018.03.002. [Google Scholar] [CrossRef]
16. X. Wang, S. X. Wang, Q. Y. Zhao, S. M. Wang, and L. W. Fu, “A multi-energy load prediction model based on deep multi-task learning and ensemble approach for regional integrated energy systems,” Int. J. Electrical Power Energy Syst., vol. 126, pp. 106583, 2021. doi: 10.1016/j.ijepes.2020.106583. [Google Scholar] [CrossRef]
17. L. Melgar-García, D. Gutiérrez-Avilés, C. Rubio-Escudero, and A. Troncoso, “A novel distributed forecasting method based on Information Fusion and incremental learning for streaming time series,” Inf. Fusion, vol. 95, pp. 163–173, 2023. [Google Scholar]
18. H. Peng, W. S. Wen, M. L. Tseng, and L. L. Li, “A cloud load forecasting model with nonlinear changes using whale optimization algorithm hybrid strategy,” Soft. Comput., vol. 25, no. 15, pp. 10205–10220, 2021. [Google Scholar]
19. A. Nespoli, S. Leva, M. Mussetta, and E. G. C. Ogliari, “A selective ensemble approach for accuracy improvement and computational load reduction in ANN-based PV power forecasting,” IEEE Access, vol. 10, pp. 32900–32911, 2022. [Google Scholar]
20. C. Deb, F. Zhang, J. Yang, S. E. Lee, and K. W. Shah, “A review on time series forecasting techniques for building energy consumption,” Renew Sustain Energ. Rev., vol. 74, pp. 902–924, 2017. [Google Scholar]
21. B. Alankar, G. Sharma, H. Kaur, R. Valverde, and V. Chang, “Experimental setup for investigating the efficient load balancing algorithms on virtual cloud,” Sensors, vol. 20, no. 24, pp. 7342, 2020. [Google Scholar] [PubMed]
22. A. Katal, S. Dahiya, and T. Choudhury, “Energy efficiency in cloud computing data centers: A survey on software technologies,” Cluster Comput., vol. 26, no. 3, pp. 1845–1875, 2023. doi: 10.1007/s10586-022-03713-0. [Google Scholar] [PubMed] [CrossRef]
23. Y. Wen, Y. Chen, M. L. Shao, J. L. Guo, and J. Liu, “An efficient content distribution network architecture using heterogeneous channels,” IEEE Access, vol. 8, pp. 210988–211006, 2020. doi: 10.1109/ACCESS.2020.3037164. [Google Scholar] [CrossRef]
24. A. Javadpour, G. Wang, and S. Rezaei, “Resource management in a peer to peer cloud network for IoT,” Wireless Pers. Commun., vol. 115, no. 3, pp. 2471–2488, 2020. doi: 10.1007/s11277-020-07691-7. [Google Scholar] [CrossRef]
25. L. Nie et al., “Network traffic prediction in industrial internet of things backbone networks: A multitask learning mechanism,” IEEE Trans. Ind Inform., vol. 17, no. 10, pp. 7123–7132, 2021. doi: 10.1109/TII.2021.3050041. [Google Scholar] [CrossRef]
26. Nord Pool, “Electricity load dataset,” 2023. Accessed: Jan. 14, 2024. [Online]. Available: https://www.nordpoolgroup.com/en/ [Google Scholar]
27. T. Van der Heijden, J. Lago, P. Palensky, and E. Abraham, “Electricity price forecasting in European day ahead markets: A greedy consideration of market integration,” IEEE Access, vol. 9, pp. 119954–119966, 2021. doi: 10.1109/ACCESS.2021.3108629. [Google Scholar] [CrossRef]
28. B. N. Oreshkin, G. Dudek, P. Pełka, and E. Turkina, “N-BEATS neural network for mid-term electricity load forecasting,” Appl. Energy, vol. 293, pp. 116918, 2021. doi: 10.1016/j.apenergy.2021.116918. [Google Scholar] [CrossRef]
29. Z. Zou, J. Wang, E. N., C. Zhang, Z. Wang, and E. Jiang, “Short-term power load forecasting: An integrated approach utilizing variational mode decomposition and TCN-BiGRU,” Energies, vol. 16, no. 18, pp. 6625, 2023. doi: 10.3390/en16186625. [Google Scholar] [CrossRef]
Cite This Article
 Copyright © 2024 The Author(s). Published by Tech Science Press.
This work is licensed under a Creative Commons Attribution 4.0 International License , which permits unrestricted use, distribution, and reproduction in any medium, provided the original work is properly cited.
 Downloads
 Citation Tools