
 Submit a Paper
 Propose a Special lssue
 Open Access
ARTICLE

MSD-Net: Pneumonia Classification Model Based on Multi-Scale Directional Feature Enhancement
1 School of Computer Science and Engineering, North Minzu University, Yinchuan, 750021, China
2 School of Medical Information & Engineering, Ningxia Medical University, Yinchuan, 750004, China
3 Key Laboratory of Image and Graphics Intelligent Processing of State Ethnic Affairs Commission, North Minzu University, Yinchuan, 750021, China
* Corresponding Author: Yujie Guo. Email:
(This article belongs to the Special Issue: Deep Learning in Medical Imaging-Disease Segmentation and Classification)
Computers, Materials & Continua 2024, 79(3), 4863-4882. https://doi.org/10.32604/cmc.2024.050767
Received 17 February 2024; Accepted 30 April 2024; Issue published 20 June 2024
 View Full Text
 Download PDF
Abstract
Computer-aided diagnosis of pneumonia based on deep learning is a research hotspot. However, there are some problems that the features of different sizes and different directions are not sufficient when extracting the features in lung X-ray images. A pneumonia classification model based on multi-scale directional feature enhancement MSD-Net is proposed in this paper. The main innovations are as follows: Firstly, the Multi-scale Residual Feature Extraction Module (MRFEM) is designed to effectively extract multi-scale features. The MRFEM uses dilated convolutions with different expansion rates to increase the receptive field and extract multi-scale features effectively. Secondly, the Multi-scale Directional Feature Perception Module (MDFPM) is designed, which uses a three-branch structure of different sizes convolution to transmit direction feature layer by layer, and focuses on the target region to enhance the feature information. Thirdly, the Axial Compression Former Module (ACFM) is designed to perform global calculations to enhance the perception ability of global features in different directions. To verify the effectiveness of the MSD-Net, comparative experiments and ablation experiments are carried out. In the COVID-19 RADIOGRAPHY DATABASE, the Accuracy, Recall, Precision, F1 Score, and Specificity of MSD-Net are 97.76%, 95.57%, 95.52%, 95.52%, and 98.51%, respectively. In the chest X-ray dataset, the Accuracy, Recall, Precision, F1 Score and Specificity of MSD-Net are 97.78%, 95.22%, 96.49%, 95.58%, and 98.11%, respectively. This model improves the accuracy of lung image recognition effectively and provides an important clinical reference to pneumonia Computer-Aided Diagnosis.Keywords
There are significant morbidity and mortality in Pneumonia worldwide. It is the leading infectious death reason in all human ages [1]. Pneumonia is a lung inflammation in terminal airways, alveoli, and pulmonary interstitium, which is caused by bacteria, viruses, or other pathogenic pathogens. Alveoli are filled with inflammatory cells and fluid once the pathogen enters the lungs. The infection prevents gas from being exchanged in the lungs, increasing the patient’s risk of death [2]. Different pathogens cause different symptoms of pneumonia. Each pneumonia treatment strategy is different. Therefore, early recognition is critical for making pneumonia treatment strategies. The pneumonia diagnosis based on X-ray images is an important means of screening in radiology departments. Lung X-ray images are less costly, time-consuming, and can show the lung structure clearly. It is widely used in clinical medicine [3]. However, different lung X-ray images have different lesion sizes and lesion directions. It is difficult to distinguish different lesions only through doctor experience. There is a lack of specificity in pneumonia clinical images, which brings challenges to the early disease diagnosis.
The development of deep learning provides new ideas and methods for Computer-Aided Diagnosis in pneumonia images [4]. CNN (Convolutional Neural Network) uses convolutional layers to extract the image features and improve performance greatly [5]. ResNet (Residual Network) [6] uses skip connections in the internal residual blocks to reuse features. It alleviates the disappearing gradients problem in deep neural networks and improves the network expression ability. Khurana et al. [7] propose a machine learning-based time-series Facebook NeuralProphet model, this study aims to determine categorical predictions for COVID-19 (Corona Virus Disease 2019). Akbulut [8] propose a powerful algorithm based on a new customized deep learning model, the model is trained synchronously with the attention and LSTM (Long Short-Term Memory) model with CNN models to classify healthy, COVID-19, and pneumonia. Kaur et al. [9] propose a new image processing-based technique for the health care systems named “C19D-Net”. The proposed system extracts deep learning features by applying the InceptionV4 architecture and Multiclass SVM (Support Vector Machine) classifier to classify and detect COVID-19 infection into four different classes. Zhou et al. [10] propose a COVID-ResNet auxiliary diagnosis model based on CT images, this model can focus lesion region by attention mechanism into the residual block, and it improves the classification performance of convolutional neural networks to improve the accuracy of COVID classification.
Although the residual network can improve the accuracy of lung X-ray image classification. However, the size of pneumonia lesions is different, and the features cannot be extracted by a single-size convolution operation. Zhou et al. [11] propose a cross-modal cross-scale global-local attention detection model, which obtained rich multi-scale features by grouping multi-scale attention for feature fusion and improving the model’s ability to extract lesion features. Xiao et al. [12] propose a multi-scale spatial channel attention module and multi-feature fusion global local attention module, which effectively solves the problem of low classification accuracy. Huo et al. [13] propose a hierarchical multi-scale feature fusion network for medical image classification, The model can extract local and global features effectively on different semantic scales, and it can improve the classification accuracy of various medical images. Although the multi-scale module can improve the feature extraction ability, it lacks the direction features perception ability about lung X-ray images.
In summary, the existing network is not sufficient to extract the lesion size and directional features. To solve the above problems, A pneumonia classification model based on multi-scale directional feature enhancement is proposed in this paper. The main contributions of this model are as follows:
1. To solve the different lesion size problems in lung X-ray images, a Multi-scale Residual Feature Extraction Module (MRFEM) is designed. The MRFEM uses dilated convolutions with different expansion rates to extract features. It improves the model’s adaptability to different sizes in pneumonia lesions, and the model’s ability to capture multi-scale features.
2. A Multi-scale Directional Feature Perception Module (MDFPM) is designed to further enhance the feature extraction ability in the backbone network. The MDFPM uses three different sizes of convolutions, and the multi-branch structure is used to gather highly correlated features to enhance the lesion features. It can further improve the feature extraction ability of the model.
3. To obtain the direction features in lung X-ray images and increase the extraction ability of global features, the Axial Compression Former Module (ACFM) is added at the end of the feature extraction network. The ACFM performs global calculations in different directions. It enhances the global features perception in different directions and improves the classification performance in pneumonia diseases.
The residual network effectively alleviates the problems, which of gradient disappearance and network degradation caused by the increase in network depth. It can greatly improve the generalization ability and robustness of deep networks, and it has made a breakthrough in the field of pneumonia image classification.
2.1 Pneumonia Classification Method Based on Residual Unit
In the residual unit, the problems of gradient disappearance and gradient explosion during deep neural network training are solved by introducing skip connection. Gopatoti et al. [14] propose a multi-textural multi-class attention recurrent residual convolutional neural network, it can classify the CXR (chest X-ray) images into normal, COVID-19, viral pneumonia, and lung opacity using extracted multi-textural features with improved accuracy. Zhang et al. [15] propose a dimension-driven multi-path attention residual network, a dimension-driven multipath attention residual block is developed to effectively obtain the multi-scale features, and differently treats these features containing different amounts of information through the channel attention mechanism, which makes the data depth features better expressed. Sreedevi et al. [16] propose a Dual Attention method based on the Resnet-50 with bidirectional gated recurrent unit for image classification, the GRU (gated recurrent unit) is combined with ResNET 50 to enhance the expressiveness of the model.
2.2 Pneumonia Classification Method Based on Overall Structure
The optimization of ResNet based on the overall structure can effectively reduce overfitting and enhance the ability of the network to learn features. Hassan et al. [17] propose an architecture called Medical Quantum Convolutional Neural Network, based on the Quantum Convolutional Neural Networks model and a modified ResNet pre-trained model, for enhancing the biomedical image classification in the MNIST medical dataset. Ejiyi et al. [18] propose a classification network named ResfEANet, which is built upon ResNet and incorporates an External Attention mechanism to extract features effectively. Nawaz et al. [19] propose a swish-based improved ResNet model, which introduced multiple dense layers at the end of the proposed CNN structure to ensure more robust sample features for classification purposes.
Compared with the traditional neural network, ResNet is a good deep learning model to alleviates the disappearing gradients. The problem that deep learning models are difficult to train is alleviated. However, it is limited in capturing local and global features. In addition, there are different lesion sizes and lesion directions in Lung X-ray images. The MSD-Net model is proposed, its structure is shown in Fig. 1, the main introduction of three modules: Multi-scale Residual Feature Extraction Module (MRFEM), Multi-scale Directional Feature Perception Module (MDFPM), Axial Compression Former Module (ACFM). In this model, ResNet50 is used as the main backbone network, there are five stages in backbone network, that is Stage I–Stage V. Firstly, the lung X-Ray image is inputted into Conv7 × 7 and Maxpool layers to extract shallow features. Then advanced semantic information is obtained stage by stage through the first four stages Stage I–Stage IV. Each Stage is composed by several MRFEMs, and rich multi-scale features are obtained through dilated convolutions with different expansion rates. In Stage V, the ACFM is designed to extract global semantic features in different spatial directions, which improves the model ability to perceive the global features of lung X-ray images. Secondly, a MDFPM is designed between the previous stage and the next stage. The module uses different size convolution and directional pooling to enhance the acquisition ability about multi-scale and directional features. Finally, it is classified by full connection layer (FC). The pseudo-code of the overall architecture is shown in Table 1.
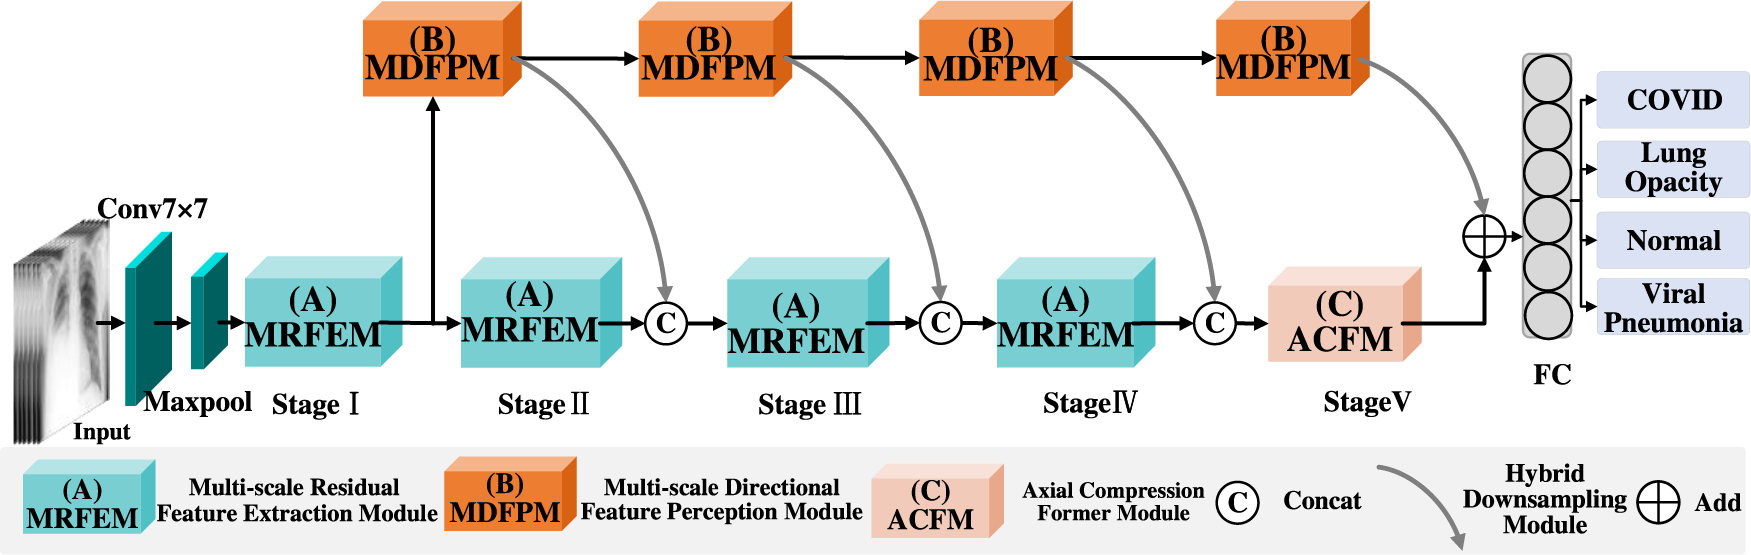
Figure 1: MSD-Net overall framework
3.1 Multi-Scale Residual Feature Extraction Module
ResNet is a typical deep learning network with great feature extraction ability. However, the basic resblock extract features using a single convolution operation, which limit the perceptive range of the input images. To solve these problems, a Multi-scale Residual Feature Extraction Module (MRFEM) is proposed in this paper. In this model, dilated convolutions with different expansion rates are added to enlarge perceptive field, which makes the model handle multi-scale and multi-level features greatly. It improves the ability of feature extraction and expression in lung X-ray images. Its structure is shown in Fig. 2.
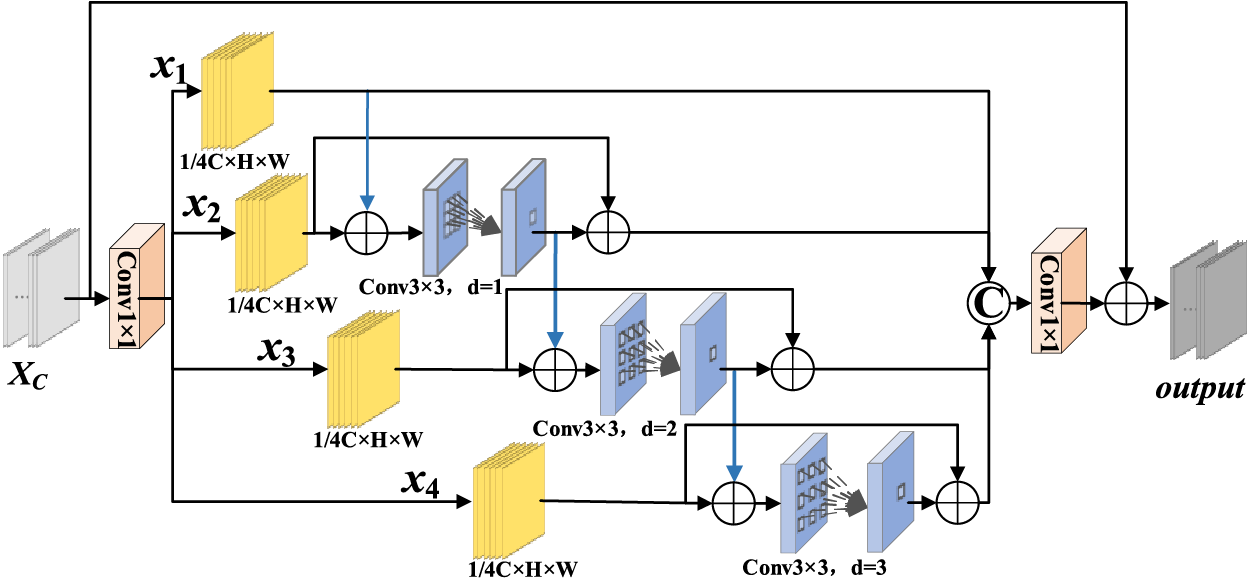
Figure 2: Multi-scale residual feature extraction module
There are four-branch structures in this model: The first branch preserves the initial features. In branch 2–branch 4, there are three expanding convolutions with different expansion rates that are used to extract features. The calculation method of dilated convolution is similar to the chessboard form. Since the feature maps of each layer are obtained by the convolution calculation of the feature maps of the previous layer. The convolution result is lack of interdependence and continuity, which is gridding effect [20]. Therefore, the residual connection is used to obtain pixel information in wider range, which avoid gridding effect. Each branch features are added to next branch which fully fuse each branch features. Finally, a 1 × 1 convolution operation is used to adjust the channel number.
The specific process is as follows: The feature map
3.2 Multi-Scale Directional Feature Perception Module
In X-ray images of pneumonia, the lesion shape is complex and the size is different, so it is difficult to extract the size, shape and direction information of different lesions. Moreover, it is insufficient to extract the size and direction features of lesion region using single-scale convolution, and small lesion region features are easily ignored. In this paper, a Multi-scale Directional Feature Perception Module (MDFPM) is designed to enhance features in three different scales. Two different ways of enlarging the convolution size are used to enlarge the perceptive field: Firstly, convolution with kernel size 3, 5, 7 is used to obtain different scale features, and the output feature are pooled in H and W directions to obtain the lesion direction features. Then, dilated convolutions with expansion rates 1, 2, 3 are used to increase the perceptive field again and capture multi-scale context features. Finally, the different scale features are fused in proper order. In this model, directional features are obtained by three-branch structure. It can improve the network ability to locate interesting targets. Its structure is shown in Fig. 3.
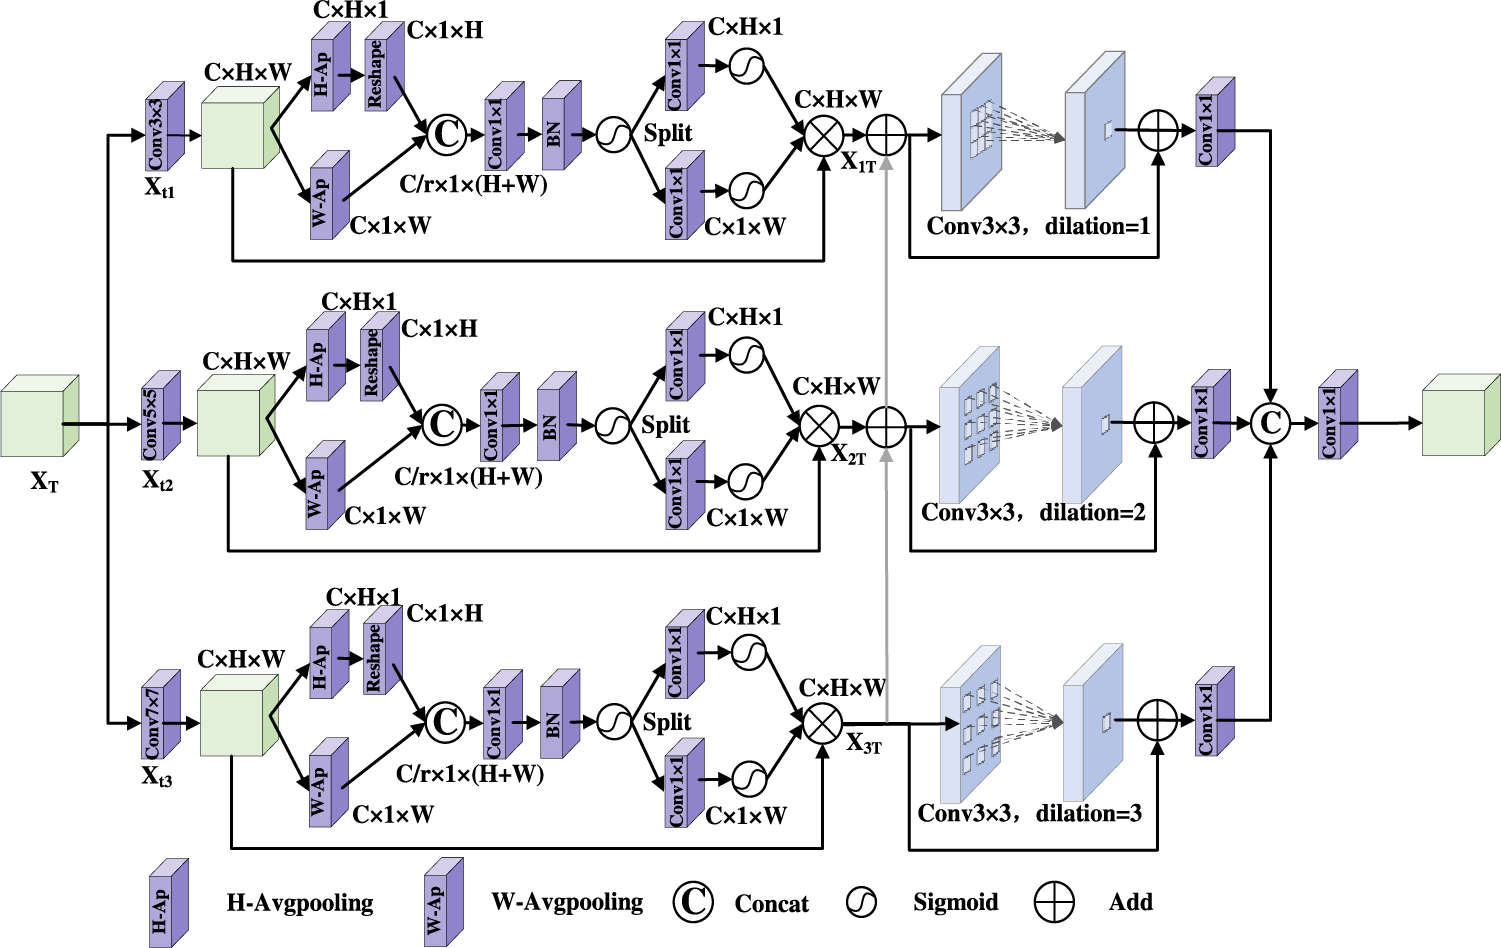
Figure 3: Multi-scale directional feature perception module
There are three branches in MDFPM. Convolutions of size 3 × 3, 5 × 5, and 7 × 7 are processed in parallel to obtain the multi-scale features. The features are aggregated by two spatial directions to capture cross-channel and direction-perception features. It helps the model to obtain spatial features and restrain irrelevant features.
Firstly, the features
Secondly, taking the first branch as an example, the feature map
Thirdly, the feature map
And so on, the feature map
Finally, in order to improve the degree of feature complementarity among different branches, the features are transferred from the feature extraction branch of the larger perceptive field to the feature extraction branch of the smaller perceptive field. Then the enhanced features are obtained by using convolution of different expansion rates.
In order to resize the feature map while retaining more feature, a hybrid downsampling module is used in this paper. Its structure is shown in Fig. 4. The module steps are as follows: Firstly, the feature map
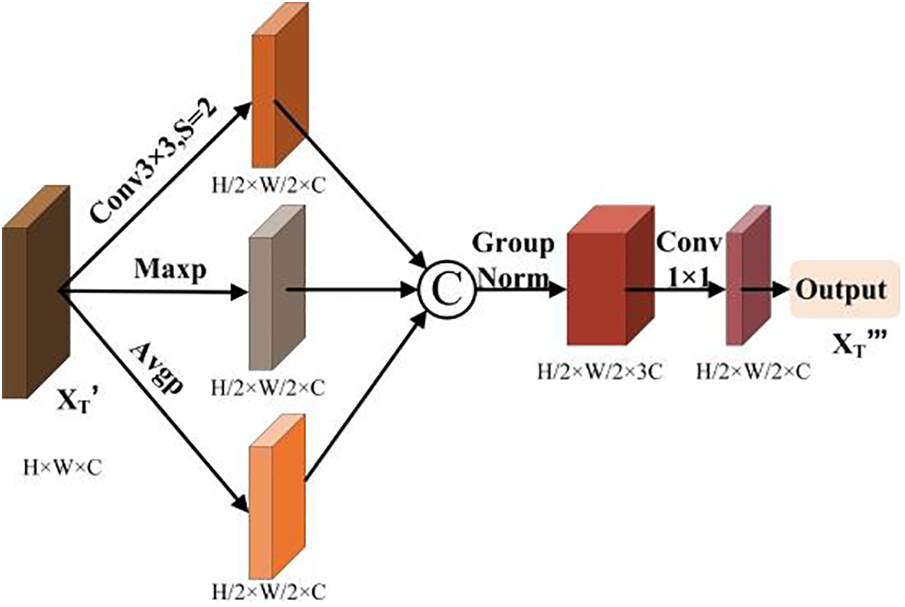
Figure 4: Hybrid downsampling module
3.3 Axial Compression Former Module
There are some advantages in CNN, it has great superiority in local feature extraction. In lung X-ray images, lesion regions are widely distributed, its shape and size are different. The perceptive field of convolution operation is limited. In contrast, the Transformer model [21] can extract global features by capturing long distance dependencies. However, the perception ability of the lesion direction is ignored in Transformer. An Axial Compression Former Module is designed in this paper. Its structure is shown in Fig. 5.
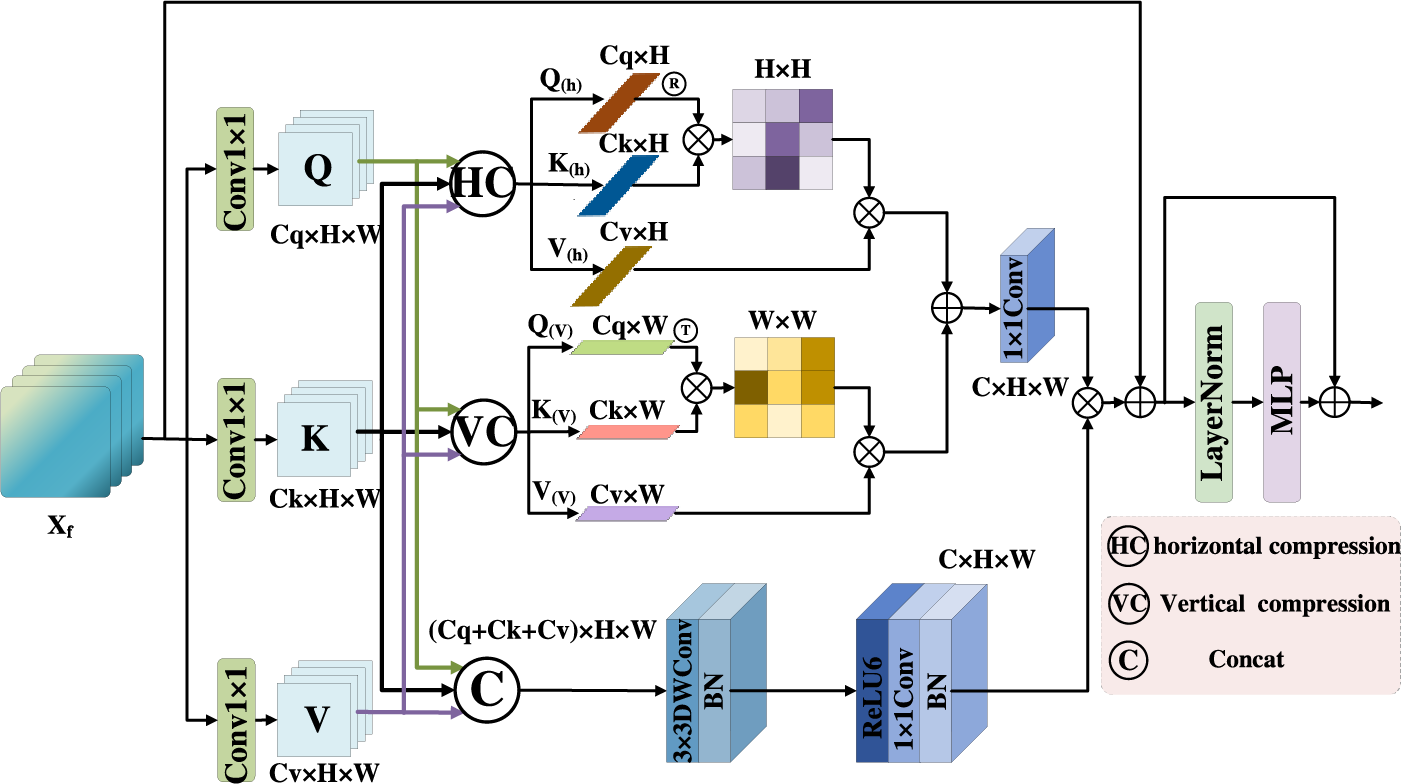
Figure 5: Axial compression former module
The input feature map is calculated by 1 × 1 convolution to get Q, K, V, it is processed by three branches: In the first branch, Q, K, V are compressed along the horizontal direction to obtain horizontal direction features
Firstly, the input features
Secondly, in order to obtain
Thirdly, in order to obtain
Fourthly, although the global semantic features are improved by the compress operation effectively, local detail features are lost in some degree. Therefore, the convolution operation is used to enhance spatial features in this paper. Q, K, V are concatenated in the channels, and the 3 × 3 depth wise convolution (
The global features obtained by 1 × 1 convolution is fused with the local features. The output
Finally, the feature maps are passed through the LayerNormal and the MLP layer. Then the residual connection operation is used to better capture the complex relationship among features. The final output of this stage is
4.1 Datasets and Data Pre-Processing
The dataset uses in this paper is a publicly available dataset from the COVID-19 RADIOGRAPHY DATABASE, created by a team of researchers from Qatar University and Dhaka University in Bangladesh, along with collaborators from Pakistan and Malaysia, in collaboration with physicians [22,23]. A total of 5374 medical images are selected, including 1332 images of COVID-19, 1335 images of lung opacity, 1362 images of normal lung and 1345 images of viral pneumonia. The images are shown in Fig. 6. The ratio of 9:1 is divided into the training set and the verification set. In order to match the model input size, the image is randomly cropped to 224 × 224, then it is converted to vector format and the pixel value is normalized.
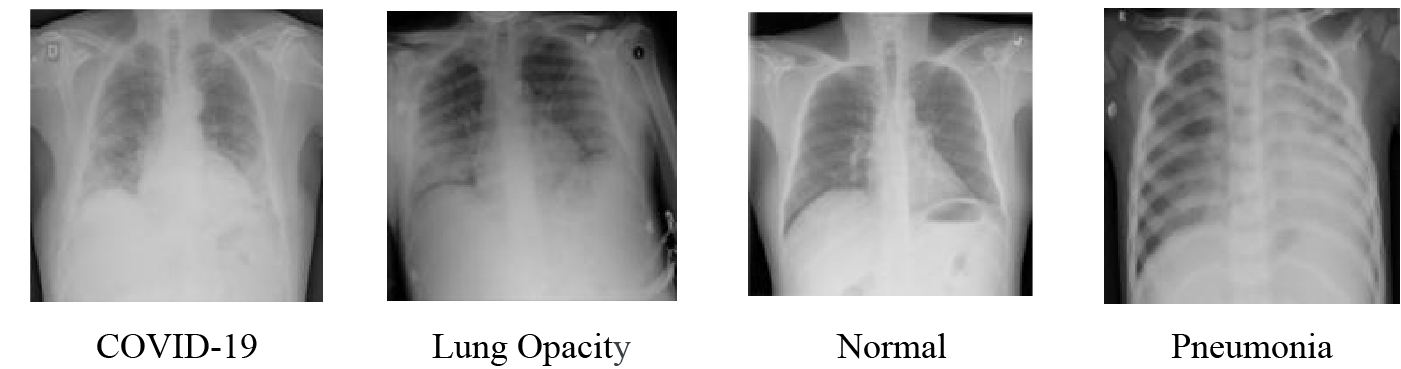
Figure 6: Lung X-ray image samples
The experimental environment for this experiment is a 64-bit Windows Server 2019 Datacenter system equipped with an Inter (R) Xenon (R) Gold 5218 CPU @2.3 GHZ, the computer has 64 GB of RAM and uses NVIDIA TITAN RTX graphics cards to speed up image processing. The program is written in Python, based on the GPU version of the Pytorch framework for network construction and training. Optimiser is performed using the Adam with a learning rate decay value of 0.001. The training period for the lung X-ray dataset is set to 150 and the training batch size is set to 8. The loss function is the cross-entropy loss. Cross entropy is a measure of how similar two distributions are. In machine learning, it is expressed as the difference between the true probability distribution and the predicted probability distribution. The lower the value of cross-entropy is, the better the model prediction effect is. Where the cross entropy loss function of multiple classes is:
where M is category; i is ith sample; yic is the label of the ith sample class c (0 or 1); pic is the probability of the ith sample class c. Finally, the model architecture is tested and evaluated.
Evaluation index is a quantitative index for model performance. In order to reasonably and comprehensively evaluate the classification performance of the overall structure, and facilitate the comparison with other networks. the confusion matrix of each model for pneumonia classification is visualized by using four index values of true positive (TP), false positive (FP), true negative (TN) and false negative (FN). Accuracy (Acc), Recall-Macro (Rec), Precision-Macro (Pre), F1 Score-Macro (F1), and Specificity (Spe) are used as the evaluation criterion to explore the effect of improved network model on the classification of different pneumonia. The calculation formula of each evaluation index is as follows:
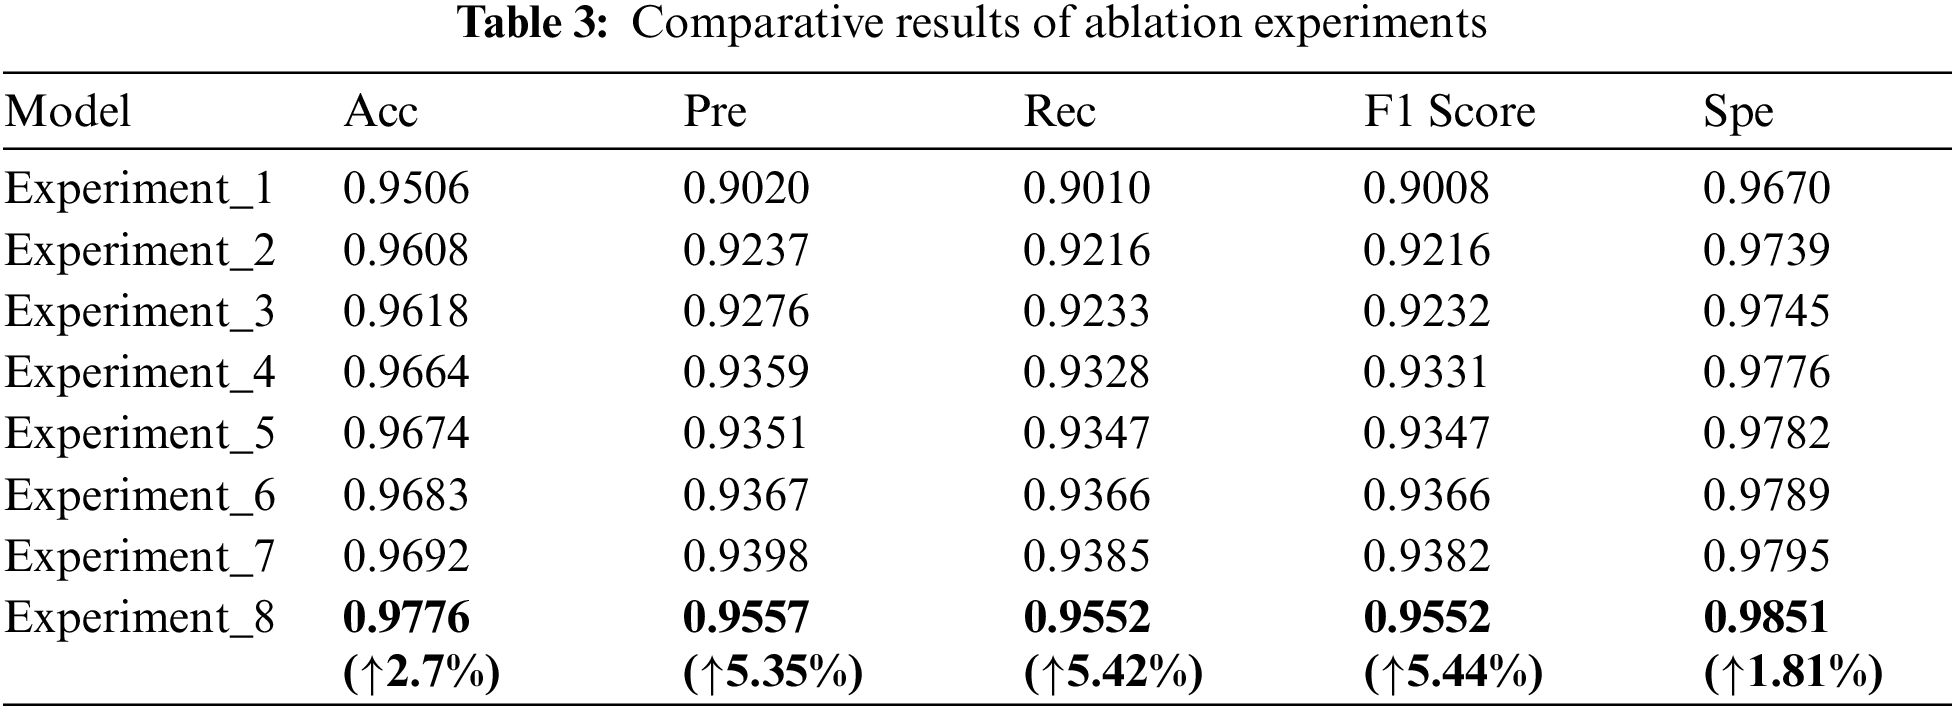
To verify the validity of the methods used in this paper, ablation experiments are performed on the same dataset. As shown in Table 2, a total of 8 groups are designed in ablation experiment, and it is as follows.
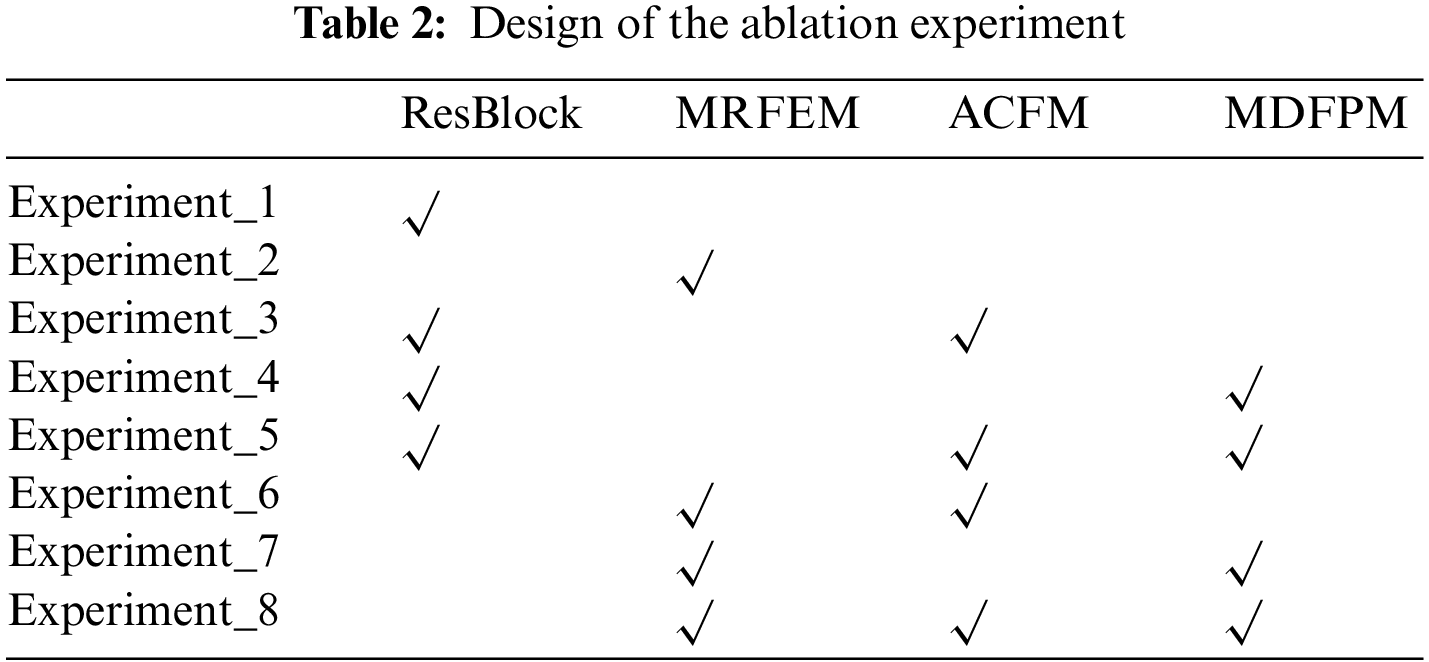
Experiment_1: Basic Resnet50 network.
Experiment_2: The Multi-scale Residual Feature Extraction Module is used to replace the original residual block for feature extraction, and then it is passed into FC layer for classification.
Experiment_3: Original residual blocks are used to extract features. And the Axial Compression Former Module is added to enhance the global semantic information of the backbone network.
Experiment_4: Original residual blocks are used to extract features. A multi-scale direction feature perception module is added after residual blocks of each stage. it expands the perceptive field network of the entire network to capture diverse features.
Experiment_5: Original residual blocks are used to extract features. A multi-scale direction feature perception module is added after residual blocks of each stage. At the same time, the Axial Compression Former Module is added to enhance the global semantic information of backbone network.
Experiment_6: The Multi-scale Residual Feature Extraction Module is used for feature extraction, and the Axial Compression Former Module is added to enhance the global semantic information.
Experiment_7: The Multi-scale Residual Feature Extraction Module is used for feature extraction. And the multi-scale directional feature perception is added to enrich the features.
Experiment_8 (the MSD-net in this paper): The Multi-scale Residual Feature Extraction Module is used for feature extraction. A multi-scale direction feature perception module is added to enhance the direction feature. The Axial Compression Former Module is added to obtain the global information.
The comparative results with different networks of ablation experiments are shown in Table 3. Experiment_2, Experiment_3, Experiment_4 are improved in various indicators compared to Experiment_1. Experiment_2 is improved in various indicators compared to Experiment_1, accuracy, precision, recall rate, F1 value and Spe value increase by 1.02%, 2.17%, 2.06%, 2.08% and 0.69%. It shows that the Multi-scale Residual Feature Extraction Module can improve the ability of the model to extract multi-scale features. Experiment_3 is improved in various indicators compared to Experiment_1, accuracy, precision, recall rate, F1 value and Spe value increase by 1.12%, 2.56%, 2.23%, 2.24% and 0.75%. It is evident that the Multi-scale Direction Feature Perception Module can improve the network extraction ability to extract direction features. Experiment_4 is improved in various indicators compared to Experiment_1, accuracy, precision, recall rate, F1 value and Spe value increase by 1.58%, 3.39%, 3.18%, 3.23%, 1.06%. It is proved that the Axial Compression Former Module enhances the extraction of global and direction features. It can complement the insufficient of convolution in the extraction of features. Experiment_5 is improved in various indicators compared to Experiment_1, accuracy, precision, recall rate, F1 value and Spe value increase by 1.68%, 3.31%, 3.37%, 3.39%, 1.12%. Experiment_6 is improved in various indicators compared to Experiment_1, accuracy, precision, recall rate, F1 value and Spe value increase by 1.77%, 3.47%, 3.56%, 3.74%, 1.19%. Experiment_7 is improved in various indicators compared to Experiment_1, accuracy, precision, recall rate, F1 value and Spe value increase by 1.77%, 3.47%, 3.56%, 3.58%, 1.19%. Experiment_8 is improved in various indicators compared to Experiment_1, accuracy, precision, recall rate, F1 value and Spe value increase by 1.86%, 3.78%, 3.75%, 3.74%, 1.25%. They proved that the pairwise concatenation of modules can improve the feature extraction ability of the model more. Compared to Experiment_8, MSD-net has the best results. The accuracy of the model increased from 95.06% to 97.76%, the precision increased from 90.20% to 95.57%, the recall rate from 90.10% to 95.52%, the F1 Score from 90.08% to 95.52%, and the Spe value increased from 96.70% to 98.51%.
It can be seen that the MSD-net has a better classification effect for the four types of lung X-ray images. The experiments are compared more intuitively by drawing the radar map of the ablation experiment results in this paper, as shown in Fig. 7. MSD-net represented by the red line is at the outer end, which proves that the model has the best performance.
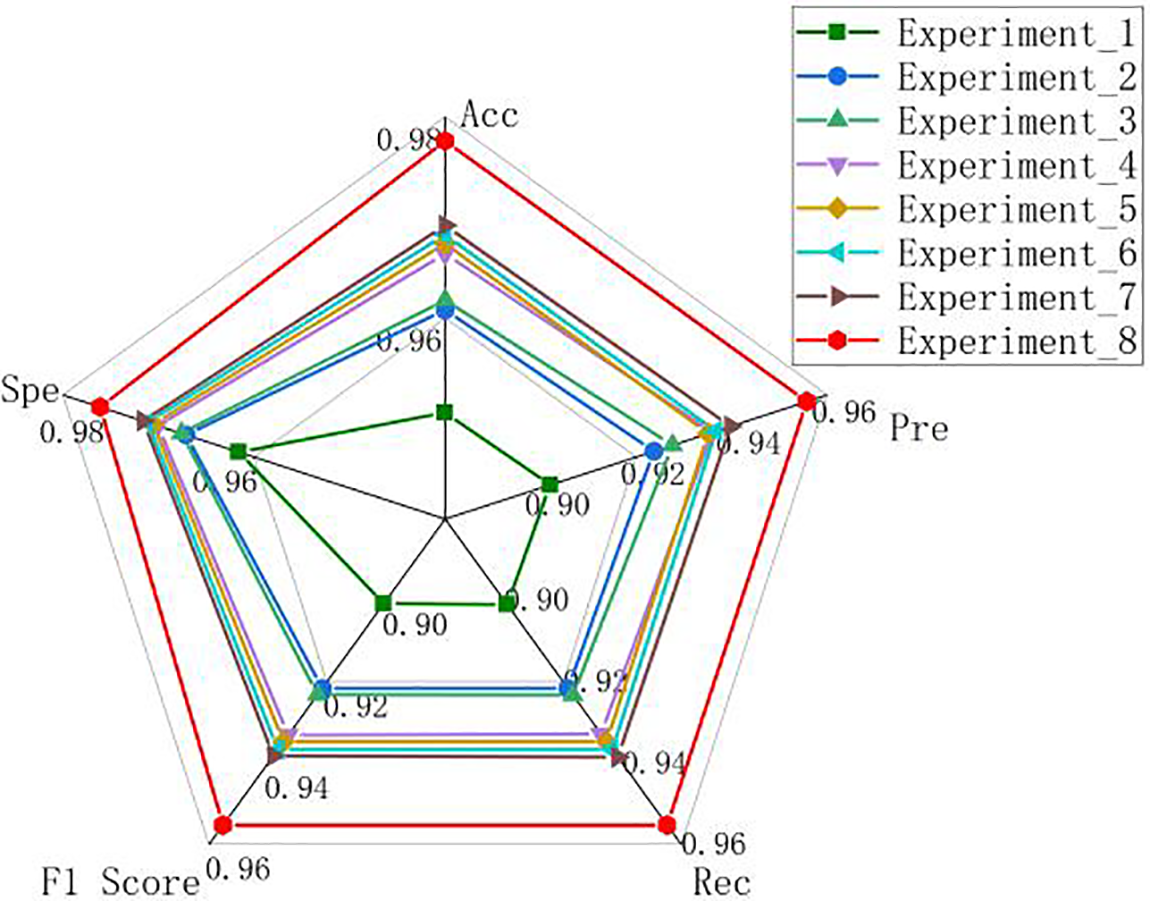
Figure 7: Radar chart of the ablation experiment results
In addition, to investigate the difference between the prediction label and the true case for the classification of test samples in different models, the results of each ablation experiment in the test set are visualized by using the confusion matrix. The visualization result is shown in Fig. 8. In the confusion matrix, the diagonal elements represent the same number of predicted and true labels. The higher the number of diagonal elements, the better the classification accuracy of the model. The same number of true labels and predicted labels for MSD-Net is the highest. It can be seen that the MSD-Net has a more balanced detection and better classification effect for the four types of lung X-ray images in the confusion matrix, which indicates that this model can achieve accurate classification of pneumonia.
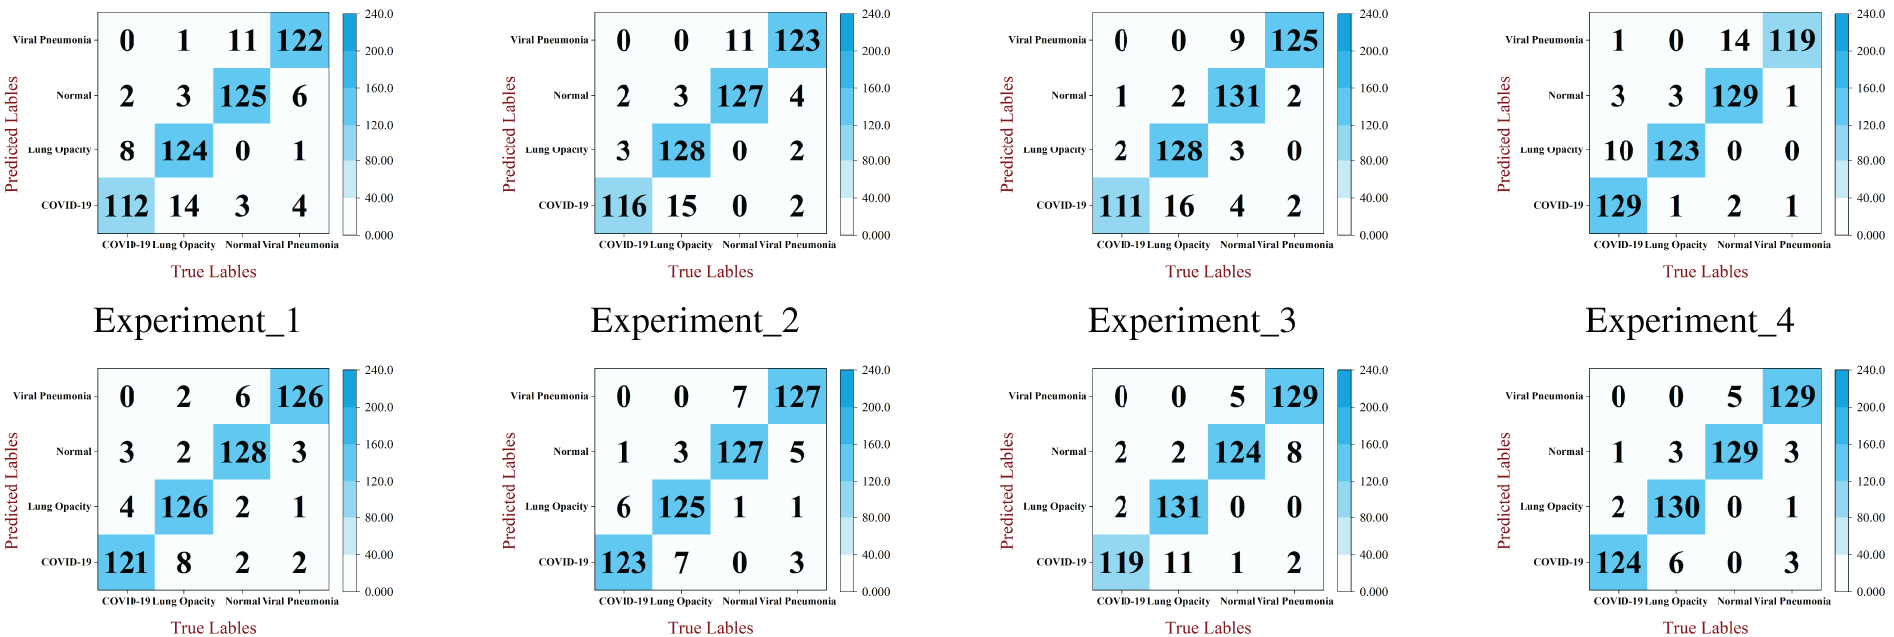
Figure 8: Confusion matrix of each model in ablation experiments
This paper mainly discusses the classification effect of 11 network architectures and MSD-Net in this paper on the same dataset. The experiments are divided into three categories: The first uses the original convolutional neural network architecture. The second uses Transformer network architecture. The third is the network architecture proposed in this paper. The experimental evaluation indexes are Acc, Pre, Rec, F1 Score and Spe for quantitative analysis. The specific experimental results are shown in Table 4.
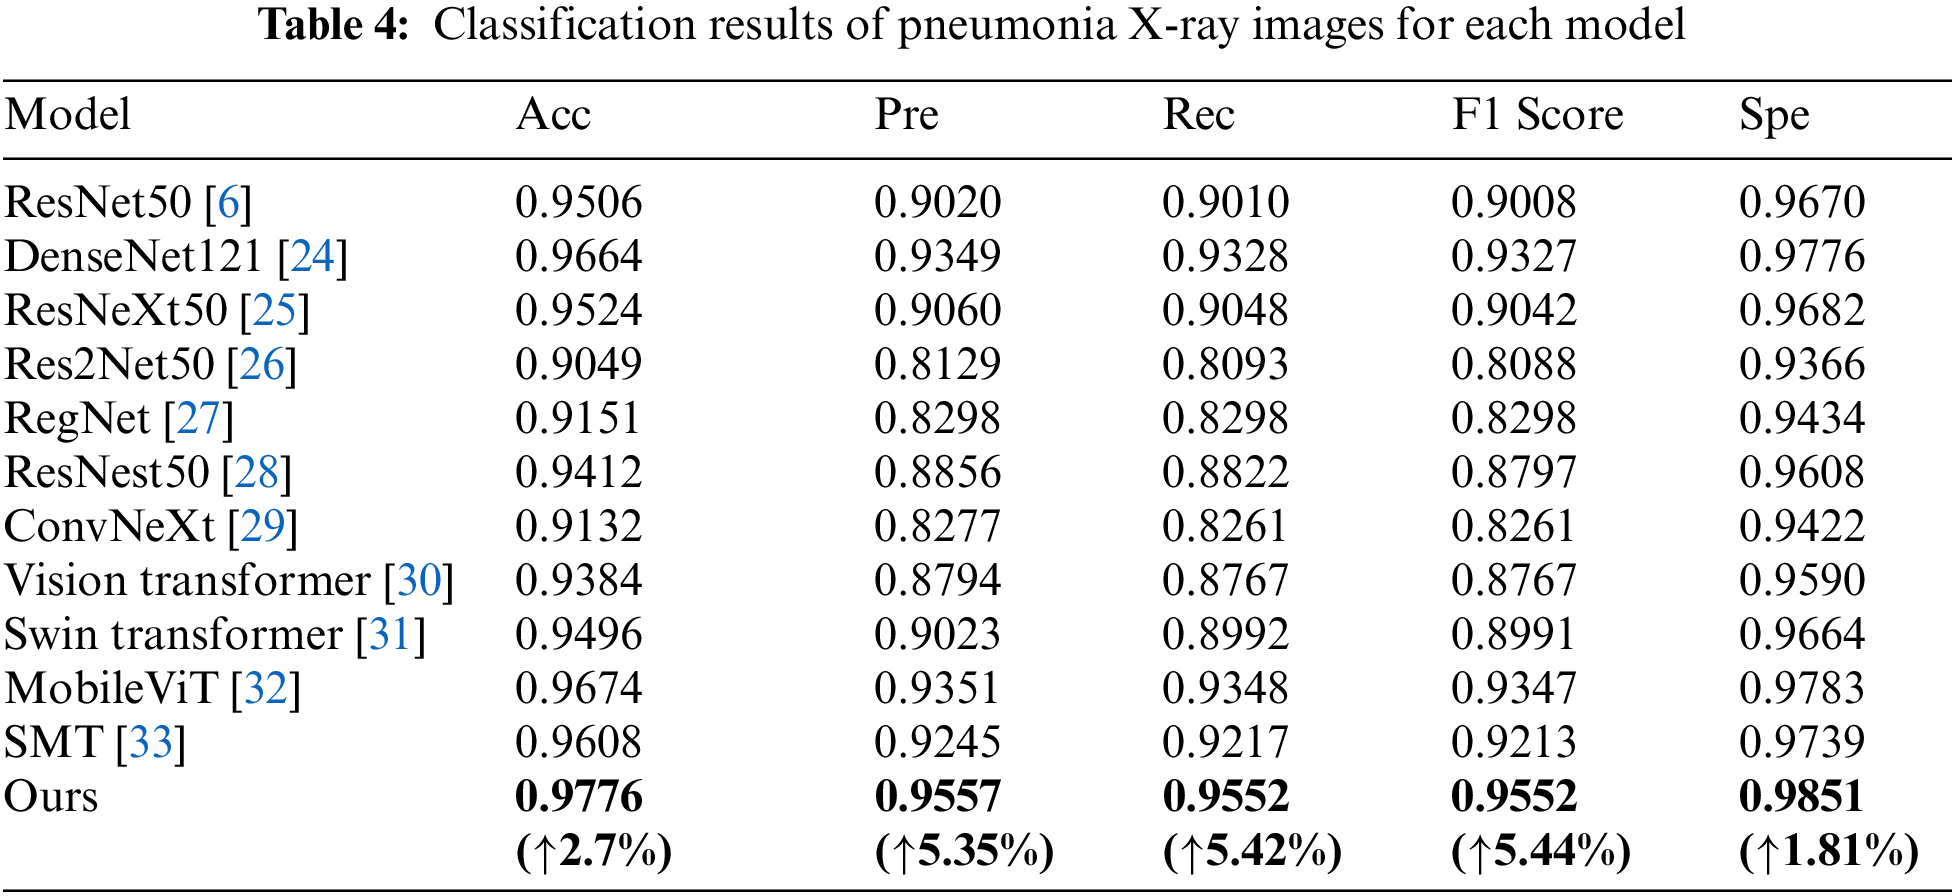
From the data in Table 4, The Acc of the model in this paper is 97.76%, the Pre is 95.57%, the Rec is 95.52%, the F1 Score is 95.52% and the Spe is 98.51%. For convolutional networks, the MSD-Net model is better than the common classification convolutional networks. MSD-Net is improved in various indicators compared to DenseNet121, accuracy, precision, recall rate, F1 value and Spe value increase by 1.12%, 2.08%, 2.24%, 5.44% and 0.75%. MSD-Net is improved in various indicators compared to ResNeXt50, Acc, Pre, Rec, F1 Score and Spe increase by 2.52%, 4.97%, 5.04%, 5.1% and 1.69%. MSD-Net is improved in various indicators compared to Res2Net50, Acc, Pre, Rec, F1 Score and Spe increase by 7.27%, 14.28%, 14.59%, 14.64% and 4.85%. MSD-Net is improved in various indicators compared to Reget, Acc, Pre, Rec, F1 Score and Spe increase by 6.25%, 12.59%, 12.54%, 12.54% and 4.17%. MSD-Net is improved in various indicators compared to ResNest50, Acc, Pre, Rec, F1 Score and Spe increase by 3.64%, 7.01%, 7.3%, 7.55% and 2.43%. MSD-Net is improved in various indicators compared to ConvNeXt, Acc, Pre, Rec, F1 Score and Spe increase by 6.44%, 12.8%, 12.91%, 12.91% and 4.29%. For Transformer, MSD-Net is improved in various indicators compared to Vision Transformer, Acc, Pre, Rec, F1 Score and Spe increase by 3.92%, 7.63%, 7.85%, 7.85% and 2.61%. MSD-Net is improved in various indicators compared to Swin Transformer, Acc, Pre, Rec, F1 Score and Spe increase by 2.8%, 5.34%, 5.62%, 5.61% and 1.87%. MSD-Net is improved in various indicators compared to MobileViT, Acc, Pre, Rec, F1 Score and Spe increase by 1.02%, 2.06%, 2.04%, 2.05% and 0.68%. MSD-Net is improved in various indicators compared to SMT, Acc, Pre, Rec, F1 Score and Spe increase by 1.68%, 3.12%, 3.35%, 3.39% and 1.12%.
From the comparison, it can be seen that the MSD-Net is superior to other networks and its classification performance is better than the other 11 network models. At the same time, in order to compare various classification networks more intuitively, the comparison experiment results are visualized by drawing radar maps. As shown in Fig. 9, MSD-Net is shown as a red polyline in the diagram and located at the outermost edge. Therefore, the classification effect of this model is better than other models.
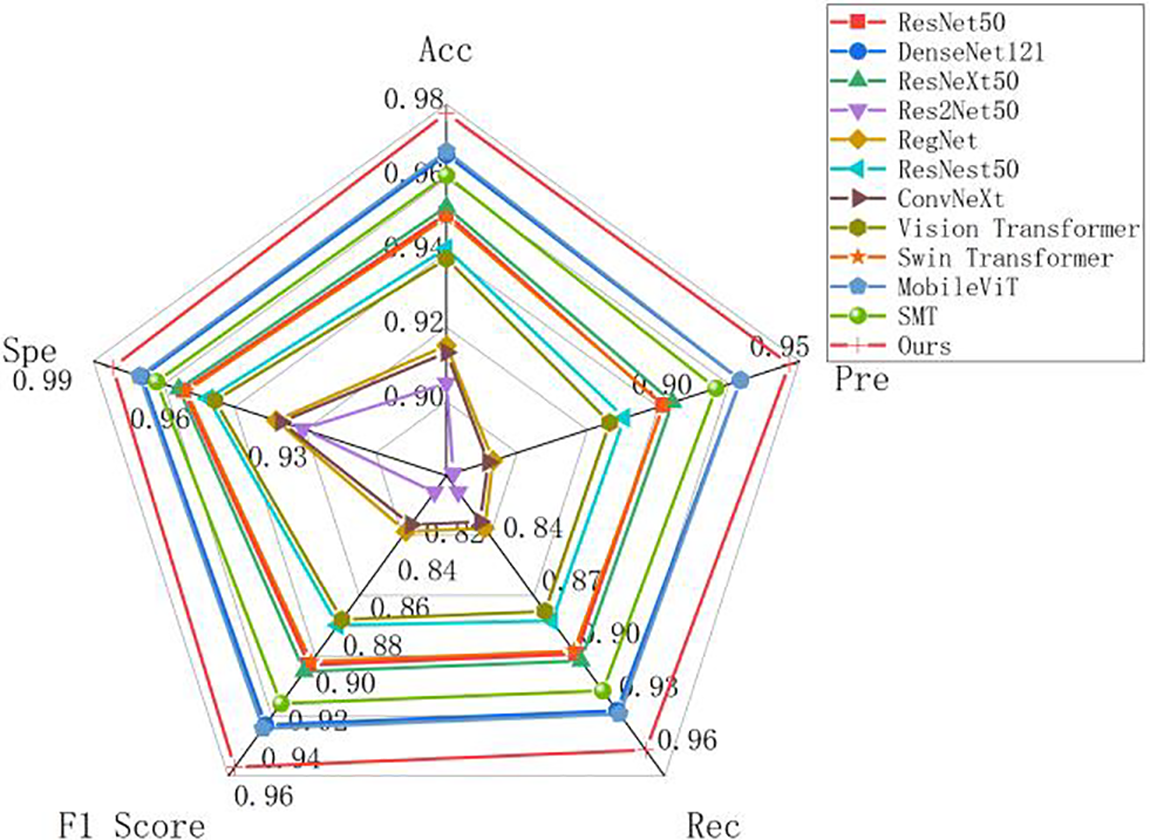
Figure 9: Radar chart of pneumonia classification results of different models
At the same time, this paper uses confusion matrix to visualize the results of each model in the comparsion experiment. The visualized result is shown in Fig. 10. From the comparison results, the same number of true labels and predicted labels for MSD-Net is the highest, it can be seen that the recognition effect of MSD-Net is the best and significantly better than the other models.
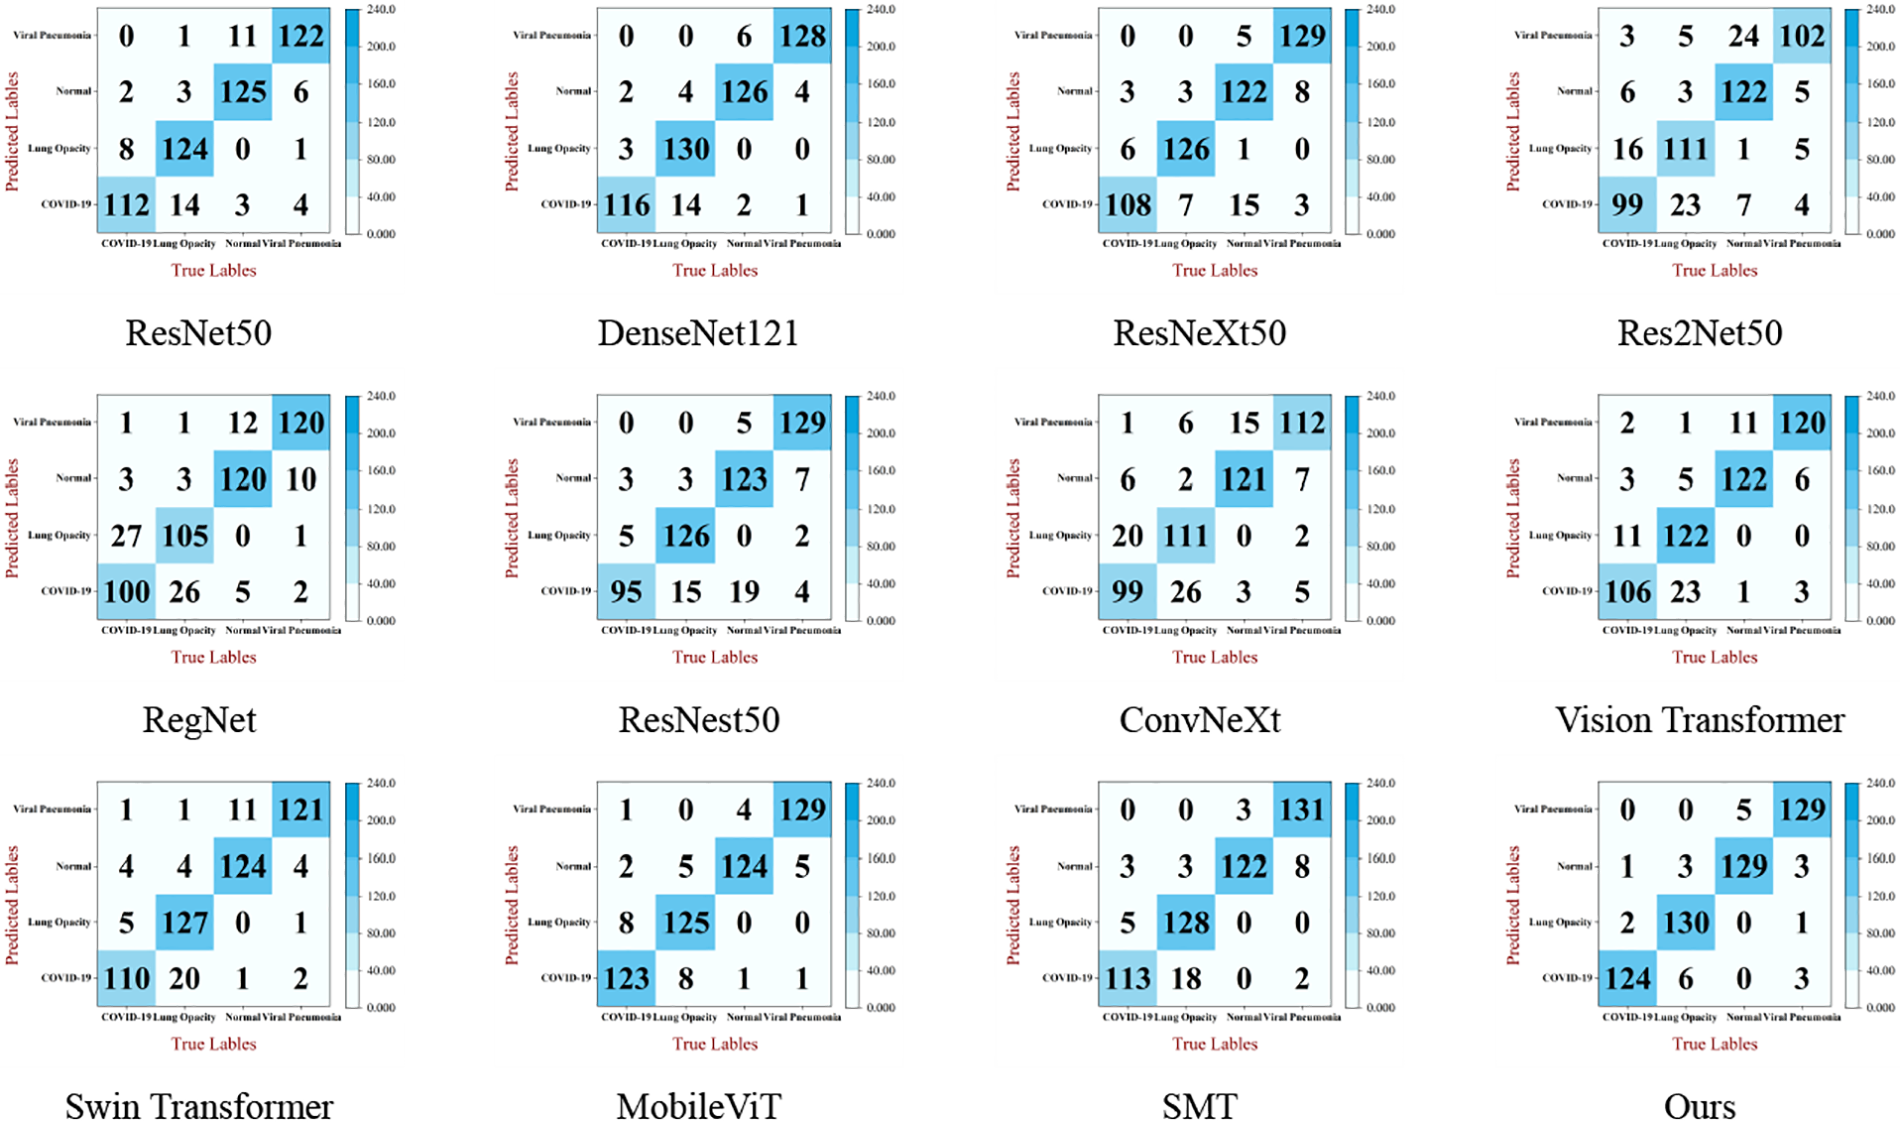
Figure 10: Confusion matrix of classification results of pneumonia X-ray images of each model
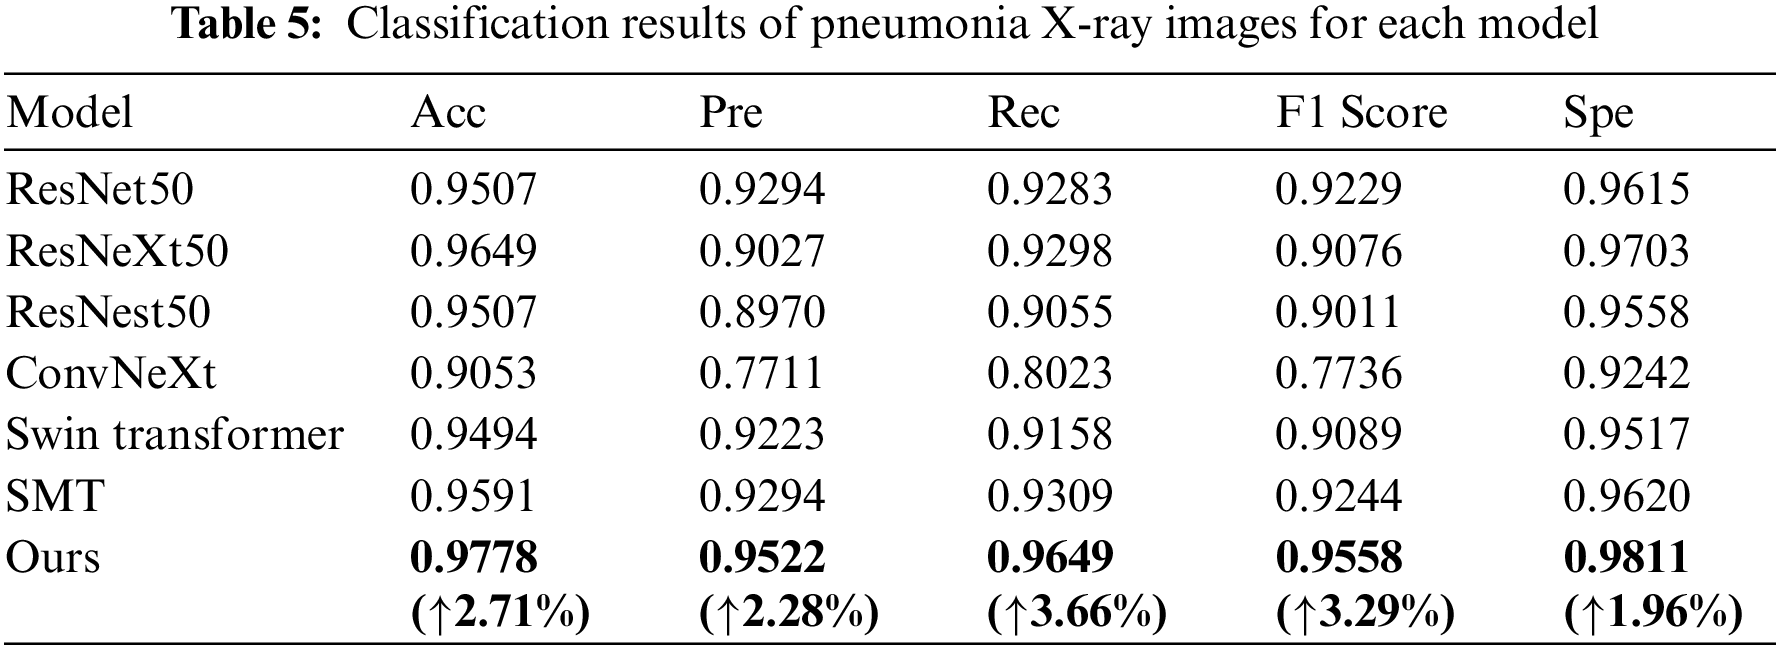
To highlight the validity of the model in this paper, a new four-classification dataset is used [34]. On this dataset, the proposed model is compared with the basic network model, as shown in Table 5. The Acc of the model in this paper is 97.78%, the Pre is 95.22%, the Rec is 96.49%, the F1 Score is 95.58% and the Spe is 98.11%. MSD-Net is improved in various indicators compared to ResNet50, Acc, Pre, Rec, F1 Score, and Spe increase by 2.71%, 2.28%, 3.66%, 3.29%, and 1.96%. MSD-Net is improved in various indicators compared to ResNeXt50, Acc, Pre, Rec, F1 Score, and Spe increase by 1.29%, 4.95%, 3.51%, 4.82%, and 1.08%. MSD-Net is improved in various indicators compared to ResNest50, Acc, Pre, Rec, F1 Score, and Spe increase by 2.71%, 5.52%, 5.94%, 5.47%, and 2.53%. MSD-Net is improved in various indicators compared to ConvNeXt, Acc, Pre, Rec, F1 Score, and Spe increase by 7.25%, 18.11%, 16.26%, 18.22%, and 5.69%. MSD-Net is improved in various indicators compared to Swin Transformer, Acc, Pre, Rec, F1 Score, and Spe increase by 2.84%, 2.99%, 4.91%, 4.69%, and 2.94%. MSD-Net is improved in various indicators compared to SMT, Acc, Pre, Rec, F1 Score, and Spe increase by 1.87%, 2.28%, 3.4%, 3.14%, and 1.91%. It can be seen that the generalization ability of the model is still good despite the different datasets.
There is a problem that lesion size features and direction features are extracted insufficiently in lung X-ray images. To solve it, a multi-scale directional feature enhanced pneumonia classification model MSD-Net is proposed. In this model, three different methods are used to enhance the ability to extract lesion size features and lesion direction features. Firstly, in the ablation experiment, the Acc, Pre, Rec, F1 Score and Spe of MRFEM are 96.08%, 92.37%, 92.16%, 92.16%, and 97.39%, respectively, it is proved that MRFEM can effectively extract multi-scale features. The Acc, Pre, Rec, F1 Score and Spe of MDFPM are 96.64%, 93.59%, 93.28%, 93.31%, and 97.76%, respectively, it is proved that MDFPM can enhance the detailed and direction features. The Acc, Pre, Rec, F1 Score and Spe of ACFM are 96.18%, 92.76%, 92.33%, 92.32%, and 97.45%, respectively, it is proved that ACFM can capture the direction features of the lesion and fully extract the global features. Then, through comparative experiments with different datasets, in the COVID-19 RADIOGRAPHY DATABASE, the Acc, Pre, Rec, F1 Score and Spe of MSD-Net are 97.76%, 95.57%,95.52%, 95.52%, and 98.51%, respectively. In the chest X-ray dataset, the Acc, Pre, Rec, F1 Score, and Spe of MSD-Net are 97.78%, 95.22%, 96.49%, 95.58%, and 98.11%, respectively. The growth of each evaluation index shows that the feature enhancement method proposed in this paper can improve the model’s perception ability of feature size and direction. Finally, the MSD-Net can improve the precision of lung X-ray diagnosis and has positive significance for pneumonia Computer-Aided Diagnosis.
Acknowledgement: The authors would like to thank the anonymous editors and reviewers for their critical and constructive comments and suggestions.
Funding Statement: This work was supported in part by the National Natural Science Foundation of China (Grant No. 62062003), Natural Science Foundation of Ningxia (Grant No. 2023AAC03293).
Author Contributions: Tao Zhou: The framework of the overall paper is proposed; Provision of experimental environment, including a 64-bit Windows Server 2019 Datacenter system equipped, NVIDIA TITAN RTX graphics cards; Fund support, including the National Natural Science Foundation of China, Natural Science Foundation of Ningxia; Evaluation of experimental data; Revision of paper. Yujie Guo: Three innovative points are proposed in the article, including: MRFEM, MDFPM, and ACFM; The code implementation of the article model; Analysis of experimental data, including tabulation of ablation experiment and comparison experiment, analysis of confusion matrix and radar map; The writing of the paper. Caiyue Peng: Drawing of model diagrams in the article; Reference search, analysis, and citations, about the application of transformer in lung disease classification; Correction of incorrect statements in the article. Yuxia Niu: Reference search, analysis, and citations, about the characteristics of pneumonia and the imaging characteristics of pneumonia X-ray images, The application of Convolutional neural network in lung disease classification. Yunfeng Pan: Drawing of model diagrams in the article; The layout of the article, check, proofread; adjust the overall structure; Correction of incorrect statements in the article. Huiling Lu: Two datasets of search, pretreatment, and analysis, including the ratio of 9:1 is divided into the training set and the verification set, Check the final layout of the article.
Availability of Data and Materials: The dataset used in this study are the public dataset COVID-19 RADIOGRAPHY DATABASE which can be download from the link: https://www.kaggle.com/datasets/tawsifurrahman/covid19-radiography-database and Chest X-Ray pneumonia datasets which can be download from the link: https://www.kaggle.com/datasets/paultimothymooney/chest-xray-pneumonia.
Conflicts of Interest: The authors declare that they have no conflicts of interest to report regarding the present study.
References
1. A. G. Mathioudakis et al., “Clinical trials of Pneumonia management assess heterogeneous outcomes and measurement instruments,” J. Clin. Epidemiol., vol. 164, pp. 88–95, 2023. [Google Scholar] [PubMed]
2. P. F. Dequin et al., “Hydrocortisone in severe community-acquired pneumonia,” New Engl. J. Med., vol. 388, no. 21, pp. 1931–1941, 2023. doi: 10.1056/NEJMoa2215145. [Google Scholar] [PubMed] [CrossRef]
3. S. X. Xing, Z. H. Ju, Z. J. Liu, Y. Wang, and F. Q. Fan, “Multi-label classification of chest X-ray images with pre-trained vision Transformer model,” (in ChineseJ. Image Graph., vol. 28, no. 4, pp. 1186–1197, 2023. doi: 10.11834/jig.220284. [Google Scholar] [CrossRef]
4. T. Zhou, B. Q. Huo, H. L. Lu, and H. B. Shi, “Progress of residual neural network optimization algorithm for medical imaging disease diagnosis,” J. Image Graph., vol. 25, no. 10, pp. 2079–2092, 2020. [Google Scholar]
5. T. Zhou, S. Liu, Y. L. Dong, J. Bai, and H. L. Lu, “Parallel decomposition adaptive fusion model: Cross-modal image fusion of lung tumors,” J. Image Graph., vol. 28, no. 1, pp. 221–233, 2023. [Google Scholar]
6. K. He, X. Zhang, S. Ren, and J. Sun, “Deep residual learning for image recognition,” in Proc. IEEE Conf. Computer Vis. Pattern Recognit. (CVPR), Las Vegas, USA, 2016, pp. 770–778. [Google Scholar]
7. S. Khurana et al., “An intelligent fine-tuned forecasting technique for COVID-19 prediction using neuralprophet model,” Comput. Mater. Contin., vol. 71, pp. 629–649, 2022. [Google Scholar]
8. Y. Akbulut, “Automated pneumonia based lung diseases classification with robust technique based on a customized deep learning approach,” Diagnostics, vol. 13, no. 2, pp. 260, 2023. doi: 10.3390/diagnostics13020260. [Google Scholar] [PubMed] [CrossRef]
9. P. Kaur et al., “A hybrid convolutional neural network model for diagnosis of COVID-19 using chest X-ray images,” Int. J. Environ. Res. Public Health, vol. 18, no. 22, pp. 12191, 2021. doi: 10.3390/ijerph182212191. [Google Scholar] [PubMed] [CrossRef]
10. T. Zhou, X. Chang, Y. Liu, X. Ye, H. Lu and F. Hu, “COVID-ResNet: COVID-19 recognition based on improved attention ResNet,” Electronics, vol. 12, no. 6, pp. 1413, 2023. doi: 10.3390/electronics12061413. [Google Scholar] [CrossRef]
11. T. Zhou, F. Liu, X. Ye, H. Wang, and H. Lu, “CCGL-YOLOV5: A cross-modal cross-scale global-local attention YOLOV5 lung tumor detection model,” Comput. Biol. Med., vol. 165, no. 14, pp. 107387, 2023. doi: 10.1016/j.compbiomed.2023.107387. [Google Scholar] [PubMed] [CrossRef]
12. H. Xiao, Q. Liu, and L. Li, “MFMANet: Multi-feature Multi-attention Network for efficient subtype classification on non-small cell lung cancer CT images,” Biomed. Signal Process. Control, vol. 84, no. 3, pp. 104768, 2023. doi: 10.1016/j.bspc.2023.104768. [Google Scholar] [CrossRef]
13. X. Huo et al., “HiFuse: Hierarchical multi-scale feature fusion network for medical image classification,” Biomed. Signal Process. Control, vol. 87, no. 7660, pp. 105534, 2024. doi: 10.1016/j.bspc.2023.105534. [Google Scholar] [CrossRef]
14. A. Gopatoti et al., “MTMC-AUR2CNet: Multi-textural multi-class attention recurrent residual convolutional neural network for COVID-19 classification using chest X-ray images,” Biomed. Signal Process. Control, vol. 85, no. 4, pp. 104857, 2023. doi: 10.1016/j.bspc.2023.104857. [Google Scholar] [PubMed] [CrossRef]
15. X. Zhang, W. Li, C. Gao, Y. Yang, and K. Chang, “Hyperspectral pathology image classification using dimension-driven multi-path attention residual network,” Expert. Syst. Appl., vol. 230, no. 1, pp. 120615, 2023. doi: 10.1016/j.eswa.2023.120615. [Google Scholar] [CrossRef]
16. P. Sreedevi et al., “Da-resbigru-brain tumor classification using Dual attention residual bi directional gated recurrent unit using MRI images,” Biomed. Signal Process. Control, vol. 88, pp. 105596, 2024. [Google Scholar]
17. E. Hassan et al., “A quantum convolutional network and ResNet (50)-based classification architecture for the MNIST medical dataset,” Biomed. Signal Process. Control, vol. 87, no. 7792, pp. 105560, 2024. doi: 10.1016/j.bspc.2023.105560. [Google Scholar] [CrossRef]
18. C. J. Ejiyi et al., “ResfEANet: ResNet-fused external attention network for tuberculosis diagnosis using chest X-ray images,” Comput. Methods Programs Biomed. Update, vol. 5, no. 11, pp. 100133, 2024. doi: 10.1016/j.cmpbup.2023.100133. [Google Scholar] [CrossRef]
19. M. Nawaz, S. Saleem, M. Masood, J. Rashid, and T. Nazir, “COVID-ECG-RSNet: COVID-19 classification from ECG images using swish-based improved ResNet model,” Biomed. Signal Process. Control, vol. 89, no. 2, pp. 105801, 2024. doi: 10.1016/j.bspc.2023.105801. [Google Scholar] [CrossRef]
20. P. Wang et al., “Understanding convolution for semantic segmentation,” in 2018 IEEE Winter Conf. Appli. Comput. Vis. (WACV), Lake Tahoe, Nevada, IEEE, 2018, pp. 1451–1460. [Google Scholar]
21. T. Zhou, Y. Niu, H. Lu, C. Peng, Y. Guo and H. Zhou, “Vision transformer: To discover the “Four secrets” of image patches,” Inf. Fusion, vol. 105, pp. 102248, 2024. doi: 10.1016/j.inffus.2024.102248. [Google Scholar] [CrossRef]
22. M. E. H. Chowdhury et al., “Can AI help in screening viral and COVID-19 pneumonia?,” IEEE Access, vol. 8, pp. 132665–132676, 2020. doi: 10.1109/ACCESS.2020.3010287. [Google Scholar] [CrossRef]
23. T. Rahman et al., “Exploring the effect of image enhancement techniques on COVID-19 detection using chest X-ray images,” Comput. Biol. Med., vol. 132, no. 2, pp. 104319, 2021. doi: 10.1016/j.compbiomed.2021.104319. [Google Scholar] [PubMed] [CrossRef]
24. G. Huang, Z. Liu, L. van der Maaten, and K. Q. Weinberger, “Densely connected convolutional networks,” in Proc. IEEE Conf. Computer Vis. Pattern Recognit. (CVPR), Honolulu, Hawaii, USA, 2017, pp. 4700–4708. [Google Scholar]
25. S. Xie, R. Girshick, P. Dollár, Z. Tu, and K. He, “Aggregated residual transformations for deep neural networks,” in Proc. IEEE Conf. Comput. Vis. Pattern Recognit. (CVPR), Honolulu, Hawaii, USA, 2017, pp. 1492–1500. [Google Scholar]
26. S. Gao, M. Cheng, K. Zhao, X. Zhang, M. Yang and P. Torr, “Res2Net: A new multiscale backbone architecture,” IEEE Trans. Pattern Anal. Mach. Intell., vol. 43, no. 2, pp. 652–662, 2021. doi: 10.1109/TPAMI.2019.2938758. [Google Scholar] [PubMed] [CrossRef]
27. I. Radosavovic, R. P. Kosaraju, R. Girshick, K. He, and P. Dollar, “Designing network design spaces,” in Proc. IEEE/CVF Conf. Comput. Vis. Pattern Recognit. (CVPR), Seattle, USA, 2020, pp. 10428–10436. [Google Scholar]
28. H. Zhang et al., “ResNeSt: Split-attention networks,” in Proc. IEEE/CVF Conf. Comput. Vis. Pattern Recognit. (CVPR), New Orleans, LA, USA, 2022, pp. 2736–2746. [Google Scholar]
29. Z. Liu, H. Mao, C. Y. Wu, C. Feichtenhofer, T. Darrell and S. Xie, “A convnet for the 2020s,” in Proc. IEEE/CVF Conf. Comput. Vis. Pattern Recognit. (CVPR), New Orleans, LA, USA, 2022, pp. 11976–11986. [Google Scholar]
30. A. Dosovitskiy et al., “An image is worth 16x16 words: Transformers for image recognition at scale,” 2020. doi: 10.48550/arXiv.2010.11929. [Google Scholar] [CrossRef]
31. Z. Liu et al., “Swin transformer: Hierarchical vision transformer using shifted windows,” in Proc. IEEE/CVF Int. Conf. Comput. Vis. (ICCV), Montreal, QC, Canada, 2021, pp. 10012–10022. [Google Scholar]
32. S. Mehta and M. Rastegari, “MobileViT: Light-weight, general-purpose, and mobile-friendly vision transformer,” 2021. doi: 10.48550/arXiv.2110.02178. [Google Scholar] [CrossRef]
33. L. Weifeng, W. Ziheng, C. Jiayu, J. Huang, and L. Jin, “Scale-aware modulation meet transformer,” in Proc. IEEE/CVF Int. Conf. Comput. Vis. (ICCV), Paris, France, 2023, pp. 6015–6026. [Google Scholar]
34. D. S. Kermany et al., “Identifying medical diagnoses and treatable diseases by image-based deep learning,” Cell, vol. 172, no. 5, pp. 1122–1131, 2018. [Google Scholar] [PubMed]
Cite This Article
 Copyright © 2024 The Author(s). Published by Tech Science Press.
This work is licensed under a Creative Commons Attribution 4.0 International License , which permits unrestricted use, distribution, and reproduction in any medium, provided the original work is properly cited.
 Downloads
 Citation Tools