
 Submit a Paper
 Propose a Special lssue
 Open Access
ARTICLE

A New Framework for Software Vulnerability Detection Based on an Advanced Computing
1 Department of Information Technology, University of Economics and Technical Industries, Hanoi, 100000, Vietnam
2 Faculty of Information Security, Posts and Telecommunications Institute of Technology, Hanoi, 100000, Vietnam
* Corresponding Author: Cho Do Xuan. Email:
Computers, Materials & Continua 2024, 79(3), 3699-3723. https://doi.org/10.32604/cmc.2024.050019
Received 25 January 2024; Accepted 15 April 2024; Issue published 20 June 2024
 View Full Text
 Download PDF
Abstract
The detection of software vulnerabilities written in C and C++ languages takes a lot of attention and interest today. This paper proposes a new framework called DrCSE to improve software vulnerability detection. It uses an intelligent computation technique based on the combination of two methods: Rebalancing data and representation learning to analyze and evaluate the code property graph (CPG) of the source code for detecting abnormal behavior of software vulnerabilities. To do that, DrCSE performs a combination of 3 main processing techniques: (i) building the source code feature profiles, (ii) rebalancing data, and (iii) contrastive learning. In which, the method (i) extracts the source code’s features based on the vertices and edges of the CPG. The method of rebalancing data has the function of supporting the training process by balancing the experimental dataset. Finally, contrastive learning techniques learn the important features of the source code by finding and pulling similar ones together while pushing the outliers away. The experiment part of this paper demonstrates the superiority of the DrCSE Framework for detecting source code security vulnerabilities using the Verum dataset. As a result, the method proposed in the article has brought a pretty good performance in all metrics, especially the Precision and Recall scores of 39.35% and 69.07%, respectively, proving the efficiency of the DrCSE Framework. It performs better than other approaches, with a 5% boost in Precision and a 5% boost in Recall. Overall, this is considered the best research result for the software vulnerability detection problem using the Verum dataset according to our survey to date.Keywords
Source code vulnerabilities are pieces of source code that lead to software [1]. For conventional software errors, encountering such issues poses the risk of rendering the software inoperable. However, unlike typical software flaws, source code vulnerabilities do not directly harm the software itself; rather, they affect potential security breaches within the system. This is because malicious actors can exploit these vulnerabilities in source code to escalate their access to the victim’s system. Hence, the timely detection and warning of source code vulnerabilities are of utmost importance.
To detect source code vulnerabilities, traditional approaches often involve extracting and processing source code, then checking that code against known Common Vulnerabilities and Exposures (CVE) and Common Weakness Enumeration (CWE) [2]. However, it lacks the ability to detect new vulnerabilities such as zero-day vulnerabilities. To address this issue, recent approaches have employed techniques involving the feature analysis of source code combined with machine learning or deep learning algorithms to search new vulnerabilities within the code.
In particular, in the study [3], various methods and techniques for extracting source code features and classification methods have been summarized. Concerning the feature analysis of source code, recent approaches often aim to standardize source code using natural language processing methods or to transform the code into graph representations [4,5]. After this preprocessing stage, a combination of data extraction techniques and classification methods is applied to detect source code vulnerabilities. Consequently, it can be observed that modern approaches to source code vulnerability detection typically focus on two main issues [6,7]: source code feature extraction methods and methods for predicting and classifying vulnerabilities based on these source code features.
In this article, we propose a new approach for detecting vulnerabilities in source code written in the C and C++ programming languages. The new approach proposed in this article focuses on addressing two main issues: first, improving the feature extraction method for source code; second, optimizing the process of prediction and detection of source code vulnerabilities based on anomalous features. Thus, for the feature extraction process of the source code, this study transforms the source code into a code property graph (CPG) and then uses Gated Graph Sequence Neural Networks (GGNN) for extraction. To predict and classify source code vulnerabilities, we suggest using a combination of three different processing methods: rebalancing data through the Dropout technique, clustering data through contrastive learning, and classifying source code vulnerabilities using Cross-Entropy Loss.
As presented above, for the problem of source code vulnerability detection, the two most critical factors determining the accuracy of the classification process are feature extraction and classification processes. However, based on our observations, recent approaches have not effectively addressed both these issues, leading to limited experimental results [8,9]. Specifically, as follows:
– Regarding the approach to source code feature extraction [10,11], it can be easily recognized that the source code data is in text form. Therefore, to extract these features, one can use either of the two methods: semantic and syntax analysis.
• Regarding the syntactic analysis method, natural language processing techniques are commonly used. However, it can be observed that these methods might not be able to extract features from lengthy source code segments. This limitation arises because these models can only handle relatively short data segments, such as 64 and 128. Despite this, in practice, there are source code segments with very large lengths. If these models are used, they inevitably lack crucial data, which leads to difficulties in the detection model. Standardizing the source code segments to uniform lengths introduces significant inaccuracies. The system cannot determine which source code segment contains the vulnerabilities. Furthermore, attempting to make the lengths uniform would result in concatenation of source code segments, leading to skewed classifications.
• Regarding the semantic analysis method [12,13] to extract source code features, approaches based on this method aim to represent the relationships among functions and parameters within the source code as graphs [14,15]. When observing and analyzing these approaches, it becomes evident that representing source code cannot fully depict the intricate relationships between components within functions and variables in the source code. In other words, the traditional method of constructing source-code features does not cover all aspects. Specifically, when these methods were applied to different datasets, the false-positive rate was quite high. This demonstrates that the proposed method is only suitable for specific datasets, making its application to diverse datasets challenging.
– For the method of source code vulnerability detection [16–19]: After obtaining the feature vectors of the source code, these feature vectors are classified through machine learning algorithms and traditional deep learning. Therefore, classifying source code in such an imbalanced dataset is a challenging task. To address this issue, approaches often use balanced or simple datasets created independently. Hence, it is necessary to optimize and improve the effectiveness of the source code vulnerability classification model.
1.2.2 Proposed Solution Approach
To address the two issues presented in Section 1.2.1, in this study, we propose a completely new approach and model. This model was named DrCSE. The novel approach in the DrCSE model enhances the following two issues:
– For the problem of selecting and extracting source code features: In this study, to extract source code features, we aim to transform the source code into a new graph form called CPG [20]. In [21], it was demonstrated that CPG combines three graph representations of AST, CFG, and PDG into a common data structure.
– For the problem of source code vulnerability classification, rather than directly using machine learning or deep learning algorithms to classify source code feature vectors, we combined several advanced data exploration methods to improve the effectiveness of the classification process.
1.3 Principles of Detecting Vulnerabilities in the Source Code of the DrCSE Framework
Based on the analyses in Section 1.2.2, it can be seen that the proposed vulnerability detection process in the DrCSE Framework consists of the following stages:
• Phase 1. Building source code feature profiles: As described above, this step normalizes the source code data into feature vectors through several steps.
– Step 1: Analyze the source code in CPG format using the Joern tool [20].
– Step 2: Encoding the vertex information using the glove encoding function.
– Step 3: Extracting edge features with Gated graph neural networks (GGNN).
– Step 4: The edge and vertex features collected in Steps 2 and 3 are synthesized into a single feature vector.
• Phase 2. Rebalancing data: Based on the vector obtained in Step 3 of phase 1, we generated additional data containing security vulnerabilities to balance the number of labels in the experiment dataset using the Dropout method.
• Phase 3. Representation learning: The contrastive learning method is used to find feature vectors of the source code that have similarities-contrasts in the dataset. Thus, with similar data pairs, we can “pull” them closer to learn each other’s higher-level features, and conversely, contrasting pairs of data are “pushed” far away. Using this approach, we optimized the source code classification process. The experimental results in this study prove the correctness and reasonableness of our proposal.
• Phase 4. Classification: This phase classifies non-vulnerable source code and code containing security vulnerabilities based on the feature vectors collected from phases 2 and 3. In this phase, we propose the use of Fully Connected Layer functions after the Representation Learning block with a Cross-Entropy Loss.
The main contributions of this paper are summarized as follows:
• A new intelligent calculation method for the DrCSE Framework was proposed to improve the efficiency of the software vulnerability classification process based on a combination of three techniques.
• A method for rebalancing the data using the Dropout technique was proposed. This is a new generation method that has not been studied and applied to generate data for training models to detect software vulnerabilities.
• A method for optimizing software vulnerability detection is proposed based on a contrastive learning technique. The proposed approach enhances the efficiency of the source code vulnerability classification process.
Many authors have used AST-based software vulnerability detection approaches. In [11], the authors proposed the VulDee-Locator model for source-code vulnerability detection. The VulDee-Locator has proven its effectiveness compared to another approach based on the four research questions in the experiment. In addition, a study [16] presented a model that combined the LSTM deep learning model for the security vulnerability detection task using a Software Assurance Reference Database dataset. References [16,22] proposed a method of feature extraction of source code based on ten open-source projects. In [23], the LSTM deep learning algorithm was used to classify source code vulnerabilities after analyzing them from an abstract syntax tree. In [24], a Representation Learning method for source-code vulnerability detection was proposed. Specifically, the authors extracted and transformed the source code into AST form and then combined the BiLSTM and Continuous Bag-of-Words algorithms to analyze and classify source code vulnerabilities. Many more approaches for AST-based source code vulnerability detection use machine learning or deep learning, such as [25–28].
In addition, CFG-based software vulnerability detection techniques have been proposed in several studies. Haridas et al. [14] suggested a SiCaGCN model for vulnerability detection based on CFG and GCN. With the support of Graph Edit Distance, the experimental performances were better than those of other deep learning graph networks. Xu et al. [29] had similar ideals when using a Neural Network-based Graph Embedding model for security vulnerability detection based on Cross-Platform Binary Code Similarity. Harer et al. [30] proposed the use of different algorithms to analyze and extract source code features and the Random Forest algorithm is applied to detect source code vulnerabilities. As a result, the model showed high efficiency with a precision-recall curve of 0.49 and an area under the ROC curve of 0.87. Another effective approach was proposed in [31], which proposed a SySeVR model based on syntax-based, semantic-based, and vector representations. Accordingly, the authors used several methods, such as syntax-based vulnerability candidates (SyVCs), semantic-based vulnerability candidates (SeVCs), and vector representation of SeVCs for source code feature extraction and classification.
Research by Nun et al. [32] presented a natural language processing method combined with the inst2vec algorithm for detecting C and C++ source code vulnerabilities. In the experiment, the authors compared their method with other approaches while applying basic machine learning and deep learning models, such as RNN, Tree-Based CNN. The results were higher than those of most approaches for the same experimental dataset. Li et al. [33] built an IVDetect model, which is a combination of two main methods: consider the vulnerable statements and their surrounding contexts via data and control dependencies and artificial intelligence.
A study [34] proposed a method to detect source code vulnerabilities based on CPG using deep learning algorithms. The authors built a REVEAL model consisting of two main phases: Feature Extraction, and Training (Representation Learning). This approach outperformed the others on two datasets: Verum [34] and FFmpeg+Qume [35]. Cho et al. [36] proposed an EFRC model with a combination of four techniques: source embedding, Feature Learning, Resampling Data, Classification. Accordingly, the EFRC model performs feature extraction of the source code in the form of CPG based on the combined model of the GCN and MLP. The Data Resampling process was performed using the SMOTE algorithm. Finally, an MLP model combined with Triploss is proposed to classify source code vulnerabilities. Cho [37] proposed a DGCNN for CPG feature extraction. It can be seen that traditional approaches use only graph networks to extract CPG. Zhang et al. [38] proposed a combined model of the Graph Attention Network and Metric Learning to extract and classify source code vulnerabilities based on CPG. Consequently, he used a Graph Attention Network to extract information of the source code based on CPG and used Metric Learning for classification. The experimental results show that the proposed model improved by 11.5%, 12.3%, 12.57%, and 7.90% according to the Precision, Recall, F1-score, and AUC measures, respectively.
Zhang et al. proposed the VDBFL model for source code vulnerability detection based on federated learning [27]. In this study, the proposed method includes the following steps: first, the source code is converted into CPG format through the Joern tool; next, GNN and CNN networks are used for feature extraction; eventually, the authors use federated learning for source code vulnerability detection and testing. The experimental results show that the model achieves high accuracy. This is 11.8 times higher than that in research [34].
3 Proposing the DrCSE Framework
3.1 Overview of the DrCSE Framework
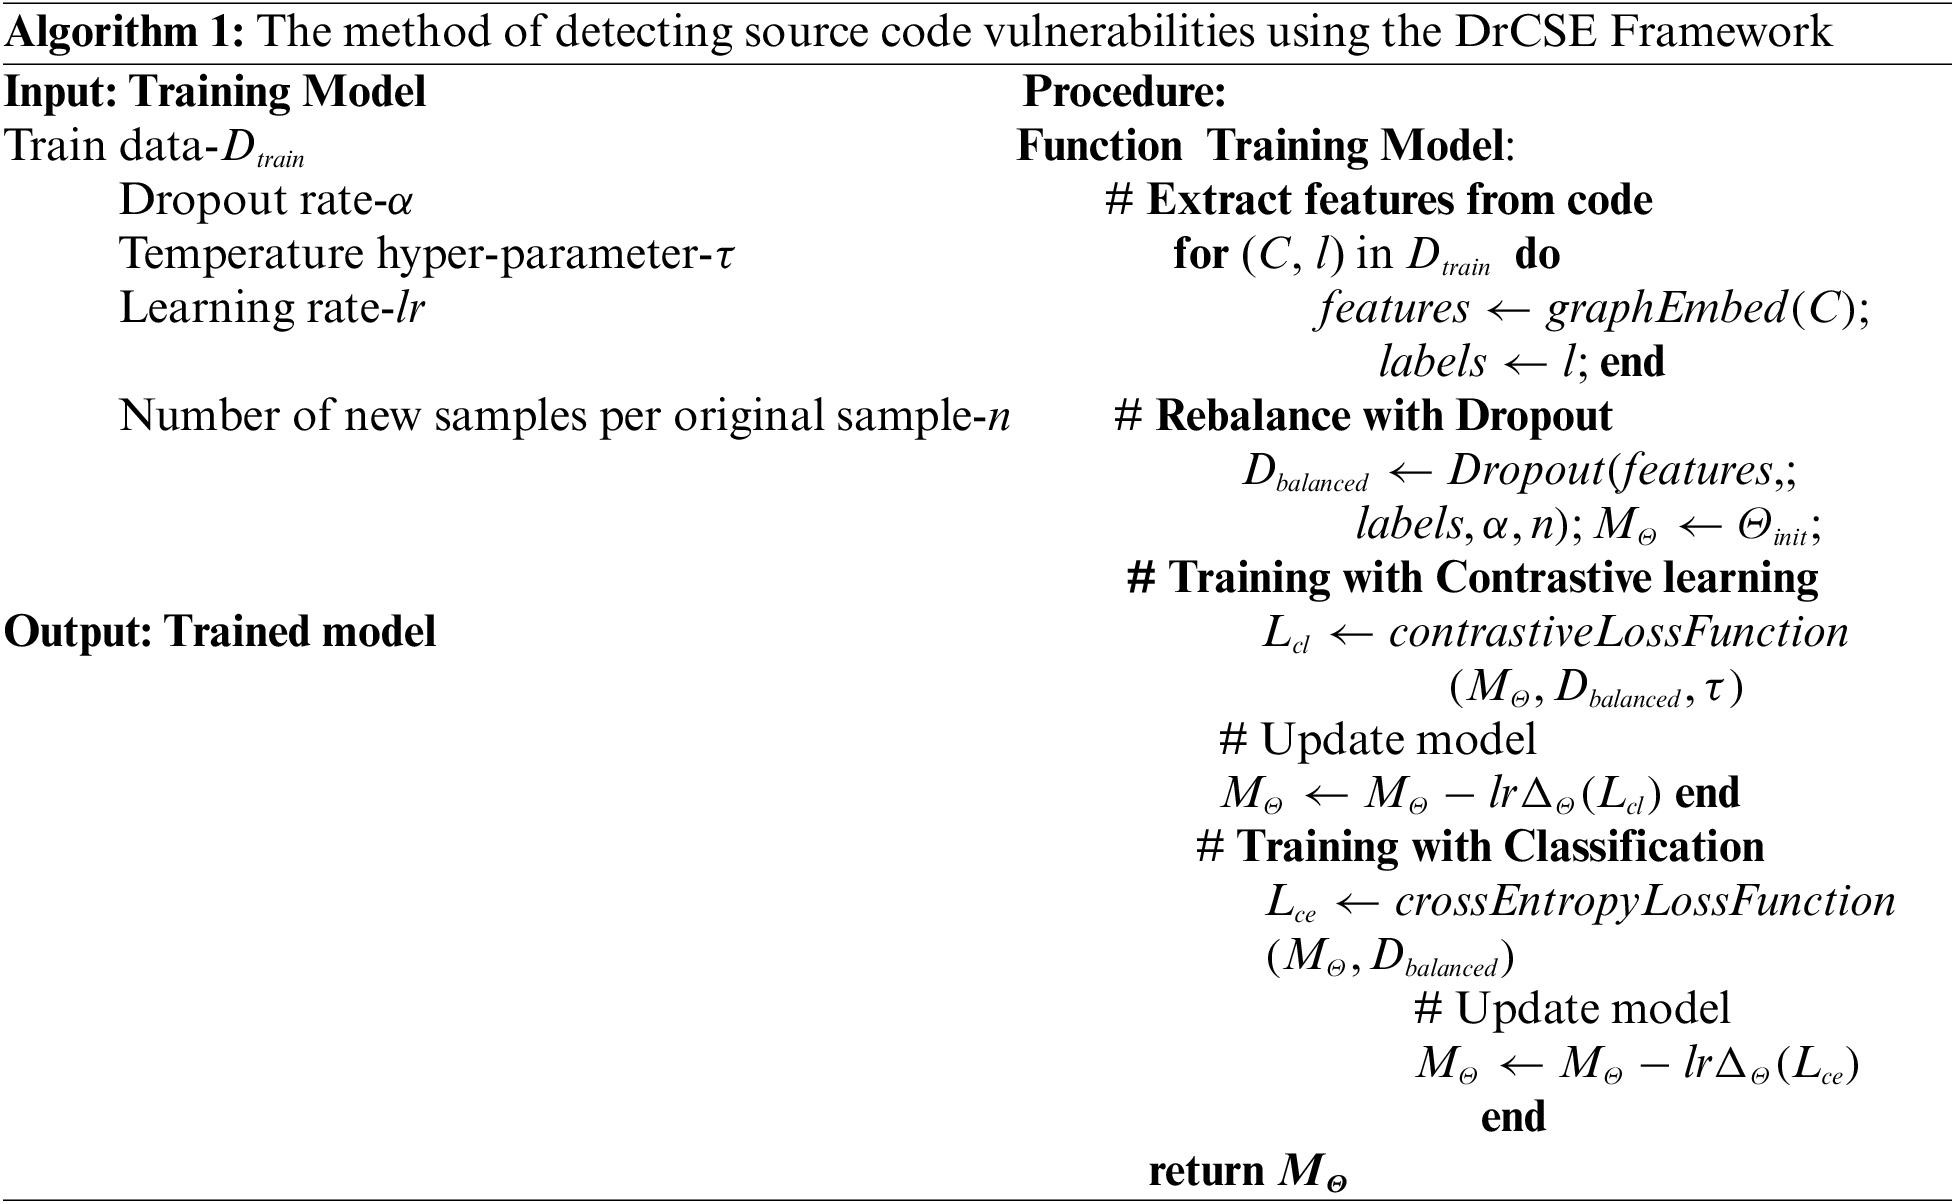
Fig. 1 depicts the source code vulnerability detection model architecture of the proposed DrCSE Framework. As mentioned in Section 1.2, Algorithm 1 describes in detail the method of detecting source code vulnerabilities based on the intelligent computational model proposed in the DrCSE framework.

Figure 1: The architecture of the DrCSE Framework
where:
• Initial parameters-
• Model with parameter Θ-
• Contrastive Loss-
• Derivative of parameter Θ-
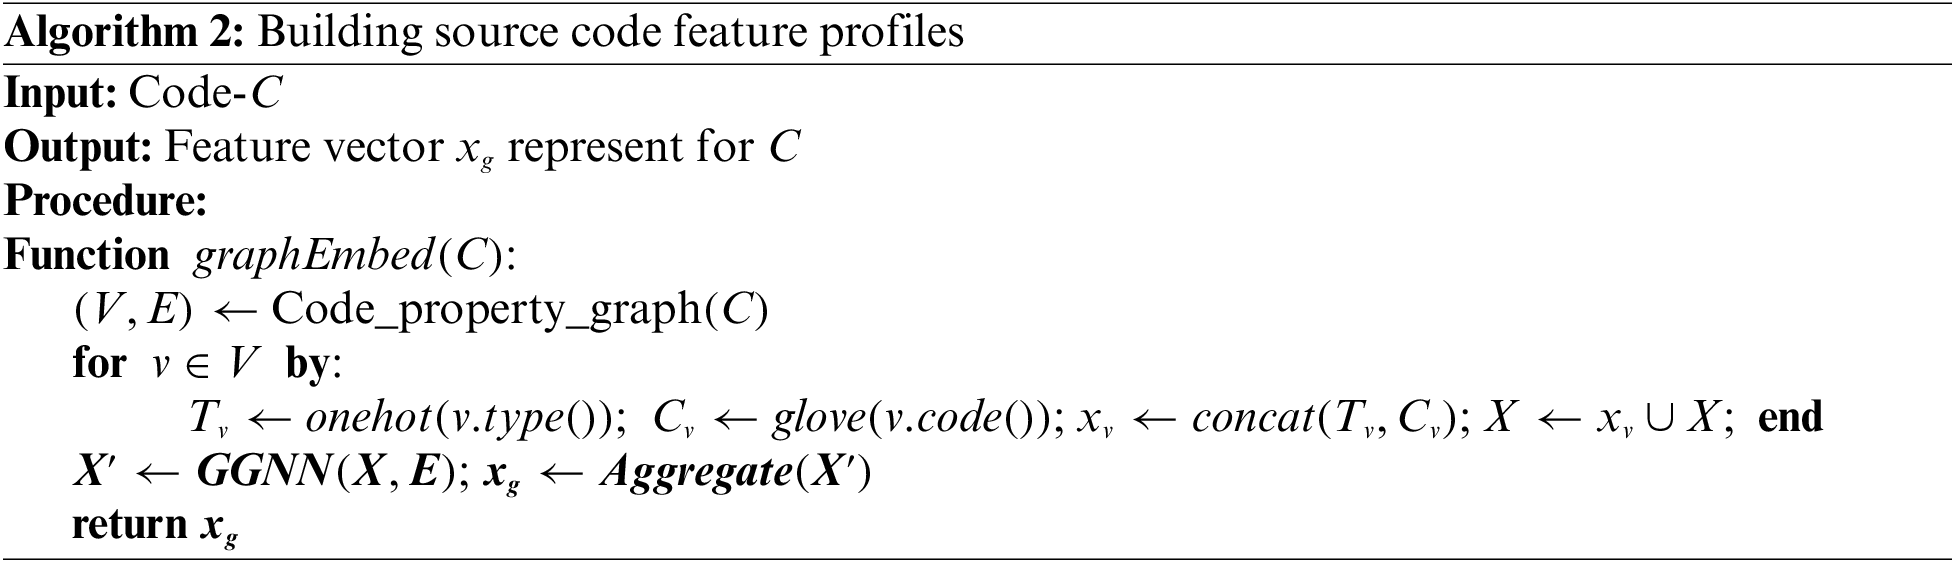
3.2 Building Source Code Feature Profiles (Phase-I)
In this phase, we convert the raw code into a numeric vector that contains both semantic and syntactic information. The following four steps explain in detail how to build a feature profile of the source code using CPG:
• Step 1: Convert the source code to the CPG form. CPG is a useful tool for extracting graph information from control and data flows [21]. Accordingly, with the input of the source code segments, the output of these segments was CPG. CPG is a graph
• Step 2: Vertex information is encoded. To encode the semantic information of vertex
• Step 3: Extracting edge information: The results obtained in Steps 1 and 2 have helped us successfully build a vector
–
–
–
• Step 4: Synthesizing and building feature vectors: To synthesize all the graph’s information according to each vertex
Algorithm 2 demonstrates in detail how to build source code feature profiles from CPG analysis in the DrCSE Framework.
3.3 Rebalancing Data (Phase-II)
The feature profile obtained from the building and synthesizing process in Section 3.2 is classified to detect non-vulnerable source code and source code containing vulnerabilities. To deal with data imbalances during training, some common workarounds are to use the synthetic minority oversampling technique (SMOTE) [41] to adjust the number of samples in each class until the number of records is balanced. To overcome the disadvantages of Smote, in this paper, we propose a new method for generating data for the minority class using the Dropout function. Dropout was first introduced in 2014 [42] to avoid overfitting during training by randomly disabling connections from the previous layer (output is zero). The study [43] presented some concepts and definitions of Dropout. A study [44] used Dropout on a vector representation
where,
Based on this idea, we passed the feature vector through the Dropout function n times to generate n samples with the same class and close to the original feature vector. With this approach, the generated sample vectors are still spatially neighboring the original feature vectors, even though they are not spatially generated. Algorithm 3 describes the data-generation process using the Dropout function in detail.
3.4 Contrastive Learning (Phase-III)
When applying traditional supervised learning methods to detect source code vulnerably, the model depends heavily on the amount of pre-labeled data, whereas the amount of unlabeled data is extremely large.

Contrastive learning aims to help the model learn features by “pulling” similar data points together while “pushing” different data points away in the embedding space.
In this paper, we propose the use of contrastive learning to learn the important features of source-code feature vectors. The working principle of the contrastive learning method is as follows.
Suppose we have a set of data points
With
where,
yi, yj, yk is the label of source code which is 0 with vulnerable source and 1 with clean source.
where,
In the above equation,
Algorithm 4 explains the implementation process of contrastive learning proposed in this paper.

After the data were balanced in Phase 3 by the Dropout method and grouped into clusters according to the same features by contrastive learning, we classified the source code feature profiles to detect non-vulnerable and vulnerable source code. We suggest using a Fully Connected Layer after the contrastive learning block with a Cross-Entropy Loss described in formula (6) as follows:
In which,
During this process, only the parameters in the last classification layer are tuned, and all parameters in the previous representation block are frozen.
Algorithm 5 below describes the vulnerability detection process of the source code.

Table 1 lists the statistics of the experimental datasets used to evaluate the effectiveness of the proposed method.
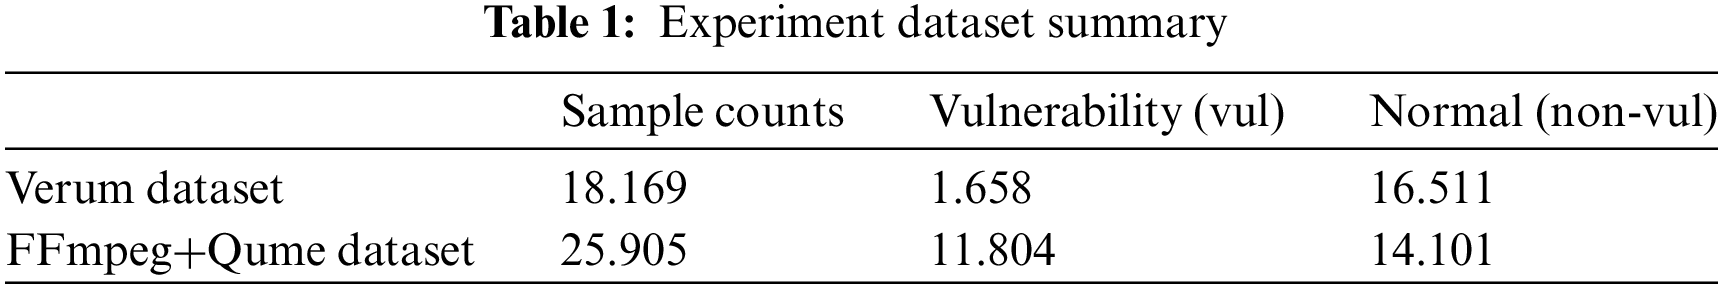
We used Verum [34] and FFmpeg+Qume [35] as the experimental datasets in this study because these two datasets are considered the most consistent with real-world datasets. Current main approaches are often used in these two datasets to detect vulnerabilities. Specifically, researchers used the Verum dataset [34] to apply the data-processing model according to the CPG. The FFmpeg+Qume dataset is often used in structural and semantic approaches. In this study, we used the Verum dataset to evaluate the effectiveness of the proposed model and the FFmpeg+Qume dataset to test its suitability on different datasets.
Below are the four metrics and their formulas used in this study to evaluate the effectiveness of the proposed model.
where,
• Accuracy: is the ratio of the number of samples classified correctly to the total number of samples.
• Precision: is the ratio of true positive points to the total number of points classified as positive (TP + FP).
• Recall: The ratio of true positive points to the total number of real positive points (TP + FN).
• F1-score: is the harmonic mean of precision and recall.
• TP–True positive: The number of vul samples classified correctly.
• FN–False negative: The number of vul samples classified as non-vul.
• TN–True negative: The number of non-vul samples classified correctly.
• FP: False positive: The number of non-vul samples classified as vul.
To demonstrate the effectiveness of the intelligent computational method proposed in the DrCSE Framework, we performed the following experiments:
• Scenario 1: Evaluating the effectiveness of the proposed method when classifying source code vulnerabilities.
• Scenario 2: What is the role and influence of the components in the proposed approach for effectively detecting security vulnerabilities? To answer this question, we conducted several experiments to assess Dropout and Reverse Learning.
• Scenario 3: Is the proposed method more effective than the other methods on the same dataset? To answer this question, we compared our proposed method to other approaches using the same experimental dataset.
• Scenario 4: Can the proposed method perform well on the other datasets? Specifically, we tested our method on the FFMpeg+Qemu Dataset and compared it with other approaches using this dataset.
4.4.1 Parameter Configuration of Experiment Models
Some requirements for hardware and software for the experimental process include:
Software installs: Python 3.9.12; Torch 2.1
Hardware requirements: 32 GB RAM; CPU Intel Core i7-11800 @ 2.30 GHz × 16; GPU 3060.
In addition, during the experiment, we configured several key parameters of the model.
Table 2 lists the parameters used for the experimental DrCSE Frameworks in this study.

4.4.2 Experiment Results of Scenario 1
As described in Section 4.3, this experiment used the Verum dataset to detect the security vulnerabilities. A study [34] pointed out that the Verum dataset has a large difference in terms of data labels. In addition, this dataset had a small duplicate code rate of approximately 0.6%. Therefore, this dataset is appropriate for applications in security vulnerability classification. Table 3 summarizes the results of the proposed method based on the metrics defined in Section 4.2.

In Table 3, we changed two parameters, α and τ, where α is the Dropout probability, and the larger α is, the more deactivated the values in the vector representation. τ is the temperature parameter that controls punishment for negative samples. Research [45] showed that as τ decreases, contrastive loss tends to focus more on regions with a significant degree of similarity. However, when τ is too small, the contrastive loss can be concentrated on only a few samples closest to the trained ones; in this case, τ has a significant influence on the quality of the model.
In Table 3, the model gave the best results when τ = 0.1 and α = 0.1 with the labels containing security vulnerabilities rate up to 69.07%. When the Dropout ratio α was small, the data points generated from the Dropout layer are more similar to the original data points than the data points generated with a larger Dropout ratio α. This helped the model to be better compatible with the small Dropout rate, when increasing α from 0.1 up to 0.2, 0.3, the recall scores decrease by about 2.74% and 5.83%. With the temperature parameter τ, obviously, with τ neither too small nor too large, the model achieved markedly better results for the security vulnerability classification task. When τ = 0.05 (too small), the model only focused on a small area of similar data points, reducing the precision and recall by 2.94% and 5.72%, respectively, compared to τ = 0.1. Conversely, when τ = 0.2 (large), the model was significantly affected by distant data points that may not be similar to the current data point, which directly affected the training results when the recall was also reduced by 4% compared to τ = 0.1. However, with τ = 0.2 and α = 0.1, we obtained the best precision of 40.08%. During training with τ = 0.2, the model performed worse in the classification of both non-vulnerable and vulnerable labels. Nevertheless, the number of non-vulnerable labels was much larger than that of vulnerable labels; therefore, the correctly classified non-vulnerable label counts were much less than the correctly classified vulnerable labels, increasing the precision by approximately 1%. In addition, there was a clear difference between the ability to classify non-vulnerable labels and labels containing security vulnerabilities. For instance, for non-vulnerable labels, the model yielded relatively high classification results (nearly 88% accuracy) for all measures. In contrast, with the vulnerability classification, the results were relatively low. Specifically, the precision score was only 39.35%, the recall was 69.07%, and the F1-score was 50.14%. Overall, the results of this classification were relatively low. Nonetheless, this result was good regardless of the experimental dataset having a difference of approximately ten times between the number of non-vulnerable source codes and the source code containing security vulnerabilities, and with the data duplication rate of 0.6%, the 69.07% recall rate was quite effective. Three main factors contributed to improving the efficiency of source-code vulnerability detection in the proposed DrCSE model:
i) The effectiveness of the Dropout method for rebalancing data
Fig. 2 shows the difference in the data distributions when using and not using the dropout method to rebalance the data.

Figure 2: Differences in data distributions during Rebalancing data. Where (a) before rebalancing data; (b) perform rebalancing data using the Dropout method
As shown in Fig. 2, this method helped balance the labels in the dataset, thereby improving the training results for the classification model. When data rebalancing methods are not used, the model is prone to bias by non-vulnerable labels because it has many more data points than those containing security vulnerabilities. Therefore, rebalancing data is an important step in optimizing the classification results of the training model.
ii) The effectiveness of the representation learning method demonstrated through contrastive learning
Fig. 3 shows the data distributions when using and not using representation learning with contrastive learning. As expected, the influence of representation learning methods in clustering similar data points is the basis for the model to better classify non-vulnerable labels and labels containing security vulnerabilities. In Fig. 3a, the data points of the two labels are confusingly distributed with no clear separation between them. In contrast, when using representation learning to cluster similar data points by pulling the similarities closer and pushing the dissimilar data points further away in the embedding space, as illustrated in Fig. 3b, the data points of the two labels exhibited a clear separation, and the classification results of the model improved significantly.

Figure 3: Differences in data distributions. In which, (a) data when not using representation learning method; (b) data when using representation learning method
iii) The correctness of combining the Dropout method with contrastive learning
We believe that each Dropout component with contrastive learning had a noticeable effect compared to not using them. However, the successful combination of these two methods in a unified model also contributed significantly to the effectiveness of the model. Fig. 4 shows the data distribution in the representation space of the model that combined Dropout with contrastive learning.

Figure 4: The data distribution in the representation space when using the combined method of Dropout with contrastive learning
As shown in Fig. 4, most of the data on non-vulnerable and vulnerable labels were classified into separate clusters, making it possible for the model to detect them easily. Using the Dropout method, we can generate many positive data points from one original data point. At the same time, contrastive learning helped the model synthesize all the information from these positive data points. Making the most of each other’s advantages, the combination of Dropout and contrastive learning methods has shown better classification results than the current vulnerability classification methods.
4.4.3 Experiment Results of Scenario 2
In Scenario 1, we present some experimental results proving the effectiveness of the proposed model for classifying source code vulnerabilities. For scenario 2, our goal was to answer two research questions (RQ) as follows:
• RQ1: What is the role and importance of each component of Dropout and contrastive loss in optimizing the vulnerability detection of the source code?
• RQ2: Why do you combine Dropout with contrastive loss and no other methods? Are other combinations more effective than Dropout and contrastive loss combinations?
To answer these two RQs (ARQs), we conducted the following experiments:
• For RQ1:
– ARQ1: Evaluate the role and effectiveness of the Dropout method in the process of rebalancing data. To do this, we used the Smote method to replace the Dropout method. The empirical model was a combination of smoke and contrastive loss. In addition, to be more objective, this paper also evaluates the approach without using any data generation algorithm.
– ARQ2: Evaluating the role and effectiveness of contrastive loss in the representation-learning process. In this case, the proposed experimental method included the following:
+ The contrastive loss method was replaced by the trip-loss method. The experimental model was a combination of Dropout and trip loss.
+ After the Dropout method processed the data, it was classified using traditional machine learning and deep learning methods, such as MLP and RF. Therefore, the experimental model would be a model combining Dropout with MLP or RF.
• For RQ2:
– ARQ3: The experiments in ARQ1 and ARQ2 have demonstrated the role and importance of Dropout and contrastive loss methods for classifying source code vulnerabilities. It has also been shown that the Dropout method is more effective than the Smote algorithm, and that the contrastive loss method is more effective than the trip loss method. However, the idea is how effective the model would be if we combined the smoke and loss of trip compared with the Dropout and contrastive loss combination. This concept was proposed in [34]. Thus, the experiment of ARQ3 will clarify which approach is better: the Smoke and Tripet loss method in [34], or Dropout and Contrastive loss.
Table 4 presents the results of the proposed models for ARQ1, ARQ2, and ARQ3 underscenario 2.

Based on the experimental results in Table 4 and the experimental results in Table 4, we have the following discussion.
• Discussion 1 on ARQ1 (a) of RQ1: Comparing the results of Tables 3 and 4, the model combining Dropout and contrastive loss yielded much better performance than the smooth and contrastive loss combination models. This result was worse than that of our proposed model by 3%, 2%, and 3%. Similarly, for the non-vulnerable code prediction process, our proposed model was approximately 1% higher than that of the combined model on the F1-score. The Dropout method was more effective than Smote in terms of rebalancing the data in the embedding space. Fig. 5 depicts the distribution of the dataset when the Smoke method was used to rebalance the data.

Figure 5: Data distribution when rebalancing data by Smote method
Fig. 5 shows that the Smote method succeeded in adding new data points to balance the distribution between the two labels in the dataset. Comparing the data distribution between Fig. 5 (using the Smote method) and Fig. 2b (using the Dropout method), it is clear that the Dropout method has demonstrated advantages over the Smote method in adding new data points from the original dataset. Specifically, the Smote creates a new data point using interpolation between two or more neighboring data points in the representation space. Therefore, Smote was quite sensitive to noisy data points with an unfocused distribution, and the variance was quite large, which changed the distribution of the original dataset. To overcome this shortcoming, the Dropout method uses only one data point to generate similar data points. Although the generated data points did not have a relationship between the distances between neighbors in the representation space, such as Smote, Fig. 2b clearly shows that these data points still had similarities and neighbors in the representation space. In addition, the Dropout was less sensitive to noise because the generated data points could only be located in the vicinity of the original data point, which helped the balanced dataset maintain the distribution, as in the original dataset. This further proves the suitability and advantages of using the Dropout for rebalancing data. In addition, based on the experimental results, we can see that the results of the model using data generation technique are much better than those without using this technique. However, there is only one measurement, accuracy, which is about 1% lower. The reason is that the value of accuracy is calculated in terms of both TP and TN, and TP increases but does not increase as much as the number of TN decreases (because the number of labels of normal source code is much larger than the number of labels of vulnerability), the value of accuracy can still decrease even though the values of precision and recall both increase.
• Discussion 2 on ARQ1 (b) of RQ1: When data generation techniques are not used, the source code vulnerability prediction results are completely low. Comparing Table 4 with Table 3, we see that this is the worst result. This result once again proves the correct and reasonable use of data generation techniques.
• Discussion 3 on ARQ2 of RQ1: Our proposed model combining Dropout and contrastive loss resulted in much better performance than the combination of Dropout and Triplet loss. This efficiency clearly demonstrates the ability to accurately detect source code vulnerabilities when the proposed method was 3% higher than that of the combined model. This is considered to be an excellent result for the vulnerability classification task using real datasets. Therefore, the contrastive loss performed better than the triplet loss in training the model to provide a vector representation. Fig. 6 shows the distribution results of the data after processing by the combined model of Dropout and Triplet loss.
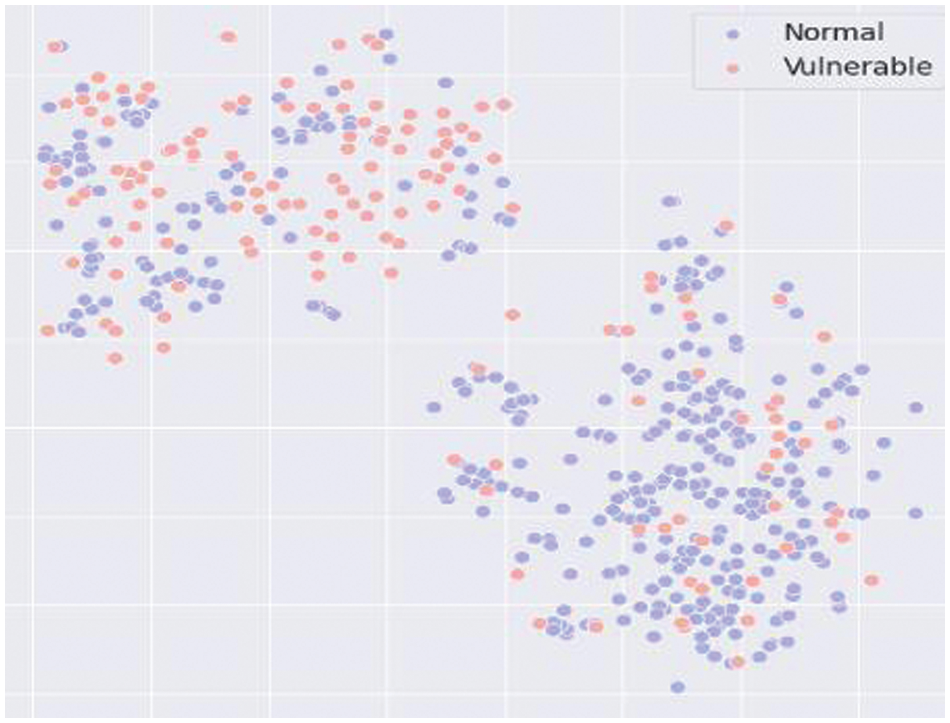
Figure 6: Data distribution when using a combination of Dropout and Triplet loss
Comparing Fig. 6 with Fig. 4, we can see that because of triplet loss traits, the model can only be trained through a pair of positive and negative data (x+, x−). In contrast, our proposed method can generate more than one pair (x+, x−). Therefore, with data containing several generated positive samples, Triplet Loss did not take full advantage of the rebalancing data methods. However, using Contrastive Loss successfully overcame this limitation from Triplet Loss when it helped the model train with many generated positive samples, making the most of the benefits of the method of rebalancing data.
• Discussion 4 on ARQ2 of RQ1: For models that did not use contrastive loss, it is no surprise that their effectiveness is deficient. Accordingly, if only the Dropout method is used to generate data for the training model without using contrastive loss methods to optimize the classification process, then the Dropout method is not useful. Specifically, the models combining Dropout with MLP and Dropout with RF were approximately 22% worse than the proposed model. From Fig. 3 in scenario 1 of the paper, we present the data distribution after using the data rebalancing technique. The cause of this problem is that the vector representations of the source code containing vulnerabilities and the clean source code in the embedding space are still fragmented and not centrally distributed. Meanwhile, classification methods such as MLP or RF are not capable of identifying and classifying non-vulnerable and vulnerable source codes.
• Discussion 5 on ARQ3 of RQ2: For the model replacing the Dropout and contrastive loss method with the smoke and trip loss method, our proposed method yields better results for both the non-vulnerable source code prediction and source code security vulnerability prediction. The experimental results of this model show that the method [34] resulted in 4%, 7%, and 5% lower efficiency on precision, recall, and F1 scores, respectively, than our method. These results were also reasonable because, through the experimental process of replacing Dropout with smoke and contrastive loss with trip loss, the results were less effective. In general, each proposed method is more effective than the individual methods indicated in [34]. Fig. 7 shows the difference in the data distribution in the embedding space of the model combining Smote with triplet loss with our proposed method.

Figure 7: Differences in data allocation when using the loss function. Where (a) data when using Smote + Triplet Loss model; (b) data when using the Dropout + Contrastive Loss model
Fig. 7 clearly shows that the combination of Dropout and Contrastive loss was able to distinguish clusters containing vulnerable and non-vulnerable labels better than the Smote and Triplet loss. Comparing Figs. 7a and 7b, we can see that using Dropout and Contrastive loss is much more successful in grouping data points with the same label than the Smote and Triplet loss methods. From this, we can see the success of combining the two methods of Dropout and Contrastive loss.
Finally, with the experimental results in Table 4, the model that did not use the representation learning method exhibited the worst performance on all measurements.
4.4.4 Experiment Results of Scenario 3
As mentioned above, we experimented with this scenario to test and evaluate the effectiveness of our proposed method with other methods on the same Verum experiment dataset. For research on detecting source code vulnerabilities based on this dataset, we have found that there are studies [34] that we evaluated in Table 4 of scenario 2. In addition, reference [34] conducted experiments and evaluated several algorithms, methods, and techniques of other approaches on the Verum dataset. In this study, we reuse the experimental results presented in [34]. The approaches compared and evaluated with our method include REVEAL [34], Russell [8], VulDeePecker [11], SySeVR [31], and Devign [46]. Table 5 lists the experimental results of other approaches on the Verum dataset.

A comparison of the experimental results in Tables 5 and 3 shows that our proposed method was more effective than the other approaches. Specifically, Russell’s approach [8] was inferior to ours for all the measurements. In particular, with the recall score, this method was lower than our proposed method by more than 60%. Similarly, the VulDeePecker, SySeVR, and Devign methods were much worse.
4.4.5 Experiment Results of Scenario 4
For this scenario, we demonstrated the effectiveness of the proposed method using other datasets. Therefore, we used the FFMpeg+Qemu Dataset for the experiment. The Qemu dataset is a collection of software programs that allow the creation, management, and administration of virtual machines and the operation of virtualized environments on physical servers. FFmpeg includes software programs and libraries for processing videos, audio, and other multimedia streams.
The experimental results in Table 6 show that the DrCSE model was also more effective than the other approaches on the FFMpeg+Qemu Dataset. Specifically, the DrCSE Framework gave experimental scores for Accuracy, Precision, Recall, and F1 of 64.37%, 58.19%, 76.29%, and 66.02%, respectively. This result was approximately 2% higher than that of REVEAL [34] for all the measurements. Meanwhile, the DrCSE Framework performed better than the REVEAL model on both the Verum and FFmpeg+Qume datasets [35]. Moreover, the DrCSE was also much more optimized when experimented on the FFMpeg+Qemu Dataset. For example, when comparing DrCSE with Russell [8], SySeVR [31], and Devign [46], the DrCSE model was 6%–25% more efficient. Likewise, VulDeePecker [11] was less effective than DrCSE by 10% to 35% for all measurements.

From Tables 5 and 6, although the SySeVR [31] and Devign [46] approaches were designed to detect source code vulnerabilities based on the FFMpeg+Qemu dataset, when comparing them with the DrCSE Framework, these two approaches were both less effective. Therefore, the DrCSE framework has brought about flexibility and optimization for detecting software vulnerabilities in many different datasets. This result shows that the combination of Dropout and contrastive learning helped the DrCSE Framework improve the difficulty of detecting source code vulnerabilities on real datasets with different structures.
4.5.1 The DrCSE Framework: An Adaptive Software Vulnerability Detection Based on CPG Analysis
With different scenarios proposed, we proved the superior effectiveness of the DrCSE Framework for source code vulnerability detection. Therefore, the three problems posed previously in the paper have been overcome and improved by the DrCSE Framework, including the following:
a) Source code representation problem.
Although we are not the proponent of a method to process and represent source code in CPG form, but based on CPG documents provided by Joern [20] and the results reported in this paper, we have demonstrated that CPG is more efficient than other code representations, such as AST, CFG, and PDG. In addition, in scenario four’s results when applying the DrCSE Framework on several different datasets, such as FFMpeg+Qemu or Verum, the DrCSE Framework has mostly resulted in higher efficiency than other approaches using AST, CFG, or PDG source code representations. In general, processing source code into CPG form and then applying data mining techniques are considered the current trending solutions for source code vulnerability detection.
b) Source code vulnerabilities classification in unbalanced datasets
The experimental results in scenarios 1 and 2 show the absolute effectiveness of the DrCSE Framework when handling unbalanced data. For instance, the data distribution in Fig. 2 and the RAQ2 experimental results prove the stability and effectiveness of the Dropout method in rebalancing data to support the training models. In addition, with the proposed scenarios, applying Dropout is correct and reasonable when it yields better results than the approach using Smote [34] or when not using the data rebalancing method.
c) Source code vulnerability detection method
In this study, the DrCSE Framework uses the representation learning method with a contrastive learning model to improve the efficiency of the vulnerability detection task. Several scenarios have proven that the DrCSE Framework is much more effective than the approach that does not use representation learning or the approach using representation learning with the triplet loss model. This result reaffirms the effectiveness of the DrCSE Framework in detecting security vulnerabilities using imbalanced datasets. At the same time, based on the experimental results of scenario 4, the DrCSE Framework works effectively not only on one particular dataset but also on many other datasets with different features and structures.
4.5.2 Improving Research Direction
Recently, the development of deep learning models has gradually led to the significant problem of training data shortage. Since then, training methods based on unsupervised learning have become an urgent and essential issue to help improve deep-learning models. In addition to the advantages and benefits of the method combining Dropout and Contrastive Learning in the supervised learning problem presented in this article, DrCSE can also be an unsupervised learning model applied to new tasks. In particular, Dropout can generate similar data points x+ from the original data point x. We then pass these pairs of similar data through Contrastive Learning to “pull” x+ and x come closer together in the representation space and “push” other data points away. This training process can help the model find hidden structures in new data and generate vector representations of new data points.
In addition, when doing this research, we found that the source code representation problem is crucial in detecting security vulnerabilities tasks and many other related works. We empirically used CPG to represent the source code in a graph form. In addition to the advantages of this method, there are still some problems when the extracted information is not accurate, and it still needs a function to convert text to vectors, etc. In the past few years, the fields of natural language processing and language modeling have proven their superiority and effectiveness with text-to-vector representation. For instance, some models have been developed and widely used, such as BERT and GPT. In general, through this study, we found that with source code processing problems, developing a full vector representation model of the source code is essential to improve the results of the prediction task, because some of the current vector representation methods still have certain disadvantages.
In this article, we proposed the DrCSE Framework with a combination of new intelligent computing techniques based on data rebalancing and representation learning methods to improve the efficiency of detecting source code vulnerabilities and minimize false warnings in non-vulnerable source code. Our investigation with four experimental scenarios answered a wide range of questions and proved the correctness and science of the DrCSE Framework for classifying source code vulnerabilities. The scientific correctness of DrCSE is reflected in its flexible combination of Dropout and contrastive learning methods. In addition, the outstanding performance of the classification results on many different datasets demonstrates the practical significance of the DrCSE model. Finally, based on this proposal, we successfully built a new framework that yields good vulnerability prediction results and can be tailored to actual needs.
Acknowledgement: This study was sponsored by scientific research from the Posts and Telecommunications Institute of Technology, Vietnam.
Funding Statement: No funding was received for this work.
Author Contributions: The authors confirm contribution to the paper as follows: Study conception and design: D.X. Cho, B.V. Cong. Experiment and interpretation of results: D.X. Cho, B.V. Cong. Manuscript preparation: D.X. Cho, B.V. Cong. All authors reviewed the results and approved the final version of the manuscript.
Availability of Data and Materials: In this study, we used a public dataset, which can be downloaded from the website if needed (https://github.com/VulDetProject/ReVeal).
Conflicts of Interest: The authors declare that they have no conflicts of interest to report regarding the present study.
References
1. CVE List Downloads in CVE. Accessed: Jan. 15, 2024. [Online]. Available: http://cve.mitre.org. [Google Scholar]
2. CWE Top 10 KEV Weaknesses, 2023. Accessed: Jan. 15, 2024. [Online]. Available: https://cwe.mitre.org/top25/archive/2023/2023_kev_list.html. [Google Scholar]
3. G. Lin, S. Wen, Q. L. Han, J. Zhang, and Y. Xiang, “Software vulnerability detection using deep neural networks: A survey,” Proc. IEEE, vol. 108, no. 10, pp. 1825–1848, 2020. doi: 10.1109/JPROC.2020.2993293. [Google Scholar] [CrossRef]
4. Z. G. Lin, L. Pan, Y. Tai, and J. Zhang, “Software vulnerability analysis and discovery using deep learning techniques: A survey,” IEEE Access, vol. 8, pp. 197158–197172, 2020. doi: 10.1109/ACCESS.2020.3034766. [Google Scholar] [CrossRef]
5. H. Wang et al., “Combining graph-based learning with automated data collection for code vulnerability detection,” IEEE Trans. Inf. Forensics Secur., vol. 16, pp. 1943–1958, 2021. doi: 10.1109/TIFS.2020.3044773. [Google Scholar] [CrossRef]
6. X. Li, W. Li, Y. Xin, Y. Yang, Q. Tang and Y. Chen, “Automated software vulnerability detection based on hybrid neural network,” Appl. Sci., vol. 11, no. 7, pp. 3201, 2021. doi: 10.3390/app11073201. [Google Scholar] [CrossRef]
7. V. C. Bui and X. C. Do, “Detecting software vulnerabilities based on source code analysis using GCN transformer,” in 2023 RIVF Int. Conf. Comput. Commun. Technol. (RIVF), Hanoi, Vietnam, 2023, pp. 112–117. [Google Scholar]
8. G. Siewruk and W. Mazurczyk, “Context-aware software vulnerability classification using machine learning,” IEEE Access, vol. 9, pp. 88852–88867, 2021. [Google Scholar]
9. J. Hu, J. Chen, Z. Lin, Y. Liu, Q. Bao and A. Hilary, “A memory-related vulnerability detection approach based on vulnerability features,” Tsinghua Sci. Technol., vol. 25, no. 5, pp. 604–613, 2020. doi: 10.26599/TST.2019.9010068. [Google Scholar] [CrossRef]
10. X. Li, W. Li, and Y. Xin, “Automated vulnerability detection in source code using minimum intermediate representation learning,” Appl. Sci., vol. 10, no. 5, pp. 1692, 2020. doi: 10.3390/app10051692. [Google Scholar] [CrossRef]
11. Z. Li et al., “VulDeePecker: A deep learning based system for vulnerability detection,” arXiv preprint arXiv:1801.00168, 2018. [Google Scholar]
12. W. Zheng et al., “The impact factors on the performance of machine learning-based vulnerability detection: A comparative study,” J. Syst. Soft., vol. 168, no. 7, pp. 110659, 2020. doi: 10.1016/j.jss.2020.110659. [Google Scholar] [CrossRef]
13. R. Russell et al., “Automated vulnerability detection in source code using deep representation learning,” in 2018 17th IEEE Int. Conf. Mach. Learn. Appl. (ICMLA), Orlando, FL, USA, 2018, pp. 757–762. doi: 10.1109/ICMLA.2018.00120. [Google Scholar] [CrossRef]
14. P. Haridas, G. Chennupati, N. Santhi, P. Romero, and S. Eidenbenz, “Code characterization with graph convolutions and capsule networks,” IEEE Access, vol. 8, pp. 136307–136315, 2020. doi: 10.1109/ACCESS.2020.3011909. [Google Scholar] [CrossRef]
15. Z. Li, D. Zou, J. Tang, Z. Zhang, M. Sun and H. Jin, “A comparative study of deep learning-based vulnerability detection system,” IEEE Access, vol. 7, pp. 103184–103197, 2019. doi: 10.1109/ACCESS.2019.2930578. [Google Scholar] [CrossRef]
16. G. Lin et al., “Software vulnerability discovery via learning multi-domain knowledge bases,” IEEE Trans. Dependable Secur. Comput., vol. 18, no. 5, pp. 2469–2485, 2019. doi: 10.1109/TDSC.2019.2954088. [Google Scholar] [CrossRef]
17. M. Tang, W. Tang, Q. Gui, J. Hu, and M. Zhao, “A vulnerability detection algorithm based on residual graph attention networks for source code imbalance,” Expert. Syst. Appl., vol. 238, pp. 122216, 2024. doi: 10.1016/j.eswa.2023.122216. [Google Scholar] [CrossRef]
18. Suman and R. A. Khan, “An optimized neural network for prediction of security threats on software testing,” Comput. Sec., vol. 137, no. 5, pp. 103626, 2024. doi: 10.1016/j.cose.2023.103626. [Google Scholar] [CrossRef]
19. C. Zhang and Y. Xin, “VulGAI: Vulnerability detection based on graphs and images,” Comput. Sec., vol. 135, pp. 103501, 2023. doi: 10.1016/j.cose.2023.103501. [Google Scholar] [CrossRef]
20. Joern-The Bug Hunter’s Workbench. Accessed: Jan. 15, 2024. [Online]. Available: https://joern.io/ [Google Scholar]
21. F. Yamaguchi, N. Golde, D. Arp, and K. Rieck, “Modeling and discovering vulnerabilities with code property graphs,” in 2014 IEEE Symp. on Secu. and Priv., Berkeley, CA, USA, 2014, pp. 590–604. doi: 10.1109/SP.2014.44. [Google Scholar] [CrossRef]
22. S. Wang, T. Liu, and L. Tan, “Automatically learning semantic features for defect prediction,” in Proc. 2016 IEEE/ACM 38th Int. Conf. Software Eng. (ICSE), Austin, TX, USA, May 14–22, 2016. [Google Scholar]
23. G. Lin, J. Zhang, W. Luo, L. Pan, and Y. Xiang, “POSTER: Vulnerability discovery with function representation learning from unlabeled projects,” in Proc. 2017 ACM SIGSAC Conf. Comput. Commun. Secur., Dallas, TX, USA, Oct. 30–Nov. 03, 2017. [Google Scholar]
24. G. Lin et al., “Cross-project transfer representation learning for vulnerable function discovery,” IEEE Trans. Ind. Inform., vol. 14, no. 7, pp. 3289–3297, 2018. doi: 10.1109/TII.2018.2821768. [Google Scholar] [CrossRef]
25. C. D. Xuan and D. Duc, “Automatically detect software security vulnerabilities based on natural language processing techniques and machine learning algorithms,” J. ICT Res. Appl., vol. 16, no. 1, pp. 70–87, 2022. doi: 10.5614/itbj.ict.res.appl.2022.16.1.5. [Google Scholar] [CrossRef]
26. P. Bian, B. Liang, Y. Zhang, C. Yang, W. Shi and Y. Cai, “Detecting bugs by discovering expectations and their violations,” IEEE Trans. Softw. Eng., vol. 45, pp. 984–1001, 2018. doi: 10.1109/TSE.2018.2816639. [Google Scholar] [CrossRef]
27. C. Zhang, T. Yu, B. Liu, and Y. Xin, “Vulnerability detection based on federated learning,” Inf. Softw. Tech., vol. 167, no. 5, pp. 107371, 2024. doi: 10.1016/j.infsof.2023.107371. [Google Scholar] [CrossRef]
28. S. Liu et al., “CD-VulD: Cross-domain vulnerability discovery based on deep domain adaptation,” IEEE Trans. Dependable Secur. Comput., vol. 19, no. 1, pp. 438–451, 2022. doi: 10.1109/TDSC.2020.2984505. [Google Scholar] [CrossRef]
29. X. Xu, C. Liu, Q. Feng, H. Yin, L. Song and D. Song, “Neural networkbased graph embedding for cross-platform binary code similarity detection,” in Proc. ACM SIGSAC Conf. Comput. Commun. Secur., New York, USA, Oct. 2017, pp. 363–376. [Google Scholar]
30. J. A. Harer et al., “Automated software vulnerability detection with machine learning,” arXiv preprint arXiv:1803.04497, 2018. [Google Scholar]
31. Z. Li, D. Zou, S. Xu, H. Jin, Y. Zhu and Z. Chen, “SySeVR: A framework for using deep learning to detect software vulnerabilities,” IEEE Trans. Dependable Secure Comput., vol. 19, no. 4, pp. 2244–2258, 2022. doi: 10.1109/TDSC.2021.3051525. [Google Scholar] [CrossRef]
32. T. B. Nun, J. S. Alice, and T. Hoefler, “Neural code comprehension: A learnable representation of code semantics,” in Proc. Adv. Neural Inf. Process. Syst., Montréal, QC, Canada, 03–08 Dec. 2018, pp. 3589–3601. [Google Scholar]
33. Y. Li, S. Wang, and N. N. Tien, “Vulnerability detection with fine-grained interpretations,” presented at the 29th ACM Joint Meeting on Eur. Softw. Eng. Conf. Symp. Found. Softw. Eng. Assoc. Comput. Mach., New York, NY, USA, 2021, pp. 292–303. doi: 10.1145/3468264.3468597. [Google Scholar] [CrossRef]
34. C. Saikat, R. Krishna, Y. Ding, and B. Ray, “Deep learning based vulnerability detection: Are we there yet?,” IEEE Trans. Softw. Eng., vol. 48, no. 9, pp. 3280–3296, 2022. doi: 10.1109/TSE.2021.3087402. [Google Scholar] [CrossRef]
35. Download FFmpeg. Accessed: Jan. 15, 2024. [Online]. Available: https://ffmpeg.org/download.html [Google Scholar]
36. D. X. Cho, D. H. Mai, M. C. Thanh, and B. V. Cong, “A novel approach for software vulnerability detection based on intelligent cognitive computing,” J. Supercomput., vol. 79, pp. 17042–17078, 2023. doi: 10.1007/s11227-023-05282-4. [Google Scholar] [CrossRef]
37. D. X. Cho, “A new approach to software vulnerability detection based on CPG analysis,” Cogent Eng., vol. 10, no. 1, pp. 1–16, 2023. doi: 10.1080/23311916.2023.2221962. [Google Scholar] [CrossRef]
38. C. Zhang, B. Liu, Q. Fan, Y. Xin, and H. Zhu, “Vulnerability detection with graph attention network and metric learning,” TechRxiv, vol. 1, pp. 1–17, 2022. doi: 10.36227/techrxiv.19783456.v1. [Google Scholar] [CrossRef]
39. Y. Li, D. Tarlow, M. Brockschmidt, and R. Zemel, “Zemel gated graph sequence neural networks,” in 4th Int. Conf. Learn. Repre., San Juan, Puerto Rico, May 02–04, 2016, pp. 321–328. [Google Scholar]
40. F. Scarselli, M. Gori, A. C. Tsoi, M. Hagenbuchner, and G. Monfardini, “The graph neural network model,” IEEE Trans. Neural Netw., vol. 20, no. 1, pp. 61–80, 2009. doi: 10.1109/TNN.2008.2005605. [Google Scholar] [PubMed] [CrossRef]
41. N. V. Chawla, K. W. Bowyer, L. O. Hall, and W. P. Kegelmeyer, “Smote: Synthetic minority over-sampling technique,” J. Artif. Intell. Res., vol. 16, pp. 321–357, 2002. doi: 10.1613/jair.953. [Google Scholar] [CrossRef]
42. N. Srivastava, G. Hinton, A. Krizhevsky, I. Sutskever, and R. Salakhutdinov, “Dropout: A simple way to prevent neural networks from overfitting,” J. Mach. Learn. Res., vol. 15, no. 56, pp. 1929–1958, 2014. [Google Scholar]
43. P. Baldi and P. J. Sadowski, “Understanding Dropout”, in Advances in Neural Information Processing Systems 26 (NIPS 2013). Red Hook, NY, USA, Dec. 05–10, 2013, pp. 1–9. [Google Scholar]
44. X. Li, S. Chen, X. Hu, and J. Yang, “Understanding the disharmony between dropout and batch normalization by variance shift,” presented at the 2019 IEEE/CVF Conf. Comput. Vis. Pattern Recognit. (CVPR), Long Beach, CA, USA, 2019, pp. 2677–2685. [Google Scholar]
45. F. Wang and H. Liu, “Understanding the behaviour of contrastive loss,” in 2021 IEEE/CVF Conf. Comput. Vis. Pattern Recognition, Nashville, TN, USA, 2021, pp. 2495–2504. [Google Scholar]
46. Y. Zhou, S. Liu, J. Siow, X. Du, and Y. Liu, “Devign: Effective vulnerability identification by learning comprehensive program semantics via graph neural networks,” in 33rd Int. Conf. Neural Inf. Process. Syst., Red Hook, NY, USA, 2019, pp. 10197–10207. [Google Scholar]
Cite This Article
 Copyright © 2024 The Author(s). Published by Tech Science Press.
This work is licensed under a Creative Commons Attribution 4.0 International License , which permits unrestricted use, distribution, and reproduction in any medium, provided the original work is properly cited.
 Downloads
 Citation Tools