
 Submit a Paper
 Propose a Special lssue
 Open Access
ARTICLE

A Deepfake Detection Algorithm Based on Fourier Transform of Biological Signal
1 School of Electrical and Electronic Engineering, Wuhan Polytechnic University, Wuhan, 430023, China
2 School of Mathematics and Computer Science, Wuhan Polytechnic University, Wuhan, 430048, China
3 Paul G. Allen School of Computer Science and Engineering, University of Washington, Seattle, WA, 98195, USA
4 School of Computer Science and Engineering, University of California, SanDiego, CA, 92093, USA
* Corresponding Author: Wu Zeng. Email:
(This article belongs to the Special Issue: Applications of Artificial Intelligence for Information Security)
Computers, Materials & Continua 2024, 79(3), 5295-5312. https://doi.org/10.32604/cmc.2024.049911
Received 22 January 2024; Accepted 14 May 2024; Issue published 20 June 2024
 View Full Text
 Download PDF
Abstract
Deepfake-generated fake faces, commonly utilized in identity-related activities such as political propaganda, celebrity impersonations, evidence forgery, and familiar fraud, pose new societal threats. Although current deepfake generators strive for high realism in visual effects, they do not replicate biometric signals indicative of cardiac activity. Addressing this gap, many researchers have developed detection methods focusing on biometric characteristics. These methods utilize classification networks to analyze both temporal and spectral domain features of the remote photoplethysmography (rPPG) signal, resulting in high detection accuracy. However, in the spectral analysis, existing approaches often only consider the power spectral density and neglect the amplitude spectrum—both crucial for assessing cardiac activity. We introduce a novel method that extracts rPPG signals from multiple regions of interest through remote photoplethysmography and processes them using Fast Fourier Transform (FFT). The resultant time-frequency domain signal samples are organized into matrices to create Matrix Visualization Heatmaps (MVHM), which are then utilized to train an image classification network. Additionally, we explored various combinations of time-frequency domain representations of rPPG signals and the impact of attention mechanisms. Our experimental results show that our algorithm achieves a remarkable detection accuracy of 99.22% in identifying fake videos, significantly outperforming mainstream algorithms and demonstrating the effectiveness of Fourier Transform and attention mechanisms in detecting fake faces.Keywords
In recent years, the evolution of deep learning and the widespread adoption of smart devices have thrust deepfake technology into the societal limelight. This technology leverages machine learning techniques, including autoencoders and Generative Adversarial Networks (GANs), and comprises fake face generators [1], reproduction techniques exemplified by 3D masks [2,3], and methods for manipulating facial expressions [4]. It facilitates the replacement of faces and voices in videos, producing media content that is virtually indistinguishable from reality to the unaided eye, achieving a deceptively high level of visual authenticity.
The emergence of deepfake technology offers new possibilities for the digital art and entertainment industries, such as seamless face replacement in movie production or the creation of amusing content on social media. However, the ease with which such face-swapped fake videos can be produced and disseminated, aided by the ubiquity of social media and the development of smartphone applications, has made discerning the truth increasingly difficult. This situation has sparked significant concerns about the illegal misuse of this content, posing complex threats to society [5]. Deepfake technology not only undermines public trust in the videos they encounter and invades privacy and portrait rights to some extent, but it also exposes numerous face detection-related systems to fraud attacks. More alarmingly, fabricated videos of political figures making statements could potentially mislead the public, incite political or religious conflicts, affect election outcomes, and even threaten global security [6,7]. Consequently, it is crucial to remain vigilant against the misuse of deepfake technology and to develop effective detection methods to mitigate its adverse effects on society.
Numerous researchers have proposed various methods to detect deepfakes, including techniques based on facial visual features, deep network learning, and biometric signal characteristics. Among these, methods based on biometric signals generally yield better outcomes. This is attributed to the fact that while current deepfake generators focus on achieving highly realistic visual effects, they often neglect to replicate the biometric signals inherent to each person’s face. These signals, linked to the periodic beating of the heart, cause fluctuations in the volume of blood within superficial facial veins, altering skin reflectivity due to varying concentrations of hemoglobin in the blood. To date, no deepfake generation model has successfully replicated this type of PPG (Photoplethysmography) biometric signal [8].
As a result, we utilize remote photoplethysmography (rPPG), which can detect subtle changes in skin color through camera analysis. This enables us to extract biometric signals related to heartbeats from genuine facial video sequences. In contrast, from fake face video sequences, we derive deepfake signals (a form of noise). By comparing these signals, we can accurately determine the authenticity of the faces.
Upon acquiring the aforementioned time-domain signals, we aim to extract discriminative information from both the time and frequency domains. The time domain intuitively reflects the amplitude variations over time, with periodicity and waveform shape serving as excellent indicators of cardiac activity, and thus providing a crucial basis for analysis. In the frequency domain, much research such as [9] has concentrated on the power spectral density (PSD), which describes how the power of a signal is distributed across various frequencies. Discrete peaks in the PSD effectively highlight the periodic components of the signal, such as heartbeats, serving as a viable criterion for classification. However, in studies focused on calculating heart rate from facial videos, we discovered that conducting a Fast Fourier Transform (FFT) on the time-domain rPPG signals to derive the amplitude spectrum, and then identifying the peak frequency and multiplying it by 60, yields an instantaneous heart rate. This suggests that FFT is also closely related to human cardiac activity. Consequently, in this paper, we will explore which of the two frequency domain representations—PSD or FFT—exhibits greater differences when analyzing real vs. fake face videos, thereby containing more discriminative information.
Furthermore, to better reflect the consistency of heartbeats across different facial regions, we extract rPPG biometric signals separately from multiple Regions of Interest (ROIs) on the face. These signals are arranged sequentially, with time-domain signals at the top and their corresponding frequency-domain signals below, visualized using a heatmap. This approach consolidates the information from the entire video into a single image and prevents the leakage of facial information. Additionally, representing signal amplitude through variations in color intensity on the heatmap makes the differences between real and fake face videos more visually intuitive. Most importantly, this method transforms the multi-signal classification problem into a single-image classification challenge, enabling the use of advanced image classification networks.
To enhance the generalization capability and performance of our neural network model, we have also incorporated attention layers, aiming to surpass the accuracy of mainstream algorithms.
The main contributions of our work are:
1. We have recognized the significance of the Fourier Transform as a frequency domain representation and encoded facial videos into Matrix Visualization Heatmap (MVHM) for input into image classification networks. Our experiments on the public dataset DeepFakeTIMIT have shown our algorithm achieves an accuracy of 99.2%, indicating that FFT of rPPG biometric signals contains more discriminative information for distinguishing real from fake faces compared to PSD.
2. The spatial attention mechanism has played a crucial role in enhancing the performance of the VGG19 network, with an increase of up to 9.38 percentage points.
The rest of the article is structured as follows: The section on Related Work summarizes mainstream methods for detecting deepfakes, with a focus on detectors based on biometric signals. The Methodology section presents the framework of our proposed fake face detection system in the form of a flowchart and details the methods and principles of key components. Performance Analysis then displays the configurations and results of various experiments. We also analyze these results and compare them with other advanced algorithms. Finally, in the Conclusion section, we draw conclusions and look forward to our future research endeavors.
Fake face detection algorithms are mainly divided into three categories:
Based on facial visual features: Li et al. [10] proposed the Long-term Recurrent Convolutional Networks (LRCN) to capture the temporal dependencies characteristic of human blinking. They evaluated their algorithm using the UADFV database, achieving a commendable AUC of 99%. Jung et al. [11] combined Fast-HyperFace [12] and EAR [13] algorithms to introduce a deep vision approach for tracking blinking, which showed promising performance on their own dataset with an accuracy of 87.5%. Agarwal et al. [14] focused on the different facial expressions and movements while speaking, inputting these features into the widely used machine learning classifier SVM, and achieved an AUC of 96.3% on their dataset.
When generating fake faces, artifacts arise due to the facial differences between the source and target faces, serving as potential detection targets. For instance, Matern et al. [15] introduced a detector based on simple visual artifacts (such as eye color inconsistencies, missing reflections, and lack of detail in the teeth area), ultimately achieving an AUC of 85.1%. Yang et al.'s [16] algorithm is capable of identifying inconsistencies in head posture brought about by fake faces. Li et al. [17,18] proposed a CNN-based detection system highly sensitive to image alterations to detect the presence of warping artifacts around the face and surrounding areas, one of the most powerful methods against subtle facial manipulation techniques.
Leveraging deep learning to enable the network to autonomously discern and classify based on distinct features between authentic and fabricated videos: Deep learning-based fake detectors are the most popular, requiring only the provision of as many real/fake videos as possible to the network, which then autonomously extracts discriminative features. Typically, these fake detectors utilize popular network architectures such as Xception [19,20], Capsule Networks [21], MesoNet [22], Two-stream neural networks [23], Multi-task learning [24], and CNNs enhanced with attention mechanisms [25,26].
In [27], the authors diverged from the mainstream visual approaches that utilize the entire facial region for feature extraction. Instead, they evaluated the discriminative ability of various small facial regions against fake faces using state-of-the-art network architectures, achieving impressive results on both first and second-generation deepfake databases.
Based on biological signal characteristics: We particularly focus on fake face detectors based on biometric features, as this aligns with our approach. Studies [8,9,28] investigated the periodic presentation of reflected light caused by blood volume changes in the face using deepfake videos. In [8], Ciftci et al. utilized rPPG technology to extract physiological parameters and applied it to two commonly used classification networks, SVM and CNN. They verified the accuracy of their algorithm on two datasets, achieving 94.9% on FaceForensics++ and 91.5% on Celeb-DF. Later, in [9], Ciftci et al. discovered that each fake face generation model exhibited unique residuals (i.e., fake heartbeats). Thus, they used rPPG to extract PPG signals from real and fake face videos and input them into advanced classification networks, not only distinguishing the authenticity of videos with an accuracy of 97.29% but also tracing the source of fake face generation models with an accuracy of 93.39%. In [28], Qi et al. introduced a fake detector named deephythm. Deephythm is better adapted to dynamic changes between frames and various types of fake faces, consisting of two modules: (i) motion magnification and (ii) dual attention mechanism. It achieved excellent results with an accuracy of 100% on the FaceForensics++ database but performed poorly on the DFDC Preview, with an accuracy of only 64.1%. However, the preprocessing part of this algorithm consumed a significant amount of computational power, requiring precise detection of 81 facial feature points and the use of a color magnification algorithm.
Hernandez-Ortega et al. [29] introduced DeepFakesON-Phys to investigate how much improvement biometric signals represented by rPPG could bring to fake video detection. They employed the Convolutional Attention Network (CAN) for classification tasks, achieving over 98% AUC on both Celeb-DF and DFDC databases, making it one of the best deepfake detectors currently available.
We propose a fake face detection system as illustrated in Fig. 1. The system primarily consists of five key steps: selection of facial Regions of Interest (ROI), extraction and preprocessing of rPPG signals, time-frequency domain analysis of rPPG signals, generation of Matrix Visualization Heatmap (MVHM), and training of a Convolutional Attention Neural Network. Initially, upon receiving facial video frames (a), the system performs face detection to capture the ROI area (b). It then extracts rPPG signals using the Chrom method and conducts noise removal (c), followed by a time-frequency domain analysis of the rPPG signals, employing Fast Fourier Transform for frequency domain analysis (d). Subsequently, it forms a matrix with the rPPG signals and their corresponding FFTs, visualized in the form of a heatmap (e). Finally, this heatmap is fed into the VGG19 network, which is trained for fake face detection (f).
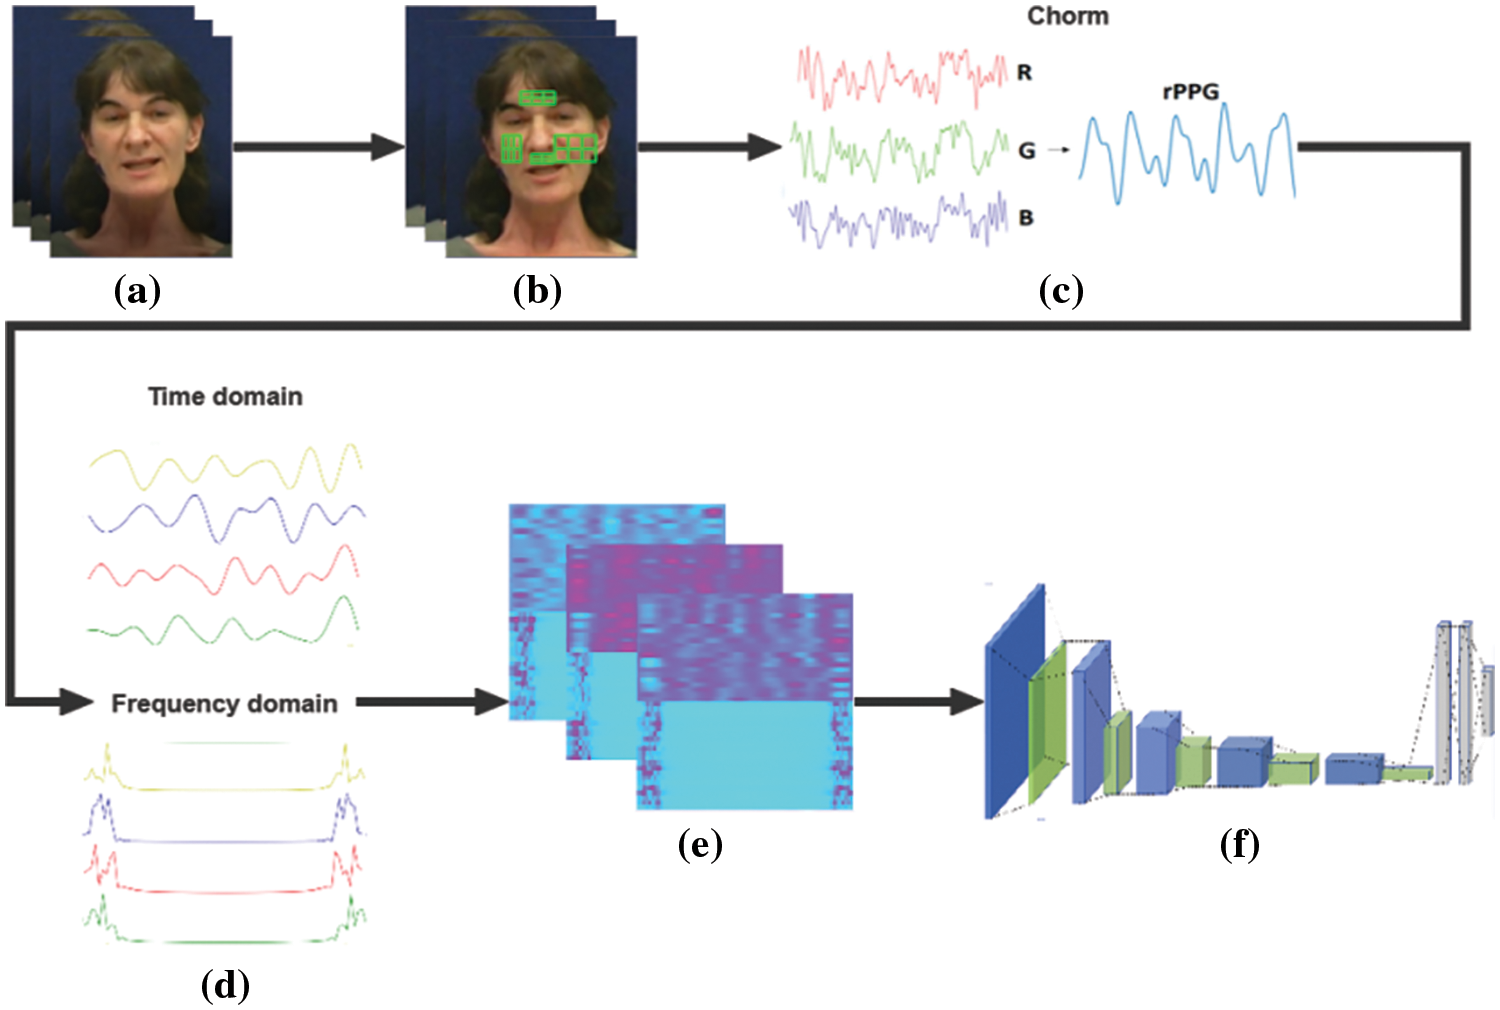
Figure 1: System overview
In this paper, the selection of Regions of Interest (ROIs) is based on the coordinates of 81 facial landmarks, utilizing a pre-trained model from the dlib library. This model comprehensively covers major facial areas such as the eyes, eyebrows, nose, lips, and contours, enabling precise facial segmentation. It employs the Gradient Boosting Trees method, which ensures that the ROIs defined by these landmarks adapt to facial movements for effective tracking. We ultimately selected four regions: the forehead, left and right cheeks, and the philtrum, as these areas are rich in blood vessels and have moderate skin thickness, making them ideal for containing abundant pulse signals and theoretically offering better detection of deepfake attacks. To account for the consistency of heartbeats across different areas and the impact of noise, we further subdivided these regions into 22 smaller segments, thereby increasing the number of rows in the signal matrix.
In this paper, we extract rPPG biometric signals from each ROI using the Chrom method [30]. The Chrom method computes the average red, green, and blue (RGB) values within the region, offering a degree of robustness against lighting changes, which is crucial for accurately detecting fake faces under various environmental conditions. Moreover, its ease of implementation across different devices broadens the applicability of our algorithm.
The principle of Chrom is as follows: It begins by iterating through all video frames, calculating the average RGB values within the ROI of each frame, and transforming these into a vector, meanrgb. Then, using a projection matrix, meanrgb is transformed into a new color space, XY, with the projection matrix designed to minimize the impact of environmental lighting and enhance the visibility of minor color changes caused by the heart pumping blood. This process can be expressed mathematically:
In this process, XY represents the matrix vector formed by signals X and Y, P stands for the projection matrix, and meanrgbT is the transpose of the meanrgb vector.
Subsequently, we calculate the standard deviation of the X and Y signals and create a weight matrix. This weight matrix is then transposed and multiplied by the XY matrix to compute the S signal. Following this, the S signal is normalized to obtain the final rPPG signal, removing the impact of any scale factors. The aforementioned process can be expressed using the following formulas:
In this context, std(X) and std(Y) respectively represent the standard deviation of signals X and Y, with weights denoting the weight matrix. S refers to the S signal, while Sn denotes the S signal after normalization.
The rPPG signals calculated through the aforementioned steps still contain low-frequency trends and high-frequency noise, which we aim to preprocess through sliding window detrending and Butterworth band-pass filtering. Sliding window detrending is designed to remove linear trends or other slowly varying non-periodic components from the signal. This is achieved by sliding a fixed-size window across the signal and subtracting the average value within each window, effectively reducing or eliminating low-frequency trends. This method adapts to non-global changes in the signal and provides a more stable baseline for further analysis. The Butterworth filter, on the other hand, suppresses noise and irrelevant frequencies while retaining information pertinent to the pulse. In our experiments, we set the number of windows to 15 and the filter range between 0.8 and 3 Hz, corresponding to the normal human heart rate range. As demonstrated in Fig. 2, both the low-frequency trends and high-frequency noise have been effectively eliminated.
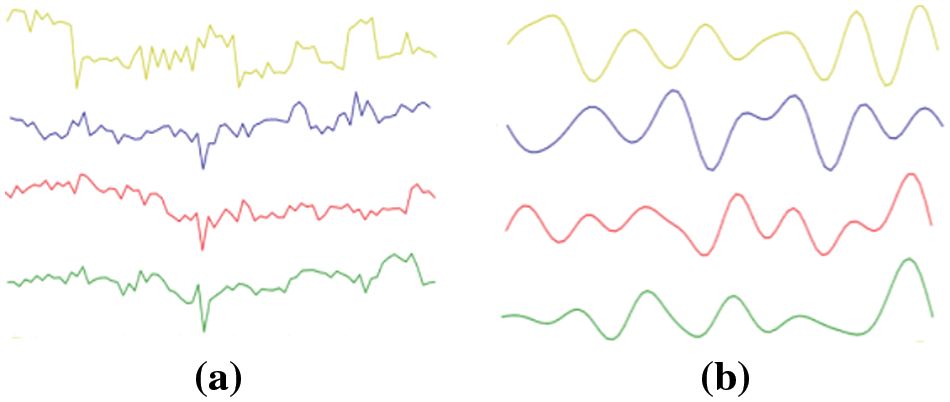
Figure 2: Comparison before and after using sliding window detrending and bandpass filtering (a) before removing noise (b) after removing noise
3.5 Time and Frequency Domain Analysis of Signals and Generation of MVHM
Any signal can be analyzed from both time and frequency domain perspectives. In the time domain, rPPG biometric signals allow us to intuitively observe how amplitude changes over time. Their exhibited periodicity and waveform shape effectively reflect cardiac activity, highlighting the importance of the time domain. In the frequency domain, the signal manifests in two primary forms: the amplitude spectrum and power spectral density (PSD). The amplitude spectrum provides insights into the frequency composition of a signal, indicating which frequencies are most prominent or where the signal’s energy is primarily concentrated. Typically, the Fourier Transform of an rPPG signal can intuitively reflect the real-time heart rate. The power spectral density describes the function of power distribution over frequency, used to identify and analyze noise and oscillations within the signal. Thus, the cardiac activity reflected in real face videos and the noise emanating from fake face videos can be distinguished in the power spectral density. In summary, both the FFT and PSD of biometric signals are related to cardiac activity and can theoretically serve as bases for distinguishing between real and fake faces. Our investigation focuses on which of these displays a more pronounced difference when analyzing real vs. fake face videos, and which combination with time-domain signals contains more discriminative information.
Ciftci et al. [9] introduced a spatiotemporal block called PPG CELL for deepfake detection, which comprises 32 rPPG signals and their corresponding PSDs, achieving an accuracy of up to 97.29%. However, he did not consider the frequency domain representation of FFT. We also found that the lengths of the FFT and the rPPG time-domain signals are consistent, allowing their integration to form a matrix. This uniformity means that each signal value occupies an equal number of pixels, with a uniform distribution, unlike the PSD and rPPG time-domain signal lengths, which do not match and therefore cannot be arranged into a matrix. Based on this observation, we constructed a Matrix Visualization Heatmap (MVHM) composed of PPG and FFT, aimed at enhancing detection performance. Specifically, this paper applies Fast Fourier Transform to 22 rPPG signals, then arranges the rPPG time-domain signals on top with their corresponding FFTs below in a sequence to form a 44-row matrix. This matrix is then visualized as a heatmap, creating our discriminative label MVHM. To minimize training time without sacrificing information, we set the resolution of the MVHM to 240 × 240. An example of an MVHM generated from dataset samples is shown in Fig. 3.

Figure 3: Example of MVHM
3.6 Neural Networks and Attention Mechanism
At this point, the problem of detecting fake faces transforms into an image classification challenge, where the differences in biometric signals between real and fake videos in the time-frequency domain are now represented as textural differences on the MVHM. Consequently, this study employs the pretrained weights of VGG19 for transfer learning and incorporates an attention mechanism to accelerate the training process and enhance the model’s generalization capability and performance. The training framework is depicted in Fig. 4.
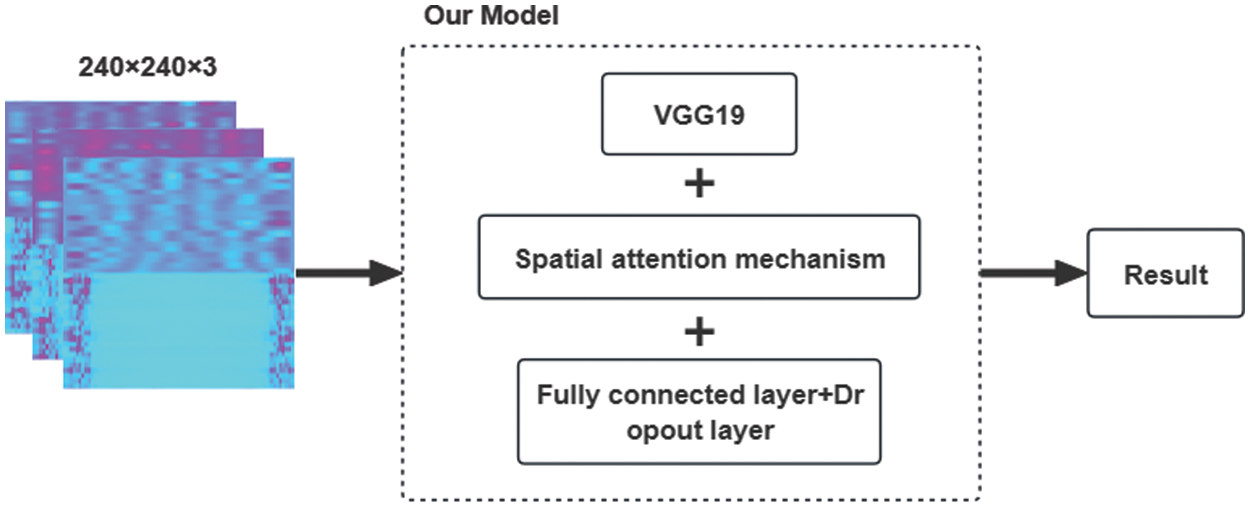
Figure 4: Our model framework
VGG19 is a deep learning model developed by researchers from the Visual Geometry Group at the University of Oxford and Google DeepMind, specifically designed for image recognition and classification. It was one of the top-performing models in the 2014 ILSVRC (ImageNet Large Scale Visual Recognition Challenge). VGG19 comprises 19 layers, including 16 convolutional layers, 3 fully connected layers, and 5 max-pooling layers. The architecture of VGG19 is illustrated in Fig. 5.
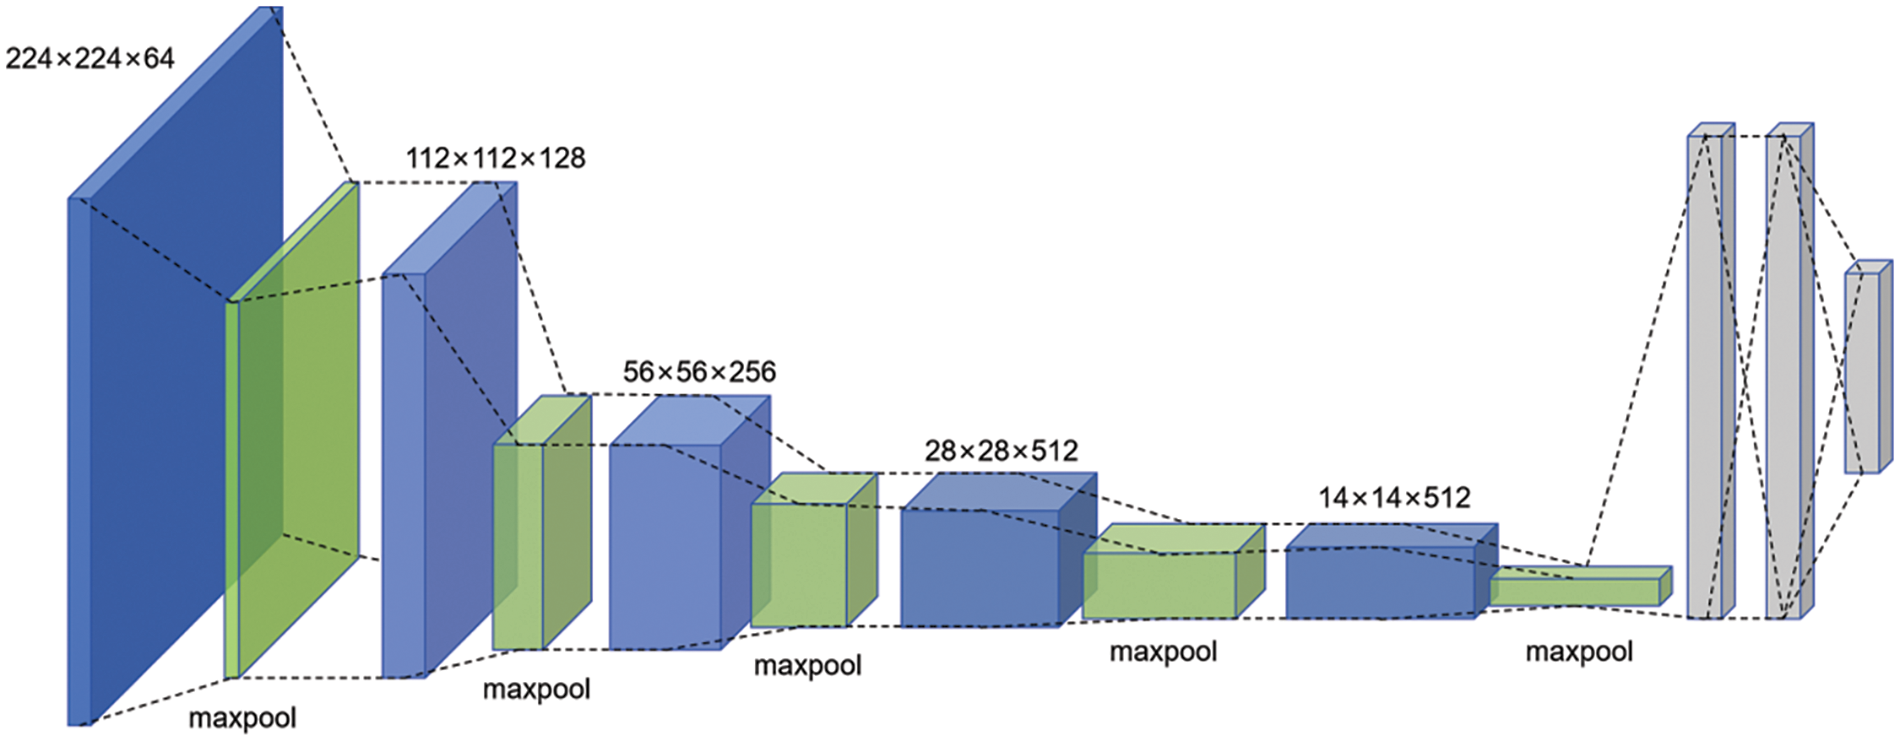
Figure 5: Structure of VGG19 image classification network
To meet the experimental requirements, we made several modifications to the VGG19 model. Firstly, after loading the pretrained weights of the VGG19, we removed its top fully connected layers and adapted the input size to match the resolution of the MVHM (240 × 240 × 3). Secondly, we incorporated a spatial attention module after the VGG19 output layer to enhance the model’s ability to discern the distinct features in the MVHM between real and fake faces. Following the attention module, we added three fully connected layers and a dropout layer to prevent overfitting. Finally, we employed a sigmoid activation function for the binary classification output.
Next, we will elaborate on the working principle of the attention mechanism used, which proves highly effective in image classification tasks, particularly when the model needs to focus on specific regions. The core idea of our spatial attention mechanism is to generate a soft mask by learning the spatial distribution of input features. This mask is then multiplied by the original features to highlight key features, and it is added to the original features to retain some original information. The entire process comprises five steps: preprocessing, the backbone network, the soft mask branch, application of the attention map, and output. The preprocessing step involves normalization and ReLU activation of the input tensor to make the data distribution more uniform, facilitating training.
In represents the normalized tensor, σ denotes the ReLU activation function to introduce non-linearity, BN stands for batch normalization to reduce internal covariate shift, and I signifies the input tensor.
Following this, the backbone network processes the treated feature map through two rounds of convolution, batch normalization, and ReLU activation to extract features. Concurrently, the soft mask branch processes the treated feature map through one round of convolution, batch normalization, and ReLU activation, but ultimately outputs an attention map ranging between 0 and 1 through a sigmoid-activated 1 × 1 convolution layer. This feature map is used to emphasize or suppress the features in the backbone network.
In this context, T represents the output from the backbone network, and Conv denotes the convolution layer, which uses a specified number of filters to extract features. M signifies the output from the soft mask branch, i.e., the attention map, while
The output of the backbone network is then element-wise multiplied by the output of the soft mask branch (the attention map) to achieve spatial attention modulation. Finally, the modulated feature map is added to the original input feature map to preserve original information while enhancing key features.
Modulated refers to the feature map after attention modulation, and O is the output. The input-output process of the attention mechanism is illustrated in Fig. 6.
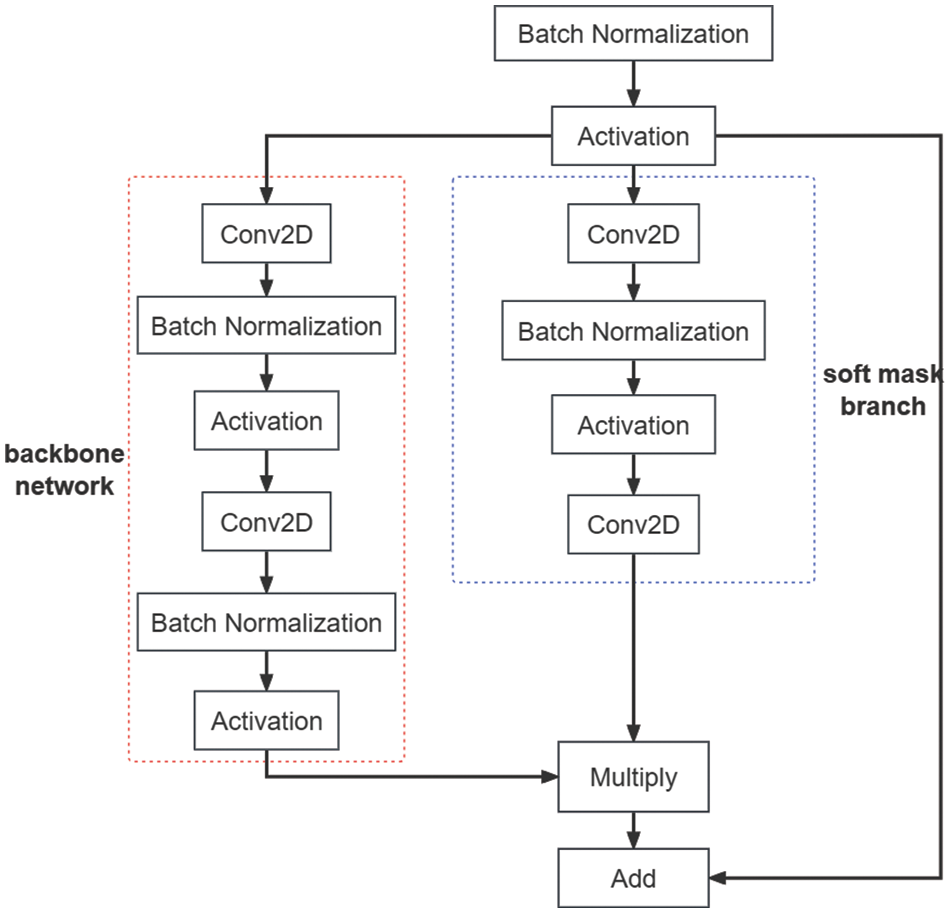
Figure 6: Spatial attention mechanism flow chart
The public dataset used in our experiment is DeepFakeTIMIT [31,32], which utilizes a Generative Adversarial Network (GAN)-based approach to swap faces. This method evolved from the initial autoencoder-based deepfake algorithm, making this dataset a viable option for simulating fake face attacks. DeepFakeTIMIT selected 16 pairs of individuals with similar appearances from the publicly available VidTIMIT database. Since there are 10 videos per person in the VidTIMIT database, 10 fake face videos were generated for each of the 32 subjects, resulting in a total of 320 face-swapped videos, without any manipulation of the audio channel. DeepFakeTIMIT includes two different models: a low-quality model with 64 × 64 input/output resolution, and a high-quality model with 128 × 128 resolution.
4.2 Comparative Experiments and Results Analysis
We utilized the high-quality model of DeepFakeTIMIT, comprising 320 deepfake samples and 320 corresponding real samples, totaling 640 samples for training the fake face detection model. Given the varying lengths of videos in the dataset, to ensure the consistency of the extracted signal lengths and matrix sizes, we used the shortest video duration of 3 s as the benchmark for segmentation. This means that for videos longer than 3 s, we only calculate the rPPG biometric signals contained within the first 3 s of video frames. Given the frame rate of 25 FPS, the length of the rPPG signal is calculated to be 75, resulting in a signal matrix size of 44 × 75.
4.2.1 Comparison of Biosignals and MVHM
We investigated the similarities and differences, in a visual context, of the rPPG signals, Fast Fourier Transform, Power Spectral Density, and MVHM within the same ROI after inputting a real video and its corresponding face-swapped video of the same experimental subject. The results are depicted in Fig. 7.
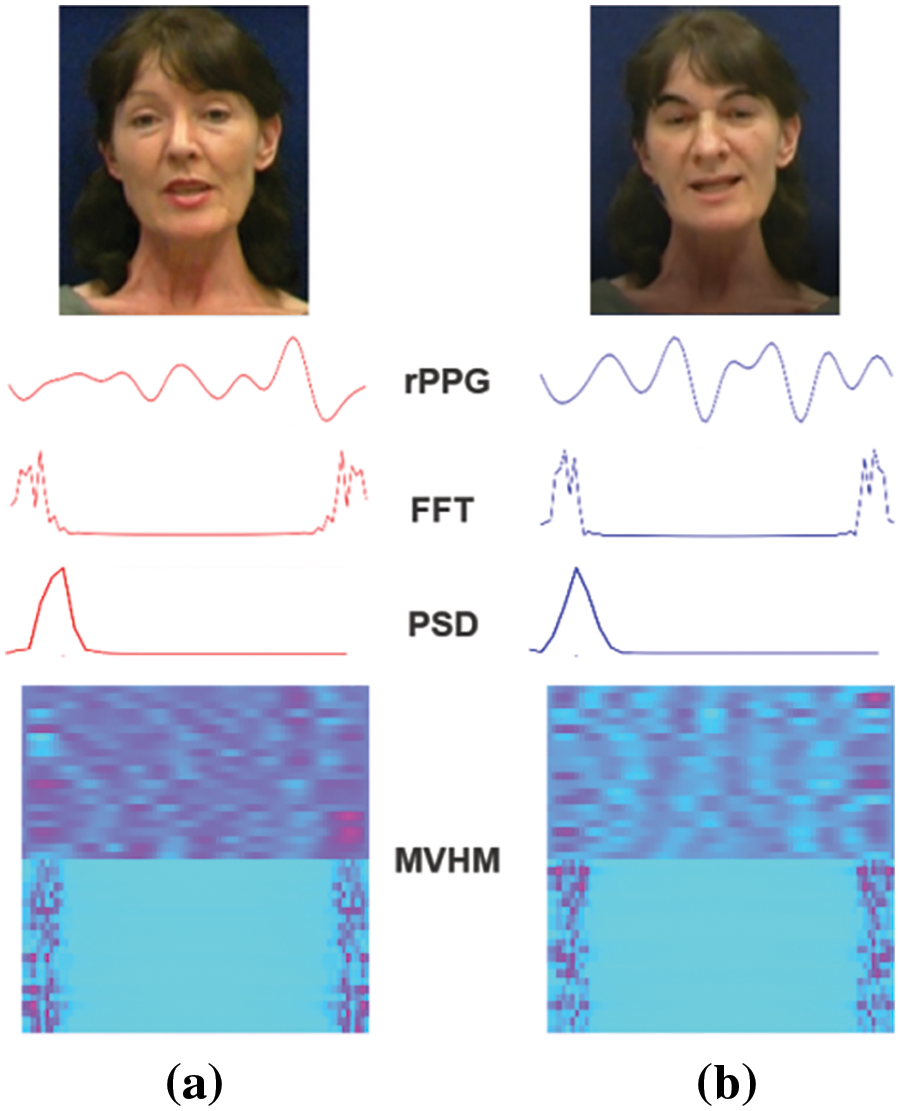
Figure 7: Output comparison (a) real video (b) fake video
Upon examination, it is evident that while both rPPG time-domain signals exhibit clear periodicity, the real video’s rPPG signals display significant amplitude differences, whereas the fake video’s rPPG signals have smaller amplitude variations with a uniform waveform distribution. This observation is more intuitively visible in the upper half of the MVHM; the real face’s color blocks are deeper and more dispersed, reflecting the patterns of human cardiac activity, while the fake face’s color blocks appear lighter and more uniform, which we speculate is due to the deepfake heartbeats being akin to white noise. Additionally, differences in the frequency domain between FFT and PSD are visible in their waveforms but are not pronounced; we believe there lies deeper information that is not discernible by the naked eye. Given that we have transformed signal differences into texture differences in MVHM, employing VGG19 becomes necessary to further compare the rPPG time-domain signals along with their FFT and PSD, to determine which combination contains more discriminative information.
We conducted experiments on various combinations of the rPPG time-domain signals along with their FFT and PSD to determine which type of heatmap yields higher accuracy. When combining the rPPG time-domain signals with PSD, given their length discrepancies that prevent the formation of a matrix, we applied the following approach: The rPPG time-domain signals and PSD each formed a 22-row matrix, which were then visualized as heatmaps with a resolution of 120 × 240. These heatmaps were subsequently concatenated to form a size of 240 × 240, thus ensuring the resolution of the heatmaps for each combination remains consistent. An example from the same sample is shown in Fig. 8.
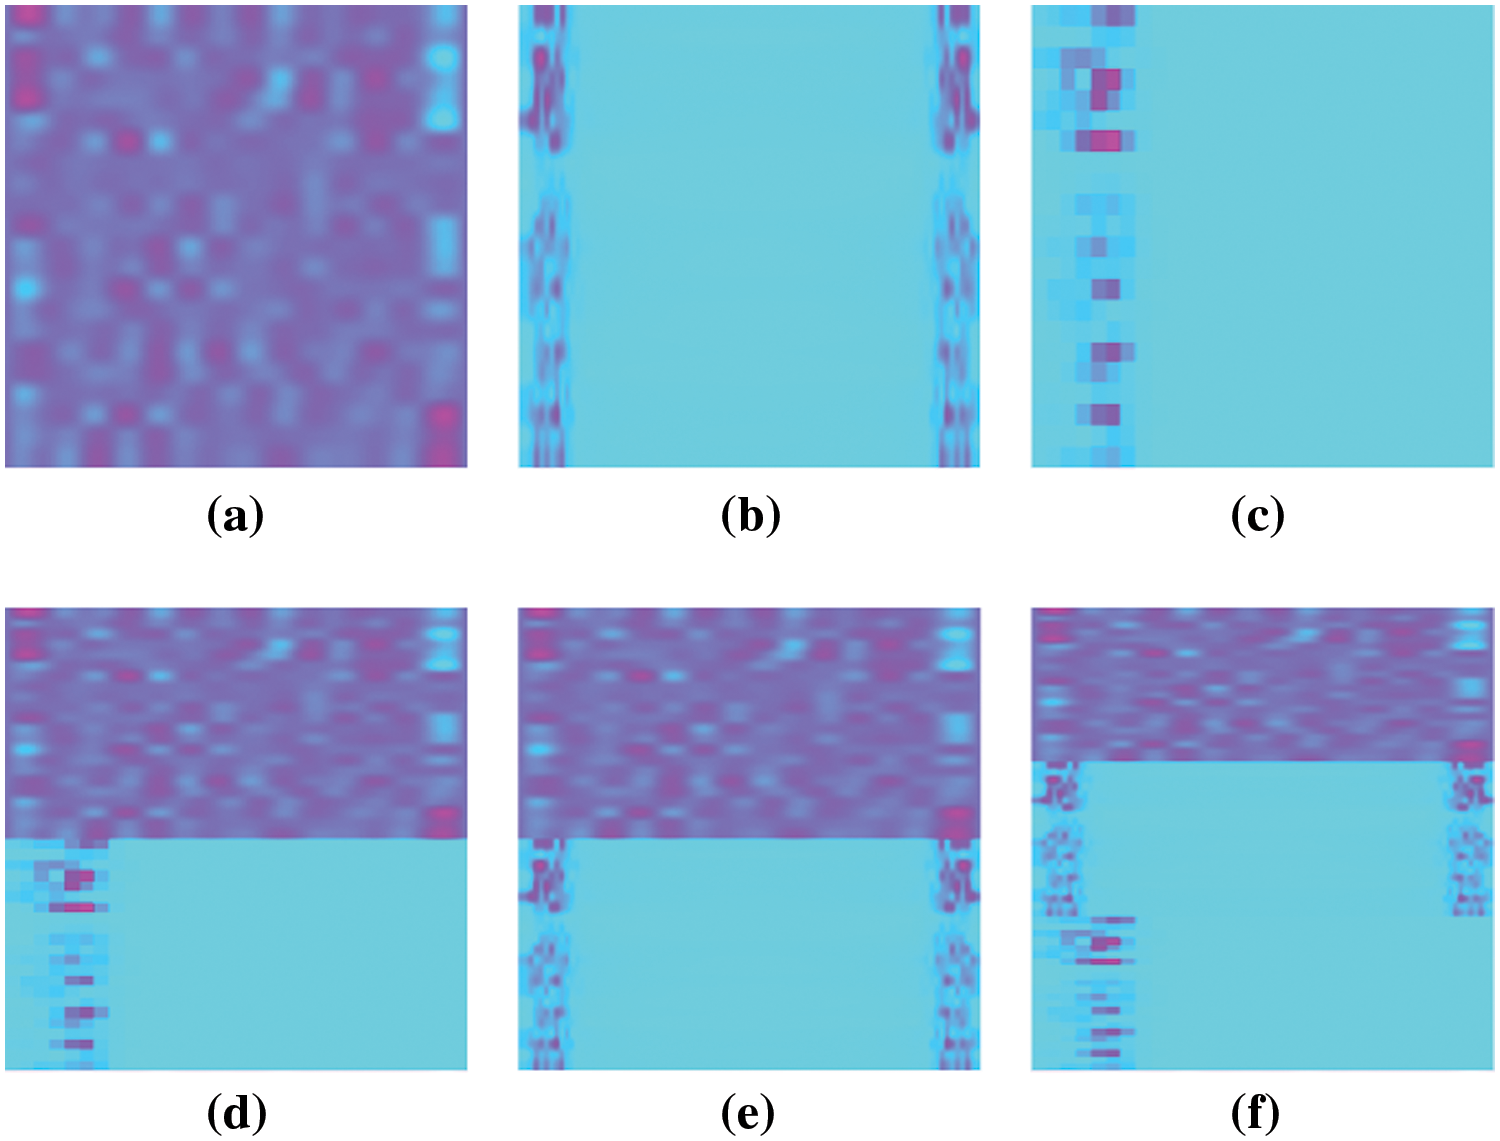
Figure 8: Heat map generated by each combination method (a) rPPG (b) FFT (c) PSD (d) rPPG + PSD (e) rPPG + FFT (f) rPPG + FFT + PSD
We input each of the aforementioned combinations into the VGG19 image classification network for experiments, within an environment of TensorFlow 2.2.0. The dataset was split into training and testing sets with an 80% to 20% ratio, utilizing a smaller learning rate and learning rate decay. The learning rate was set to 0.00001, using the Adam optimizer and binary cross-entropy loss function, over 50 epochs of training. To validate whether the spatial attention mechanism plays a crucial role in the classification process, experiments were also conducted with the addition of the attention mechanism. The results are presented in Table 1. Among these, the accuracy of MVHM in the VGG19 network with the attention mechanism corresponds to the confusion matrix shown in Fig. 9.
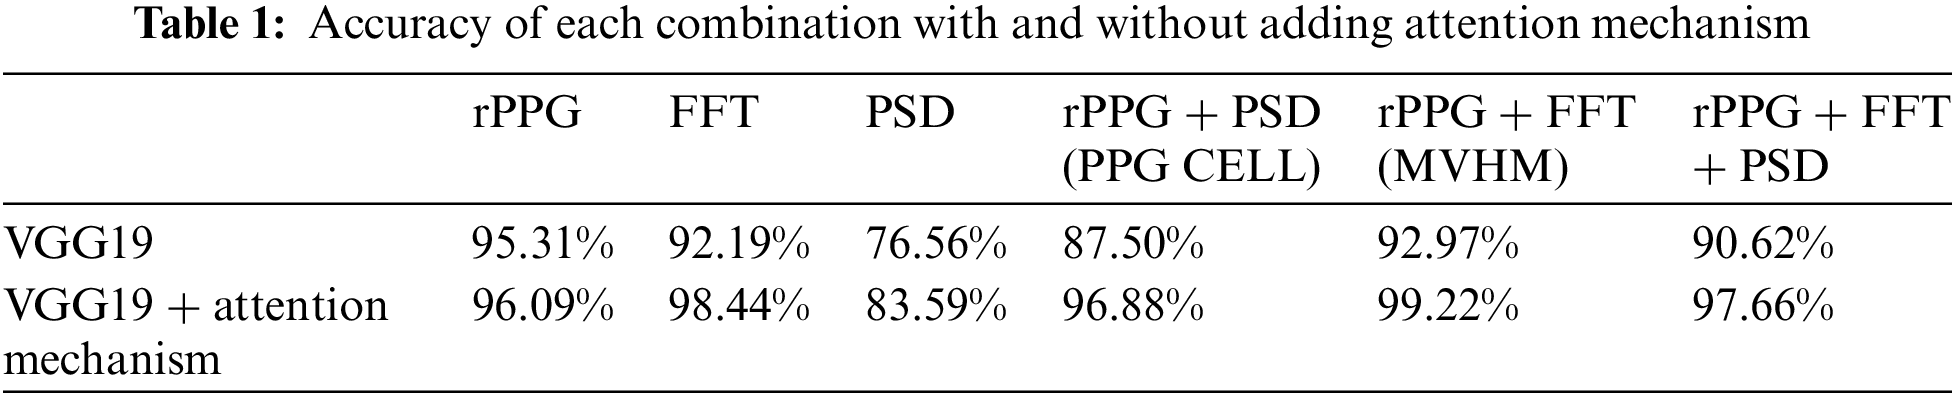
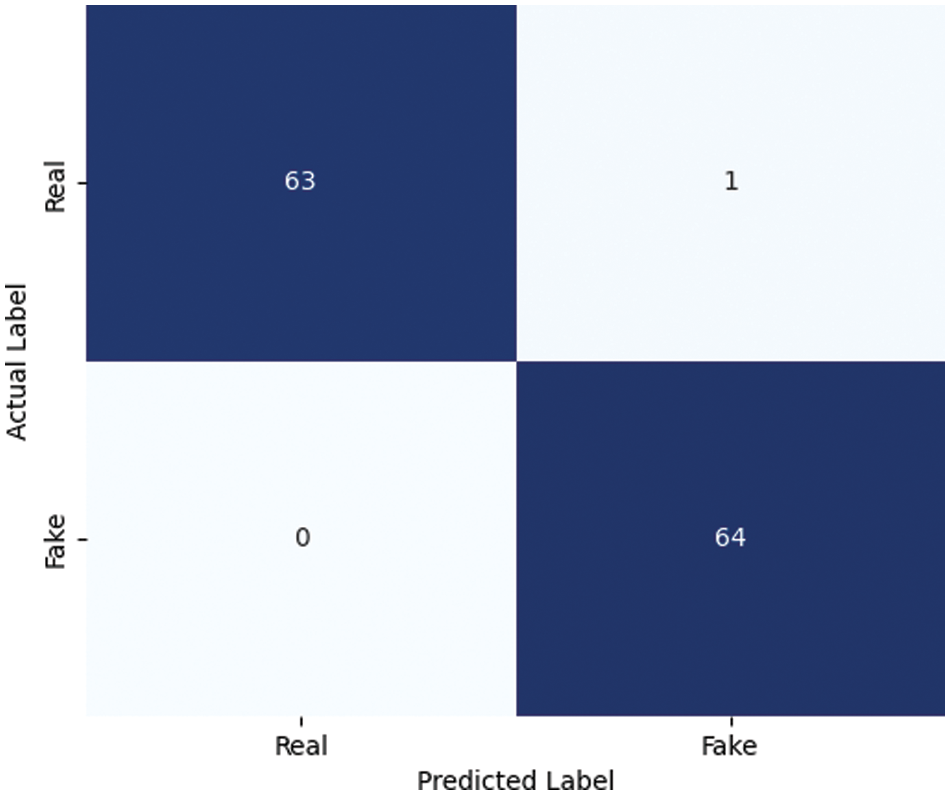
Figure 9: Confusion matrix diagram corresponding to MVHM
Firstly, the results show that the MVHM composed of rPPG and FFT achieved the highest accuracy of 99.22%, surpassing the combination of rPPG and PSD (PPG CELL). We found that the differences between authentic and fake videos are more pronounced with FFT, followed by rPPG, and then PSD. We believe this is because the peak frequency of FFT reflects the real-time heart rate, which remains relatively stable over short periods, whereas the fake face generator violates this consistency.
Secondly, while combinations introduce valuable discriminative information for model training, they also incorporate noise, which can hinder feature extraction, as indicated by the lower heatmap accuracy when all three are combined. However, the spatial attention mechanism can reduce the impact of irrelevant features, allowing the network to focus more on textures related to forgery, thus enhancing the VGG19 network’s classification capabilities. The data show that after implementing the attention mechanism, each combination experienced an accuracy improvement, notably the rPPG and PSD combination, which improved by 9.38 percentage points, demonstrating the effectiveness of the attention mechanism.
Lastly, without the attention mechanism, the heatmap generated solely from the rPPG temporal signal outperformed all other combinations. However, this was reversed with the introduction of the attention mechanism, suggesting that while the discriminative information in the rPPG temporal signal is evident in shallow textures (visible in Fig. 7), deeper texture information benefits significantly from the attention mechanism. This scenario highlights the crucial role of the attention mechanism and the rich discriminative information available in the MVHM.
4.2.3 Number of ROIs and Window Length
The number of Regions of Interest (ROIs) determines the width of the matrix, while the duration for extracting rPPG signals dictates the matrix’s length. Both factors significantly influence the stability and representativeness of the Matrix Visualization Heatmap (MVHM). Having too few ROIs and a short window might cause the MVHM to miss crucial information, whereas too many ROIs and a long window could introduce excessive noise. Initially, we varied the number of ROIs while maintaining each video’s duration at 3 s, which corresponds to a window length of 75, to explore how the choice of ROI number affects detection accuracy.
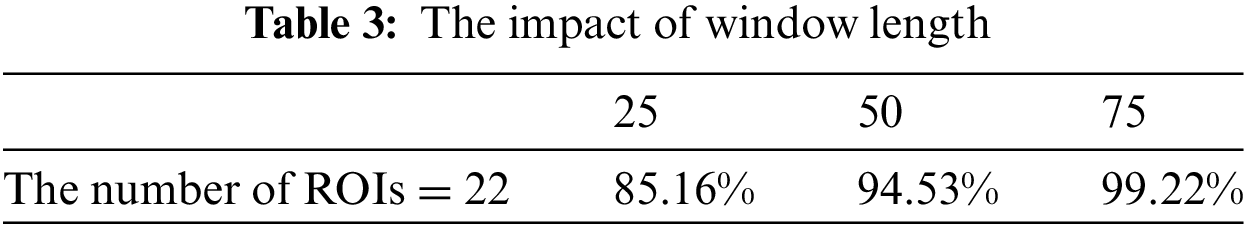
It was observed in Table 2 that with the increase in the number of ROIs, accuracy first increased and then decreased, achieving the optimum value when the number of ROIs was 22. Subsequently, we fixed the number of ROIs at 22 and tested our method with window sizes of 25, 50, and 75 to assess the impact.

Based on the results shown in Table 3, it can be concluded that accuracy improves with increasing window length. Ultimately, under the conditions of 22 ROIs and a window length of 75, MVHM as a discriminative label achieved the highest accuracy.
Based on the conclusions from previous experiments, we tested the robustness of the fake face detection algorithm proposed in this paper. We selected accuracy, F1 score, and ROC-AUC score as evaluation metrics. The F1 score, which is the harmonic mean of precision and recall, serves as a comprehensive performance indicator that considers both precision and recall rates. The ROC-AUC score represents the area under the receiver operating characteristic curve and is used to evaluate the performance of classifiers. An AUC value closer to 1 indicates superior algorithm performance. Gaussian noise, a common type of statistical noise, can simulate various natural and artificial disturbances. Consequently, we plan to sequentially add Gaussian white noise with standard deviations ranging from 0.1 to 0.5 to the MVHM to observe changes in these metrics, which will help demonstrate the algorithm’s robustness under extreme conditions.
From the data in Table 4, it can be seen that with the increase in noise intensity, the accuracy shows a trend of first decreasing, then increasing, and then decreasing again. However, the magnitude of the change is very small, and it can maintain a high accuracy rate, indicating that the algorithm can effectively handle noise interference. At the same time, the F1 score and AUC value do not change much before and after adding noise, indicating that the algorithm maintains a good balance between precision and recall, and can maintain efficient recognition performance even in the presence of noise.
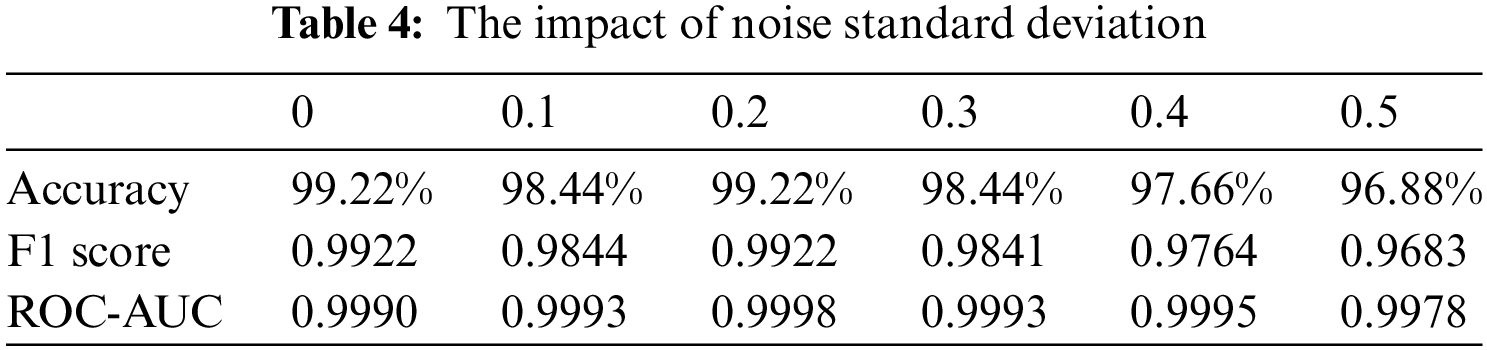
Regarding the reason for the trend in accuracy changes, our understanding is as follows: The addition of noise of low intensity acts as a mild regularization, helping the model resist overfitting. This can explain to some extent why there is a decrease in accuracy. As the noise further increases, the model is able to maintain stable predictive performance under more complex input conditions, thereby showing better results on the test set. However, when the noise increases to a higher level, it starts to mask the key information in the images, making it difficult for the model to extract effective features from the images.
Deepfake detection fundamentally constitutes a binary classification task, typically exhibiting good performance on both classical machine learning and deep learning classifiers. Most studies, including ours, have employed one or several of these. Considering the potential of FFT, we explored the most suitable combination for fake face detection and the effect of the spatial attention mechanism. Ultimately, we found that the combination of rPPG and FFT (MVHM) achieved the highest accuracy, surpassing mainstream fake face detection algorithms, indicating that our algorithm can provide reliable results.
Table 5 showcases the comparative results with other advanced deepfake detection methods, with some results directly cited from [29,33–35]. For each study, we listed the research method, the types of features used, the classifier, and the optimal evaluation results. We particularly focused on other recent algorithms for deepfake detection based on biometric features, given the current incapability of deepfake technology to simulate normal biological signals, these algorithms generally demonstrate superior performance and reliability.
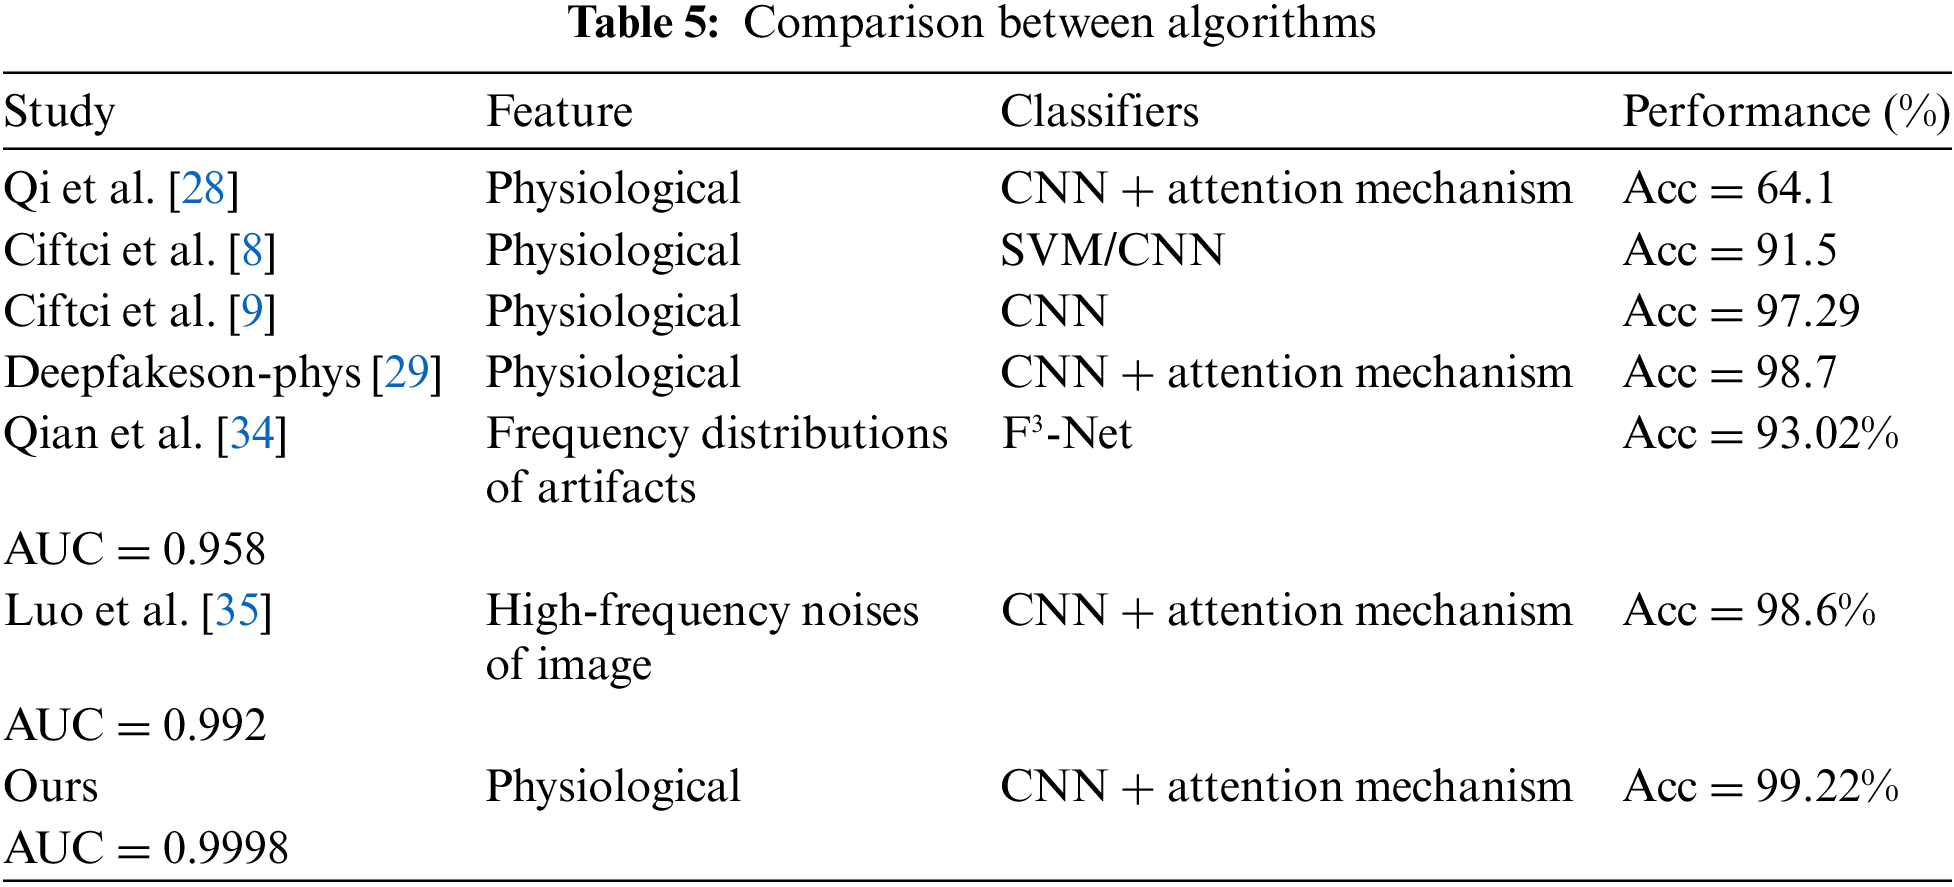
It is evident that although the classification networks utilized by various algorithms differ, we achieved commendable results on the representative public dataset, DeepFakeTIMIT, confirming that: 1. Biometric signals, particularly the frequency domain representation of FFT, are crucial for detecting fake faces; 2. The attention mechanism can significantly enhance the accuracy of image classification networks. Thanks to the use of transfer learning, our proposed algorithm requires less computational power and exhibits some resistance to noise, making it suitable for a wide range of application domains.
In this paper, we propose a method to detect deepfake by extracting biometric signals from facial video frames using remote photoplethysmography (rPPG). To our knowledge, this is the first time the combination of rPPG time-domain signals and their FFT has been used as a discriminative label. Furthermore, we tested the performance of our algorithm on the VGG19 image classification network enhanced with a spatial attention mechanism, achieving accuracy that surpasses mainstream algorithms. This demonstrates the effectiveness of the Fourier Transform and attention mechanisms in the deepfake detection domain.
We have considered the advantages of integrating facial visual features and deep learning. Theoretically, integrating visual and biometric information through a more complex deep learning network for multimodal fusion could enhance discrimination accuracy to some extent. Additionally, it could provide robustness against various fake face generation techniques, including facial generation, reproduction, and manipulation. We regard this idea as part of our near-term work.
Acknowledgement: The authors would like to express their gratitude for the valuable feedback and suggestions provided by all the anonymous reviewers and the editorial team.
Funding Statement: This work was financially supported by the National Nature Science Foundation of China (Grant Number: 61962010).
Author Contributions: The authors confirm contribution to the paper as follows: study conception and design: Yin Ni, Wu Zeng; data collection: Yin Ni; analysis and interpretation of results: Yin Ni, Wu Zeng, Peng Xia; draft manuscript preparation: Yin Ni, Wu Zeng, Peng Xia, Guang Stanley Yang, Ruochen Tan. All authors reviewed the results and approved the final version of the manuscript.
Availability of Data and Materials: The data are contained within the article.
Conflicts of Interest: The authors declare that they have no conflicts of interest to report regarding the present study.
References
1. T. Karras, S. Laine, and T. Aila, “A style-based generator architecture for generative adversarial networks,” in IEEE Conf. Comput. Vis. Pattern Recognit., Long Beach, CA, USA, 2019, pp. 4401–4410. [Google Scholar]
2. J. Thies, M. Zollhöfer, M. Stamminger, C. Theobalt, and M. Nießner, “Face2Face: Real-time face capture and reenactment of RGB videos,” in IEEE Conf. Comput. Vis. Pattern Recognit., Las Vegas, NV, USA, 2016, pp. 2387–2395. [Google Scholar]
3. J. Thies, M. Zollhöfer, and M. Nießner, “Deferred neural rendering: Image synthesis using neural textures,” ACM Trans. Graph., vol. 38, no. 4, pp. 1–12, 2019. doi: 10.1145/3306346.3323035. [Google Scholar] [CrossRef]
4. J. Thies, M. Zollhöfer, M. Nießner, L. V. algaerts, M. Stamminger and C. Theobalt, “Real-time expression transfer for facial reenactment,” ACM Trans. Graph., vol. 34, no. 6, pp. 183:1–183:14, 2015. doi: 10.1145/2816795.2818056. [Google Scholar] [CrossRef]
5. D. Chu et al., “White paper: Deep fakery–an action plan,” Technical Report, Institute for Pure and Applied Mathematics (IPAMUniversity of California, Los Angeles, CA, USA, Jan. 2020. Accessed: Aug. 30, 2023. [Online]. Available: http://www.ipam.ucla.edu/wp-content/uploads/2020/01/Whitepaper-Deep-Fakery.pdf [Google Scholar]
6. A. Heidari, N. J. Navimipour, H. Dag, and M. Unal, “Deepfake detection using deep learning methods: A systematic and comprehensive review,” Wiley Interdiscip. Rev.: Data Min. Knowl. Discov., vol. 14, no. 2, pp. e1520, 2024. [Google Scholar]
7. A. Heidari, N. J. Navimipour, H. Dag, S. Talebi, and M. Unal, “A novel blockchain-based deepfake detection method using federated and deep learning models,” Cognit. Comput., vol. 9, no. 24, pp. 1–19, 2024. doi: 10.1007/s12559-024-10255-7. [Google Scholar] [CrossRef]
8. U. A. Ciftci, I. Demir, and L. Yin, “FakeCatcher: Detection of synthetic portrait videos using biological signals,” in IEEE Trans. Pattern Anal. Mach. Intell., 2020. doi: 10.1109/TPAMI.2020.3009287. [Google Scholar] [PubMed] [CrossRef]
9. U. A. Ciftci, I. Demir, and L. Yin, “How do the hearts of deep fakes beat? Deep fake source detection via interpreting residuals with biological signals,” in IEEE Int. Joint Conf. Biom., Houston, TX, USA, 2020, pp. 1–10. [Google Scholar]
10. Y. Li, M. Chang, and S. Lyu, “In ictu oculi: Exposing AI created fake face videos by detecting eye blinking,” in IEEE Int. Workshop Inf. Forensics Secur., Hong Kong, China, 2018, pp. 1–7. doi: 10.1109/WIFS.2018.8630787 [Google Scholar] [CrossRef]
11. T. Jung, S. Kim, and K. Kim, “DeepVision: Deepfakes detection using human eye blinking pattern,” IEEE Access, vol. 8, pp. 83144–83154, 2020. doi: 10.1109/ACCESS.2020.2988660. [Google Scholar] [CrossRef]
12. R. Ranjan, V. M. Patel, and R. Chellappa, “HyperFace: A deep multi-task learning framework for face detection, landmark localization, pose estimation, and gender recognition,” IEEE Trans. Pattern Anal. Mach. Intell., vol. 41, no. 1, pp. 121–135, 2017. doi: 10.1109/TPAMI.2017.2781233. [Google Scholar] [PubMed] [CrossRef]
13. T. Soukupová and J. Čech, “Real-time eye blink detection using facial landmarks,” in 21st Computer Vision Winter Workshop (CVWW), Rimske Toplice, Slovenia, 2016. [Google Scholar]
14. S. Agarwal, H. Farid, Y. Gu, M. He, K. Nagano and H. Li, “Protecting world leaders against deep fakes,” in IEEE/CVF Conf. Comput. Vis. Pattern Recognit. Workshops, 2019, vol. 1, pp. 38–45. [Google Scholar]
15. F. Matern, C. Riess, and M. Stamminger, “Exploiting visual artifacts to expose DeepFakes and face manipulations,” in IEEE Winter App. Comput. Vis. Workshops (WACVW), Waikoloa, HI, USA, 2019, pp. 83–92. [Google Scholar]
16. X. Yang, Y. Li, and S. Lyu, “Exposing deep fakes using inconsistent head poses,” in IEEE Int. Conf. Acoust., Speech Signal Process. (ICASSP), Brighton, UK, 2019, pp. 8261–8265. [Google Scholar]
17. Y. Li and S. Lyu, “Exposing DeepFake videos by detecting face warping artifacts,” in IEEE/CVF Conf. Comp. Vis. Pattern Recognit. Workshops, 2019, pp. 46–52. [Google Scholar]
18. Y. Li, X. Yang, P. Sun, H. Qi, and S. Lyu, “Celeb-DF: A large-scale challenging dataset for DeepFake forensics,” in IEEE/CVF Conf. Comp. Vis. Pattern Recognit., Seattle, WA, USA, 2020, pp. 3207–3216. [Google Scholar]
19. A. Rössler, D. Cozzolino, L. Verdoliva, C. Riess, J. Thies and M. Nießner, “FaceForensics++: Learning to detect manipulated facial images,” in IEEE/CVF Int. Conf. Comput. Vis. (ICCV), Seoul, Korea (South2019, pp. 1–11. [Google Scholar]
20. B. Dolhansky, R. Howes, B. Pflaum, N. Baram, and C. C. Ferrer, “The deepfake detection challenge (DFDC) preview dataset,” 2019. doi: 10.48550/arXiv.1910.08854. [Google Scholar] [CrossRef]
21. H. H. Nguyen, J. Yamagishi, and I. Echizen, “Use of a capsule network to detect fake images and videos,” 2019. doi: 10.48550/arXiv.1910.12467. [Google Scholar] [CrossRef]
22. D. Afchar, V. Nozick, J. Yamagishi, and I. Echizen, “MesoNet: A compact facial video forgery detection network,” in IEEE Int. Workshop Inf. Forensics Secur., Hong Kong, China, 2018, pp. 1–7. [Google Scholar]
23. P. Zhou, X. Han, V. Morariu, and L. Davis, “Twostream neural networks for tampered face detection,” in IEEE Conf. Comput. Vis. Pattern Recognit. Workshops (CVPRW), Honolulu, HI, USA, 2017, pp. 1831–1839. [Google Scholar]
24. H. H. Nguyen, F. Fang, J. Yamagishi, and I. Echizen, “Multi-task learning for detecting and segmenting manipulated facial images and videos,” in IEEE Int. Conf. Biom. Theory, App. Syst. (BTAS), Tampa, FL, USA, 2019, pp. 1–8. [Google Scholar]
25. H. Dang, F. Liu, J. Stehouwer, X. Liu, and A. Jain, “On the detection of digital face manipulation,” in IEEE/CVF Conf. Comput. Vis. Pattern Recognit. (CVPR), Seattle, WA, USA, 2020, pp. 5781–5790. [Google Scholar]
26. H. Zhao, T. Wei, W. Zhou, W. Zhang, D. Chen and N. Yu, “Multi-attentional deepfake detection,” in IEEE/CVF Conf. Comput. Vis. Pattern Recognit. (CVPR), Nashville, TN, USA, 2021, pp. 2185–2194. [Google Scholar]
27. R. Tolosana, S. Romero-Tapiador, J. Fierrez, and R. VeraRodriguez, “DeepFakes evolution: Analysis of facial regions and fake detection performance,” Int. Conf. Pattern Recognit., vol. 12665, pp. 442–456, 2021. doi: 10.1007/978-3-030-68821-9_38. [Google Scholar] [CrossRef]
28. H. Qi et al., “DeepRhythm: Exposing DeepFakes with attentional visual heartbeat rhythms,” in ACM Int. Conf. Multimedia, Seattle, WA, USA, 2020, pp. 4318–4327. [Google Scholar]
29. J. Hernandez-Ortega, R. Tolosana, J. Fierrez, and A. Morales, “DeepFakes detection based on heart rate estimation: Single-and multi-frame,” in Handbook Digit. Face Manipul. Detection: From DeepFakes Morphing Attacks, 2022, pp. 255–273. [Google Scholar]
30. G. de Haan and V. Jeanne, “Robust pulse rate from chrominance-based rPPG,” IEEE Trans. Biomed. Eng., vol. 60, no. 10, pp. 2878–2886, 2013. doi: 10.1109/TBME.2013.2266196. [Google Scholar] [PubMed] [CrossRef]
31. P. Korshunov and S. Marcel, “DeepFakes: A new threat to face recognition? Assessment and detection,” 2018. doi: 10.48550/arXiv.1812.08685. [Google Scholar] [CrossRef]
32. C. Sanderson and B. C. Lovell, “Multi-region probabilistic histograms for robust and scalable identity inference,” in Adv. Biom.: Third Int. Conf., Alghero, Italy, 2009, vol. 5558, pp. 199–208. [Google Scholar]
33. I. Masi, A. Killekar, R. M. Mascarenhas, S. P. Gurudatt, and W. AbdAlmageed, “Twobranch recurrent network for isolating deepfakes in videos,” in Comput. Vis.-ECCV 2020: 16th Eur. Conf., Glasgow, UK, 2020, pp. 667–684. [Google Scholar]
34. Y. Qian, G. Yin, L. Sheng, Z. Chen, and J. Shao, “Thinking in frequency: Face forgery detection by mining frequency-aware clues,” in Comput. Vis.-ECCV 2020: 16th Eur. Conf., Glasgow, UK, 2020, pp. 86–103. [Google Scholar]
35. Y. Luo, Y. Zhang, J. Yan, and W. Liu, “Generalizing face forgery detection with high-frequency features,” in IEEE/CVF Conf. Comput. Vis. Pattern Recognit. (CVPR), Nashville, TN, USA, 2021, pp. 16317–16326. [Google Scholar]
Cite This Article
 Copyright © 2024 The Author(s). Published by Tech Science Press.
This work is licensed under a Creative Commons Attribution 4.0 International License , which permits unrestricted use, distribution, and reproduction in any medium, provided the original work is properly cited.
 Downloads
 Citation Tools