
 Submit a Paper
 Propose a Special lssue
 Open Access
ARTICLE

Enhancing Wireless Sensor Network Efficiency through Al-Biruni Earth Radius Optimization
1 Department of Information Technology, College of Computer and Information Sciences, Princess Nourah bint Abdulrahman University, P.O. Box 84428, Riyadh, 11671, Saudi Arabia
2 Department of Computer Sciences, College of Computer and Information Sciences, Princess Nourah bint Abdulrahman University, P.O. Box 84428, Riyadh, 11671, Saudi Arabia
3 Computer Science and Intelligent Systems Research Center, Blacksburg, Virginia, 24060, USA
4 Delta Higher Institute for Engineering and Technology, Mansoura, 35511, Egypt
5 Faculty of Artificial Intelligence, Delta University for Science and Technology, Mansoura, 35712, Egypt
6 Artificial Intelligence and Computational Intelligence Research Center, Meriden, Connecticut, 06450, USA
7 School of ICT, Faculty of Engineering, Design and Information & Communications Technology (EDICT), Bahrain Polytechnic, P.O. Box 33349, Isa Town, Bahrain
* Corresponding Author: S. K. Towfek. Email:
Computers, Materials & Continua 2024, 79(3), 3549-3568. https://doi.org/10.32604/cmc.2024.049582
Received 11 January 2024; Accepted 09 April 2024; Issue published 20 June 2024
 View Full Text
 Download PDF
Abstract
The networks of wireless sensors provide the ground for a range of applications, including environmental monitoring and industrial operations. Ensuring the networks can overcome obstacles like power and communication reliability and sensor coverage is the crux of network optimization. Network infrastructure planning should be focused on increasing performance, and it should be affected by the detailed data about node distribution. This work recommends the creation of each sensor’s specs and radius of influence based on a particular geographical location, which will contribute to better network planning and design. By using the ARIMA model for time series forecasting and the Al-Biruni Earth Radius algorithm for optimization, our approach bridges the gap between successive terrains while seeking the equilibrium between exploration and exploitation. Through implementing adaptive protocols according to varying environments and sensor constraints, our study aspires to improve overall network operation. We compare the Al-Biruni Earth Radius algorithm along with Gray Wolf Optimization, Particle Swarm Optimization, Genetic Algorithms, and Whale Optimization about performance on real-world problems. Being the most efficient in the optimization process, Biruni displays the lowest error rate at 0.00032. The two other statistical techniques, like ANOVA, are also useful in discovering the factors influencing the nature of sensor data and network-specific problems. Due to the multi-faceted support the comprehensive approach promotes, there is a chance to understand the dynamics that affect the optimization outcomes better so decisions about network design can be made. Through delivering better performance and reliability for various in-situ applications, this research leads to a fusion of time series forecasters and a customized optimizer algorithm.Keywords
Optimization techniques are essential for enhancing the system performance in various applications, and their utilization on the WSNs is an excellent case study [1]. Within this context, metaheuristic and evolutionary algorithms provide new approaches to dealing with the complex factors inherent to the class of optimization problems in wireless sensor networks (WSNs). The algorithms scrutinized herewith, for instance, Al-Biruni Earth Radius Optimization (BER), Gray Wolf Optimization (GWO) [2], Particle Swarm Optimization (PSO) [3], Genetic Algorithm (GA) [4], and Whale Optimization Algorithm (WOA) [5], are comprised of a set of approaches that are akin to nature’s processes. Numerous algorithms are useful in dealing with the complicated phenomena in WSNs, such as choosing the best positions for sensors during deployment and efficiently allocating resources.
BER algorithm is unique because it combines its methodology with the theory of planetary theory developed by the 10th-century scientist Abu Rayhan Muhammad ibn Ahmad al-Biruni. Contrary to that, the algorithm chooses the exploration and exploitation phases against each other, which ensures the harmony of the equilibrium—at the same time, taking advantage of the flexibility of its mechanism for generic optimization situations. The utility of a wireless sensor network (WSN) is also discussed in the sense of making the network more efficient, especially concerning sensor placement and resource allocation [6,7]. These undertakings are intended to make the data harvesting process more efficient and promote the conservation of energy resources across the information network. According to this concept, the GWO method incorporates the cooperative hunting inclinations of the gray wolves. The GWO model has a hunting social structure, which helps in improving many key benefits of the network, like sensor network coverage, reduction of energy consumption, and data collection efficiency. The algorithm is in the form of a hierarchical ordering that is something like the structure of social hierarchy in wolf packs. This functional nature of the algorithm extends its adaptability and efficiency in tackling the specific optimization problems that are particular to WSNs [8–11].
PSO is a technique that applies the synergy of a group of particles to harness their collective intelligence to adjust sensors in WSNs. PSO helps optimize network coverage and save energy by dynamically adjusting how peers around a unit and individual members use data. PSO is flexible. Therefore, it can note any failures and carry out appropriate modifications and adjustments in the sensor networks in dynamic contexts for optimal performance [12]. A genetic algorithm is a strong technique for solving complex optimization issues in the WSN because it draws on both natural selection and genetics. GA mimics the process of evolution, implying that it has great potential in solving problems of sensor selection and resource allocation. The algorithm possesses the attribute of looking at different alternatives that change from generation to generation. This is the reason behind its ability to produce software that can be used to operate WSNs. Making use of the alternating iterations, the algorithm can generate superior solutions, which in turn result in high quality and efficient performance [13].
The WOA algorithm is also a novel approach that is derived from the hunting strategies of humpback whales as they are united in a social group. This technology is engaged in a great number of jobs, comprising the minimization of sensor location error and the enhancement of output reliability. This algorithm successfully calculates the optimum solutions by mimicking humpback whales’ tail-flapping behavior while hunting fish in the ocean [14–16].
Fig. 1 reveals that this research report is useful in modeling the impact optimization methods on WSNs. The foremost objective of this research is to investigate the roles and factors that determine the differences in the optimization of WSNs for various tasks [17]. This study utilizes metaheuristic algorithms, which borrow from nature, and explores their advantages. The proposed methodology incorporates these metaheuristic algorithms to enhance performance metrics, network durability, and efficiency in WSNs. This part will touch on the fact that combinatorial algorithms can be merged with autoregressive integrated moving average (ARIMA) models to present the assessment of their overall performance, which is made via different metrics and statistical tests. This complete methodology aims to give a deeper view of the generous impact that optimization methods might exert on everyday situations, and there is an emphasis on understanding their capacity for bringing a revolution in WSN.
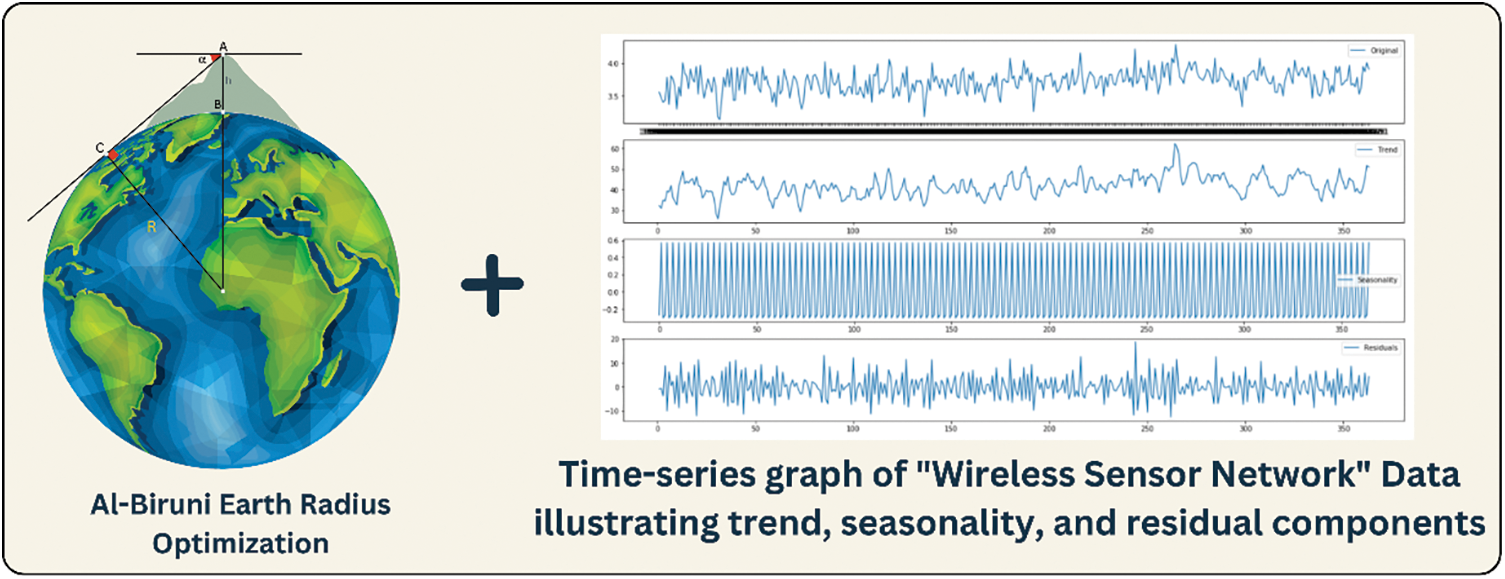
Figure 1: The utilization of ARIMA-BER in the context of Wireless Sensor Networks (WSN)
The main objectives of the paper are:
• Initial processing and cleaning of the Wireless Sensor Network (WSN) dataset.
• Implementation of the Autoregressive Integrated Moving Average (ARIMA) model for time series forecasting.
• Utilization of ARIMA as a powerful tool for understanding and predicting temperature variations in the WSN.
• Application of optimization techniques to fine-tune the hyperparameters of the ARIMA model.
• Exploration and exploitation of the Al-Biruni Earth Radius (BER) optimization algorithm for enhanced ARIMA performance.
• Comprehensive statistical analysis using various metrics (e.g., MSE, RMSE, NSE) to evaluate model performance.
• Integration of metaheuristic algorithms for comparison with other optimization methods.
• Apply ANOVA and Wilcoxon Signed Rank Test for an in-depth examination of performance variations.
In WSNs, optimization plays a critical role in improving performance and energy efficiency. Data aggregation algorithms enhance routing efficiency and reduce congestion, while optimal energy consumption schemes aim to prolong the network’s operational lifespan [18,19]. Both approaches underscore the importance of optimization in WSNs, with data aggregation targeting routing efficiency and energy schemes focusing on resource management for longevity. Integrating these strategies can significantly enhance WSN functionality and effectiveness in real-world applications. This research aims to explore and incorporate such optimization techniques to address the challenges faced by WSNs, contributing to advancements in network reliability and performance.
The subsequent sections delve into Related Works, Materials and Methods, then Experimental Results and Conclusion and Future Directions.
The topic of data aggregation in WSNs is covered by Sudha et al. [20], who highlight that sensor data should be corrected before aggregation to avoid errors and noise. This study proposes the Accurate Data Aggregation framework. These are modeled via neural networks and classified through data categorization methods using Machine learning. This mechanism, in which machine learning methods are used to spot and get rid of errors and meaningless data before sending the data, will thus improve the accuracy at which the data is received. In the paper, the authors [21] introduce a new adaptive seasonal auto-regressive integrated moving average model (ASARIMA) model, which can predict solar energy harvesting for outdoor energy harvesting sensor networks. The model trains the added data regarding the similarity to the historical data, and the model carries out seasonal difference data fitting to adjust the maximum parameters of the prediction model. The experiment results show that ASARIMA outperforms other algorithms for power forecasting, which are already applied, especially in steady weather conditions.
The research by [22] focuses on whether wireless mesh networks can be used to predict traffic. This article focuses on some prevalent traffic-shouldering approaches based on different principles. It demonstrates a case study in which a network of sensors is used to estimate the performance of a High-Speed Diesel pump. Statistical models, machine learning, and deep learning approaches will be explored and evaluated using a variety of methods during the implementation stage, including the most advanced convolution neural network and long short-term (LSTM). The model demonstrates the successful behavior of high-speed diesel pump forecasting, which makes it attractive for industrial purposes such as network traffic prediction and monitoring. In [23], the authors investigate the range of opportunities available in WSNs and their applications in intrusion detection and online tracking. The present paper focuses on a feed-forward deep learning-based artificial neural network model that aims to give the actual k-barrier count with excellent accuracy. One important objective of this proposal is to raise intrusion detection and mitigation capabilities. The approach utilizes multiple characteristics, such as the signal of the target zone, the field of sensing, the field of transmission, and several sensors. These features will be extracted using the Monte Carlo method. According to the given methodology, the methodology is allegedly more effective than the other ordinary ways of intrusion detection in terms of this efficiency.
This study [24] concentrates on the design problems of wireless sensor networks, with a prime focus on power-constrained procedures, restricted dispersion radius, limited computing/buffering power, low bandwidth connectivity, and active network topologies. This study indicates that one should establish a relay mode and incorporate it into the present game theory energy balancing scheme to extend the lifespan of the entire network. The final validation of the updated game-theoretic energy balancing (GTEB) algorithm is conducted for the following metrics which are latency, hop count, energy usage, number of motes that can be used and cannot be used, the ratio of the lifetime, routing overhead, and the throughput. The research provides compelling evidence for the increased speed and accuracy of the improved algorithm compared to the already existing ones. It goes without saying that the main priority for WSN is to maximize resource efficiency in order to achieve network longevity, fast data transfer speed, low computational latency and control overhead elimination [25]. The paper compares the supervised machine learning method known as the Classification And Regression Tree (CART) with an intelligent resource allocation in the WSN. A proposed approach, which will be explained in detail in this paper, is the process of clustering, identification of Cluster Heads (CH), the computation of CH characteristics, as well as the usage of intelligent search and feature selection methods for the aggregation and classification of Cluster Members (CM) and CH features. As described in this research paper, a proposed technique for resource allocation outruns other strategies, including Linear Regression (LR) and Neural Network (NN), in terms of accuracy of resource allocation, computational latency, and data transmission efficiency. The simulation results confirm the performance of the proposed solution.
The scope of the present research is limited to the discipline of WSN, which is used in different areas. Researchers consider the use of diverse methodologies, which implies the application of deep learning techniques in intrusion detection, energy algorithm modifications for network life duration etc. At the cutting edge of these efforts is the deployment of machine learning algorithms such as CART, which facilitates the distribution of resources in WSN. The research underpins the value of smart sensors and intelligent computations in our ever more interconnected and networked global community. Wireless sensing technologies provide that kind of information, which allows for improving networks’ efficiency, lifetime and quality of operation. In other words, they point out the way towards a bright future for these technologies.
This section explains the entire method used to better WSNs performance through modeling processes of Autoregressive Integrated Moving Average (ARIMA) and (BER) algorithm seen in Fig. 2. The strategy is channelized into four major components. Firstly, we run a data preprocessing phase involving simple data cleaning, date and time changeover, and column merging to make their structures congruous. Then, the stage ‘ARIMA Model’ is performed, which is based on the usage of the ARIMA model to give time series predictions for temperature changes in the WSN. The subsequent task of optimizing the ARIMA Model’s hyperparameters will be achieved with the aid of sophisticated optimization tools and the BER algorithm, which sets the parameters of the model for higher performance. Finally, the stage of Statistical Analysis and Evaluation is the one where the accuracy of the model is intensively evaluated using many indicators. Moreover, metaheuristic models aid in making comparisons with analysis.
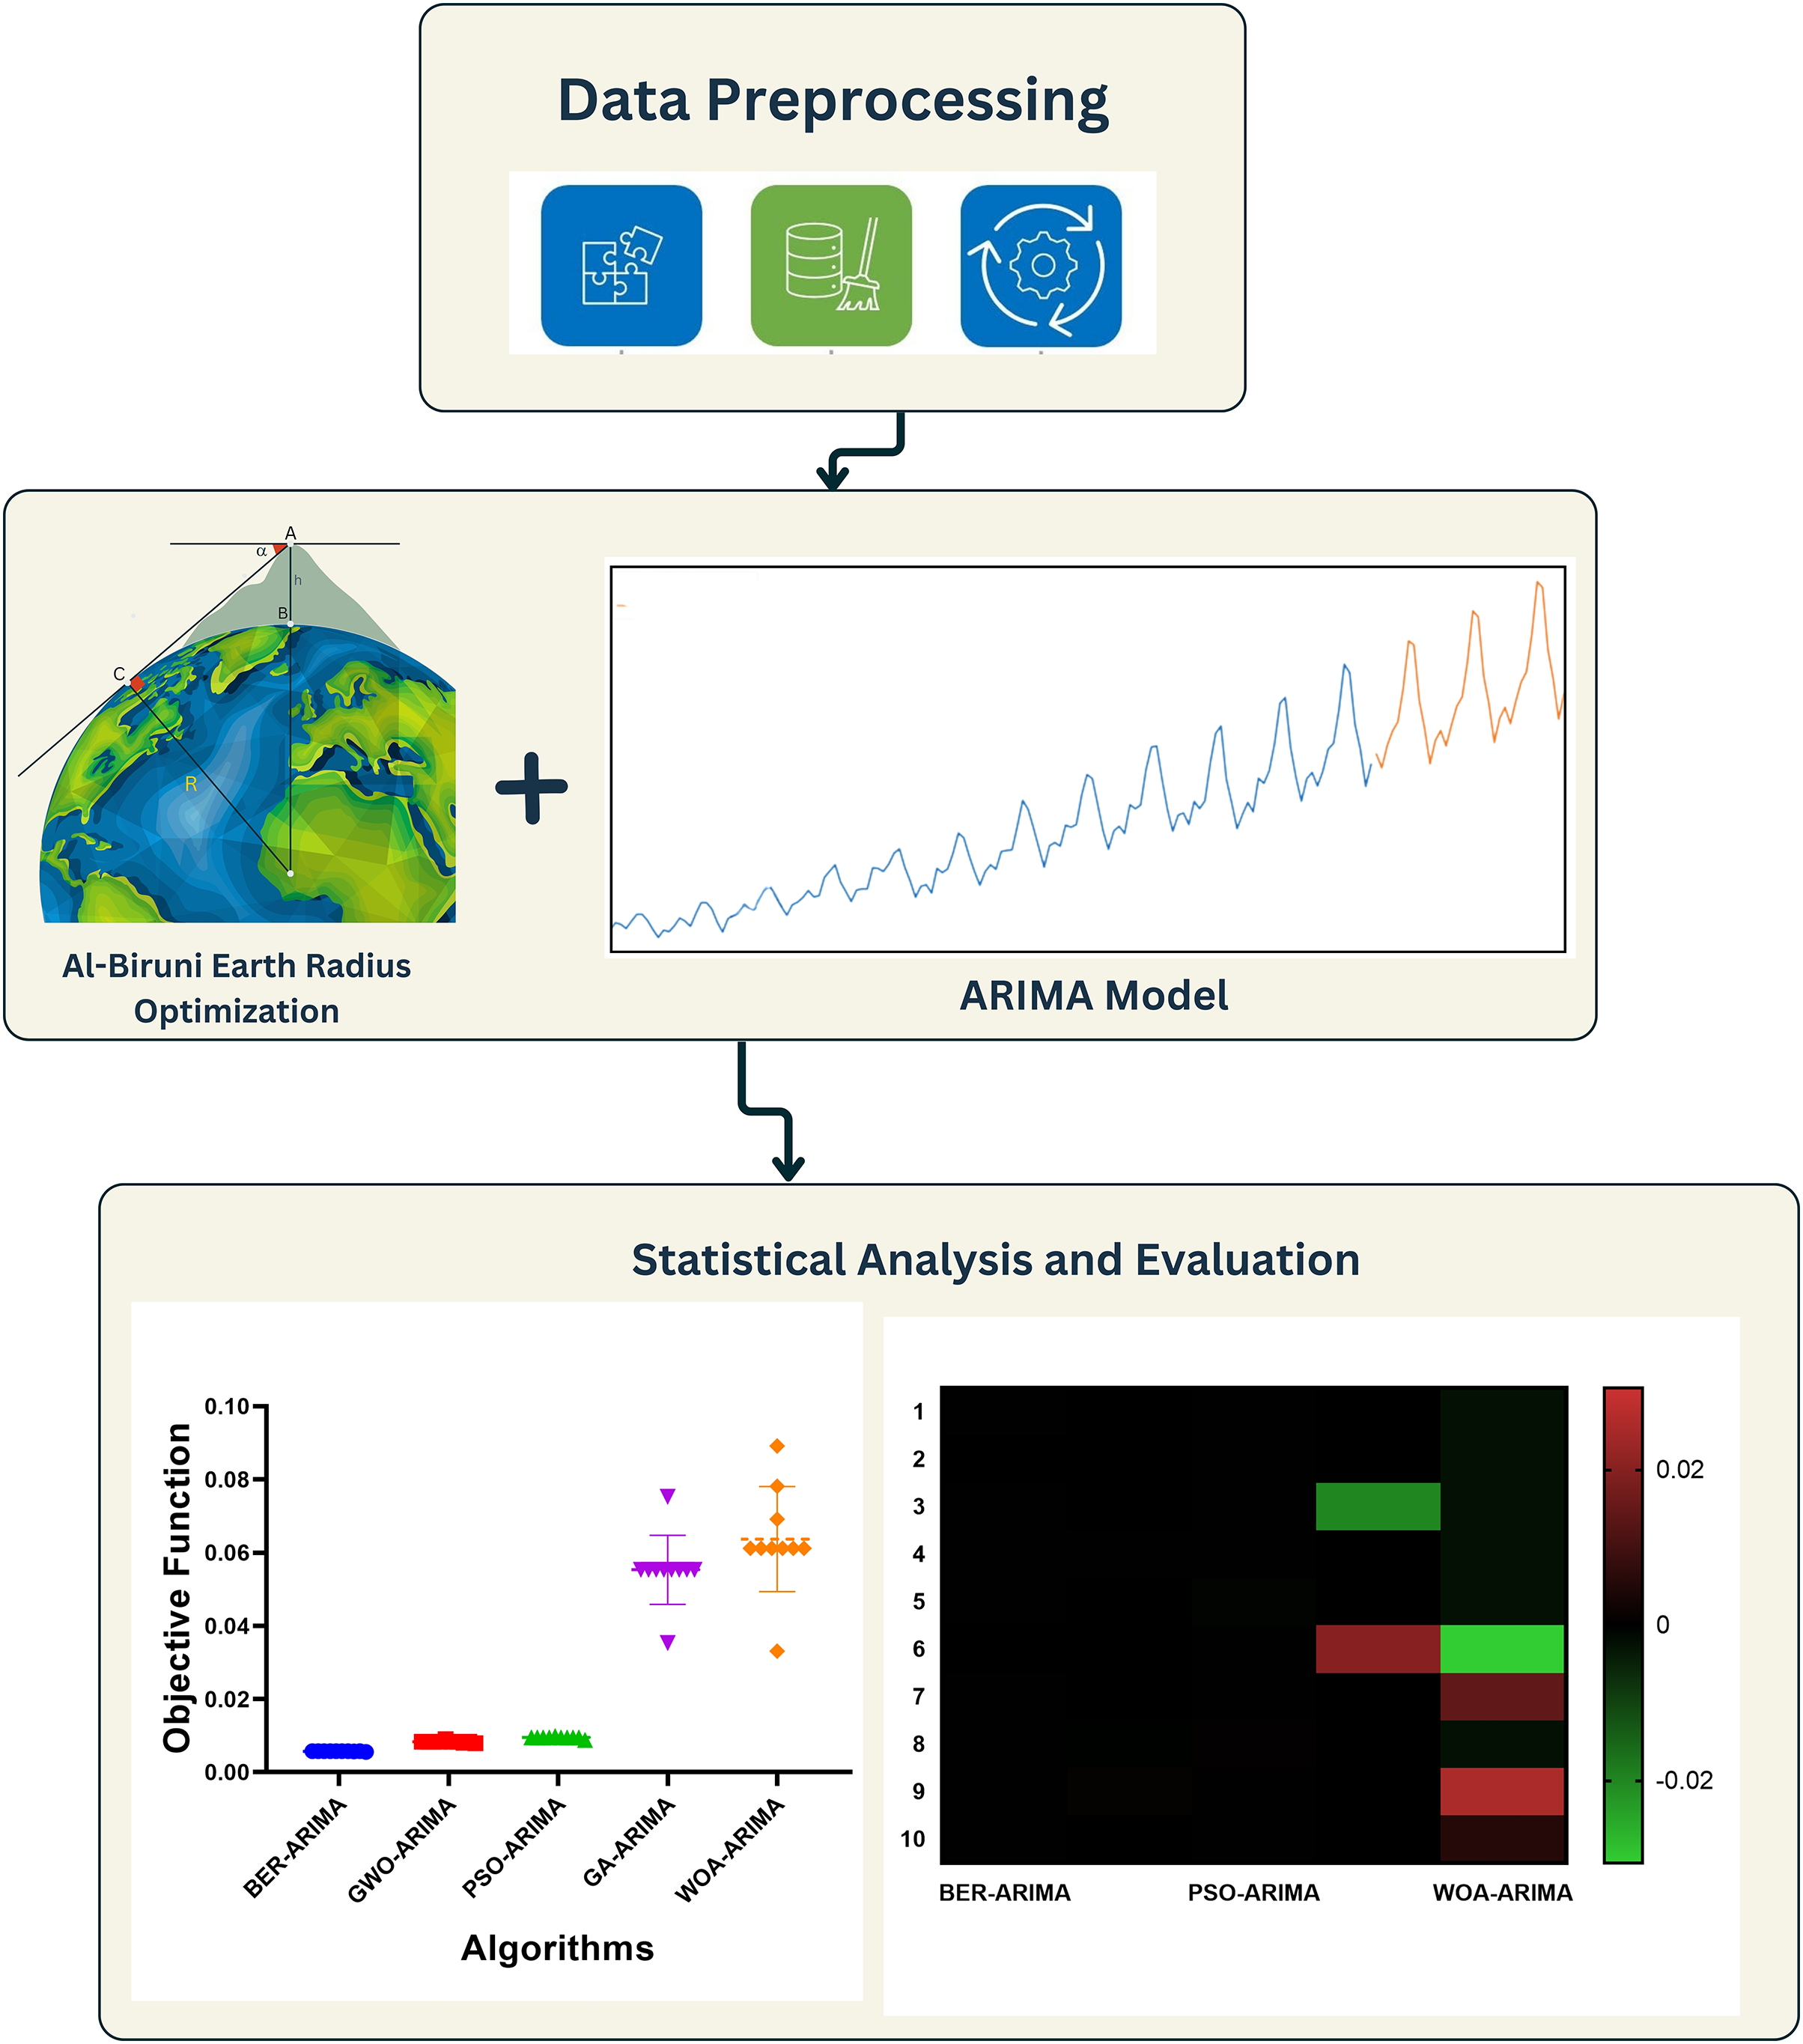
Figure 2: The proposed framework of ARIMA-BER for Wireless Sensor Networks (WSN)
In this study, data obtained from the latest version of the Kaggle dataset was created, especially for WSNs [26]. The datasets, more than 2.3 million rows in number, allow a thorough probing of WSN behavioral patterns. The primary columns encompass:
• timestamp: This is a DateTime field that shows the time component of each measurement.
• sensor_id: This is an important part that shows the unique number that is given to each sensor in the network.
• sensor_type: All sensors of this type are marked with the letter “B.” The original collection only had one kind of measurement, which was marked with a “b.”
• temp_C: This parameter is very important for knowing how the environment affects the WSN because it shows the temperature in Celsius for each test.
• hpa_div_4: A unit of measurement for pressure in hectopascals (hPa) split by four.
• battery_level: This number tells how much power each sensor has left, so it is a key part of figuring out how energy-efficient each sensor is in the network.
• sensor_cycle: This variable stores the number of sensor cycles and helps you keep track of the operating cycles of sensors across the dataset.
The analyzed data has evolved from the dataset. However, the major research focus is the implication of the federal basis and its optimization. This Section is devoted to the methodology applied, the algorithms used, and the statistics used.
3.2 Descriptive Analysis of the Data
To fully understand the Wireless Sensor Network (WSN) information, a detailed description analysis was carried out. For this, visual tools like heatmaps and histograms were used to find patterns, trends, and ranges in the collection [27].
Making a heatmap is a useful way to show the correlation matrix in the information. This graphic helps us understand how the many factors are connected and affected by each other in a confusing way [28]. The heatmap in Fig. 3 makes it easy to see how different factors are related by using a color gradient, where darker shades show stronger relationships. The heatmap analysis gave us valuable information that helped us find possible multicollinearity and figure out which factors in the dataset can have a big effect on others [29].
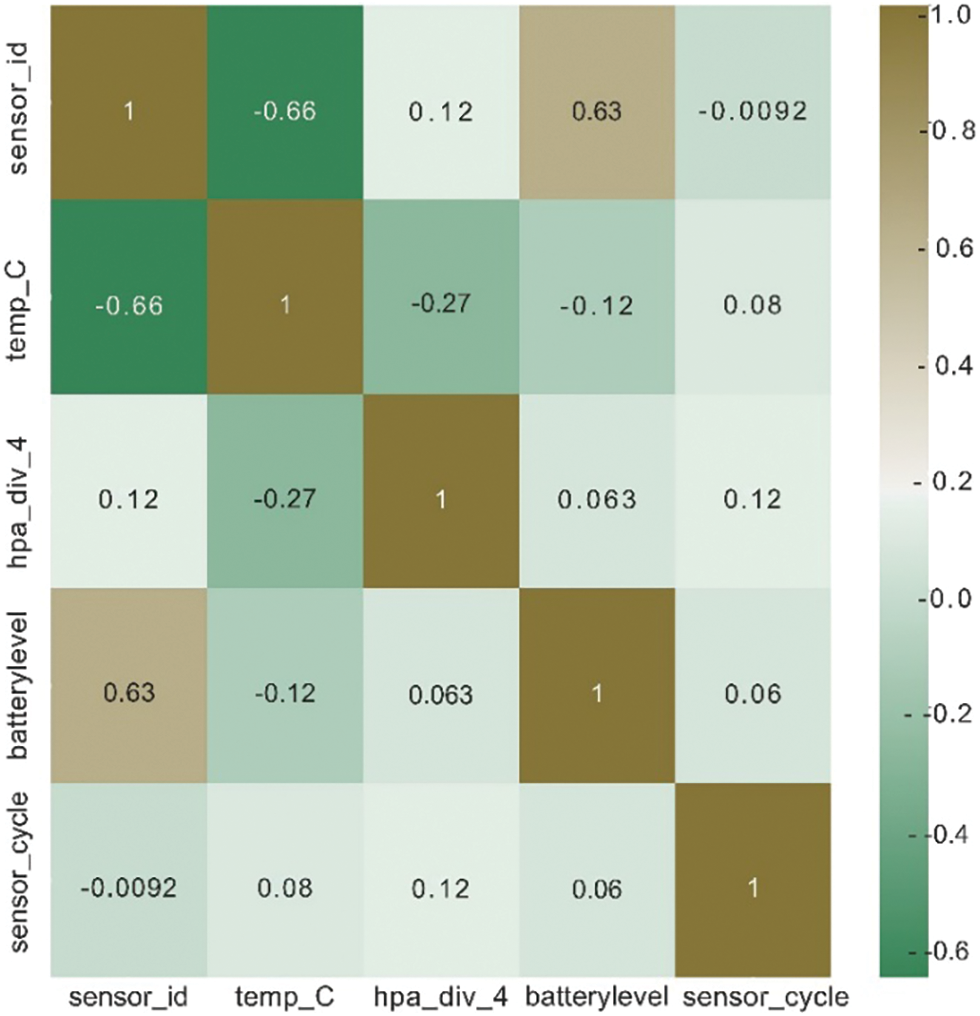
Figure 3: Heatmap analysis of the WSN dataset
Histograms are a reliable way to look at how important factors like temperature (temp_C), pressure (hpa_div_4), battery level (battery_level), and sensor cycles are spread out. As shown in Fig. 4, the images give information about the frequency, which helps us understand the main trends and changes. This careful examination sets the stage for comprehending the range and spread [30–32].
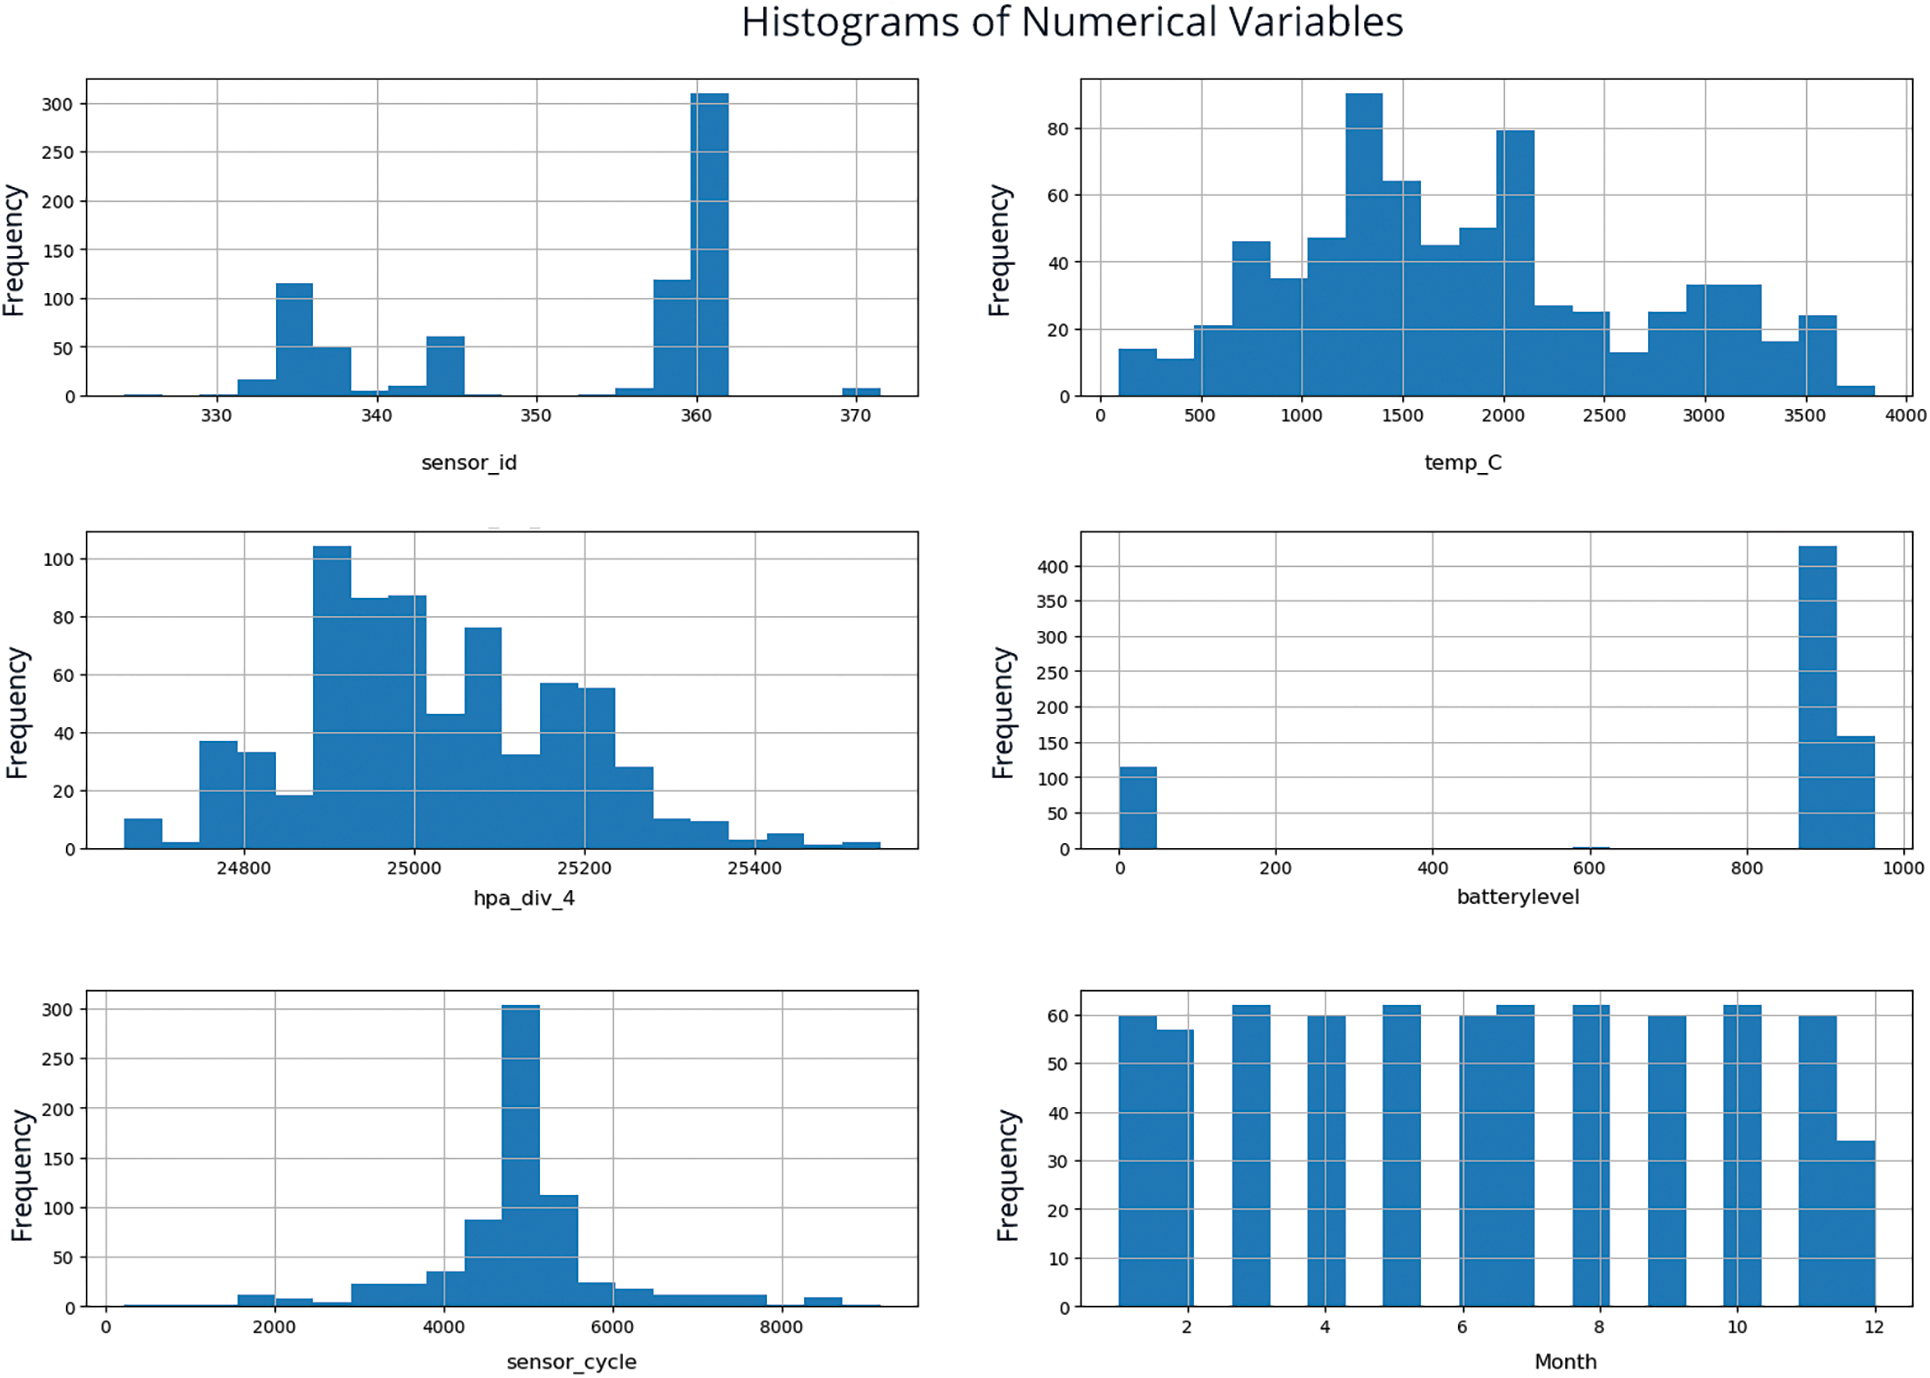
Figure 4: Histogram analysis of WSN dataset
These descriptive statistics are the first step in analyzing this information. They tell us important things about the people or things that make it up. Making heat maps and histograms is an important part of getting a better understanding of how different factors are related. Once people understand this better, it helps them come up with useful tactics and lets them choose between metaheuristic algorithms. The next parts will talk about how to use these algorithms and statistical methods in the real world so that they can be improved even more and the Wireless Sensor Network works better [33].
3.3 Al-Biruni Earth Radius (BER) Algorithm
Al Biruni calculated the radius of the Earth in the 11th century. It found the distance from a hilltop to the ground between the sky and the ground. Two times, Al-Biruni measured. First, he calculated the mountain’s elevation. From two different spots, he found the angle to the top of the hill twice. The following equation, as shown in Fig. 5, helped him figure out how high the mountain was.
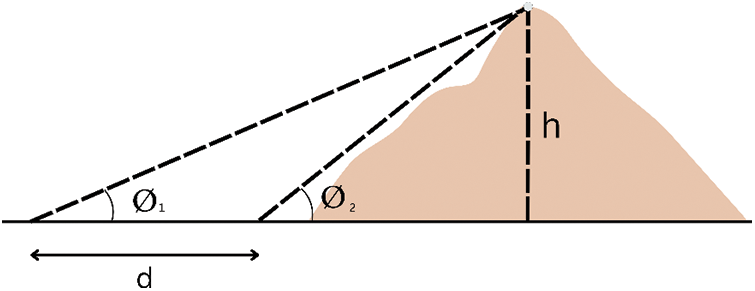
Figure 5: Calculation of hill height based on the Al-Biruni equations
Second, Al-Biruni climbed to the top of the mountain and measured how far down the sky it was. Based on the information he had, he was able to calculate the radius of the Earth using the equation shown in Fig. 6.
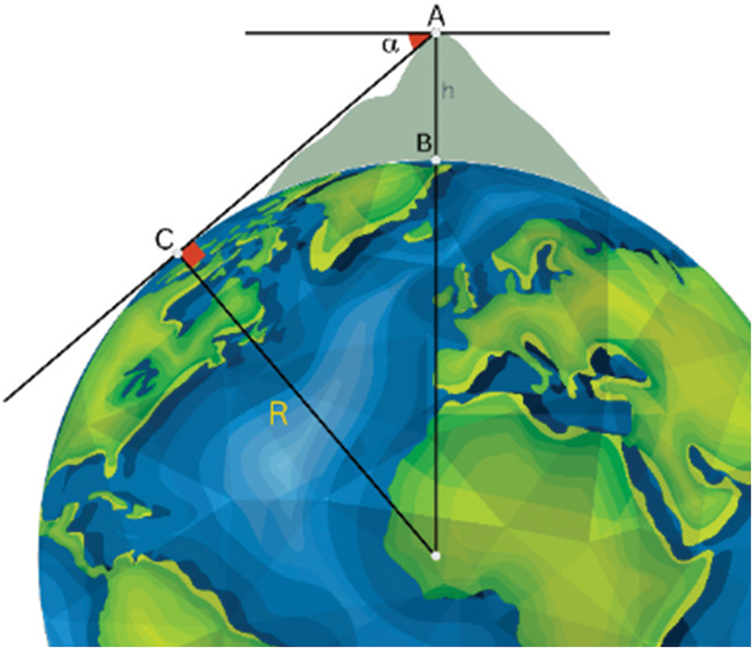
Figure 6: Calculation of Earth Radius based on the Al-Biruni method
The suggested optimization method used the Al-Biruni technique for the exploration and exploitation tasks of the cooperative optimization algorithm. This simulated swarm collaboration to reach a global optimization goal. Real-life swarms live in groups and talk to each other to get what they want. They usually get food and protect themselves from attackers by working together and trading off tasks as needed. They broke up into smaller groups, and people worked together within their groups and with people from other groups to reach their main goal. Ant and bee colonies are two examples of swarms that work together. Each bee in the swarm does something different to help the hive. Soldiers in the settlement are fed by people who go out and gather food. The idea for BER came from the fact that people in groups are often split up into smaller groups to work on different tasks at different times and help each other reach their goals. Most of the time, exploration and exploitation are done to find the best answer to an optimization problem. In our case, BER splits people into two smaller groups, each of which is responsible for one of the two tasks. In BER, the actions of exploitation and exploration make sure that the search space is thoroughly explored so that the local optima can stay safe. Most joint optimization methods require everyone to do exploitation after each cycle, which could make local optima remain where they are. BER escapes this situation by having a group of search bots that, over time, look into more parts of the search space. BER also quickly raises the number of people looking into the search space if the algorithm’s performance does not get better after three solution mutations.
3.3.2 Basic Concepts and Formulation
The goal of optimization algorithms is to find the best answer to a problem that has several constraints. BER lets you show a person from the population as a vector,
3.3.3 Exploration-Exploitation Balance
In this proposed method, the population is split into subgroups, and the number of people in each group changes over time to make the jobs of exploitation and exploration more evenly distributed. As the first step, the population is split into two groups to be used for exploration and exploitation. Of the people in the population, 70% are in the exploration group, and only 30% are in the exploitation group. So that the fitness values of each person in each group get better, the number of people in the exploitation job is set at 30% at first and then raised over the optimization steps until it reaches 70% of the population count. However, over time, the number of people in the exploration group dropped from 70% to 30%, even though the starting number was 70%. The world’s general level of fitness can get even better with this process. Additionally, the elitist strategy is used to ensure the convergence of the optimization process for the population by maintaining the process’s top solution if no better solution is found. In the BER optimization method, a solution may be a local optimum if its fitness does not improve significantly after three rounds. This can lead to the creation of a new exploration individual through the mutation operation.
Exploration is the process of finding interesting parts of the search space and keeping the search going past the local optimal point. This strategy will have the lone traveler look for more interesting areas to explore nearby, which will help the group get closer to the best answer. Exploration is not just about finding the best answer; it is also about figuring out how well it works. To reach this goal, you need to investigate the options in your area and pick the one that fits your fitness needs the best. In BER’s works, this is done with the help of the following equations:
S(t) is the solution vector for step t, and D is the size of the circle that the search agent will look inside to find interesting areas. The search tool will only look for interesting areas inside this circle. x can be any number between 0 and 180, and h is a scalar that can be any number between 0 and 2. When you solve the equation, you get numbers for
The group whose job it is to take advantage of chances needs to work to make the answers that are already there better. At the end of each cycle, the BER will give rewards to the people who have worked the hardest to get to the top levels of fitness. In this section, we will talk about the two different ways that the BER tried to reach its exploitation goal. We can move closer to finding a solution to the problem if we use the following equation to guide our actions toward the best answer:
The equation below shows how the BER performs the process that was just explained. Here, Q(t) is the solution vector at step t, L(t) is the best possible solution vector, D is the distance vector, and
With the optimal solution expressed by Q∗(t). We could select the optimal Q∗ implementation by comparing Q(
When z is a number between 0 and 1, and h is the height of the hill.
To ensure the quality of the answers found, the BER picks the best one for the next round. Although the elitist method makes algorithms more efficient, it can cause multimodal functions to reach convergence too quickly. It is important to note that the BER has great exploration skills because it uses a mutation method and searches around people in the exploration group. Due to its strong exploration skills, the BER can avoid early convergence [19]. Al-Biruni Earth Radius BER algorithm is described in Algorithm 1.

Al-Biruni Earth Radius algorithm has a dynamic tuning process that is meant to fix the issues that come up with WSNs. When combined with a balance in the discovery and exploitation processes, it makes it a useful tool for achieving better convergence and efficiency within the limits of our study. Fig. 7 displays the pseudo-code for the Al-Biruni Earth Radius optimization algorithm. This gives a clear picture of how it is put together and helps us understand its complex workings better.
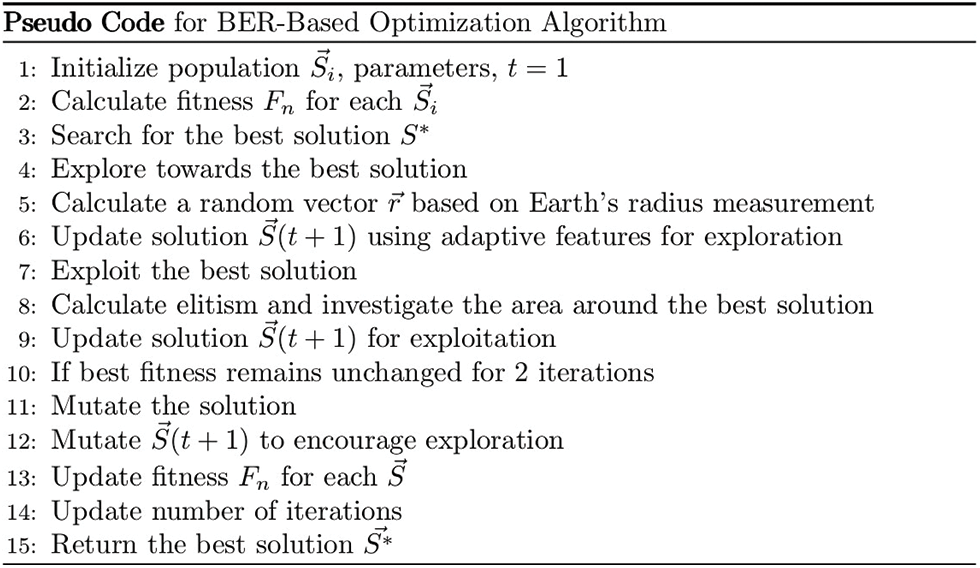
Figure 7: Pseudo code for BER-based optimization algorithm
3.4 Hyperparameter Tuning for ARIMA Models
Hyperparameter tuning in time series forecasting, particularly with ARIMA models, is crucial for achieving optimal accuracy and reliability in predictions. The selection of hyperparameters such as the differencing factor (d), the order of the moving average feature (q), and the order of the autoregressive feature (p) significantly impacts the model’s performance. The aim of hyperparameter optimization is to strike a balance between model complexity and prediction accuracy, ensuring that the model generalizes well to unseen data.
To achieve effective hyperparameter tuning, various optimization algorithms can be employed. These algorithms aim to explore the hyperparameter space efficiently while considering both the discovery of optimal configurations and their exploitation for accurate predictions. By leveraging optimization techniques, such as grid search, random search, or more advanced methods like Bayesian optimization, practitioners can identify the best hyperparameters for their ARIMA models [34–37].
In the time series forecasting framework, the performance of the ARIMA model strongly depends on the selected hyperparameters. Hence, the proper combination of these elements is crucial in order to make accurate predictions. Hyperparameter tuning is a systematic technique that allows analysts to increase the model’s predictive power, leading to more intelligent decision-making and improved outcomes, for instance, in the finance, economics, and resource management areas.
The BER algorithm is the basis of the second optimization algorithm and is of theoretical and practical importance, especially in industrial applications and sensor networks. The algorithm’s built-in dynamics and adaptivity make the solution suitable for practical applications ranging from determining optimum sensor locations to reducing power consumption and increasing network performance. In many industries that specialize in features such as precision, reliability, and resource utilization, the BER scheme can be exceptionally important in improving operations and lowering costs.
In addition, this feature enables the BER optimization method to respond differently to varied environments and is versatile across all kinds of jobs and industries. Industrial plants can take advantage of BER technology through its integration into optimization frameworks for enhanced operation as a consequence of increased efficiency, which equates to a longer lifespan for products under real-life conditions. In general, the developed BER optimization approach not only provides a new set of manufacturing principles but also significantly contributes to the movement of sensor networks towards higher efficiency and performance in the different domains.
The Al-Biruni Earth Radius (BER) algorithm is a distinctive and innovative addition to our optimization framework, exerting a notable influence on the Autoregressive Integrated Moving Average (ARIMA) model within the Wireless Sensor Network (WSN) dataset. This algorithm introduces a dynamic optimization process designed to strategically balance the exploration and exploitation mechanisms, addressing challenges inherent in WSNs. By incorporating adaptive features, the BER algorithm enhances convergence in demanding optimization scenarios, making it an asset in the optimization toolkit. When coupled with the ARIMA model, the BER algorithm augments the forecasting capabilities of the ARIMA model, contributing to improved precision in time series forecasting. The synergy between the two enables the ARIMA model to benefit from the BER algorithm’s unique approach, resulting in enhanced overall performance and efficiency in WSNs.
Table 1 presents a comprehensive comparison of the ARIMA model’s performance metrics against a baseline, evaluated across various criteria. These metrics include Mean Squared Error (MSE), Root Mean Squared Error (RMSE), Mean Absolute Error (MAE), Mean Bias Error (MBE), Pearson correlation coefficient (R), R-squared (R2), Relative RMSE (RRMSE), Nash-Sutcliffe Efficiency (NSE), and Willmott’s Index (WI). Notably, the ARIMA model exhibits outstanding performance, characterized by a notably reduced MSE of 0.00633. This reduction underscores the model’s prowess in time series forecasting, indicating a higher level of predictive accuracy. Lower MSE values signify stronger alignment between predicted and actual values, affirming the ARIMA model’s reliability in capturing temporal patterns within the dataset.
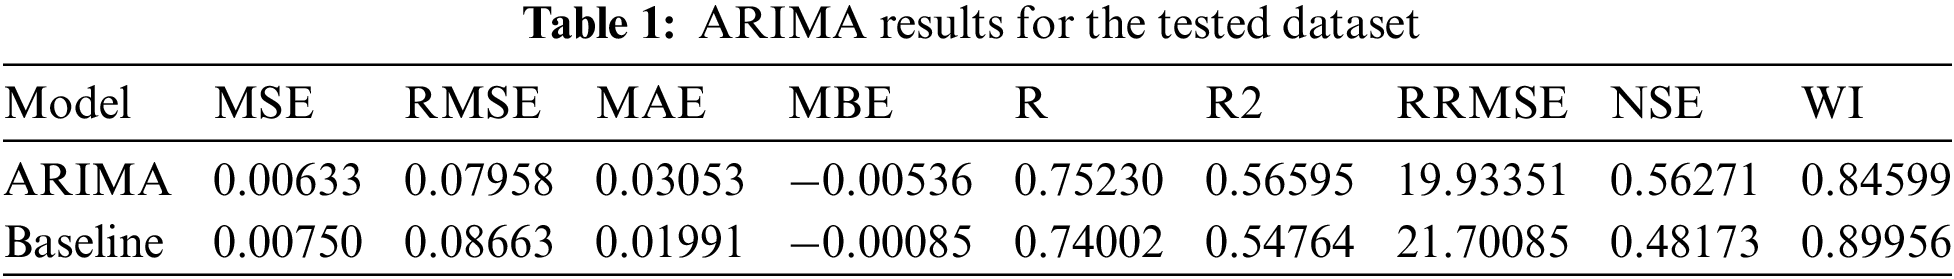
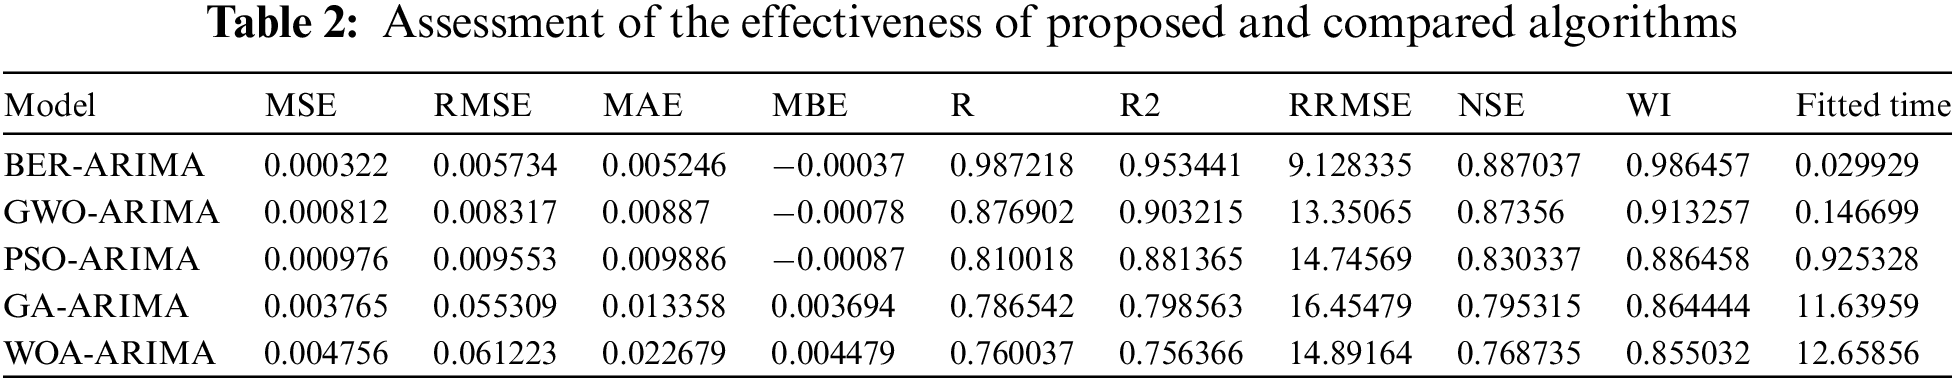
Table 2 provides a detailed comparison of the proposed BER-ARIMA algorithm with alternative optimization techniques, including GWO-ARIMA, PSO-ARIMA, GA-ARIMA, and WOA-ARIMA. Various evaluation metrics are considered, such as (MSE), Root Mean Squared Error (RMSE), Mean Absolute Error (MAE), Mean Bias Error (MBE), Pearson correlation coefficient (R), R-squared (R2), Relative RMSE (RRMSE), Nash-Sutcliffe Efficiency (NSE), Willmott’s Index (WI), and Fitted Time. These metrics offer insights into the effectiveness and efficiency of each algorithm in optimizing the Wireless Sensor Network dataset.
A radar graph that is illustrated in Fig. 8 is a pictorial document that is used to depict many performance metrics at the same time, thus making it easy to compare the various algorithms. In this context, the algorithm BER-ARIMA is graphically shown in a radar plot against the rest of the algorithms. BER-ARIMA refers to Bit Error Rate-Autoregressive Integrated Moving Average, a model for forecasting that is suitable for time series and is frequently used in forecasting.
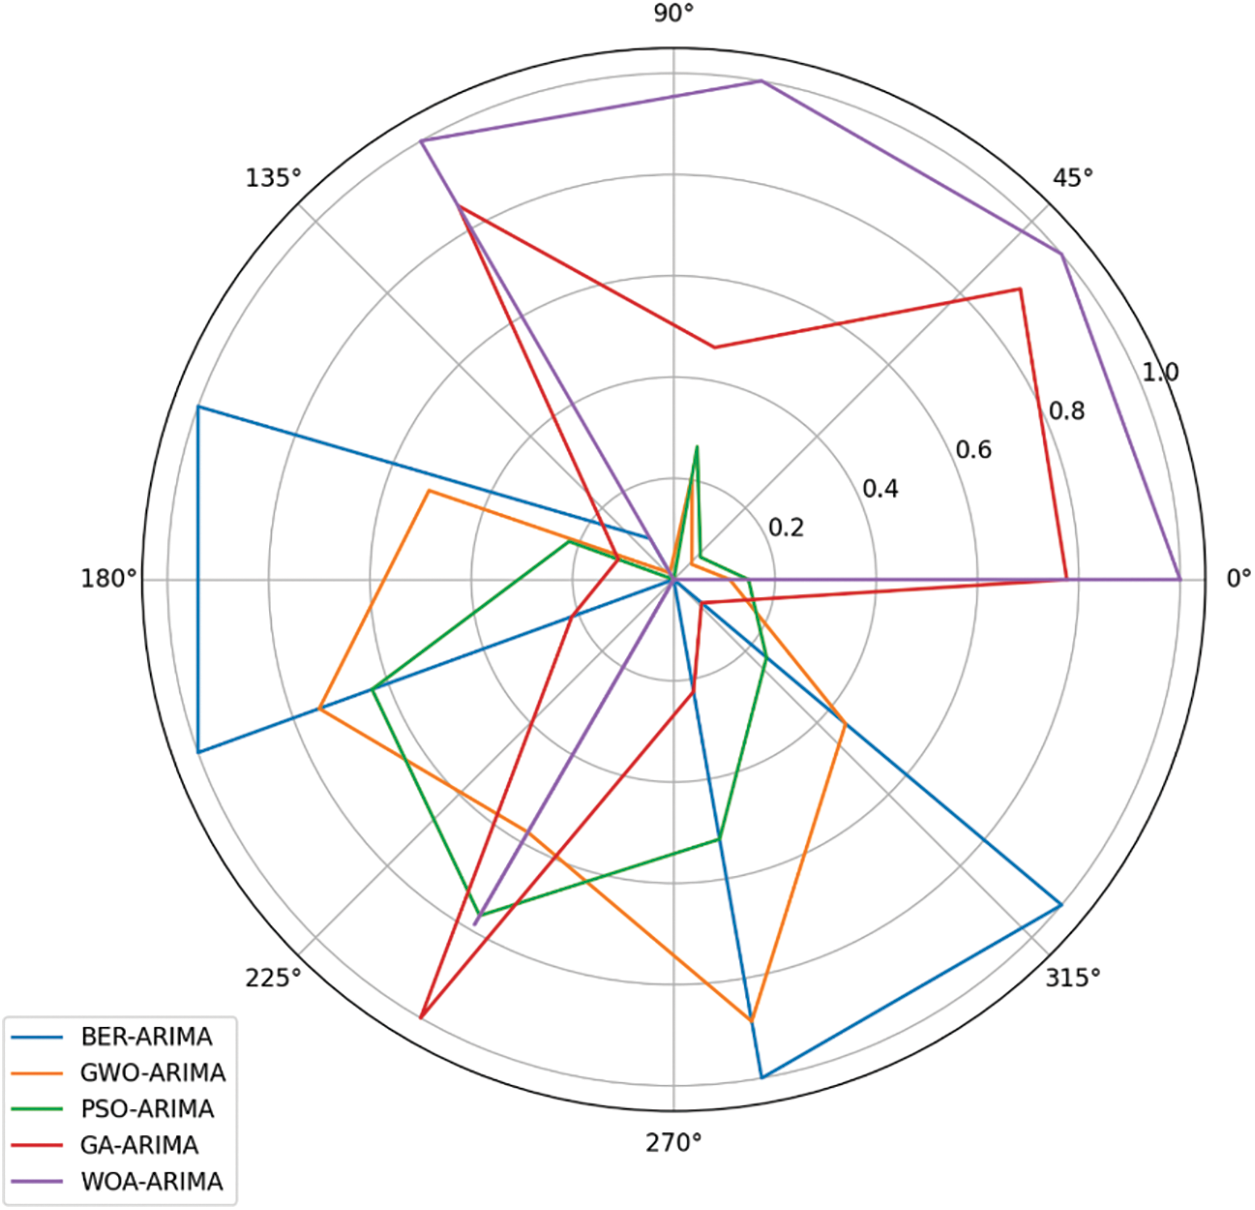
Figure 8: Radar plot of performance metrics (BER-ARIMA vs. other algorithms)
Table 3 provides a comprehensive overview of the performance metrics associated with various optimization techniques. It encompasses statistical measurements such as the minimum and maximum values, confidence intervals, and mean values. The table examines key parameters for BER-ARIMA, GWO-ARIMA, PSO-ARIMA, GA-ARIMA, and WOA-ARIMA, shedding light on their performance across different evaluation criteria.
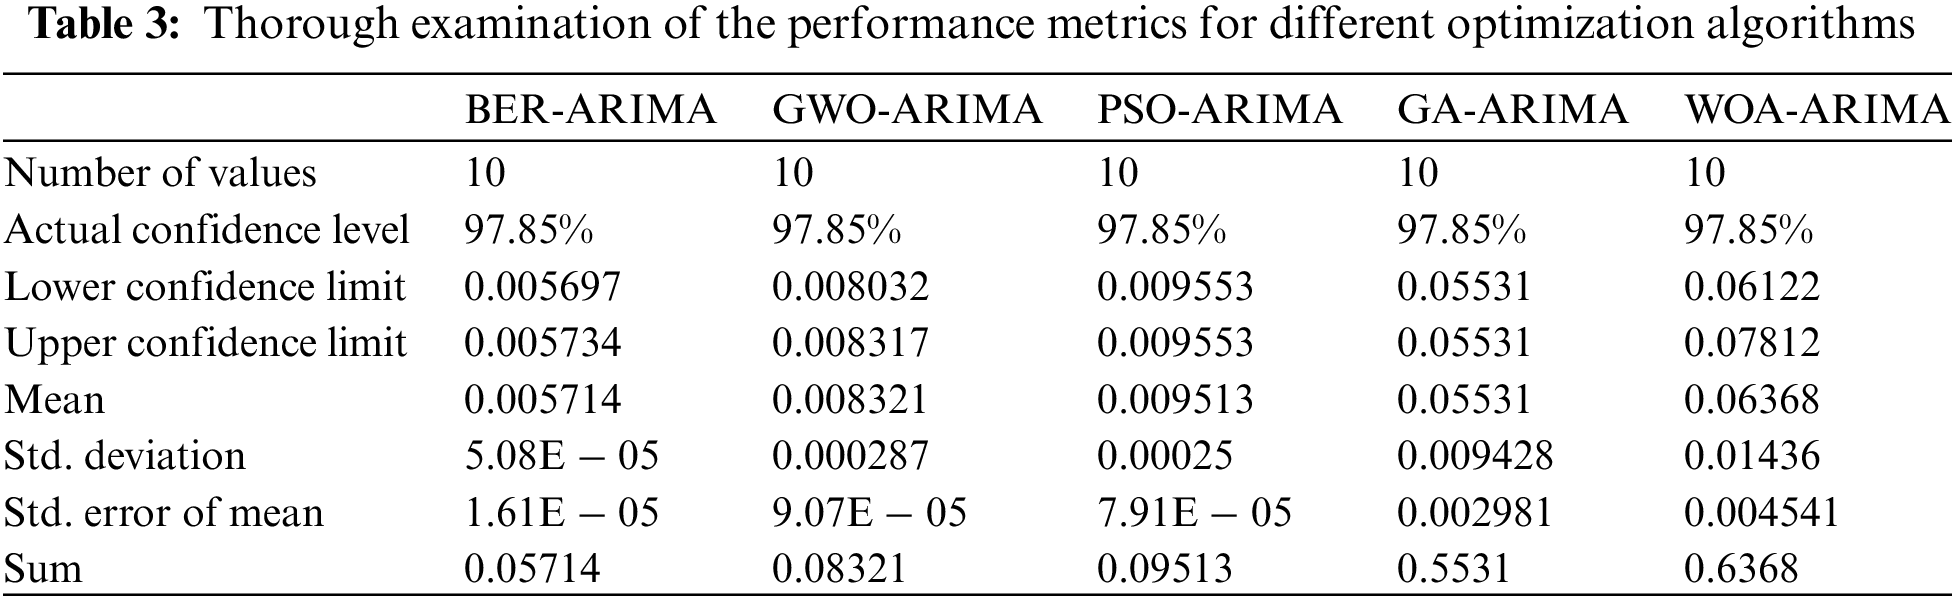
Fig. 9 provides a detailed illustration of the accuracy evaluation, specifically emphasizing the Root Mean Squared Error (RMSE) for the Al-Biruni Earth Radius (BER) optimization algorithm when integrated with the ARIMA model. Furthermore, it offers a comparison of this algorithm with other prominent optimization techniques. The depicted models include BER-ARIMA, Grey Wolf Optimization (GWO) combined with ARIMA (GWO-ARIMA), Particle Swarm Optimization (PSO) incorporated with ARIMA (PSO-ARIMA), and Whale Optimization Algorithm (WOA) in conjunction with ARIMA (WOA-ARIMA).
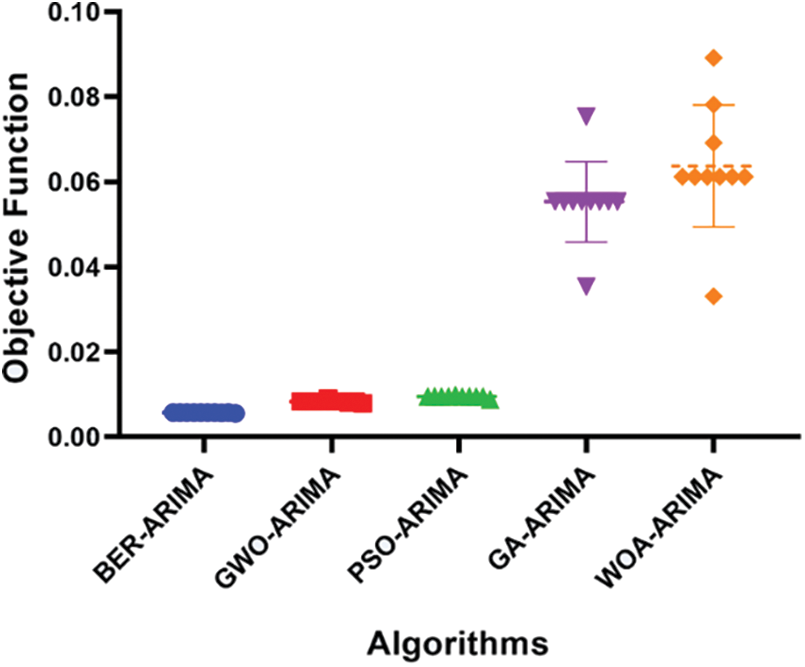
Figure 9: Assessment of the accuracy of proposed and compared models
Fig. 10 serves as a comprehensive visualization tool, offering a detailed exploration of residual values and heatmap analysis for both the BER-ARIMA algorithm and the alternative optimization models under comparison. By presenting residual values alongside heatmap analysis, this figure provides a holistic view of the models’ accuracy and behavior. Residual values offer insights into the model’s predictive performance by showcasing the differences between predicted and actual values, while heatmap analysis visually represents the patterns and correlations within the data. Together, these elements enable a thorough assessment of the models’ performance, facilitating informed decision-making in selecting the most suitable optimization approach.
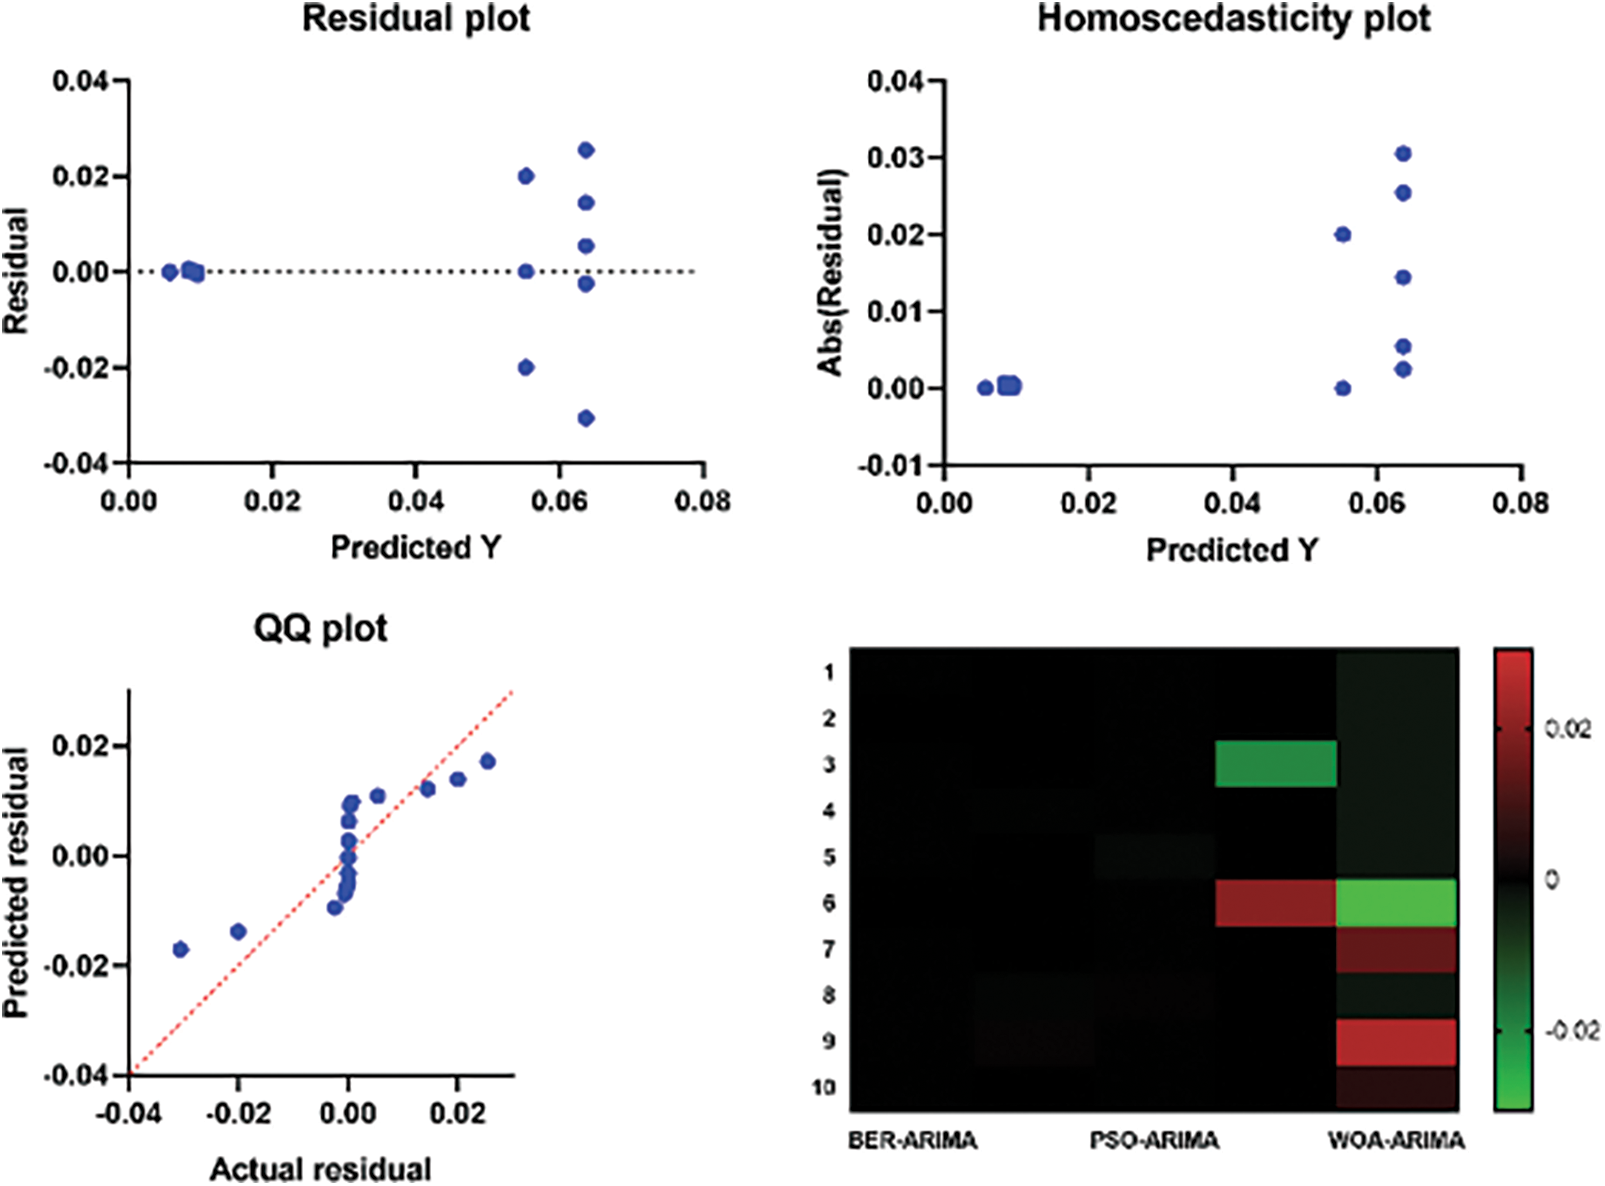
Figure 10: Residual values and heatmap analysis for BER-ARIMA and compared models
In Table 4, an analysis of variance (ANOVA) was conducted to compare the performance of the Al-Biruni Earth Radius (BER) Optimization algorithm with various other optimization strategies. The results indicate significant variations in treatment outcomes, as evidenced by the obtained F statistic (F(4, 45) = 137.3) and the corresponding p-value (p < 0.0001). The computed sums of squares (SS), degrees of freedom (DF), and mean squares (MS) further elucidate the significant differences observed among the optimization algorithms [38].
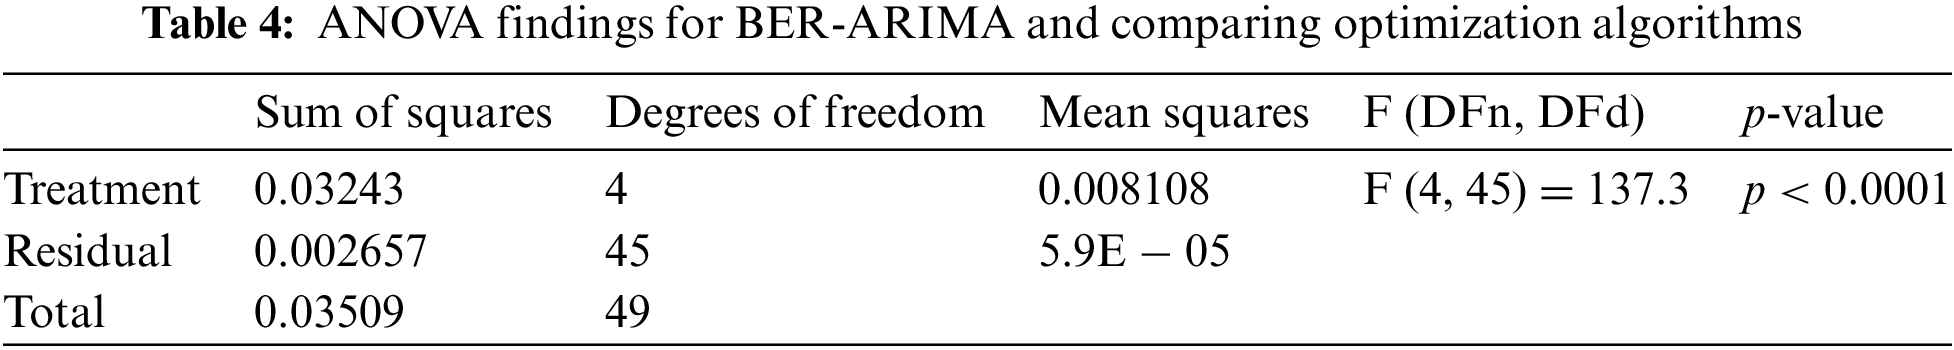
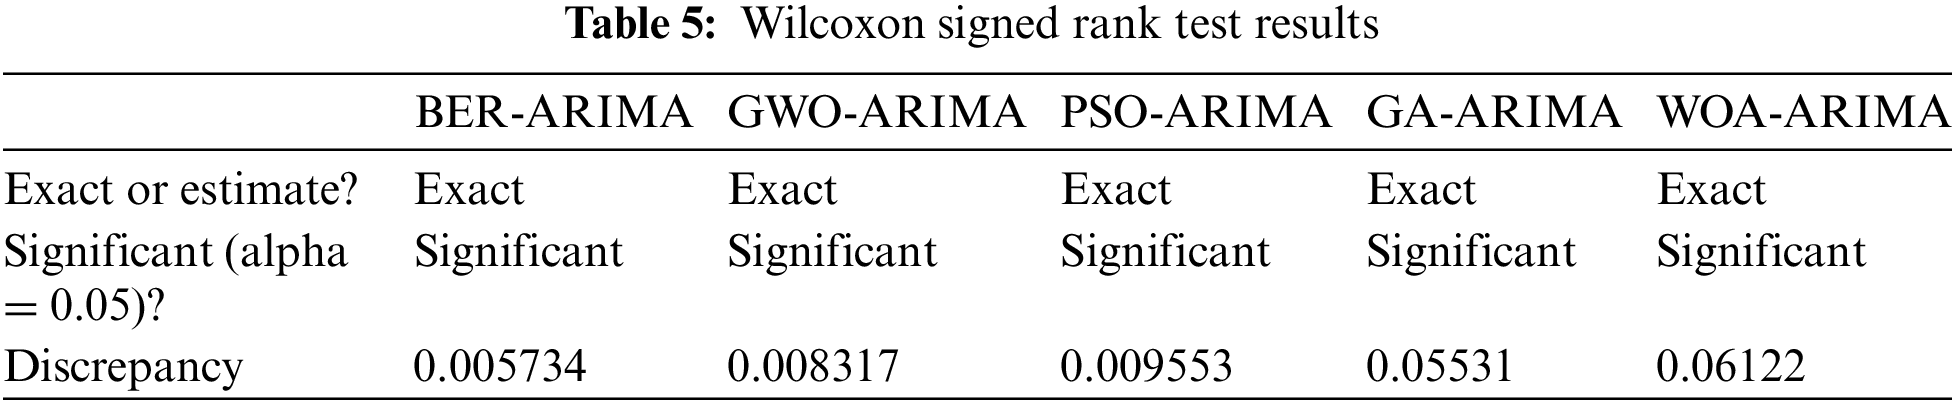
Table 5 presents the outcomes of the Wilcoxon Signed Rank Test, which compares the performance of BER-ARIMA with other optimization algorithms. The test results indicate significant differences between BER-ARIMA and the compared algorithms, with all comparisons yielding a p-value less than 0.05, signifying statistical significance. The observed discrepancies underscore the effectiveness of the proposed BER-ARIMA model in optimizing Wireless Sensor Networks.
These findings collectively highlight the robustness and superiority of BER-ARIMA over other state-of-the-art optimization strategies, reaffirming its potential for real-world applications. The statistical analyses conducted further validate the significance and reliability of the observed differences across various evaluation criteria.
5 Conclusion and Future Directions
In Conclusion, the main aim of this study was to ensure that the performance of Wireless Sensor Networks improved through Arima and a new Metaheuristic algorithm, BER. Temporal series data fits in better here than does the neural network. For instance, the improved model outperformed the simple counterpart on these metrics: MSE, RMSE and NSE. The director’s main aim was to blend novel ideas into the existing ones and not go too far out. It got top marks and surpassed other algorithms in tests by having small mean square error and high speed. The ANOVA and Wilcoxon methods were used, along with their score for stability, to see whether the differences in performance were stably different or not. Using this method for the improvement of dynamic wireless sensor networks is an interesting idea for the future. One must think about the limits of the real world and how to make the program work on bigger systems. Looking into how different models work together and improving the BER method, both look like good ways to create optimization strategies that are even better in wireless sensor networks.
Acknowledgement: Princess Nourah bint Abdulrahman University Researchers Supporting Project number (PNURSP2024R323), Princess Nourah bint Abdulrahman University, Riyadh, Saudi Arabia.
Funding Statement: This research was funded by Princess Nourah bint Abdulrahman University Researchers Supporting Project.
Author Contributions: The authors confirm their contribution to the paper as follows: Study conception and design: S. K. Towfek, Marwa M. Eid; data collection: Doaa Sami Khafaga; analysis and interpretation of results: Abdelhameed Ibrahim, Ahmed Mohamed Zaki, Reem Ibrahim Alkanhel; draft manuscript preparation: Abdyalaziz A. Al-Mooneam, S. K. Towfek. All authors reviewed the results and approved the final version of the manuscript.
Availability of Data and Materials: The data that support the findings of this research are openly available on kaggle.com at https://www.kaggle.com/datasets/halimedogan/wireless-sensor-network-data/data.
Conflicts of Interest: The authors declare that they have no conflicts of interest to report regarding the present study.
References
1. T. A. Alghamdi, “Energy efficient protocol in wireless sensor network: Optimized cluster head selection model,” Telecommun. Syst., vol. 74, no. 3, pp. 331–345, 2020. doi: 10.1007/s11235-020-00659-9. [Google Scholar] [CrossRef]
2. Z. Miao, X. Yuan, F. Zhou, X. Qiu, Y. Song and K. Chen, “Grey wolf optimizer with an enhanced hierarchy and its application to the wireless sensor network coverage optimization problem,” Appl. Soft Comput., vol. 96, no. 3, pp. 106602, Nov. 2020. doi: 10.1016/j.asoc.2020.106602. [Google Scholar] [CrossRef]
3. M. Jahandideh-Tehrani, O. Bozorg-Haddad, and H. A. Loáiciga, “Application of particle swarm optimization to water management: An introduction and overview,” Environ. Monit. Assess., vol. 192, no. 5, pp. 281, 2020. doi: 10.1007/s10661-020-8228-z [Google Scholar] [PubMed] [CrossRef]
4. K. M. Hamdia, X. Zhuang, and T. Rabczuk, “An efficient optimization approach for designing machine learning models based on genetic algorithm,” Neural Comput. Appl., vol. 33, no. 6, pp. 1923–1933, 2021. doi: 10.1007/s00521-020-05035-x. [Google Scholar] [CrossRef]
5. H. Mohammed and T. Rashid, “A novel hybrid GWO with WOA for global numerical optimization and solving pressure vessel design,” Neural Comput. Appl., vol. 32, no. 18, pp. 14701–14718, 2020. doi: 10.1007/s00521-020-04823-9. [Google Scholar] [CrossRef]
6. M. E. S. Abdelmalak et al., “BER-XGBoost: Pothole detection based on feature extraction and optimized XGBoost using BER metaheuristic algorithm,” J. Artif. Intell. Metaheuristics, vol. 6, no. 2, pp. 46–55, 2023. doi: 10.54216/JAIM.060205. [Google Scholar] [CrossRef]
7. A. Ibrahim et al., “Al-biruni earth radius optimization based algorithm for improving prediction of hybrid solar desalination system,” Energies, vol. 16, no. 3, pp. 1185, 2023. doi: 10.3390/en16031185. [Google Scholar] [CrossRef]
8. M. Lei et al., “A fast convergence strategy based on gray wolf optimization algorithm for co-estimation of battery state of charge and capacity,” Electrochim. Acta, vol. 474, pp. 143525, 2024. doi: 10.1016/j.electacta.2023.143525. [Google Scholar] [CrossRef]
9. J. Feng et al., “A UAV path planning method in three-dimensional space based on a hybrid gray wolf optimization algorithm,” Electronics, vol. 13, no. 1, pp. 68, 2024. doi: 10.3390/electronics13010068. [Google Scholar] [CrossRef]
10. R. Rajakumar, J. Amudhavel, P. Dhavachelvan, and T. Vengattaraman, “GWO-LPWSN: Grey wolf optimization algorithm for node localization problem in wireless sensor networks,” J. Comput. Netw. Commun., vol. 2017, pp. e7348141, 2017. doi: 10.1155/2017/7348141. [Google Scholar] [CrossRef]
11. A. Kaushik, S. Indu, and D. Gupta, “A grey wolf optimization approach for improving the performance of wireless sensor networks,” Wirel. Pers. Commun., vol. 106, no. 3, pp. 1429–1449, Jun. 2019. doi: 10.1007/s11277-019-06223-2. [Google Scholar] [CrossRef]
12. A. P. Piotrowski, J. J. Napiorkowski, and A. E. Piotrowska, “Population size in particle swarm optimization,” Swarm Evol. Comput., vol. 58, no. 3, pp. 100718, 2020. doi: 10.1016/j.swevo.2020.100718. [Google Scholar] [CrossRef]
13. C. Kim, R. Batra, L. Chen, H. Tran, and R. Ramprasad, “Polymer design using genetic algorithm and machine learning,” Comput. Mater. Sci., vol. 186, no. 7, pp. 110067, 2021. doi: 10.1016/j.commatsci.2020.110067. [Google Scholar] [CrossRef]
14. S. Chakraborty, A. Kumar Saha, S. Sharma, S. Mirjalili, and R. Chakraborty, “A novel enhanced whale optimization algorithm for global optimization,” Comput. Ind. Eng., vol. 153, no. 5, pp. 107086, 2021. doi: 10.1016/j.cie.2020.107086. [Google Scholar] [CrossRef]
15. W. Yang et al., “A multi-strategy whale optimization algorithm and its application,” Eng. Appl. Artif. Intell., vol. 108, pp. 104558, 2022. doi: 10.1016/j.engappai.2021.104558. [Google Scholar] [CrossRef]
16. X. Chen et al., “A WOA-based optimization approach for task scheduling in cloud computing systems,” IEEE Syst. J., vol. 14, no. 3, pp. 3117–3128, 2020. doi: 10.1109/JSYST.2019.2960088. [Google Scholar] [CrossRef]
17. O. S. Egwuche, A. Singh, A. E. Ezugwu, J. Greeff, M. O. Olusanya and L. Abualigah, “Machine learning for coverage optimization in wireless sensor networks: A comprehensive review,” Ann. Oper. Res., Nov. 2023. doi: 10.1007/s10479-023-05657-z. [Google Scholar] [CrossRef]
18. N. Goyal and M. Dave, “Data aggregation algorithm to improve performance of speed routing protocol in wireless sensor network,” presented at the 2010 Int. Conf. Math. Soft Comput. (Appl. Eng.), San Francisco, USA, Oct. 20–22, 2010. [Google Scholar]
19. K. N. Goyal, “An optimal scheme for minimizing energy consumption in WSN,” Glob. Res. Dev. J. Eng., vol. 1, pp. 1–7, 2016. [Google Scholar]
20. C. Sudha, D. Suresh, and A. Nagesh, “Accurate data aggregation created by neural network and data classification processed through machine learning in wireless sensor networks,” Theor. Comput. Sci., vol. 925, no. 4, pp. 25–36, 2022. doi: 10.1016/j.tcs.2022.04.020. [Google Scholar] [CrossRef]
21. L. Li and C. Han, “ASARIMA: An adaptive harvested power prediction model for solar energy harvesting sensor networks,” Electronics, vol. 11, no. 18, pp. 2934, 2022. doi: 10.3390/electronics11182934. [Google Scholar] [CrossRef]
22. S. Mahajan, R. Harikrishnan, and K. Kotecha, “Prediction of network traffic in wireless mesh networks using hybrid deep learning model,” IEEE Access, vol. 10, pp. 7003–7015, 2022. doi: 10.1109/ACCESS.2022.3140646. [Google Scholar] [CrossRef]
23. S. Muruganandam et al., “A deep learning based feed forward artificial neural network to predict the k-barriers for intrusion detection using a wireless sensor network,” Meas.: Sens., vol. 25, no. 14, pp. 100613, 2023. doi: 10.1016/j.measen.2022.100613. [Google Scholar] [CrossRef]
24. N. Achyutha Prasad et al., “Delay optimization and energy balancing algorithm for improving network lifetime in fixed wireless sensor networks,” Phys. Commun., vol. 58, no. 8, pp. 102038, 2023. doi: 10.1016/j.phycom.2023.102038. [Google Scholar] [CrossRef]
25. G. S. Kori and M. S. Kakkasageri, “Classification and regression tree (CART) based resource allocation scheme for wireless sensor networks,” Comput. Commun., vol. 197, pp. 242–254, 2023. doi: 10.1016/j.comcom.2022.11.003. [Google Scholar] [CrossRef]
26. “Wireless sensor network data,” 2024. Accessed: Jan. 06, 2024. [Online]. Available: https://www.kaggle.com/datasets/halimedogan/wireless-sensor-network-data [Google Scholar]
27. İ. Kalaycı and T. Ercan, “Anomaly detection in wireless sensor networks data by using histogram based outlier score method,” in 2018 2nd Int. Symp. Multidiscip. Stud. Innov. Technol. (ISMSIT), 2018, pp. 1–6. doi: 10.1109/ISMSIT.2018.8567262. [Google Scholar] [CrossRef]
28. H. Guo, W. Zhang, C. Ni, Z. Cai, S. Chen and X. Huang, “Heat map visualization for electrocardiogram data analysis,” BMC Cardiovasc. Disord., vol. 20, no. 1, pp. 277, 2020. doi: 10.1186/s12872-020-01560-8 [Google Scholar] [PubMed] [CrossRef]
29. Z. Gu, “Complex heatmap visualization,” iMeta, vol. 1, no. 3, pp. e43, 2022. doi: 10.1002/imt2.43. [Google Scholar] [CrossRef]
30. T. Li, Y. Hong, D. Kong, and K. Li, “Histogram analysis of diffusion kurtosis imaging based on whole-volume images of breast lesions,” J. Magn. Reson. Imaging, vol. 51, no. 2, pp. 627–634, 2020. doi: 10.1002/jmri.26884 [Google Scholar] [PubMed] [CrossRef]
31. Y. N. Jin et al., “The role of histogram analysis in diffusion-weighted imaging in the differential diagnosis of benign and malignant breast lesions,” BMC Med. Inform. Decis. Mak., vol. 20, no. 1, pp. 239, 2020. doi: 10.1186/s12911-020-01257-0 [Google Scholar] [PubMed] [CrossRef]
32. M. A. Matheen and S. Sundar, “Histogram and entropy oriented image coding for clustered wireless multimedia sensor networks (WMSNS),” Multimed. Tools Appl., vol. 81, no. 27, pp. 38253–38276, Nov. 2022. doi: 10.1007/s11042-022-13060-2. [Google Scholar] [CrossRef]
33. G. Zhang et al., “Based on histogram analysis: ADCaqp derived from ultra-high b-value DWI could be a non-invasive specific biomarker for rectal cancer prognosis,” Sci. Rep., vol. 10, no. 1, pp. 10158, 2020. doi: 10.1038/s41598-020-67263-4 [Google Scholar] [PubMed] [CrossRef]
34. F. Banaezadeh and A. T. Haghighat, “Evaluation ARIMA modeling-based target tracking scheme in wireless sensor networks using statistical tests,” Wirel. Pers. Commun., vol. 84, no. 4, pp. 2913–2925, 2015. doi: 10.1007/s11277-015-2772-9. [Google Scholar] [CrossRef]
35. M. Gupta and A. Sinha, “Distributed temporal data prediction model for wireless sensor network,” Wirel. Pers. Commun., vol. 119, no. 4, pp. 3699–3717, 2021. doi: 10.1007/s11277-021-08427-x. [Google Scholar] [CrossRef]
36. S. Bhandari, N. Bergmann, R. Jurdak, and B. Kusy, “Time series data analysis of wireless sensor network measurements of temperature,” Sensors, vol. 17, no. 6, pp. 1221, 2017. doi: 10.3390/s17061221 [Google Scholar] [PubMed] [CrossRef]
37. E. S. El-kenawy et al., “Al-biruni earth radius (BER) metaheuristic search optimization algorithm,” Comput. Syst. Sci. Eng., vol. 45, no. 2, pp. 1917–1934, 2022. doi: 10.32604/csse.2023.032497. [Google Scholar] [CrossRef]
38. C. Bertinetto, J. Engel, and J. Jansen, “ANOVA simultaneous component analysis: A tutorial review,” Anal. Chim. Acta X, vol. 6, no. 8, pp. 100061, 2020. doi: 10.1016/j.acax.2020.100061 [Google Scholar] [PubMed] [CrossRef]
Cite This Article
 Copyright © 2024 The Author(s). Published by Tech Science Press.
This work is licensed under a Creative Commons Attribution 4.0 International License , which permits unrestricted use, distribution, and reproduction in any medium, provided the original work is properly cited.
 Downloads
 Citation Tools