
 Submit a Paper
 Propose a Special lssue
 Open Access
ARTICLE

Developing a Model for Parkinson’s Disease Detection Using Machine Learning Algorithms
Department of Computer Science, College of Computer Science and Information System, Najran University, Najran, 55461, Saudi Arabia
* Corresponding Author: Naif Al Mudawi. Email:
Computers, Materials & Continua 2024, 79(3), 4945-4962. https://doi.org/10.32604/cmc.2024.048967
Received 23 December 2023; Accepted 22 April 2024; Issue published 20 June 2024
 View Full Text
 Download PDF
Abstract
Parkinson’s disease (PD) is a chronic neurological condition that progresses over time. People start to have trouble speaking, writing, walking, or performing other basic skills as dopamine-generating neurons in some brain regions are injured or die. The patient’s symptoms become more severe due to the worsening of their signs over time. In this study, we applied state-of-the-art machine learning algorithms to diagnose Parkinson’s disease and identify related risk factors. The research worked on the publicly available dataset on PD, and the dataset consists of a set of significant characteristics of PD. We aim to apply soft computing techniques and provide an effective solution for medical professionals to diagnose PD accurately. This research methodology involves developing a model using a machine learning algorithm. In the model selection, eight different machine learning techniques were adopted: Namely, Random Forest (RF), Decision Tree (DT), Support Vector Machine (SVM), Naïve Bayes (NB), Light Gradient Boosting Machine (LightGBM), K-Nearest Neighbours (KNN), Extreme Gradient Boosting (XGBoost), and Logistic Regression (LR). Subsequently, the concentrated models were validated through 10-fold Cross-Validation and Receiver Operating Characteristic (ROC)—Area Under the Curve (AUC). In addition, GridSearchCV was utilised to measure each algorithm’s best parameter; eventually, the models were trained through the hyperparameter tuning approach. With 98% accuracy, LightGBM had the highest accuracy in this study. RF, KNN, and SVM came in second with 96% accuracy. Furthermore, the performance scores of NB and LR were recorded to be 76% and 83%, respectively. It is to be mentioned that after applying 10-fold cross-validation, the average performance score of LightGBM accounted for 93%. At the same time, the percentage of ROC-AUC appeared at 0.92, which indicates that this LightGBM model reached a satisfactory level. Finally, we extracted meaningful insights and figured out potential gaps on top of PD. By extracting meaningful insights and identifying potential gaps, our study contributes to the significance and impact of PD research. The application of advanced machine learning algorithms holds promise in accurately diagnosing PD and shedding light on crucial aspects of the disease. This research has the potential to enhance the understanding and management of PD, ultimately improving the lives of individuals affected by this condition.Keywords
As human beings, we must go through various complexities that cannot be seen most closely. Many diseases can afflict a person, and the majority of them are either genetic or occur naturally. The brain disorder is one of the most adverse drawbacks, and the phenomenon is becoming increasingly severe in many nations. PD is a neurological infection, a type of brain disorder, and much discussion has been revolving around the difficulties. The PD symptoms appear slowly at first, with only a minor tremor in one hand. Tremors are rather typical; however, they usually stiffen or slow down as time passes [1]. Although most people develop PD at about age 60, a few people start this disorder before 50 years. Moreover, PD turns out when our basal ganglia nerve cells are injured or blocked [2]. In contrast, it is worth pointing out that these significant nerve cells produce a vital neurotransmitter called Dopamine. Since Dopamine interacts with our body with nerve cells, it plays a crucial role in our lives, but less Dopamine is made when a neuron stops moving. In this case, scientists are challenged and unaware of what triggers the death of dopamine-producing cells [3]. In a first-world country like the United States, nearly 1 million people experience PD, with around 60,000 new patients identified yearly [4]. According to a recent study, the death rate from PD has increased by 63% in the US over the last two decades [5]. Moreover, PD has grown comparatively in the United States over the past decade, so its transmission to Third World countries is likely to spread in the coming days. There is not much support in underdeveloped countries as there is medical support in the developed world, and the solution to any disease is easily found.
Presently, a vast amount of data is being recorded in the healthcare sector, but without skilled human resources or powerful technology, proper utilization cannot be done accordingly. There are many insights into clinical data, and it is possible to hope for a new disease pattern or solution by analyzing those insights. As the number of PD increases every day, its accumulation in the healthcare sector is becoming increasingly challenging to diagnose as powerful tools have not been developed yet, and manual analysis is time-consuming. This, in turn, brings us to a big question: “What new steps can we take to mitigate this issue?” In recent years, machine learning (ML) and deep learning (DL) have been widely used in the healthcare sector to detect PD.
There is a lot of potential for DL and ML-based strategies in healthcare to uncover hidden patterns in many clinical data for diagnosing different diseases [6]. By analyzing patients’ medical histories, symptoms, and tests, deep-learning solutions enable healthcare organizations to provide personalized patient care [7,8]. With the advancement of cutting-edge technology, many individuals and organizations are applying various techniques of ML and DL to measure a vast amount of data in terms of extracting significant patterns. ML-based techniques enable us to create models that incorporate a variety of variables with a disease. To better diagnose neural designer diseases, data science and ML platforms integrate several data types into a single model. Therefore, a well-developed prognosis model can alleviate the healthcare sector’s shortcomings. In this study, the following objectives have been addressed:
• Diagnosis of PD risk factors using a LightGBM model and the development of ML technique leveraging medical information to achieve rapid and promising accuracy.
• Creating a robust model through parameter tuning and validation will be widely used for PD diagnosis in clinical aspects.
• Raise public awareness through research so that people can be aware of Parkinson’s disease.
The sections of this study are interrelated. In Section 2, the review of the literature, we have examined the existing literature. In Section 3 of the research process, the system architecture is proposed. In Section 4, entitled Result, we discuss the results and the pertinent comparison. In Section 5 of the study, future work is discussed.
This section presents the background of the related work associated with our proposed methodology and working principles. By combining a Bayesian network optimized using the Tabu search algorithm with a projection filter in the form of Haar wavelets, Mandal et al. [9] were able to develop a novel ensemble technique for selecting and ranking features. The accuracy of linear logistic regression is one hundred percent, whereas the sensitivity and the range of specificity of sparse multinomial logistic regression were between 0.978% and 0.995%. Using the Voice input dataset from the UCI machine learning library, Pahuja et al. [10] determined that the best classifier was ANN with the Levenberg–Marquardt algorithm (95.89%). Despite this, the method had substantial computational expenses. The dataset must be clean and large enough for machine learning to be effective. In addition, due to the intricacy of the issue, there are few clean datasets available.
Wang et al. [11] demonstrated that deep learning outperforms the twelve analyzed machine learning models in differentiating between average individuals and Parkinson’s sufferers. Additionally, the boosting strategy has comparable performance. Boosting approaches have improved accuracy, although the rate remains at 96.2%. If we can structure the method using a computer-assisted system or machine learning, it will be more efficient and accurate.
Using incremental support vector machines (ISVMs), Nilashi et al. [12] devised a novel method for the unified Parkinson’s disease rating scale (UPDRS) prediction. Using incremental SVM, the Total-UPDRS and Motor-UPDRS are predicted. The experimental results demonstrate that the proposed method accurately predicts UPDRS. In healthcare, the technique could be used to predict PD. Although they end their investigation by gathering datasets, no automated detection method can identify man-to-man advancement without collecting enormous datasets of vast people and contemporary technological use.
Research by Prashantha et al. [13] distinguishes early PD patients from healthy controls. They employed the classifiers Naïve Bayes, Support SVM, Boosted Trees, and Random Forests. It was discovered that the SVM classifier had the most impressive performance (AUC of 98.88% and accuracy of 96.40%). According to Almeida et al. [14], PD could be detected utilizing cell phones. Phonation (P) audio outperformed Voiced (V) and Unvoiced (U) audio (U). In the event of unbalanced datasets, this issue must be handled using cross-validation. In addition, it is required to evaluate and optimize the various feature sets to eliminate characteristics that do not aid in the diagnosis of Parkinson’s disease. Senturk [15] proposed a Parkinson’s disease diagnosis based on machine learning. Less vocal Parkinson’s diagnostic features were 93.84 percent correct. Nevertheless, the SVM algorithm may rapidly diagnose the condition, albeit with less than 95% accuracy. It is required to use a computer-aided system to achieve more accurate findings so that the accuracy rate can reach 98/99%.
Wroge et al. [16] demonstrated the reliability of patient diagnosis using supervised classification approaches, such as deep neural networks. With pathological post-mortem testing as the gold standard, the maximum accuracy of their proposed machine learning models is 85 percent. The accuracy of each study is an evaluation of the overall number of instances correctly detected, regardless of whether they are positive or negative, or it is a measurement of the actual effectiveness of a technique in any circumstance. Researchers have made significant contributions by utilizing advanced machine learning algorithms to diagnose PD and identify relevant risk factors by comparing previous studies with this study. The novelty of their research lies in applying soft computing techniques for accurate PD diagnosis.
As the previous summary of the research shows, there have been many studies done on how to find Parkinson’s disease. Still, only a small amount of research is conducted employing cutting-edge machine learning techniques. Notably, crucial approaches such as cross-validation and model validation were underutilized in the prior work; we have addressed these deficiencies and adopted the light gradient boosting machine algorithm (LightGBM) to accelerate the diagnosis. This research aims to find the best method for the diagnosis of risk variables by using a lightweight model (LightGBM). Our primary purpose is to create a system with the most accurate and progressive results, therefore we have opted to incorporate it.
Despite the paucity of published work and the novelty of employing machine learning for Parkinson’s disease prognosis, we are considering including a revolutionary algorithm that will enable rapid analysis and result prediction. This study therefore examined LightGBM, RF, SVM, DT, NB, GB, XGBoost, and KNN. Our priority is to use LightGBM as the primary system classifier, and we have double-checked the results with the other model. LightGBM, a gradient boosting framework based on tree-based learning methods, has been brought to our attention. It is a high-performance gradient boosting approach that may be applied to several ML applications, including ranking, classification, and prediction. Extreme Gradient Boosting (XGBoosting) is more accurate than other decision tree gradient boosting models, such as Extreme Gradient Boosting (XGBoosting), and it can process enormous volumes of data. LightGBM is an open-source software that efficiently and effectively implements the gradient boosting algorithm [17].
Light GBM augments the gradient boosting technique with an algorithmic feature selection that emphasizes boosting situations with higher significant gradients. As a result, training improves and accelerates prediction performance. By downsampling data and characteristics, LightGBM reduces complexity. The loss is optimized by the algorithm’s branch-generating leaf-wise growth of the decision tree. As a result, this method increases the tree’s depth more quickly and efficiently than level-wise development. In addition to quicker training speeds, higher performance, and the capacity to manage vast volumes of data, reference [18] also offered lower memory consumption and more accuracy for parallel and GPU learning. In computing the benefit of variance, LightGBM differs from earlier Gradient Boosting Decision Tree (GBDT) models; this distinction has been presented analytically. The authors presents a novel approach to diagnose and classify Parkinson’s disease (PD) using ensemble learning and a deep learning technique called 1D-PDCovNN. The study aims to develop a robust method for the early detection and accurate classification of PD using EEG signals. The San Diego Resting State EEG dataset is used to evaluate the proposed method, which consists of three main stages [19]. This study focuses on the development of a wearable multisource gait monitoring system for the quantitative analysis of gait abnormalities in Parkinson’s disease (PD). The complexity of motor symptoms in PD makes it challenging to accurately assess gait abnormalities using a single type of signal. Therefore, the researchers integrate force-sensitive sensors, piezoelectric sensors, and inertial measurement units into a device to detect multisource gait data and improve clinical diagnosis effectiveness [20].
Because of this, the SVM includes a crucial method known as a kernel, and we can perform any difficult problem by using the appropriate or specific kernel function. The SVM Algorithm, on the other hand, is not overly sensitive to extreme data points which reduces the likelihood of bias in the final results. When there are outlying data points, the Mean no longer represents the data set as a whole. Therefore, SVM is superior since it reduces the impact of outliers among the data points. Finally, Random Forest (RF) is an Ensemble Learning method that relies on bagging. It constructs as many tree structures as possible on a sample of the data and then averages their results. Thus, decision trees benefit from less overfitting and variation.
This section presents the overall methodology of the proposed solution. Fig. 1 shows the key idea of the proposed method as well as the graphical illustration. In this figure, the collection of the data is accomplished from the infected person with Parkinson’s disease. Then, data preprocessing has been applied to the collected data to feed the Machine Learning (ML) models accordingly. After finding the obtained results from the ML models, any patient can be able to know about the prediction of Parkinson’s disease.
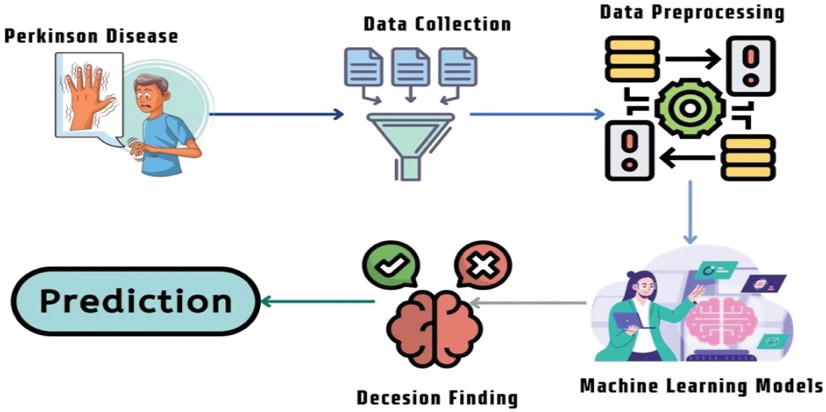
Figure 1: Summary of the machine learning algorithms
The methodology of this proposed research has been divided into several phases: Data Collection and Cleaning, Model Selection, and Model Evaluation. The first step involved cleaning and preprocessing the research dataset using data normalization, transformation, categorical encoding, and attribute selection, among other methods. Following this step, the model was trained and verified using a variety of model evaluation indicators such as K-fold-cross-validation, Receiver Operating Characteristic (ROC)—Area Under the ROC Curve (AUC), and Confusion Matrix. Eventually, the classifier was developed to predict Parkinson’s disease.
Fig. 2 shows flow diagram of the proposed methodology. In this figure, the initial step is data collection, and the dataset was collected and pre-processed. The accepted data was converted to the correct form in the second stage using categorical encoding. In the third and last stage of the process, the model was trained using a supervised machine learning model, and then the model validation indicator was used to determine which model was the most accurate.
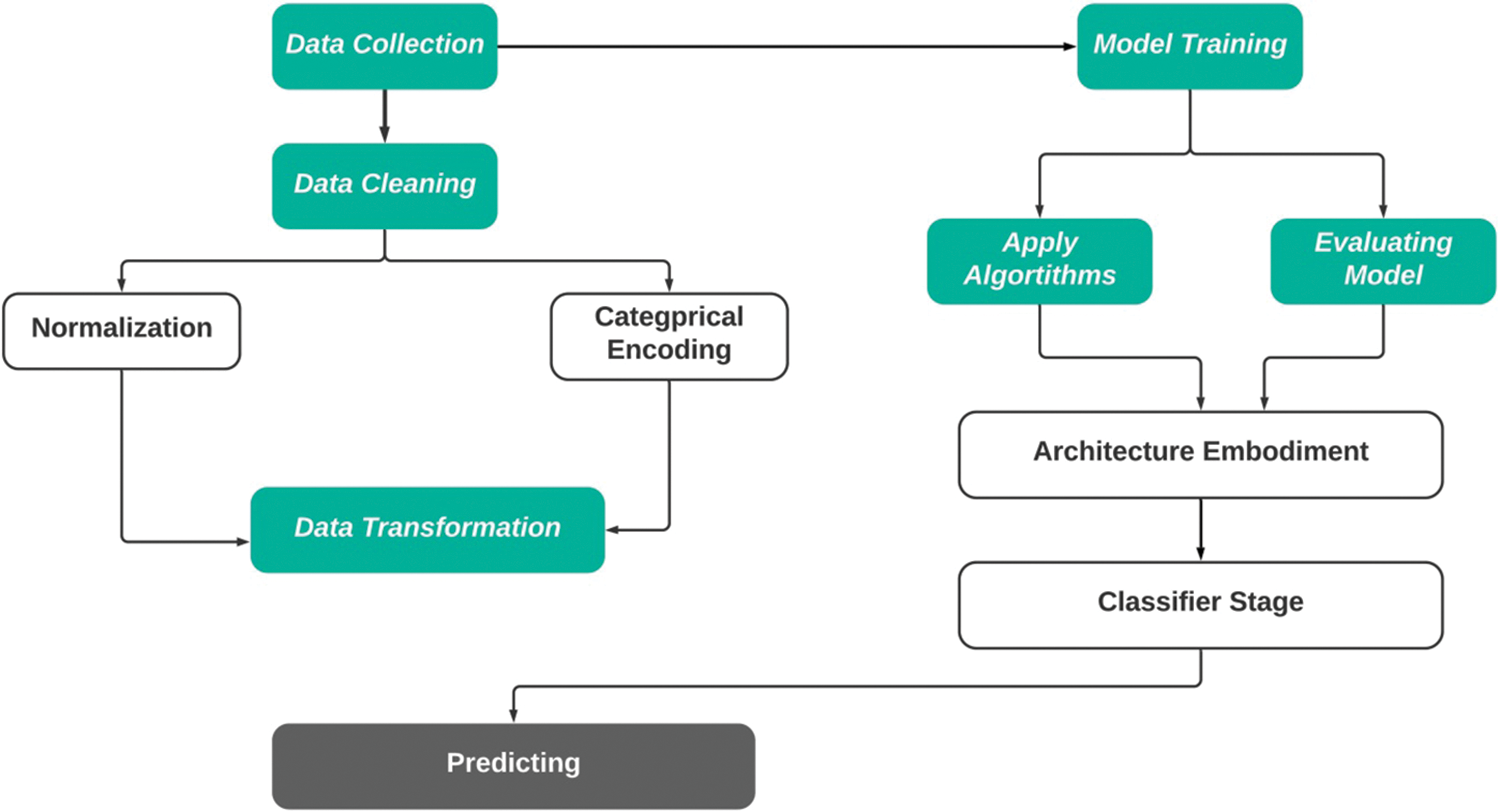
Figure 2: Architectural design to predict Parkinson’s disease
3.1 Dataset and Data Preparation
This dataset includes the biological measurements of 531 people, including 223 with Parkinson’s disease (PD) [21]. Each table column represents a different voice measure, and each row shows one of the 195 voice recordings produced by these individuals. In the stage of data collection, we have considered a set of parameters such as sex, age, stage (H&Y), years since diagnosis, etc. We have also considered the history of the disease and the previous feedback on PD. In the initial stage of the data collection, it was organized in an unorganized way, and we prepared the data using preprocessing techniques.
Data Preparation is crucial in integrating with the machine learning paradigm while data is usually collected online; moreover, an inconsistency called noise or missing values has various adverse effects while executing machine learning [22]. Thus, cleaning the dataset effectively and figuring out the unwanted variables is essential to make a model faster and more efficient. Raw data is insufficient and cannot be incorporated into a model, so it has been modified. Regarding the information in the dataset, the features were investigated from a statistical and a semantic standpoint. Furthermore, the preprocessed dataset was subjected to categorical data encoding and the Data Transformation procedure. The research found the raw data from the dataset to have noise and missing values. Also, some of the columns contain NaN values. Thus, the research applied mean value interpolation to fill in the missing values in order to make a more robust model for PD diagnosis. Further, the model applied the LabelConding() method to encode labels to find the highest results from the classifiers.
This research applied and evaluated eight machine learning algorithms to detect Parkinson’s disease. To illustrate, Decision Tree Classifier, Random Forest Classifier, Logistic Regression, Support Vector Machine Classifier, Naïve Bayes Classifier, K-Nearest Neighbor Classifier, XGBoost Classifier, and Light Gradient Boosting Machine (LightGBM). It is to be mentioned that the physicians or doctors utilize a risk assessment calculator to measure the probability of medical diseases. This is to say that the approach takes some parameters to forecast the disease, such as demographic variables, medical conditions, and other supporting essential data. The complexity here is that a similar equation-based approach has a lower efficacy. Turning into cutting-edge technology, the machine learning algorithms have appeared with satisfactory performance and accurate prognosis of the clinical disorder. Therefore, the mentioned models were considered for this research work. In the following section, we have interpreted the mathematical explanations of the algorithms used in this research, and it is to be said that out of all the algorithms, the performance of LightGBM, Support Vector Machine, and Random Forest are found to be the highest.
3.3 The Light Gradient Boosting Machine (LightGBM)
For shifting a function, for instance, from the process space X to the gradient space G, we use the concept [23] of verdict trees.
GOSS makes advantage of every instance that has more significant, while the numerous occurrences that have less significant are sampled at random. The notation O denotes the training dataset for each decision tree node. The dividing measure at node location d, or the variance gain of j, is given by:
Here,
The Gradient Boosting (GB) is mainly based on the conventional ensemble learning method. The GB uses loss optimization techniques. For regression-type issues, the gradient boosting approach performs reasonably well. The following Eqs. (4)–(9) are shown as the working procedure of the gradient mathematically boosting algorithm [24].
Reconfigure the function estimate with a constant value:
For each iteration
Compute pseudo-residuals
Here in this equation inclusion latest function
Determine the optimal coefficient ρt at gt(x) about the initial loss function
Improve current approximation
When the elementary constant and all subsequent function updates are incorporated, the resulting GBM model will be complete. Finally, the following equation will be:
3.5 Support Vector Machine (SVM)
The kernel converts the lower-dimensional data into higher dimensions [24]. The following equations are used for the case of SVM (10) and (11):
From the Eq. (10),
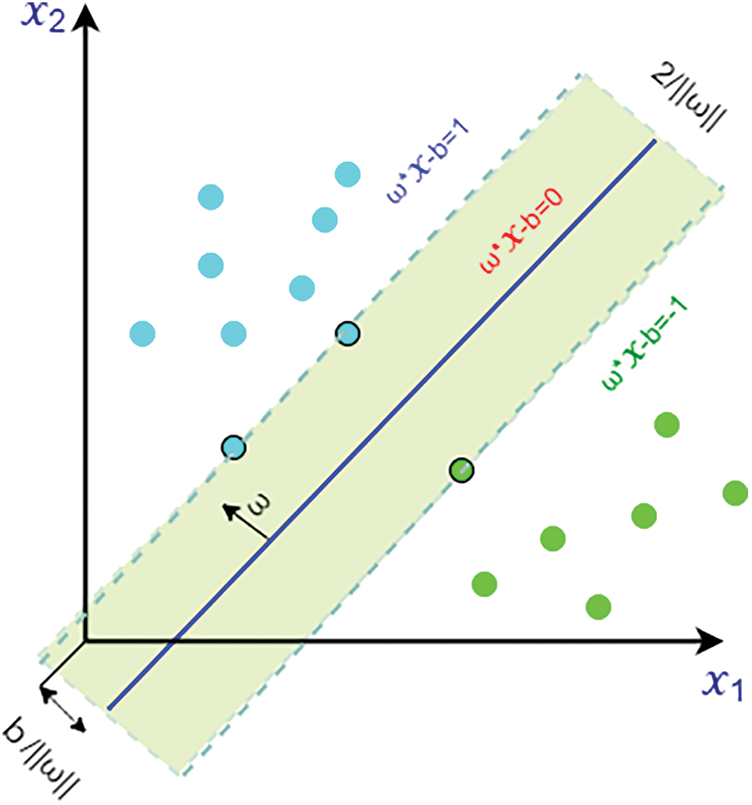
Figure 3: Margin maximization in hyperplanes and the support vector machine with data from two classes
As a result, we can represent the width or data classification can be margin by two hyperplanes as:
Radial Basis Function (RBF) Kernel Support Vector Machine (SVM): Both linear and nonlinear data work effectively with Support Vector Machine. The kernel function is essential in placing data into the function space. In many circumstances, when we plot more than one variable in a typical scatter plot, the plot is unable to distinguish between two or more data classes. The RBF is a type of nonlinear function as well. With this support vector machine’s most often practiced function kernel, any input may be mapped to infinite-dimensional space.
The Radial basis function (RBF) kernel refers to a Gaussian function. This equation gives the following:
We get a new function by applying Eqs. (9) in (10), where N represents the trained data.
In this research, we have ensured various technical contributions. As stated above, seven different machine learning algorithms were adopted in this manuscript for the case of Parkinson’s disease prognosis. Throughout the experimental exploration, the overfitting issues were resolved accordingly. Overfitting is a data modeling problem when a function aligns itself too closely with a few data points. A data model can also be under-fitted, which means that it is too simplistic and contains too few data points to be useful. Systems developed from a clinical point of view should be properly evaluated and not considered robust systems unless bias or other issues are filtered out of the model. GridSearchCv, a library function in the sklearn model selection package, is applied. Looping over specified hyperparameters assists in fitting an estimator (model) to a training set. Conclusively, the best hyperparameters can be chosen from the list of hyperparameters. By applying this technique to the decision tree, we get the best parameters like, ‘criterion’: ‘entropy’, ‘max_depth’: 6, ‘max_features’: ‘auto’, ‘random_state’: 120. Similarly, for the case of Random Forest, we have received the optimal parameters like, {‘criterion’: ‘entropy’, ‘max_depth’: 7, ‘max_features’: ‘auto’, ‘n_estimators’: 125, ‘random_state’: 200}. Turning into the SVM, we have obtained the optimal parameters such as {‘C’: 100, ‘gamma’: 1, ‘kernel’: ‘rbf’}. Lastly, the essential parameters were found on top of the XGBoost classifier.
Consequently, we have handled the computational complexity of each model and achieved the role of a robust system by making them faster. Apart from these, we have adopted LightGBM algorithms with proper hyperparameter tuning and cross-validation tenfold. To the best of our knowledge, no one has yet applied this algorithm to predict Parkinson’s disease, even though this technique has various advantages that can be discovered for predicting Type-2 diabetes. Based on this observation, this algorithm was adopted and achieved promising results accuracy [25].
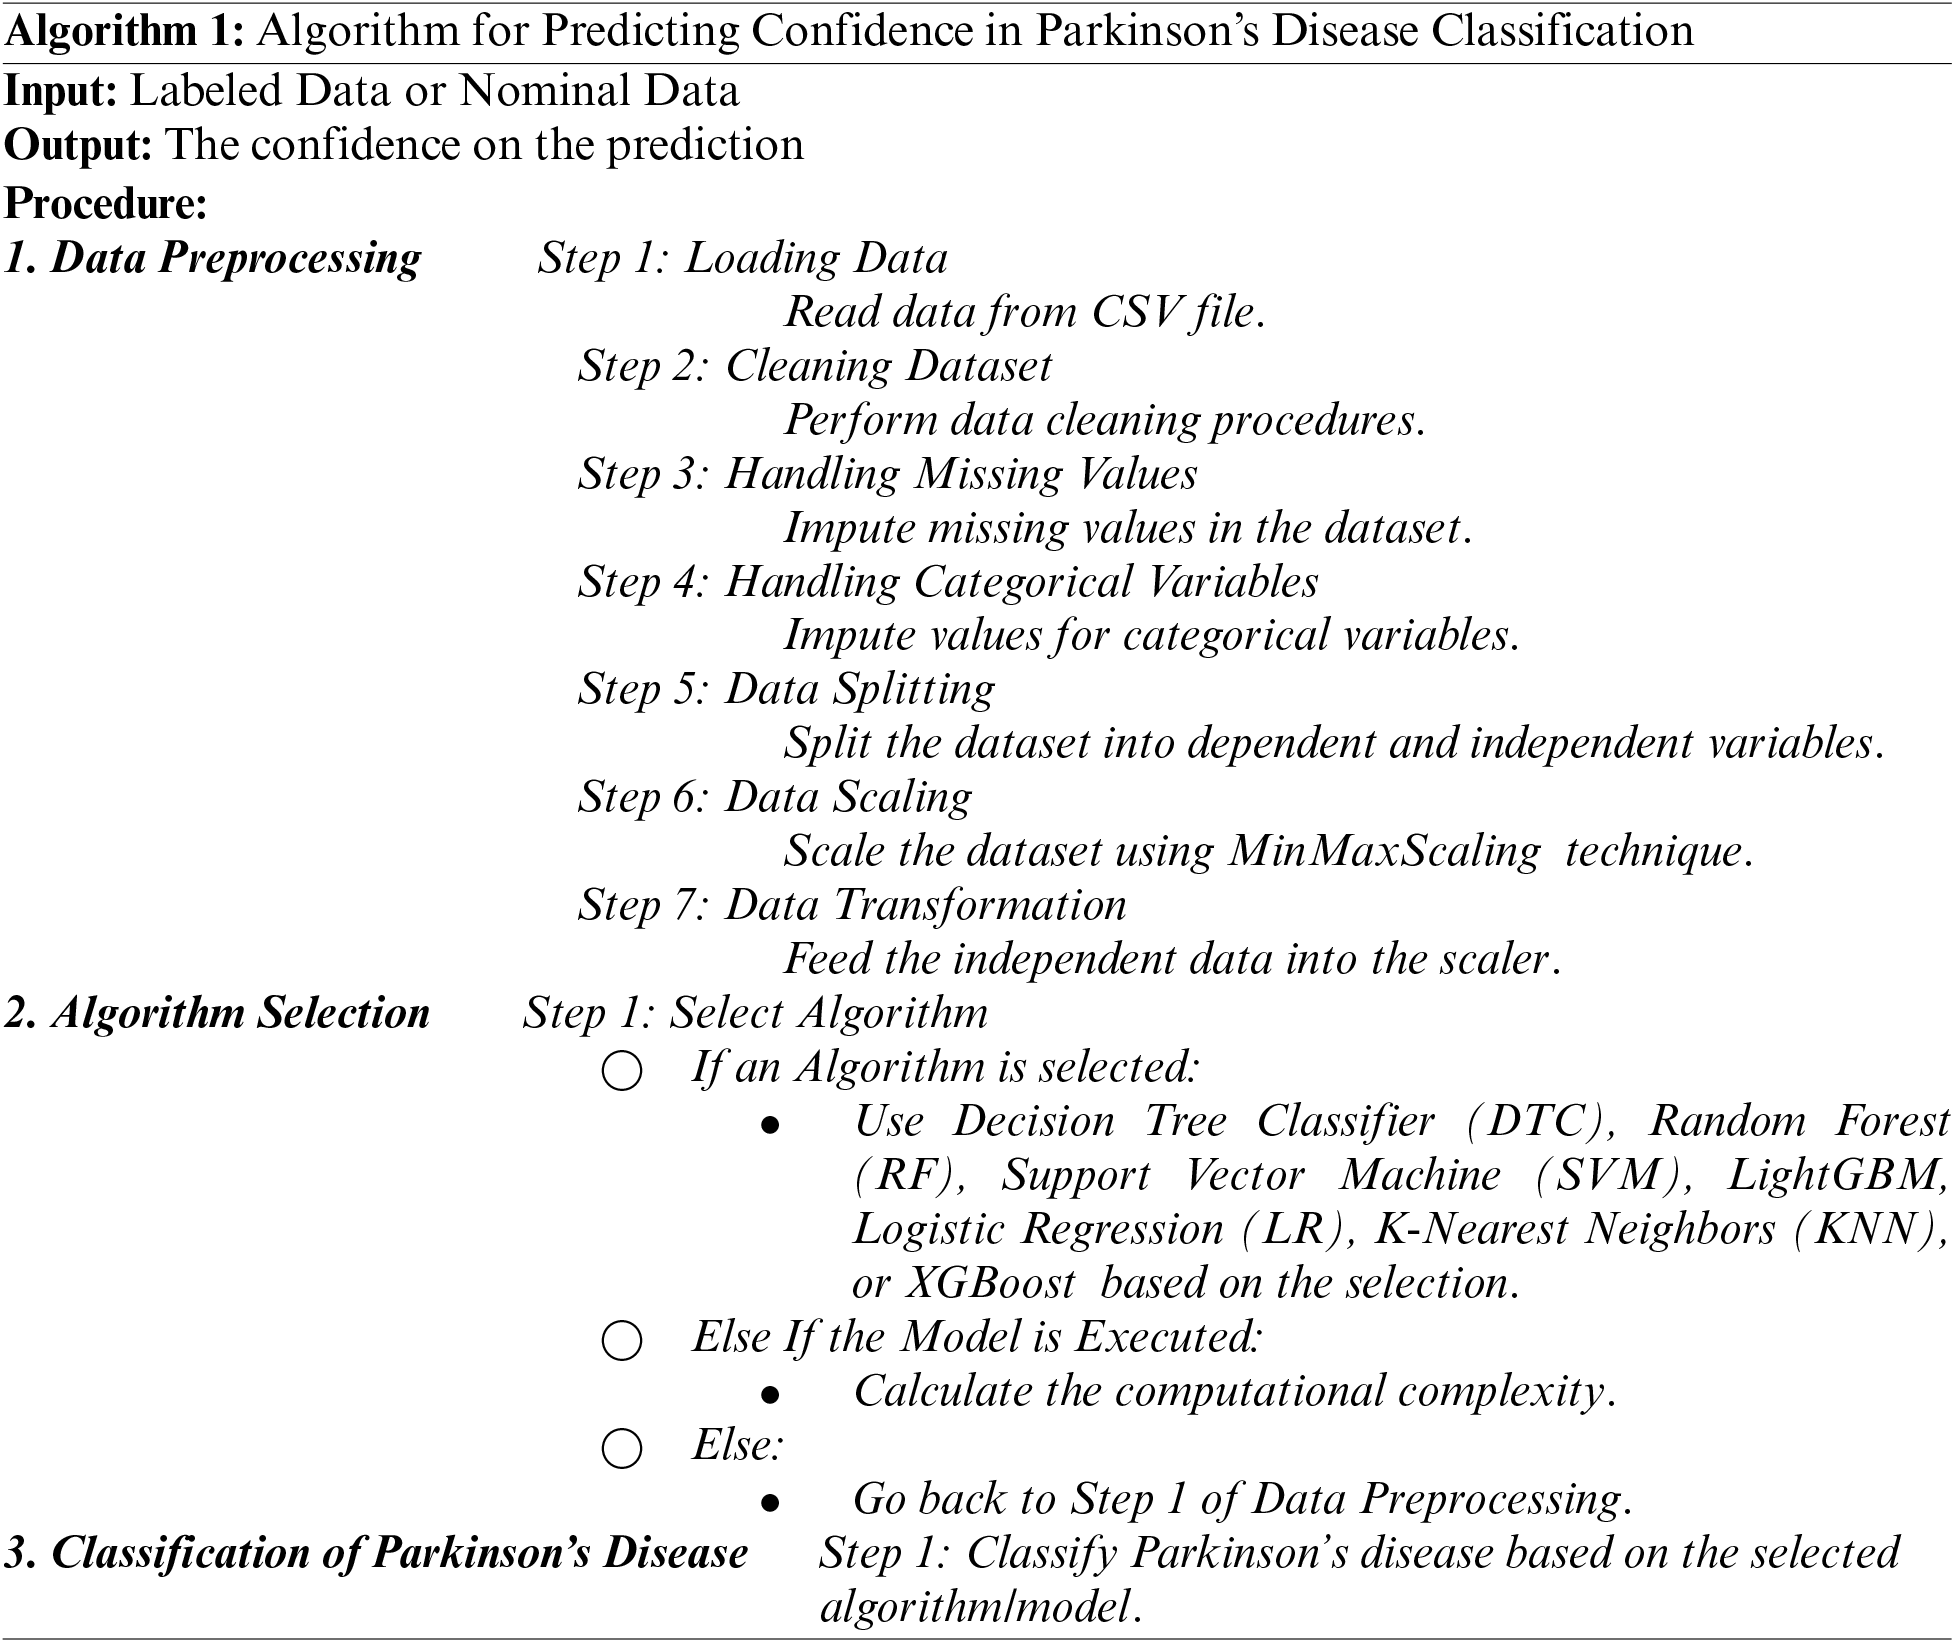
This section show have created algorithm (Algorithm 1) that used for classifying and analyzing Parkinson’s disease. There are several advantages to designing algorithm. For starters, it can be rapidly and readily transformed into a programming language similar to a programming language. Second, it is rather simple to grasp, especially for non-programmers. Fig. 4 shows the flowchart of the proposed ML pipeline.
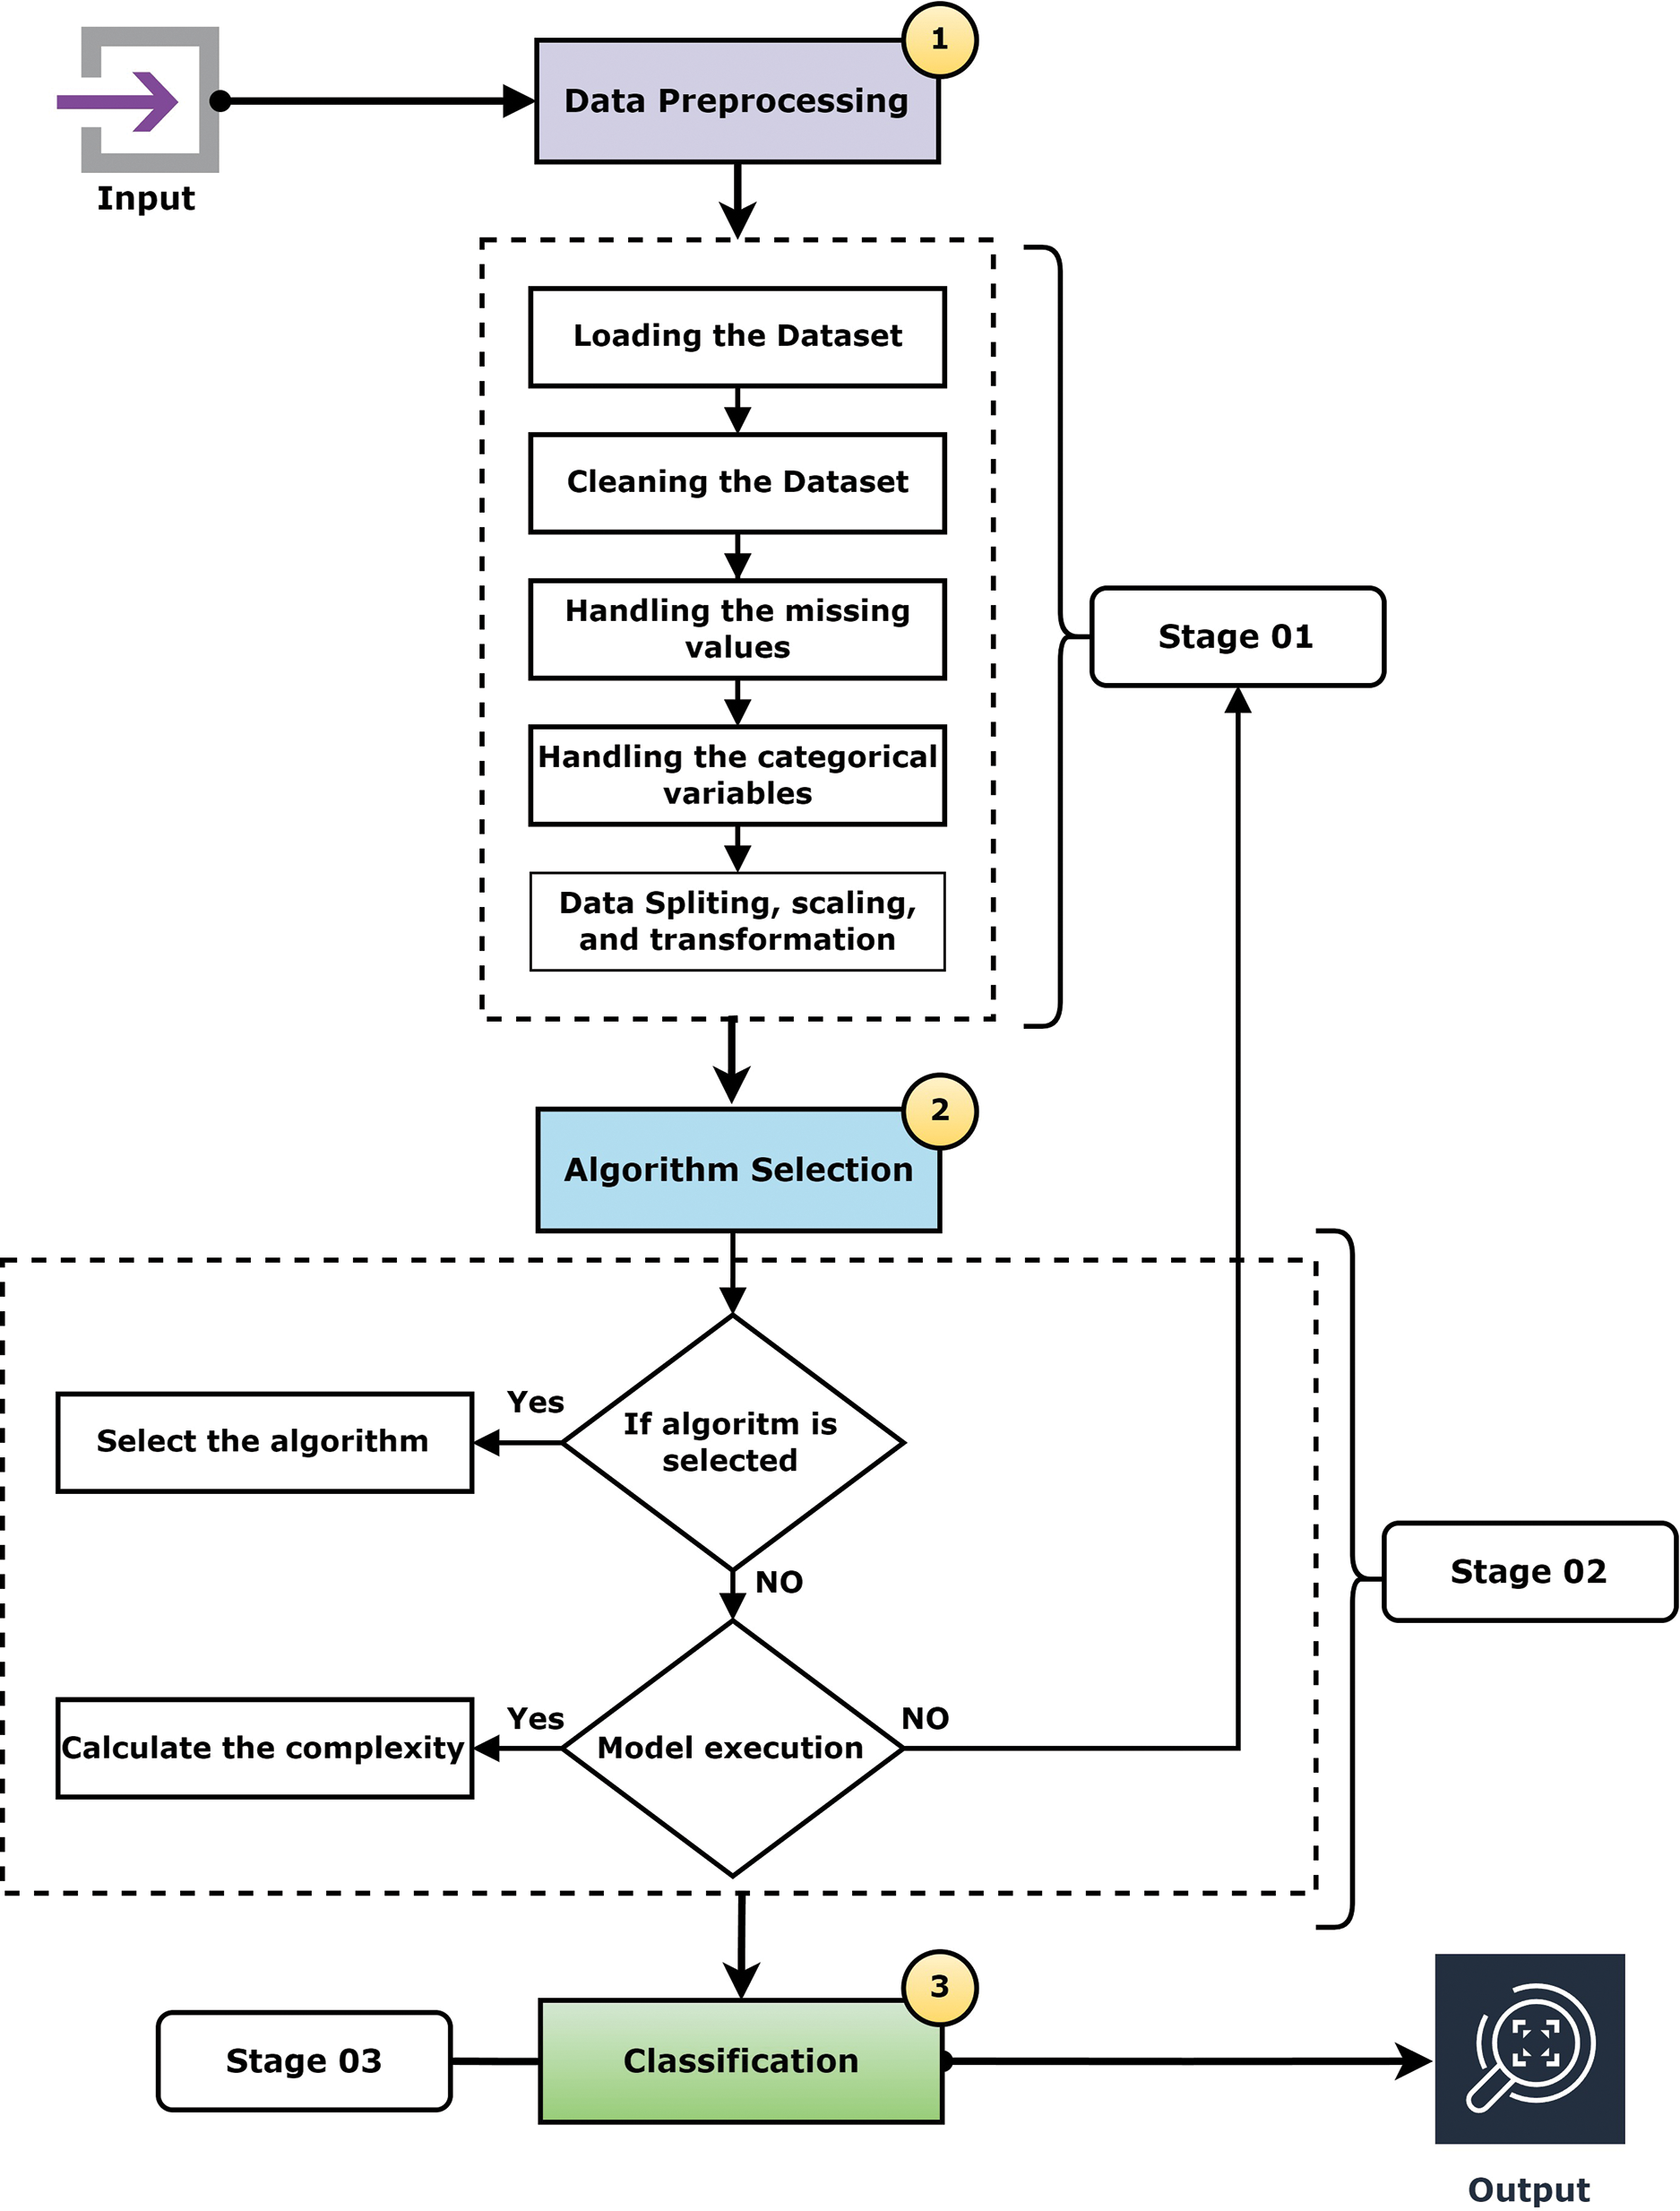
Figure 4: Flowchart of the ML pipeline
Using a classification report, we may assess the precision of the classification algorithms and find the confidence on the prediction. In this research, a set of key classification parameters including as precision, recall, and F1-score are presented on a class-by-class basis. These metrics are calculated by performing training with varying numbers of true positives, false positives, and false negatives.
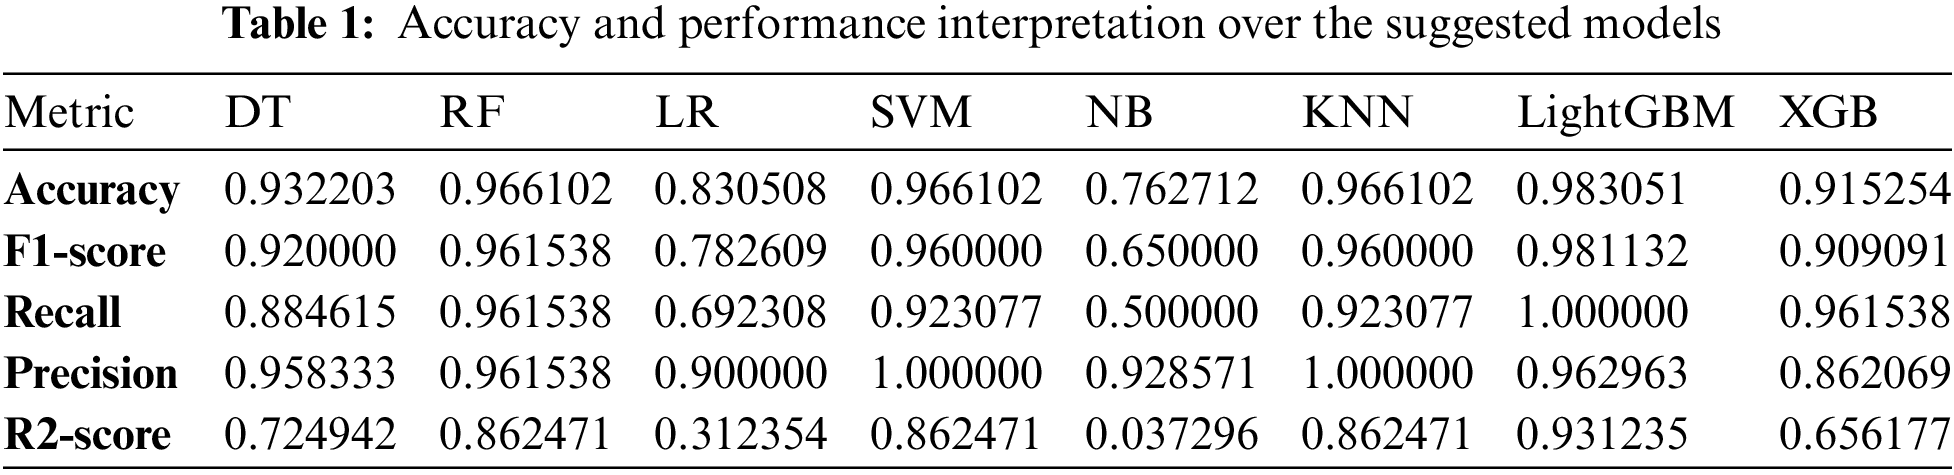
Table 1 describes these traditional machine learning algorithms’ classification reports for predicting Parkinson’s disease. The following Eqs. (15)–(18) were considered for finding precision, recall, and the F1-score are all essential factors to consider.
Precision: The ratio of the true positive estimate produced by the model to the overall positive estimate (correct and wrong). It is articulated as:
Recall/Sensitivity: The ratio of being able to predict as positive. In mathematical form, it is given as:
F1-score: It offers a better approximation than the Accuracy Metric of incorrectly categorized cases.
Accuracy: This is indicating the significant amount of true positive rate. It is stated as:
As shown in Table 1, it can be observed that the accuracy of LightGBM was the highest with 98% of accuracy among the other traditional machine learning models. At the same time, the accuracy of XGB was lowest at 91%, which indicates that even though the boosting technique is reasonably well when it comes to the disease data, the satisfactory accuracy was turned down. Also, we have provided another table in Table 2 where the sensitivity and specificity of the suggested models are depicted. Further, we have illustrated two comparison graphs in order to visualize the highest performance with the performance evaluation matrices. Fig. 5 shows the corresponding bar chart for the comparisons.
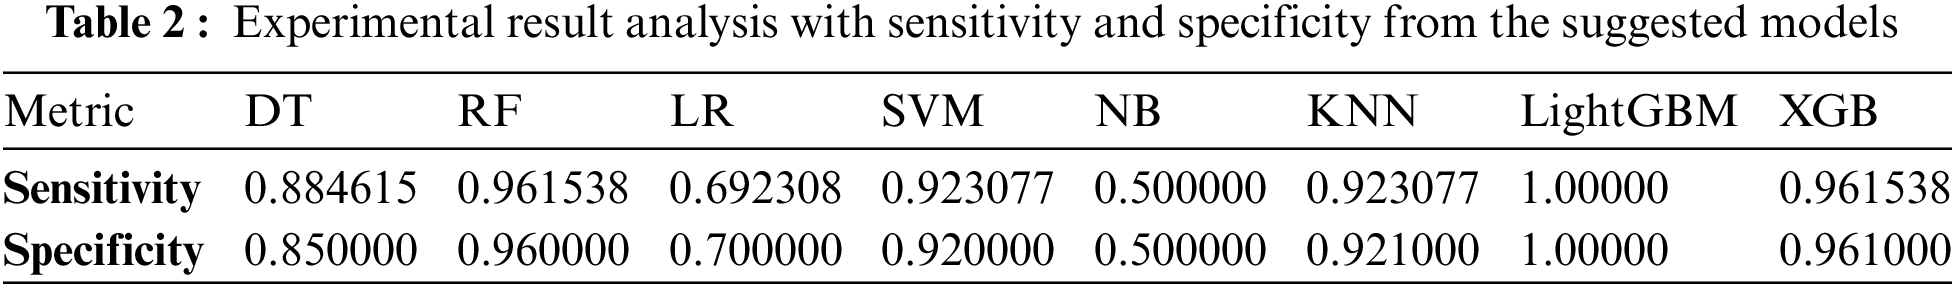
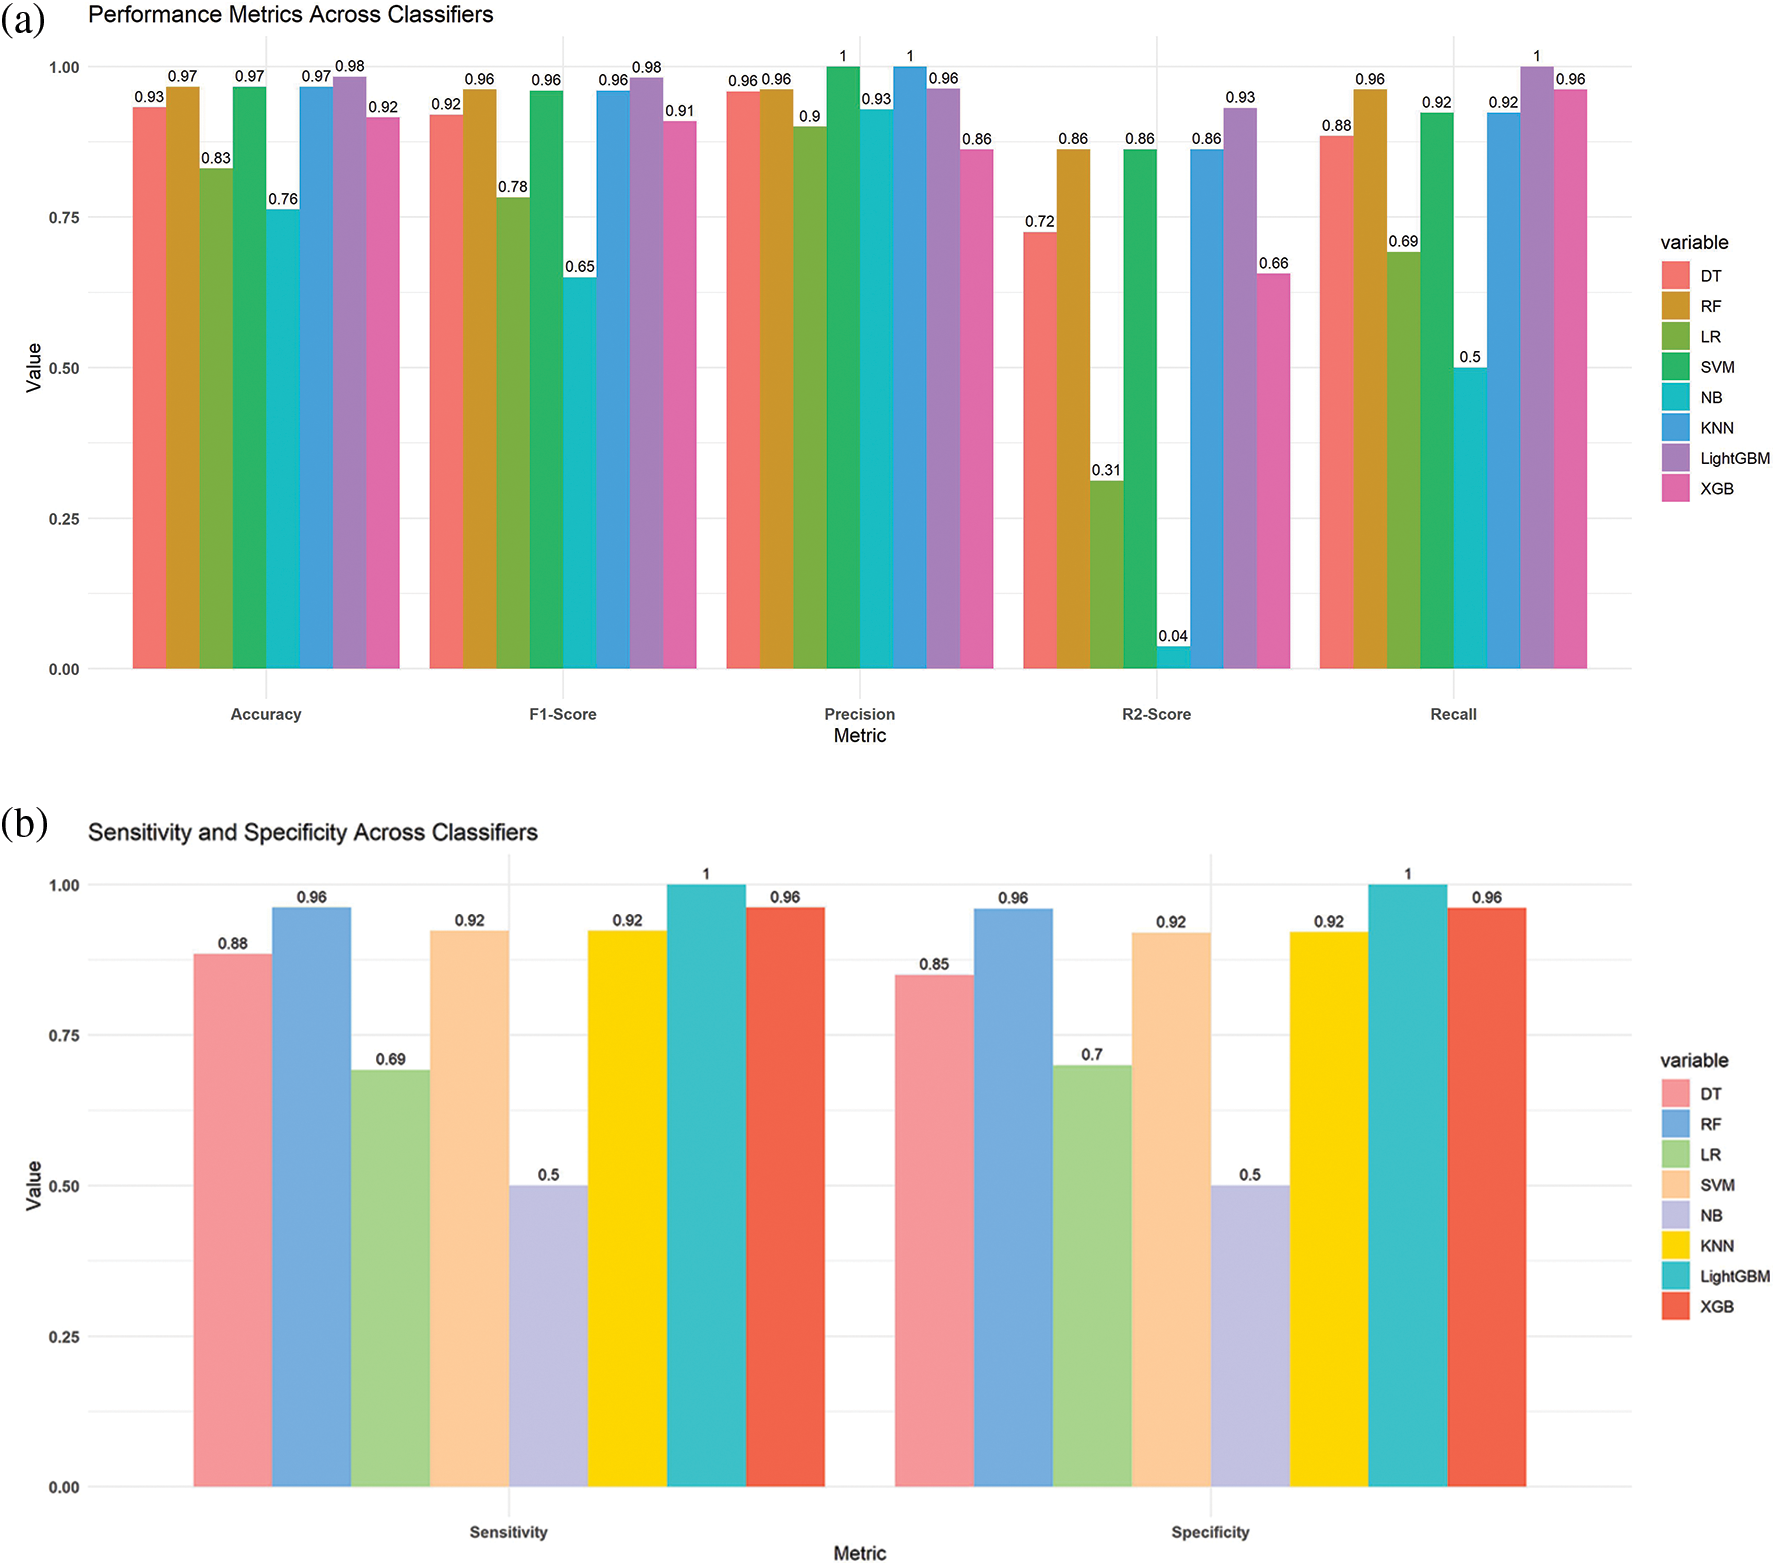
Figure 5: Comparison of the different models (a) bar chart of the best results from the suggested models (b) bar chart of the sensitivity and specificity from the suggested classifiers
We partition a dataset into five subsets with the same number of records. These subdivisions are known as folds. Consequently, our dataset was divided into five equal folds. K indicates the number of folds. The ROC curve is an estimation measure for binary classification problems. It is a probability curve that compares the TPR to the FPR at various threshold values, separating signal from noise. Ultimately, a confusion matrix is a means to summarize the findings of a classification system. False Positive (FP) mistakes in the Confusion Matrix are known as Type-1 errors, whereas False Negative (FN) errors are known as Type-2 errors. The expected value for Type-1 was incorrectly predicted, as the actual value was negative, but the model’s prediction was positive. The projected value for Type-2 was miscalculated, as the actual value was positive whereas the model expected a negative value as shown in Fig. 5. Figs. 6, 7 illustrate the model validation report applying the ROC-AUC curve and confusion matrix. Fig. 6 indicates the ROC-AUC curve applied on top of the LightGBM model and it is noticeable that the AUC was around 1, which specifies that the model is accepted and can be utilized in real-life. On the other hand, Figs. 7a and 7b visualize the LightGBM’s confusion matrix, including the amount of sensitivity and specificity.
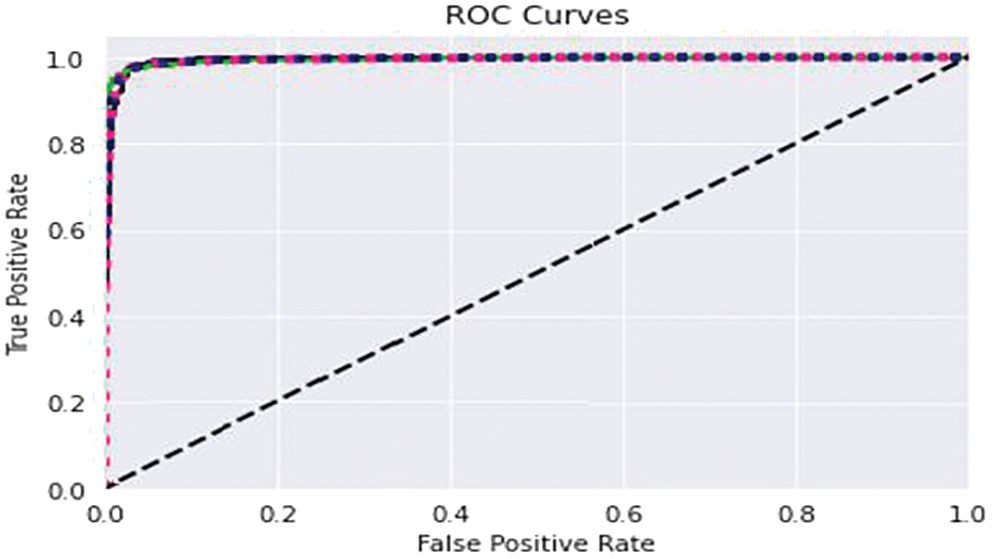
Figure 6: Model assessment report using ROC-AUC validation curve
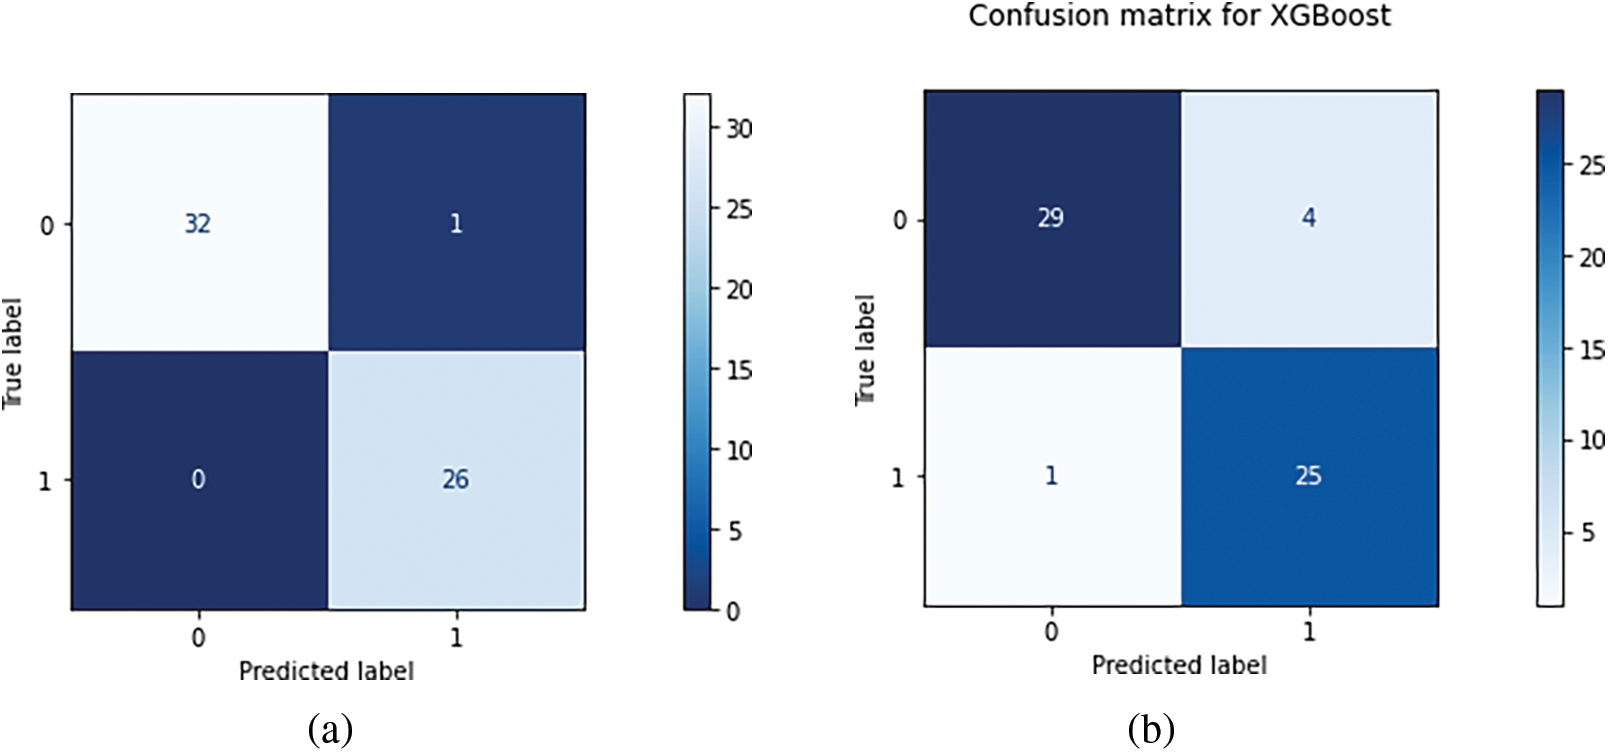
Figure 7: (a) Visualizing the LightGBM’s confusion matrix, including the amount of sensitivity and specificity (b) Illustrating the XGB’s confusion matrix with the total amount of true and false prediction rates
This section will discuss the potential findings extracted through an extensive exploration on top of Parkinson’s disease. It is noticeable that various algorithms for conventional machine learning and deep learning were applied and validated beforehand to forecast and analyze the disease. It is noticeable that SVM, RF, LR, Multilayer Perceptron, KNN, ANN, RT, and DNN models were frequently utilized to classify and predict the patients with Parkinson’s. Even though the DNN model has promising performance on different datasets, it does not show satisfactory performance on top of this research work. Turning into the SVM model, it has the highest accuracy among the other models. Support vector machines are highly efficient for high dimensional space, and this algorithm uses relatively little memory. On the other hand, the RF replaced the second place after the SVM model. It is to be mentioned that although the various traditional methods appeared in the previous research, we have extracted the information on top of the frequent model.
it is noticeable that there are some limitations to collecting the dataset. It is possible to overcome this problem by using a balanced dataset, which will allow the decision tree model to learn without bias. When noise and outliers are present in data collection, diagnosis is less likely to be accurate. As such, medical data must be automatically pre-processed before analysis. After removing noise and outliers, the processed and analyzed medical images can then be used to diagnose diseases and abnormalities, such as volume, shape, and motion of organs. So overall, the process may not be cost-effective but efficient enough to diagnose appropriately. It is also observed that the computational cost of the process was considerably high. To solve the problem, clean and substantial size datasets are required from a machine learning perspective. But here, we have noticed a limited amount of available clean datasets in light of the various complications of the datasets. In addition, this form of dataset gathering presents a number of intrinsic difficulties, including the problem of “class imbalance” and the presence of noise and outliers. In addition to these, boosting methods make some research work more efficient. 96.2% was obtained in the previous study, but the authors did not ensure the effectiveness, so this is slightly difficult to use in terms of the clinical aspects. There is no automatic detection process that can detect the progress man to man rather than collecting their dataset of prominent people and advanced technology uses. Using only two variables autonomic symptoms and olfactory dysfunction it was feasible to attain an accuracy of 84.4%, according to the ripper algorithm’s interpretable principles. Our study shows that non-motor parameters of Parkinson’s disease (PD) may be analyzed using machine learning approaches to detect PD patients with good accuracy and recall, and it enables us to choose the most discriminative non-motor variables to develop new tools for PD screening.
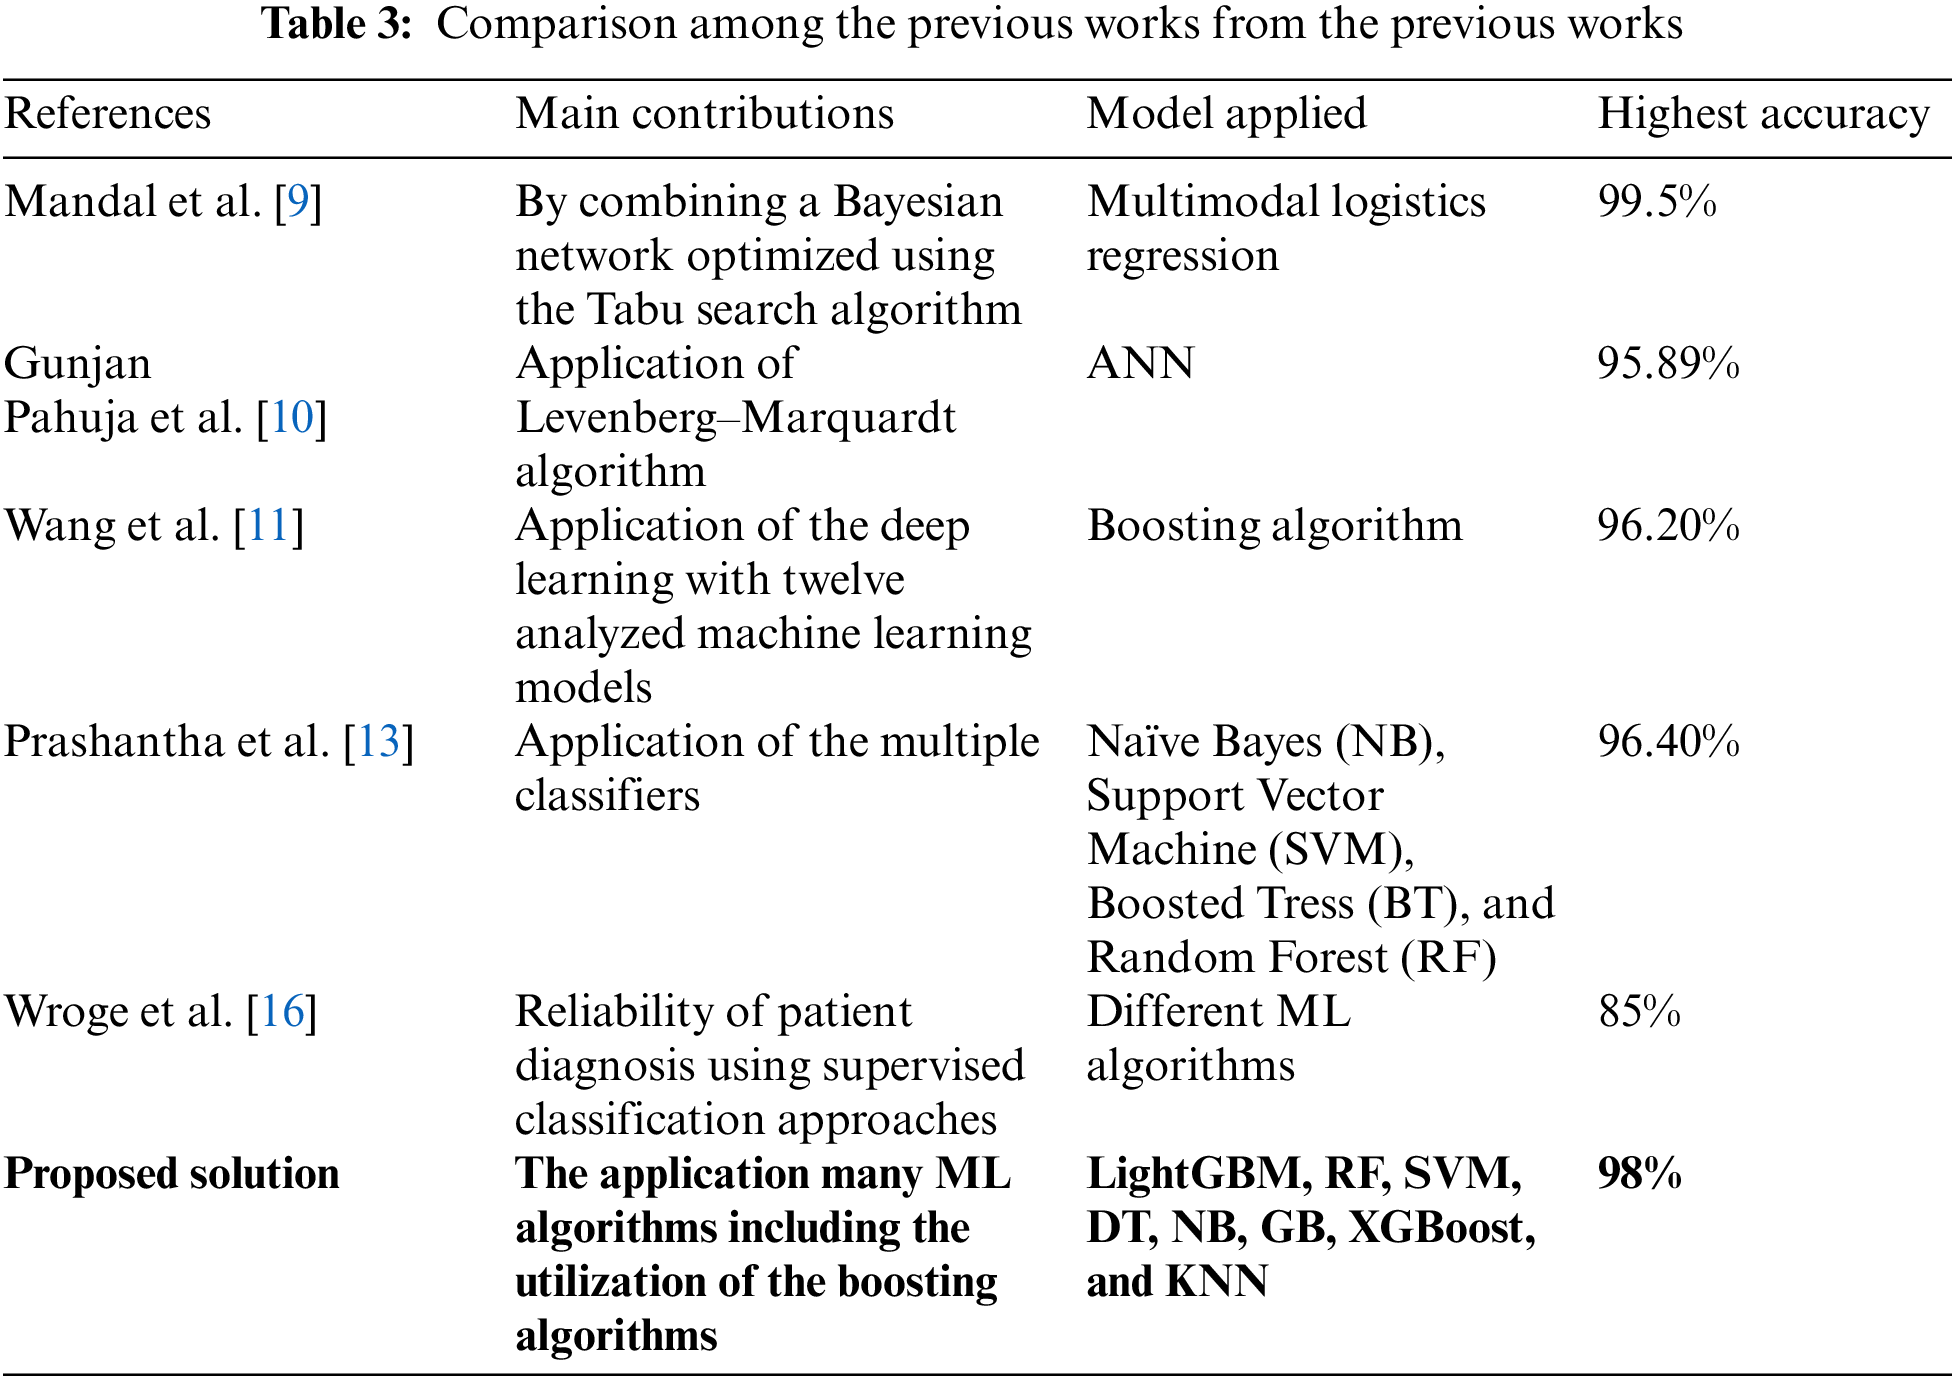
Cross-validation was used to address the imbalanced datasets in certain research projects. Also, assess and improve feature sets, eliminating characteristics that do not aid in the diagnosis of Parkinson’s disease. Through our study, we have tracked out many observations on the PD. We have found that my studies described in the literature section had interpreted insufficient description of their adopted methodology or failed to provide accurate information such as more significant parameters of early diagnosis of PD. Also, some of the studies were less efficient how the machine learning models were implemented, trained, and evaluated. Although, we attempted to include a list of model hyperparameters and cross-validation approaches in the data extraction table, a few of the included articles lacked this information in the main text, making it difficult to duplicate the findings. Nonetheless, this study provides a comparison table (Table 3) where we have interpreted the comparison among the existing models and how our model is superior to others. Based on the performance and comparison, we can say that the developed model can be implemented in computer-aided diagnosis (CAD). The suggested models and trained models can be implemented on the cloud server. As we have the highest accuracy in PD identification, the user or patient can provide the value of the corresponding factors to the models, and the model will return the results of the CAD-based diagnosis. So, from our point of view, the model can be applied to the clinical application of PD diagnosis.
Parkinson’s disease is a major global cause of death. It is more difficult to treat because many nations do not fully understand it. The healthcare system lacks the physicians and technology necessary to reduce the number of fatalities. It is difficult to determine the cause of Parkinson’s disease and how to treat patients without the proper resources. Our goal is to make it easier for doctors and patients to identify what might cause Parkinson’s and how to reduce those risks. We made a simple model called LightGBM that’s really good at spotting Parkinson’s disease. It only needs to look at two things-autonomic symptoms and olfactory dysfunction-to be 84.4% accurate.
But while working our proposed model, we face into a few issues. In addition to lacking some useful tools, we worked with limited data. We will address these issues in the future. To refine our model further, we will employ larger datasets and more advanced equipment. To further improve our model’s accuracy, we’ll incorporate additional patient data, such as speech and movement patterns. Through our project, physicians and patients will be able to determine the possible cause of Parkinson’s disease. To train our model and develop a novel approach to future disease prediction, we will leverage a large amount of data.
Acknowledgement: The authors are thankful to the Dean of Scientific Research at Najran University for funding this work under the Research Groups Funding Program, Grant Code (NU/GP/SERC/13/30).
Funding Statement: The funding for this work was provided by the Research Groups Funding Program, Grant Code (NU/GP/SERC/13/30).
Author Contributions: All work was done by a single author Naif Al Mudawi.
Availability of Data and Materials: Not applicable.
Conflicts of Interest: The author declares that they have no conflicts of interest to report regarding the present study.
References
1. C. A. Davie, “A review of Parkinson’s disease,” Br. Med. Bull., vol. 86, no. 1, pp. 109–127, 2008. doi: 10.1093/bmb/ldn013. [Google Scholar] [PubMed] [CrossRef]
2. I. Chendo et al., “Frequency of depressive disorders in Parkinson’s disease: A systematic review and meta-analysis,” J. Parkinson’s Dis., vol. 12, no. 5, pp. 1409–1418, 2022. doi: 10.3233/JPD-223207. [Google Scholar] [PubMed] [CrossRef]
3. L. M. de Lau and M. M. Breteler, “Epidemiology of Parkinson’s disease,” The Lancet Neurol., vol. 5, no. 6, pp. 525–535, 2006. doi: 10.1016/S1474-4422(06)70471-9. [Google Scholar] [PubMed] [CrossRef]
4. N. Wan and G. Lin, “Parkinson’s disease and pesticides exposure: New findings from a comprehensive study in Nebraska, USA,” J. Rural Health, vol. 32, no. 3, pp. 303–313, 2016. doi: 10.1111/jrh.12154. [Google Scholar] [PubMed] [CrossRef]
5. G. Nagasubramanian and M. Sankayya, “Multi-variate vocal data analysis for detection of Parkinson disease using deep learning,” Neural Comput. Appl., vol. 33, no. 10, pp. 4849–4864, 2021. doi: 10.1007/s00521-020-05233-7. [Google Scholar] [CrossRef]
6. E. Balaji, D. Brindha, V. K. Elumalai, and R. Vikrama, “Automatic and non-invasive Parkinson’s disease diagnosis and severity rating using LSTM network,” Appl. Soft Comput., vol. 108, no. 4, pp. 107463, 2021. doi: 10.1016/j.asoc.2021.107463. [Google Scholar] [CrossRef]
7. T. Panch, P. Szolovits, and R. Atun, “Artificial intelligence, machine learning and health systems,” J. Glob. Health, vol. 8, no. 2, pp. 489–502, 2018. doi: 10.7189/jogh.08.020303. [Google Scholar] [PubMed] [CrossRef]
8. C. Quan, K. Ren, and Z. Luo, “A deep learning based method for Parkinson’s disease detection using dynamic features of speech,” IEEE Access, vol. 9, pp. 10239–10252, 2021. doi: 10.1109/ACCESS.2021.3051432. [Google Scholar] [CrossRef]
9. I. Mandal and N. Sairam, “New machine-learning algorithms for prediction of Parkinson’s disease,” Int. J. Syst. Sci., vol. 45, no. 3, pp. 647–666, 2014. doi: 10.1080/00207721.2012.724114. [Google Scholar] [CrossRef]
10. G. Pahuja and T. Nagabhushan, “A comparative study of existing machine learning approaches for Parkinson’s disease detection,” IETE J. Res., vol. 67, no. 1, pp. 4–14, 2021. doi: 10.1080/03772063.2018.1531730. [Google Scholar] [CrossRef]
11. W. Wang, J. Lee, F. Harrou, and Y. Sun, “Early detection of Parkinson’s disease using deep learning and machine learning,” IEEE Access, vol. 8, pp. 147635–147646, 2020. doi: 10.1109/ACCESS.2020.3016062. [Google Scholar] [CrossRef]
12. M. Nilashi, O. Ibrahim, H. Ahmadi, L. Shahmoradi, and M. Farahmand, “A hybrid intelligent system for the prediction of Parkinson’s disease progression using machine learning techniques,” Biocybern. Biomed. Eng., vol. 38, no. 1, pp. 1–15, 2018. doi: 10.1016/j.bbe.2017.09.002. [Google Scholar] [CrossRef]
13. R. Prashanth, S. D. Roy, P. K. Mandal, and S. Ghosh, “High-accuracy detection of early Parkinson’s disease through multimodal features and machine learning,” Int. J. Med. Inform., vol. 90, pp. 13–21, 2016. doi: 10.1016/j.ijmedinf.2016.03.001. [Google Scholar] [PubMed] [CrossRef]
14. J. S. Almeida et al., “Detecting Parkinson’s disease with sustained phonation and speech signals using machine learning techniques,” Pattern Recognit. Lett., vol. 125, no. 2, pp. 55–62, 2019. doi: 10.1016/j.patrec.2019.04.005. [Google Scholar] [CrossRef]
15. Z. K. Senturk, “Early diagnosis of Parkinson’s disease using machine learning algorithms,” Med. Hypotheses, vol. 138, no. 4, pp. 109603, 2020. doi: 10.1016/j.mehy.2020.109603. [Google Scholar] [PubMed] [CrossRef]
16. T. J. Wroge, Y. Özkanca, C. Demiroglu, D. Si, D. C. Atkins and R. H. Ghomi, “Parkinson’s disease diagnosis using machine learning and voice,” in 2018 IEEE Sig. Process. Med. Biol. Symp. (SPMB), IEEE, 2018, pp. 1–7. [Google Scholar]
17. J. Brownlee, “How to develop a light gradient boosted machine (LightGBM) ensemble,” 2022. Accessed: Jan. 23, 2022. [Online]. Available: https://machinelearningmastery.com/light-gradient-boosted-machine-lightgbm-ensemble/ [Google Scholar]
18. M. Al-Kasassbeh, M. A. Abbadi, and A. M. Al-Bustanji, “LightGBM algorithm for malware detection,” in Intelligent Computing, Springer, 2020, pp. 391–403. [Google Scholar]
19. J. Xie et al., “Wearable multisource quantitative gait analysis of Parkinson’s diseases,” Comput. Biol. Med., vol. 164, no. 9, pp. 107270, 2023. doi: 10.1016/j.compbiomed.2023.107270. [Google Scholar] [PubMed] [CrossRef]
20. N. Nour, U. Senturk, and K. Polat, “Diagnosis and classification of Parkinson’s disease using ensemble learning and 1D-PDCovNN,” Comput. Biol. Med., vol. 161, no. 11, pp. 107031, 2023. doi: 10.1016/j.compbiomed.2023.107031. [Google Scholar] [PubMed] [CrossRef]
21. M. Little, P. McSharry, E. Hunter, J. Spielman, and L. Ramig, “Suitability of dysphonia measurements for telemonitoring of Parkinson’s disease,” Nat. Prec., 2008. doi: 10.1038/npre.2008.2298.1. [Google Scholar] [CrossRef]
22. X. Chu, I. F. Ilyas, S. Krishnan, and J. Wang, “Data cleaning: Overview and emerging challenges,” in Proc. 2016 Int. Conf. Manag. Data, 2016, pp. 2201–2206. [Google Scholar]
23. E. K. Sahin, “Assessing the predictive capability of ensemble tree methods for landslide susceptibility mapping using XGBoost, gradient boosting machine, and random forest,” SN Appl. Sci., vol. 2, no. 7, pp. 1–17, 2020. doi: 10.1007/s42452-020-3060-1. [Google Scholar] [CrossRef]
24. Y. Chen, Z. Jia, D. Mercola, and X. Xie, “A gradient boosting algorithm for survival analysis via direct optimization of concordance index,” Comput. Math. Methods Med., vol. 20, no. 2, pp. 413, 2013. doi: 10.1155/2013/873595. [Google Scholar] [PubMed] [CrossRef]
25. J. Mei, C. Desrosiers, and J. Frasnelli, “Machine learning for the diagnosis of Parkinson’s disease: A review of literature,” Front. Aging Neurosci., vol. 13, pp. 633752, 2021. doi: 10.3389/fnagi.2021.633752. [Google Scholar] [PubMed] [CrossRef]
Cite This Article
 Copyright © 2024 The Author(s). Published by Tech Science Press.
This work is licensed under a Creative Commons Attribution 4.0 International License , which permits unrestricted use, distribution, and reproduction in any medium, provided the original work is properly cited.
 Downloads
 Citation Tools