
 Submit a Paper
 Propose a Special lssue
 Open Access
ARTICLE

A Proposed Feature Selection Particle Swarm Optimization Adaptation for Intelligent Logistics—A Supply Chain Backlog Elimination Framework
1 College of Computing and Information Technology at Khulais, Department of Information Systems, University of Jeddah, Jeddah, 21959, Saudi Arabia
2 Faculty of Computers and Information Technology, Future University in Egypt, Cairo, 11835, Egypt
* Corresponding Author: Amira M. Idrees. Email:
Computers, Materials & Continua 2024, 79(3), 4081-4105. https://doi.org/10.32604/cmc.2024.048929
Received 22 December 2023; Accepted 29 March 2024; Issue published 20 June 2024
 View Full Text
 Download PDF
Abstract
The diversity of data sources resulted in seeking effective manipulation and dissemination. The challenge that arises from the increasing dimensionality has a negative effect on the computation performance, efficiency, and stability of computing. One of the most successful optimization algorithms is Particle Swarm Optimization (PSO) which has proved its effectiveness in exploring the highest influencing features in the search space based on its fast convergence and the ability to utilize a small set of parameters in the search task. This research proposes an effective enhancement of PSO that tackles the challenge of randomness search which directly enhances PSO performance. On the other hand, this research proposes a generic intelligent framework for early prediction of orders delay and eliminate orders backlogs which could be considered as an efficient potential solution for raising the supply chain performance. The proposed adapted algorithm has been applied to a supply chain dataset which minimized the features set from twenty-one features to ten significant features. To confirm the proposed algorithm results, the updated data has been examined by eight of the well-known classification algorithms which reached a minimum accuracy percentage equal to 94.3% for random forest and a maximum of 99.0 for Naïve Bayes. Moreover, the proposed algorithm adaptation has been compared with other proposed adaptations of PSO from the literature over different datasets. The proposed PSO adaptation reached a higher accuracy compared with the literature ranging from 97.8 to 99.36 which also proved the advancement of the current research.Keywords
Complex computation methods have been proposed seeking for effective manipulation and dissemination of huge amounts of data. However, the challenge that arises from the increasing dimensionality has a negative effect on the computation performance, efficiency, and stability of computing. Consequently, the feature selection field has gained a major focus as a vital preprocessing step for artificial intelligence techniques [1]. Feature selection is considered a step towards optimization by selecting the optimal features representing the dataset. Mathematically speaking, considering X number of features, then there is a possibility to generate a total of 2n subsets of features which may lead to an exponential growth of the number of iterations when applying the machine learning algorithms.
Many of the feature selection methods have been proposed and proved their applicability in identifying the highest influencing features. Many statistical methods such as analysis of variance, correlations, entropy, and chi-squared have also been introduced for this task [2]. However, most of these methods perform the selection task based on the correlations between features’ pairs solely without considering other perspectives. Exploring multiple features’ relationships should be one of the perspectives for a more accurate determination of the highest influencing features [3]. Therefore, another direction has emerged with the heuristics swarm intelligence algorithms. One of the most successful optimization algorithms is Particle Swarm Optimization (PSO) which has proved its effectiveness in exploring the highest influencing features in the search space based on its fast convergence and the ability to utilize a small set of parameters in the search task [4]. However, as highlighted in different research [4,5], the success of PSO is commonly affected as the data dimensionality increases. Consequently, seeking to improve the performance of PSO in feature selection tasks has become one of the vital research directions targeting both less computation and higher accuracy while minimizing the effect of dimensionality size. On the other hand, PSO performance is also affected by the random process in searching the data space as well as the possibility of similar particles’ positions over the iterations. This randomness has been a main reason for performance degradation in one direction as well as lacking the ability to reach the local optima [6]. Although different research proposed solutions [5,7,8], however, these solutions still suffer from performance issues as will be discussed in Section 2.
This research proposes an effective enhancement of PSO for feature selection that tackles the challenge of randomness search as one of the vital aspects that directly affects PSO performance. The research proposes a novel approach to avoid the constant reference to the global best solution to all particles due to the local optima traps possibility. The proposed enhancement includes an approach in a systematic search strategy that reduces the search space as well as the computation time.
On the other hand, focusing on the business objective of this research, a supply chain is the complete path since setting the raw material from the supplier along to the manufacturing process and ending with offering the product to the customer [9]. One of the main issues that may lead to high loss in the supply chain is the shipping delays. Delays not only affect customer satisfaction, but they also could negatively affect product quality, raise the cost, cause retailers and distributers dis-satisfaction, and eventually, lead to decreasing customer satisfaction and loyalty. Delays are one of the critical issues in all types of supply chain which should be highlighted to avoid such loss. For example, the research [10] highlighted the effect of delays in transportation systems and consequently on economic growth. The research proposed a novel method targeting to avoid delays. As mentioned in [11], over 80% of delayed shipments lead directly to customers’ dissatisfaction and decrease the customer segment. This argument is also highlighted in [12] by stating that over 58% of the customers who do not receive their orders on time stop purchasing from the same business. On the other hand, attracting new customers is a higher expensive task than attaining the current customers. Accordingly, maintaining the order delivery schedule is confirmed to be a successful path to reserve the current customers as well as extend the customer segment. One of the solutions is predicting the possible shipment delays. Early delay prediction leads to highlighting the main reason for the chain malfunction and providing efficient solutions to avoid this delay.
Supply chain backlog is one of the major challenges in supply chains. As mentioned in [12], product delivery by trucks in America was delayed for a total of 1.2 billion hours in 2016 which resulted in a loss of 74.5 billion US Dollars. The backlog situation has risen again in the period of the Covid-19 pandemic. The pandemic raised the reliance on online shopping which required home delivery service. However, the low workers’ availability at that time was a main factor for the backlog situation. It is a fact that although the pandemic has passed, however, its impact has altered many aspects of the field of commerce forever [13]. Since then, the supply chain has been strongly influenced in different aspects including customer behavior in shopping patterns and the amount of shopping, the sales amount and frequency, the supplier responses, and customers’ satisfaction, financial profit and losses, and others. As all of these issues are affected directly by the delays and the resulting backlogs, therefore, highlighting efficient solutions for such bottlenecks is considered a positive step for an efficient reliable supply chain.
For this objective, this research proposes an intelligent framework for early prediction of the order delay and eliminating order backlogs which could be considered as an efficient potential solution for raining the supply chain performance. The research presents the proposed framework with a complete experiment to prove the proposed framework’s applicability, efficiency, and reliability. The proposed framework presents an efficient utilization of adapted machine learning techniques in addition to raising the focus on the most efficient prediction features by applying feature selection based on swarm intelligence optimization techniques. The proposed framework with all details confirming each phase’s contribution to reaching the required objective is discussed in detail.
To summarize, the research novelty is highlighted by the proposed enhancement of the PSO algorithm for feature selection. The enhancement tackles the randomization in searching for particles in the data space and proposes a novel search method that is based on exploring the semantic relationship in a collaborative environment. The proposed adaptation is proven to reach the optimal solution with less computation and higher accuracy by minimizing the effect of dimensionality size.
Based on the proposed methodology, the current research tackles the following set of contributions:
First, from a technical perspective, the research proposes an enhancement of the PSO algorithm:
– The research proposes a method to identify the particle under examination based on the feature’s contribution to the dataset by moving the highly influencing features for early examination by introducing a novel collaborative approach of a set of weighting methods.
– The fitness value is also adapted by introducing the collaboration of a set of algorithms for measuring the performance. The results evaluation is performed by applying a novel method that determines the evaluation measures invariance level and tackles its effectiveness in correctly evaluating the results.
Second, from a business perspective, the research proposes an efficient methodology for supply chain backlog elimination:
– Early prediction of the orders delays using adapted machine learning technique. The research will confirm that the proposed adaptation outperforms other machine learning techniques by the experimental results comparison.
– Exploring the significant factors for order delays with identifying the significance polarity and effect level. An adapted PSO swarm intelligence optimization technique is utilized for this objective to ensure high performance.
– Recommendations for avoiding delivery delay will be endorsed according to the explored features which ensure delivery fulfillment on time and attain the customers’ satisfaction.
– The proposed framework is generic and could be applied to any type of delivery phase or product category in any supply chain.
The remaining research discusses the related work in Section 2, the proposed framework in Section 3, the experiment in Section 4, and the concussion in Section 5.
Different research proposed enhancements for PSO in feature selection [5,7,8]. Most of this research provides acceptable results, however, the field is still open for research due to falling into the incapability of balancing between the global and local search which even increases with the high dimensional data. Another direction is the need for more efficient methods for inertia weighting as well as more efficient swarm division methods to enhance both the accuracy and performance of the algorithm.
The research [14] proposed an improvement of PSO for feature selection based on the correlations with clustering guidance targeting to reduce the computational cost. The research [15] focused on the issue of high dimensionality and proposed an adaptation of PSO based on variable-sized particles. The research [16] targeted solving the network intrusion problem by proposing a time-varying approach for feature selection using PSO. The research [16] followed the same time-varying approach, however, the performance was not adequate for all the contributing datasets which highlighted the instability in the proposed enhancement performance. The research [17] proposed an adaptation for PSO election operators to tackle the issue of population diversity. Although the proposed research tackled PSO improvement from different perspectives, however, the randomness issue in the search process remained a bottleneck hindering these improvements which lacked the consideration of the presented research
On the other hand, different research has discussed ideas for predicting supply chain backlogs. The research [18] proposed performing the prediction task by applying an adapted Markov process. The model provides an expectation in each stage rather than highlighting the critical delays. Another research [19] proposed a model to detect the required truck speed to avoid delays. The model relied on the relationship between the travel distance and the total available time without engaging other parameters such as traffic congestion. Moreover, the research [20] utilized rapid mining tools in applying data mining techniques. The research performed a qualitative analysis to propose a delivery delay management plan. In terms of algorithms runtime, the research [21] presented a study that focused on comparing three algorithms: Gradboost, histogram Grad Boost, and CatBoost. However, the research was only limited to the runtime comparison.
Other researchers performed the same methodology by comparing different algorithms to monitor these algorithms’ performance in backlog prediction tasks. The research [22] performed this compassion for a set of classification algorithms including support vector machine, random forest, neural networks, and logistic regression. The study highlighted the highest accuracy for the logistic regression. The previous research results contradicted the earlier research [23] which highlighted the utilization of support vector machines and neural networks for more than 85% of the research in that literature. A support vector machine is also utilized in the research [24] to provide a transit plan for the shipment while minimizing the delay risk. The research utilized historical data with the support of weather and social media data which is considered one of the challenges to releasing such rich data. Additionally, the research [25] also utilized a support vector machine and random forest in addition to identifying the variables’ dependency using chi-square targeting to predict the estimated delivery time for the shipments. Support vector machine is additionally applied in [26] with the aim of time delivery forecasting. A hybrid approach is proposed in [27] to improve the delivery time. Although the data included shipping and time features, however, some of these features were unrealistically presented and are not applicable to be collected in real data.
On the other hand, the parameters affecting the backlog prediction have been investigated. Exploring the delayed deliveries was one of the objectives that led many researchers to apply different machine learning algorithms, however, the issue of data dimensionality was highlighted which made the research more applicable to limited volume [28,29]. One successful research [30] focused on the supply chain of organ transplantation in the medical field. The research tackled a vital field that highlighted the critical necessity for delay elimination and task prioritization and proposed a simulation-based fuzzy model for allocating and distributing organ transplant tasks. The research was successful by a set of tests in balancing the supply chain implementation varieties with the people’s needs and the cost minimization. As mentioned in the research, enhancements could enrich the proposed model by considering other parameters such as the total travel time, geographical constraints, and emergencies.
Moreover, most of the researchers also highlight the data unavailability in their research. The research [28] proposed a prediction model for delays before delivery, however, the research lacked the information availability during the process and was only limited to the prediction in the late stages of the supply chain. The proposed study lacked the required information for early prediction. Other research [29] struggled for the same target which followed the same direction with eliminating the orders that were ordered less than five times as a trial to raise the data quality. According to the literature, a set of research objectives could be raised. The first objective is exploring the most appropriate model for backlog prediction which could be considered a generic solution. The second objective is to identify the impact of the data dimensionality on the prediction task. Moreover, identifying the effect of the dimensions for the backlog prediction task is another objective with a study for the impact of each dimension elimination. The dimensions dependencies is another one of the vital objectives with a study of the impact of this dependency relationship on the delivery time prediction task. In summary, the literature revealed the gap that exists in utilizing machine learning algorithms in forecasting the delivery backlog prediction in the early stages with the contribution of available dimensions. The literature also tackled the effect of backlogs on the organization’s financial situation which revealed the loss and highlighted the impact of early delay on avoiding such loss. Backlog delay could be performed in a qualitative approach by predicting the estimated delivery duration or in a quantitative approach by predicting the delivery status. Finally, identifying the affected dimensions and the dimensions’ dependencies are two vital objectives that could positively affect the prediction task.
According to the literature, particle swarm optimization has a set of research gaps. PSO could reach a premature convergence due to the ability to unbalance between the global and local search. Therefore, the need for an efficient method for searching for the optimal solution is still an open search area with balancing this search with the data dimensionality. Another direction is the fact of the exponential growth of the data dimensions which still requires more efficient handling techniques. The weighting techniques and the learning parameters are two vital factors for PSO, therefore, investigating their mutual effect should also be on focus. A third direction is the initialization problem which requires a more efficient method for effective division and consequently balance between the particle movement speeds with the particle size. The current research tackles two points of the research gap. They are the initialization problem and proposing efficient features’ weighting methods as will be discussed in the following sections.
3 The Proposed Adapted Feature Selection PSO Algorithm (APSO)
This section discusses the proposed adaptation in the PSO algorithm. First, the following algorithm represents the original PSO algorithm:
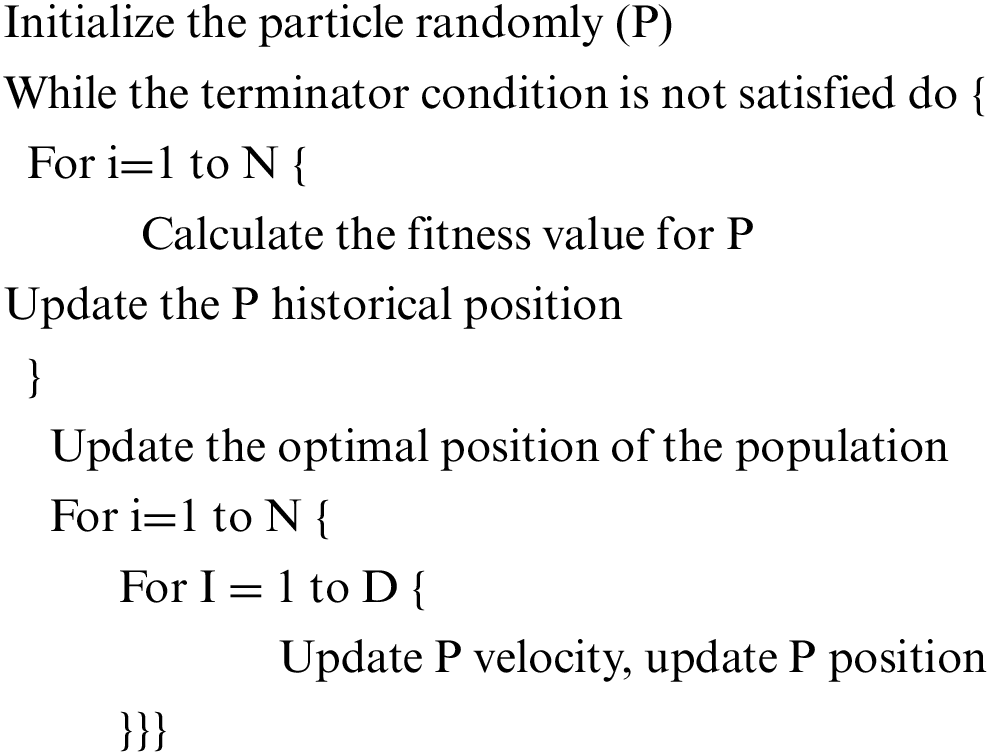
A simple description of the original PSO algorithm is as follows:
1. Initialize a particle randomly.
2. Evaluate the particle performance.
3. Update positions and velocity of the particle according to the evaluation results.
4. Repeat 2 and 3 until stopping criterion (nothing to examine or no performance enhancement).
5. Determine the best features subset based on the evaluation.
The first step in PSO is initializing the particle population. This first step can follow one of many strategies. The first strategy is the forward initialization in which one feature is included in each iteration and its impact is determined through determining the fitness value. The second strategy is the backward initialization in which one feature is eliminated in each iteration and the impact of this elimination is determined through determining the fitness value. The third strategy is including randomly selected features and these features impact is also determined. In each iteration, the features are switched on and off to be able to determine their impacts. This is an exhaustive process. In this research, a more comprehensible approach is proposed to set the selected feature for contributing to the iteration. The proposed enhancement ensures that the minimum number of iterations selects the highest qualified features subset. The following sections demonstrate the details of each step in the proposed algorithm.
3.1 Particle Initialization Based on a Collaborative Mining Approach
The particle initialization is performed following the forward selection approach. In each iteration, one feature will be added to the particle. The selection of the selected feature for contribution is not random as will be discussed in the following subsections. The research argues that the proposed non-random forward approach ensures the precedence in the contribution of the high influencing features in the earlier iterations as well as the minimum number of iterations to reach the optimal set. Seeking for optimal, yet inexpensive approach, this research proposes the following steps for the selection process. This research argues that applying the following steps succeeds in finding the optimal features subset with less computation than the original PSO.
3.1.1 First Step: Determine the Features’ Significance Level
This step determines the attributes’ weights following the proposed strategy in [31]. The features’ significance is determined based on the collaboration of a set of weighting methods. The deliverable of this step is tagging each feature by one of three labels, they are strong significant, weak significant, and insignificant. Only the features with the first two labels will have the chance to be further investigated in the next steps while the insignificant labeled features are eliminated with no further investigation.
The following are the main steps that determine the assigned label for each feature:
First, the set of features and the set of contributing weighting measures are represented in formulas (1) and (2), respectively.
The features set includes x representative features where x is an integer number representing the number of features that describe the data. On the other hand, the weighting measures set includes y weighting measures where y is an integer number representing the number of the contributing weighting measures.
Second, all the features are weighted by all the contributing weighting measures. This means that each feature will have y measures, where y is the number of the contributing weighting measures. The set of weighting for each feature is represented in formula (3) while the set of the weighting of all features including x members is represented in formula (4) where each member is a vector of y+1 elements.
The feature weightings are represented as a vector with a series of weighting values, wmxy is the weighting value of the feature x by the weighting measure y. The set of all weights for all features by all the contributing weighting measures is represented as the union of the features weighting vectors.
Third, the weighting threshold (WMThreshold) is determined.
Fourth, the three labels; strong significance, weak significance, and insignificance; are set to each attribute according to the following rules:
The feature is strong significance if it had all of the weighting measures above the threshold. The feature is the weak significance if it had sixty percent of the number of weighting measures above the threshold. For example, if the contributing weighting measures are ten measures, then the feature is decided to be weak in significance if its weight for at least six of these measures is above the threshold. The feature is insignificant otherwise. It is a fact that the nature of the features differs according to the contributing field, therefore, the threshold is identified according to the contributing field. For example, the age feature could be significant to identify the chemotherapy dose, however, it could be weakly significant for the retailing field, while it could be insignificant for the real state. Identifying sixty percent acceptance for weak significance followed the research [32] which limited the threshold for ten decision variables to be at least sixty-one percent with the least variance equal to 0.1. Additionally, the least variance level is selected as the classification accuracy becomes higher with the increase of the invariance level of the variables [33].
Each feature will have three weighting subsets which are determined as follows:
∀ fx ∈ F, ∃ wmxy ∈ fx (WM)
If sig_fx = | fx (WM)|
Else If sig_ fx > | fx (WM)| *60/100
Else reject_Features = reject_Features
In this step, selecting the contributing feature is applied according to its weight and membership in one of the sets Strong_Features, Weak_Features, and reject_Features. The features that belong to the reject_Features are excluded and will not contribute to this step. This means that these features will not be examined further. First, the average weights for all features in both Strong_Features and Weak_Features are determined. Second, both sets will be arranged in descending order. Third, this research follows the forward selection approach. In each iteration, one of the features will be added to the examined particle. Selecting the contributing feature is according to its weight and membership. The members in the Strong_Features set are examined first, then, the members of Weak_Features. In each set, the selected feature for contributing in the particle is the highest weighted feature in the set that has not contributed yet. This description can be formally represented as follows:
The union of the strong and weak features’ sets forms the set (Examine_F) for further significance examination in the next step. The following steps are performed to accomplish the required examination.
Order Examine_F set
False_F =
Contributing feature = fx : Fx ∈ Examine_F, fx ∉ False_F, fx ∉ True_F, avg_Weight (fx) > avg_Weight (fy), fy ∈ Strong_Features
If success (fx)
Else False_F = False_F + fx
This stage applies the particle assessment according to the classification performance. The classification performance is determined by utilizing the determined set of evaluation measures with the proposed approach of the measures weighting. The fitness function relies on the resulting measure values after weighting. The general function of fitness value per feature is determined as the minimum of the classification evaluations that are performed with the contribution of each feature. The fitness of each function could be illustrated as:
This is a vital step to perform which is the main step that decides whether the feature subset will be included in the final subset. Therefore, this research applies a novel approach to determining the fitness of the contributing particle. Following the research in [2], this step will include the contribution of a set of classification algorithms to ensure the fitness value accuracy. The feature is evaluated by its contribution to enhancing classification accuracy. Moreover, these classification algorithms are evaluated with a set of evaluation measures. The final algorithm classification follows a collaborative approach for these measures as will be discussed in this section. The subset succeeds in this step if its fitness value is above the threshold either for at least eighty percent of the contributing algorithms or its overall average evaluation. It means that if there are ten contributing classification algorithms in the examination process, then the features subset should either have a performance value higher than the threshold for eight of these algorithms or have an average performance value higher than the threshold. This percentage is identified following the research [32] which reached a maximum of seventy-two percent of the inconsistency threshold for a variance level equal to twenty-five percent. As the classification accuracy has a negative relationship with the variance level, therefore, this percentage is identified as an exhaustive examination of the feature in the classification task to ensure its significance in the worst-case scenario.
This step includes two determinants, the contributing classification algorithms and the contributing evaluation measures. They can be represented as follows:
Evaluation Measures Significance
The evaluation measures’ mission is to determine the success level of the classification algorithm in a defined perspective. For example, the accuracy measures the success percentage of the classification algorithm in correctly classifying a certain record. While the sensitivity measures the success of the classification algorithm in correctly identifying the records that belong to the positive class. On the other hand, these evaluation measure has its accuracy level in its task. For example, if the accuracy measure is accurate with 80% in its task, this means that this measure could be able to identify only 80% of the correctly classified records by the classification algorithm. There may be other records that are correctly classified, and the evaluation measure could not detect them. These records could represent 20% of the total correctly classified records by the classification algorithm. This means that the classification algorithm could have a higher accuracy but it is not detected by the evaluation measure.
This situation raises the necessity to evaluate the classification algorithm with more than one evaluation measure to ensure the correct evaluation. But the question that is raised, is which evaluation measure to depend on in the final evaluation. In this research, the evaluation measures are evaluated by the invariance property. In the case of binary classification, which is the current research case, the evaluation measure requires to have the possible highest level of non-invariance. This means that the evaluation measure could successfully examine both classes with equal importance. This research follows eight of the properties that determine the invariance level of the evaluation measure. These eight properties are as follows:
Invariance measure 1 defines the evaluation measure to be invariant if the exchange between the true positive and negative values in the confusion matrix provides no effect on the results.
Invariance measure 2 defines the evaluation measure to be invariant if the true negative could be solely changed with no change of other parameters in the confusion matrix.
Invariance measure 3 defines the evaluation measure to be invariant if the true positive could be solely changed with no change of other parameters in the confusion matrix.
Invariance measure 4 defines the evaluation measure to be invariant if the false negative could be solely changed with no change of other parameters in the confusion matrix.
Invariance measure 5 defines the evaluation measure to be invariant if the false positive could be solely changed with no change of other parameters in the confusion matrix.
Invariance measure 6 defines the evaluation measure to be invariant if the positive values could be changed with the same ratio of the change in negative values in the confusion matrix.
Invariance measure 7 defines the evaluation measure to be invariant if the positive and negative values in the confusion matrix could be vertically switched with no effect on the results.
Invariance measure 8 defines the evaluation measure to be invariant if the positive and negative values in the confusion matrix could be horizontally switched with no effect on the results.
Fitness Value by Classifications Algorithms’ Cross Validation
In this step, a set of classification algorithms are applied. Evaluation measures are determined for each algorithm. Then the overall performance for each algorithm is determined. The fitness value of the feature subset under examination is determined to be the minimum overall performance of the classification algorithms. Formula (9) represents the evaluation values of the classification algorithm c. The average evaluation value of the algorithm c is determined in formula (10), and then the set of all classification algorithms averages is represented in formula (11). The fitness value is the minimum average. The features’ subset succeeds in the examination process if the minimum fitness is above the threshold.
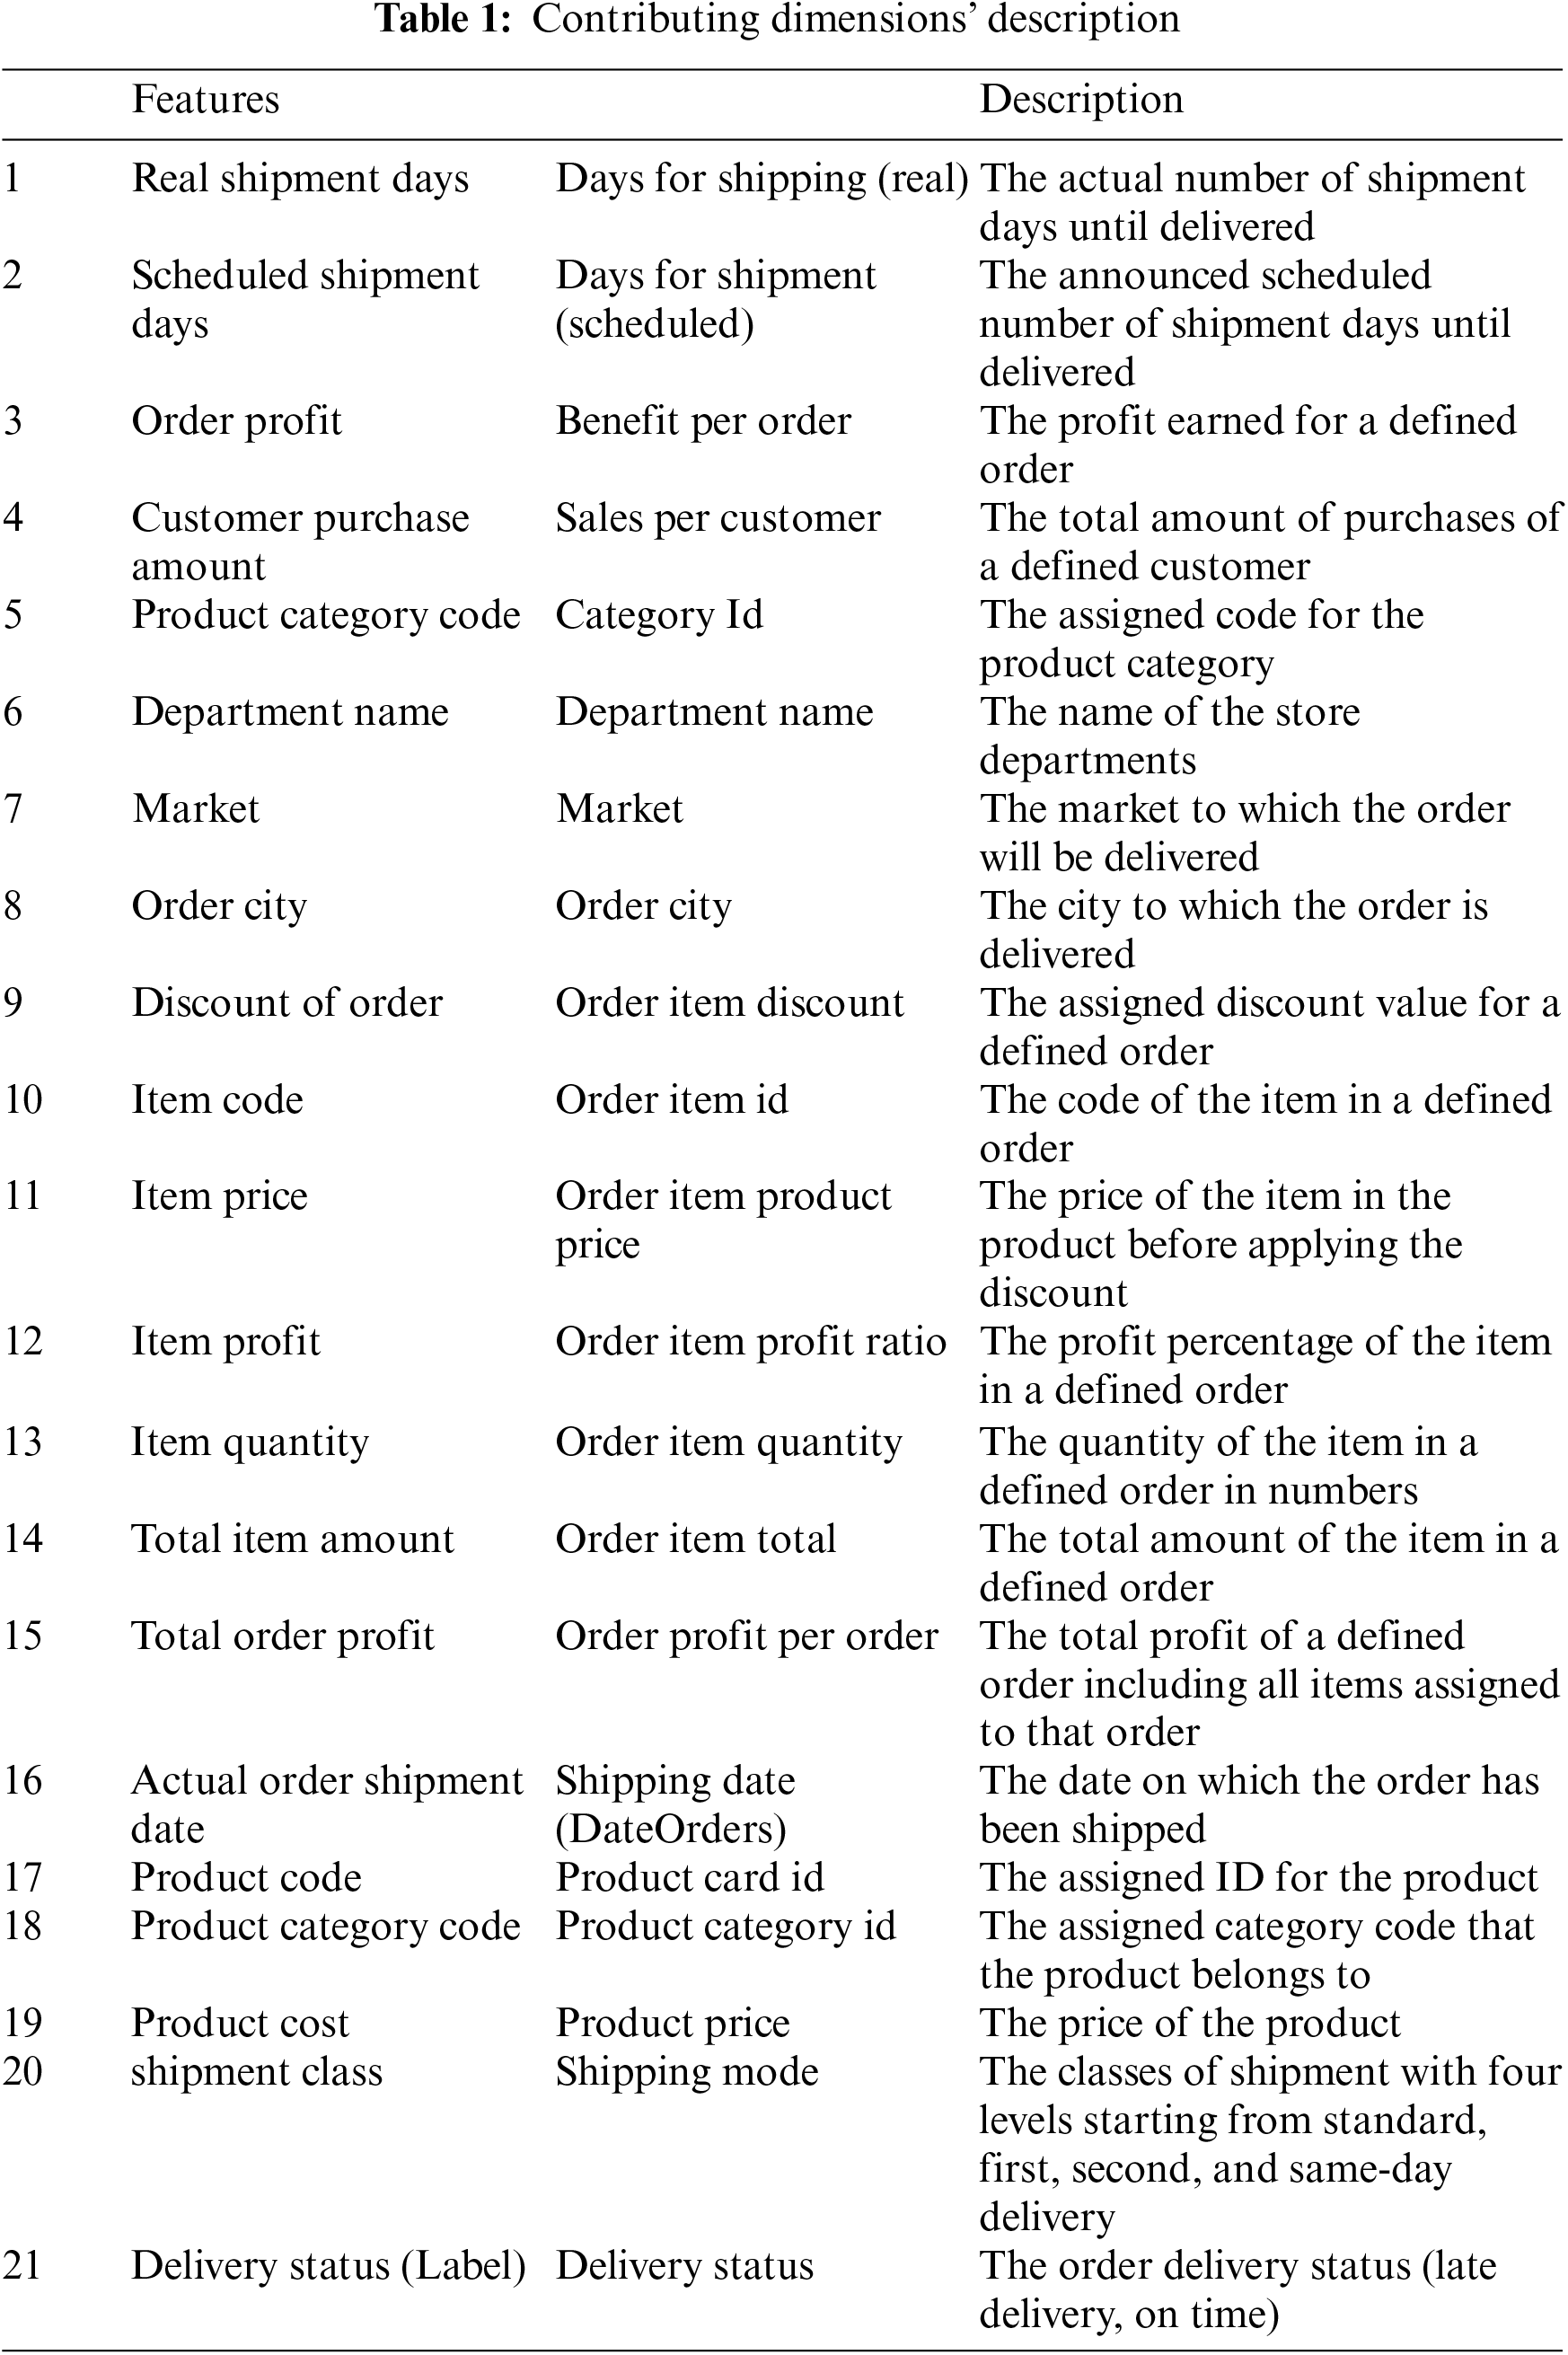
The original experiment is applied using data that was retrieved from the Kaggle website [34]. As mentioned, the dataset owner is “DataCo Global” company which uploaded the dataset for public use. The data included about one hundred and eighty thousand records. It covered transactions with a time range of five years from 2015 to 2019. The data is characterized by fifty-two dimensions. However, eight of these dimensions are not beneficial to the current study, they are Product Image, Product Description, Longitude, Latitude, Customer Password, Customer Lname, Customer Fname, and Customer Email. On the other hand, there are some of the dimensions that are related such as category id and category name. These dimensions are considered the same, therefore, one of them is eliminated. Consequently, only twenty attributes initially contribute to the experiment in addition to the main label dimension, the delivery status. Moreover, the delivery status, which is the dependent dimension, has four values, they are shipment on time, late delivery, shipment canceled, and advance shipping. As the experiment focuses on backlog prediction the focus of the study is on only two statuses, shipment on time and late delivery, therefore, the contributing transactions were limited to these two statuses. Moreover, the order status is also limited to three possible values, complete, processing, and pending. Additionally, the experiment assumes that the product on focus is available in stock, therefore, only the transactions with the product status available are included in the dataset. Finally, the dataset includes three types of customers, they are consumers, corporates, and home offices. The current study concentrates on only one type of customer, which is the consumer. The type “consumers” has contributed a total of about ninety-three thousand records in the dataset. Therefore, the utilized sample in the experiment is retrieved from this subset of these records. According to these limitations, the final contributing dataset included about twenty thousand records. Statistically speaking, the dataset is distributed to a percentage of forty-five percent of the transactions that were delivered on the set time while the remaining fifty-five were late. As mentioned in [35], the unbalanced dataset could reveal a negative effect on the performance, therefore, SMOTE sampling technique is applied to ensure a balanced dataset. Finally, the contributing dataset count is set to be with equal distribution of both classes, delivery on time and late delivery. Table 1 describes the dimensions of the dataset.
Pre-processing tasks are applied to the dataset for the prediction task. The first task is to ensure the data completeness. It is observed that some attributes have missing values, they are product description and order zip code. Therefore, these attributes are removed from the dimensions set. Therefore, the final contributing features are eighteen features in addition to the label feature.
The second task is understanding data by visualization. Samples of visualized data are demonstrated in this section. The sample focus is on the dimensions that describe the customer’s behavior. The first dimension is the customer preference for the shipping category. This attribute has four values the standard, first, second, and same-day delivery classes. All classes reflect the number of days to receive the order which certainly is mapped to the delivery fees according to the chosen category. As illustrated in Fig. 1, it is shown that almost fifty percent of the customers choose the cheapest category for delivery, the third class.
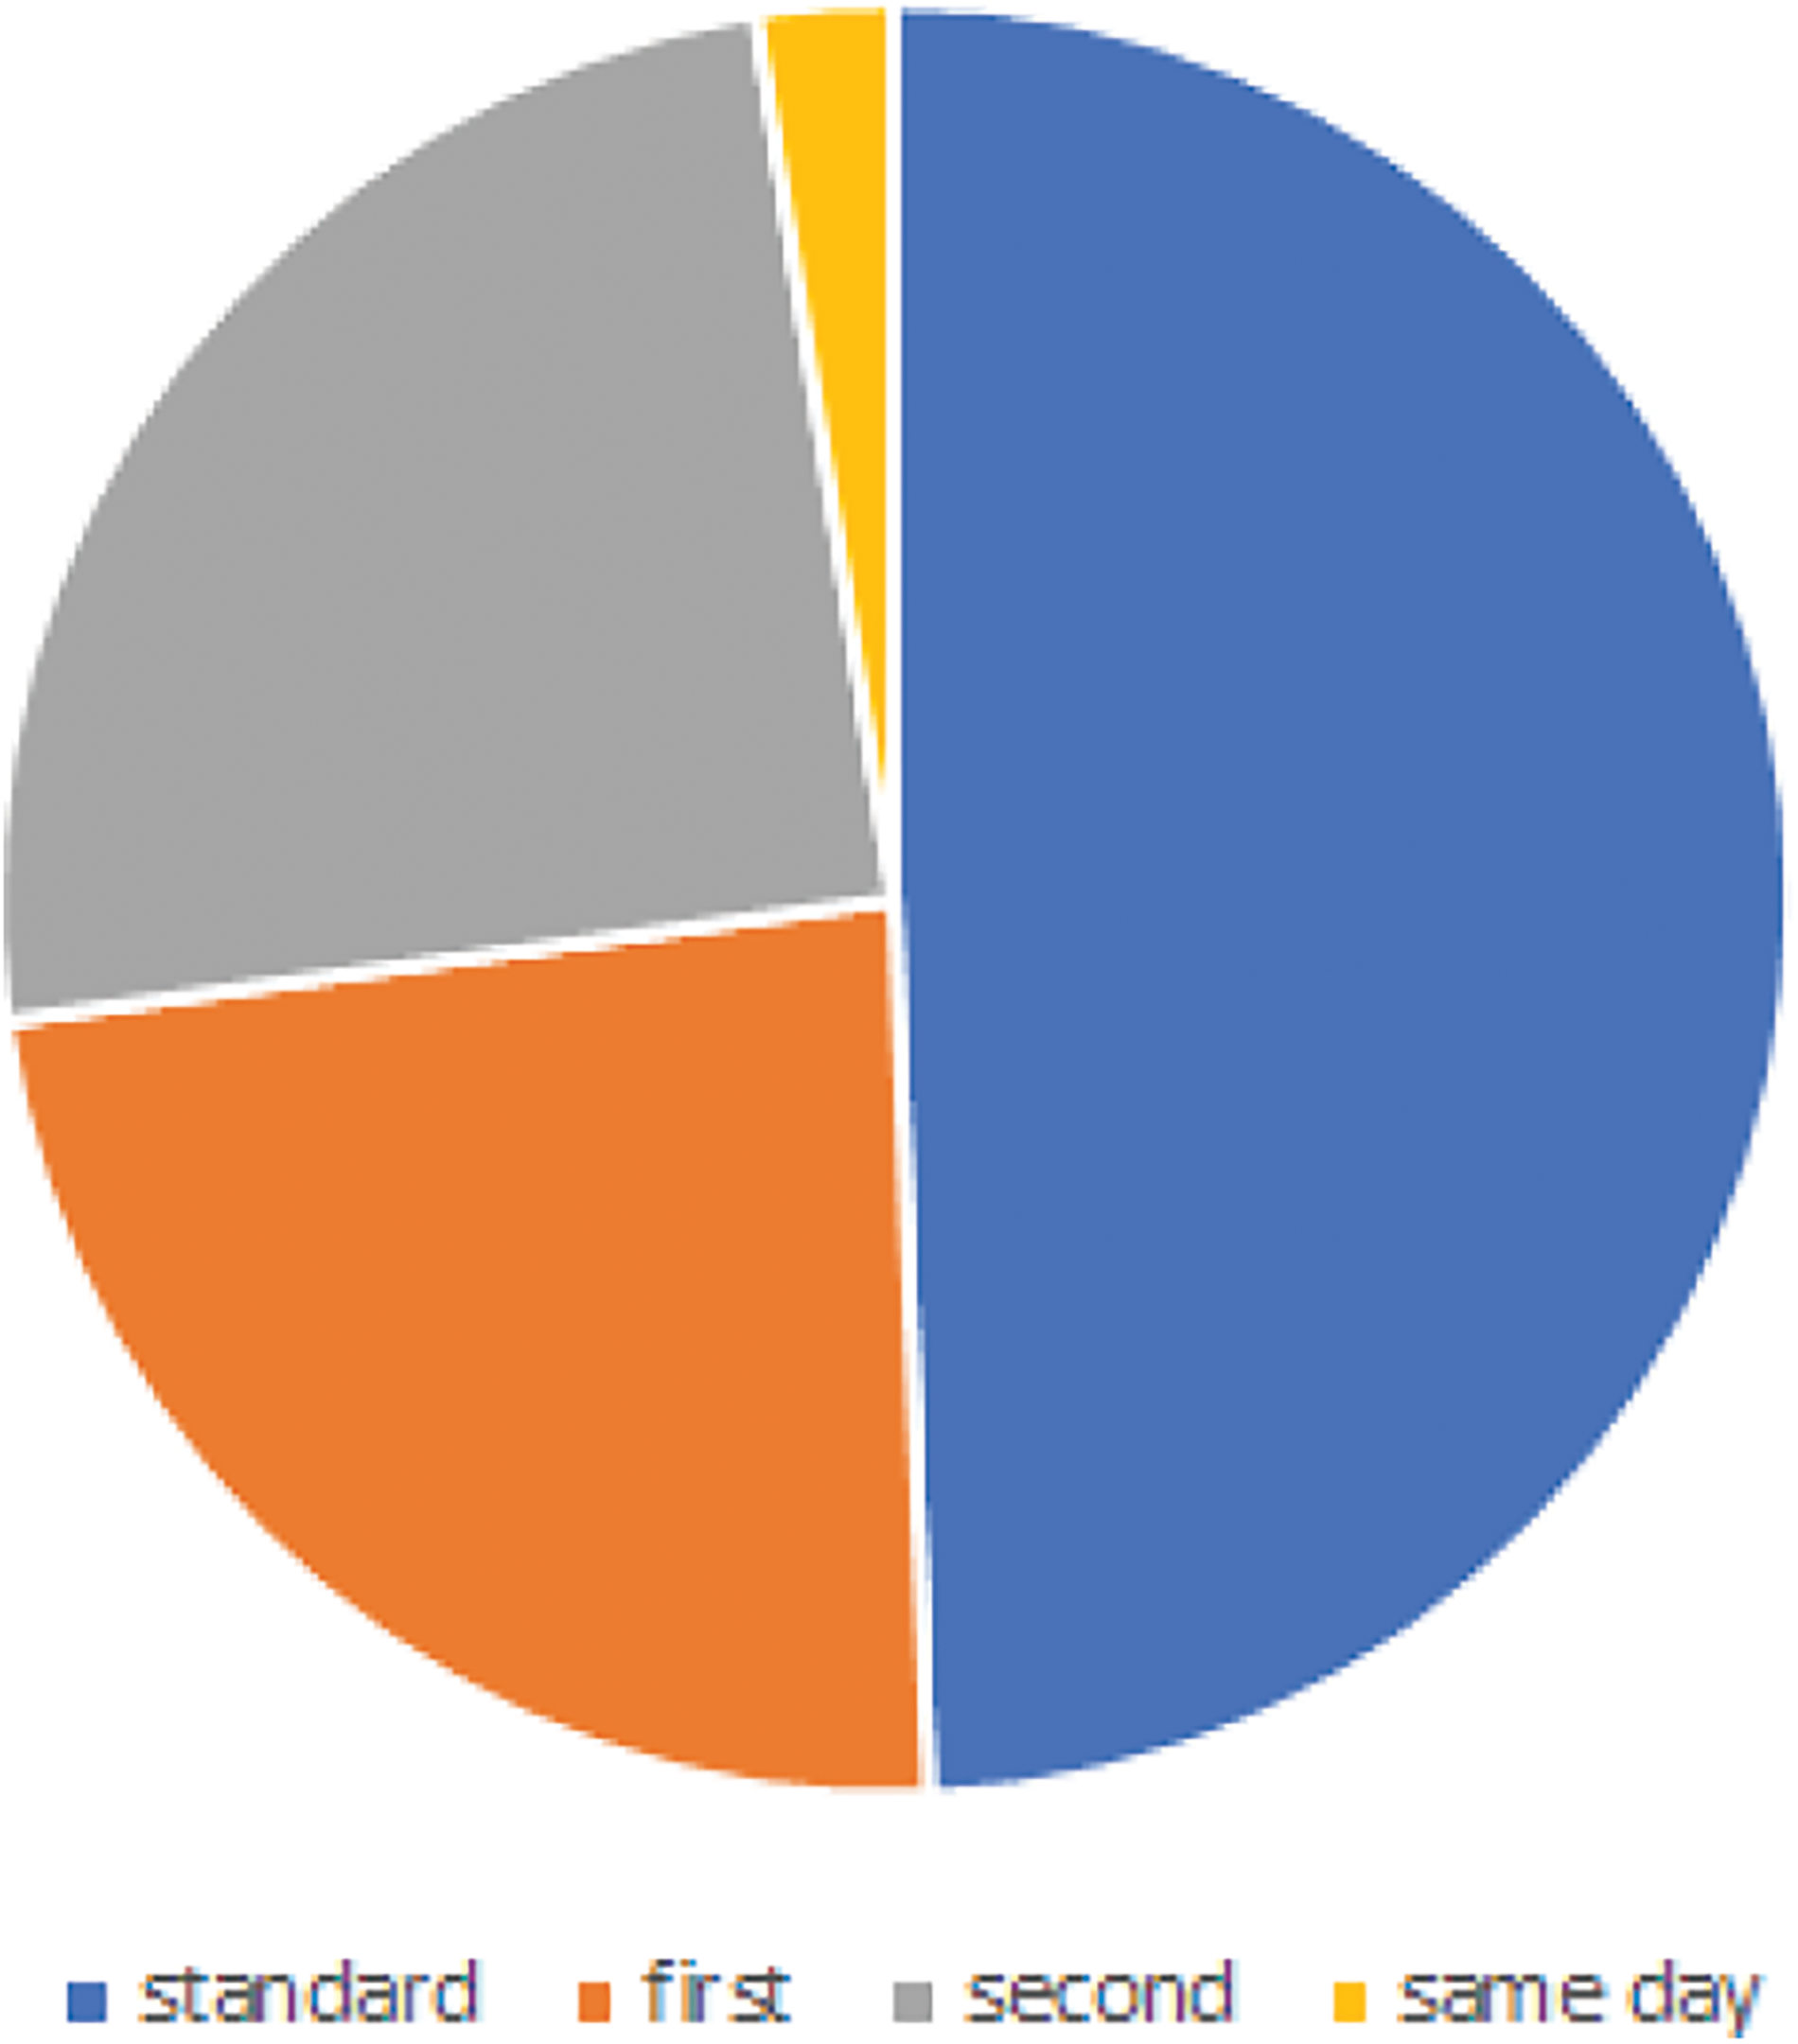
Figure 1: Shipment class distribution
The third attribute of focus is the product departments. This attribute demonstrates the distribution of the ordered products based on their categories. The attribute illustrates the customers’ preferences and answers the question of what are the most likely categories that are ordered online as individual parameters. The illustration in Fig. 2 shows that the most likely ordered products are Apparel and Golf, while the least likely ordered products are health products and beauty.
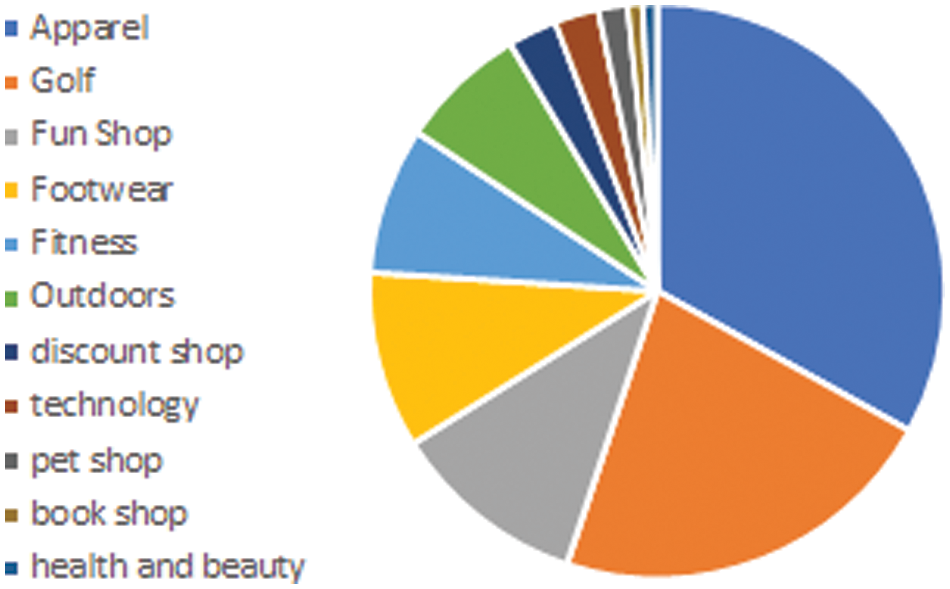
Figure 2: Department name distribution
4.2 Applying the Proposed Adapted Feature Selection PSO Algorithm (APSO)
To demonstrate the applied steps of the proposed algorithm, the following steps demonstrate one cycle of the proposed enhancement in the initial feature of (PSO), the features subsets selection stage. These steps are iteratively applied until there is no change in the features’ subsets. The weighting measures are determined and applied to the dataset as demonstrated in Table 2. The threshold has been defined to be 50%. The feature is weak significance if four out of the six measures are above the threshold, strong significance if all measures are above the threshold, and insignificant otherwise. The final results are illustrated in Table 3.
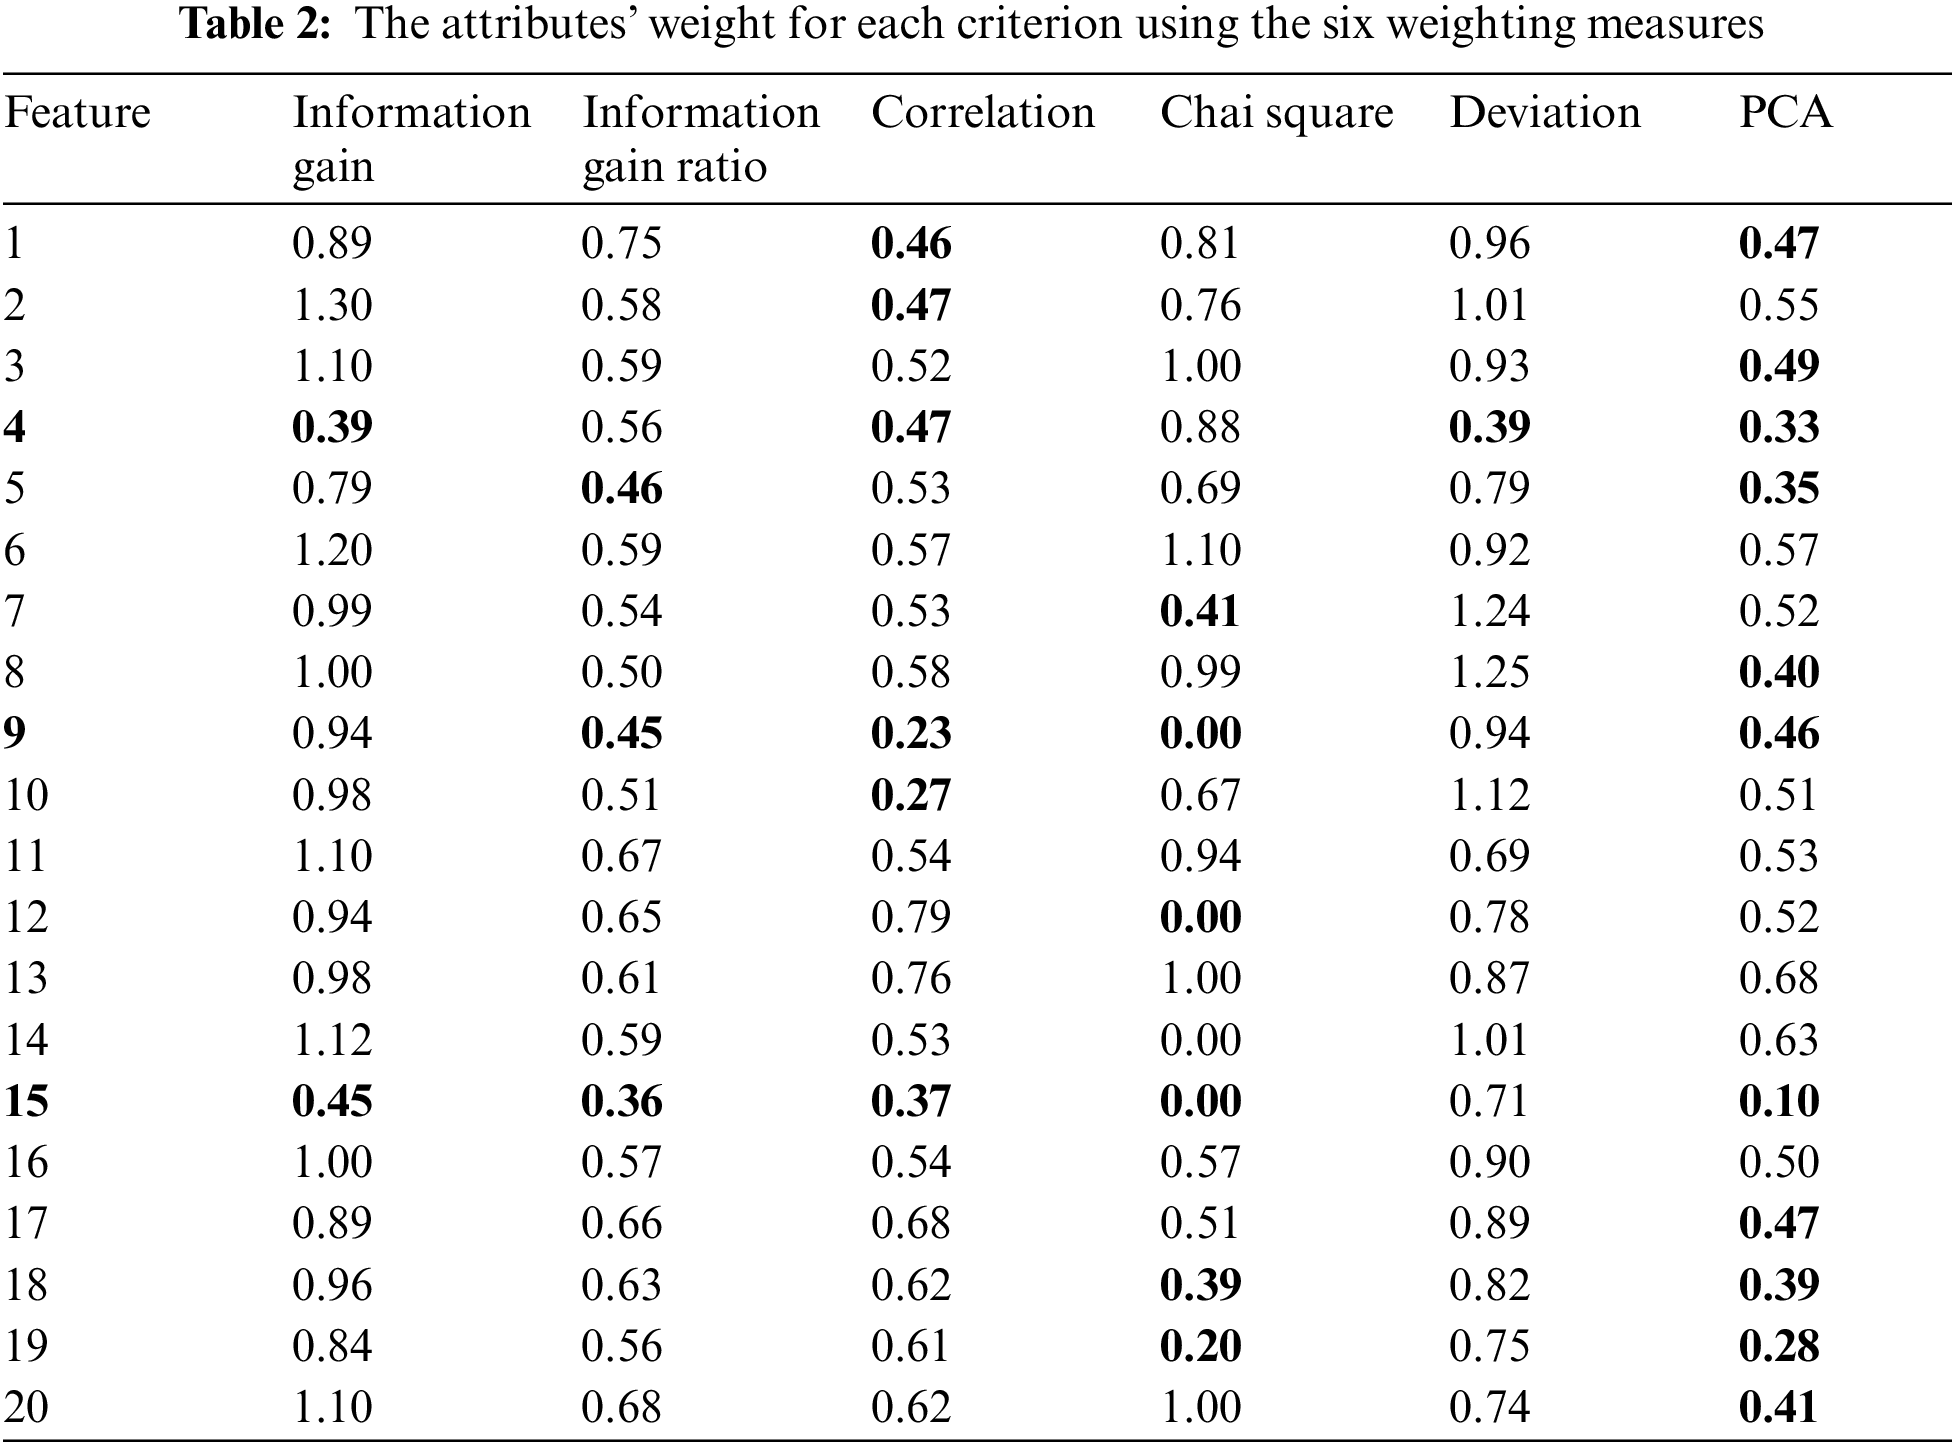
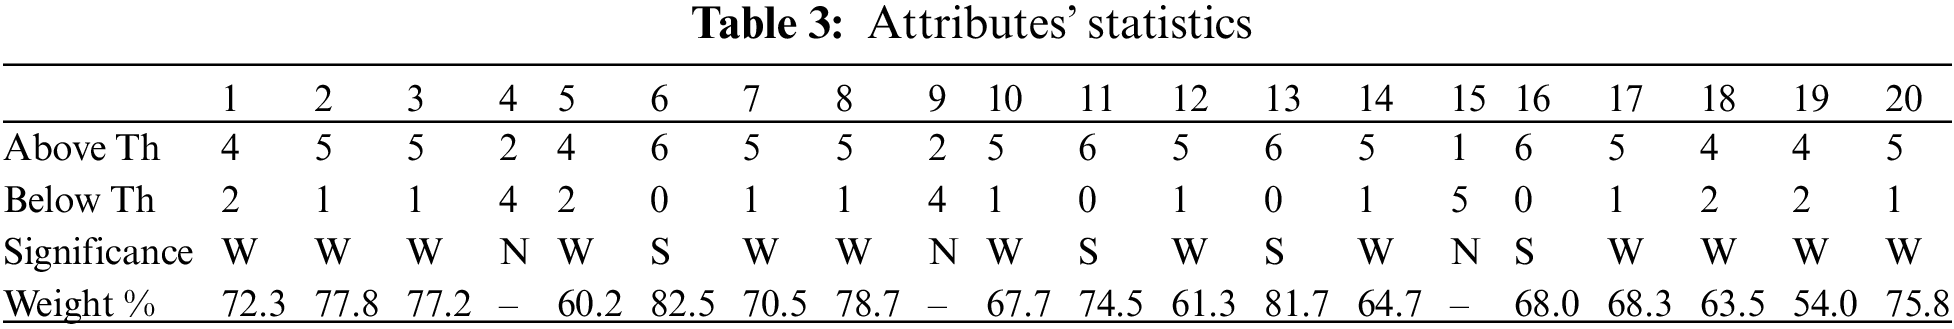
As a result, only three features will not contribute to the remaining of the experiment and are excluded in this step, they are “Customer purchase amount”, “Discount of Order”, and “Total order profit”. The average weight is calculated for all other features and then, the features are arranged in a descending order to prepare the features subsets for the next step.
To present the next step, a feature subset has been selected to apply the next step and determine the fitness value. The first five features contribute to this step. Seven of the well-known classification algorithms are determined to contribute to this step. These algorithms are selected based on the literature that confirms their high performance and variation [33]. These algorithms are Decision Tree, Random Forest, Naïve Bayes, Logistic Model Tree (LMT), K Nearest Neighbor, Support Vector Machine, and Iterative Dichotomiser 3 (ID3) algorithms.
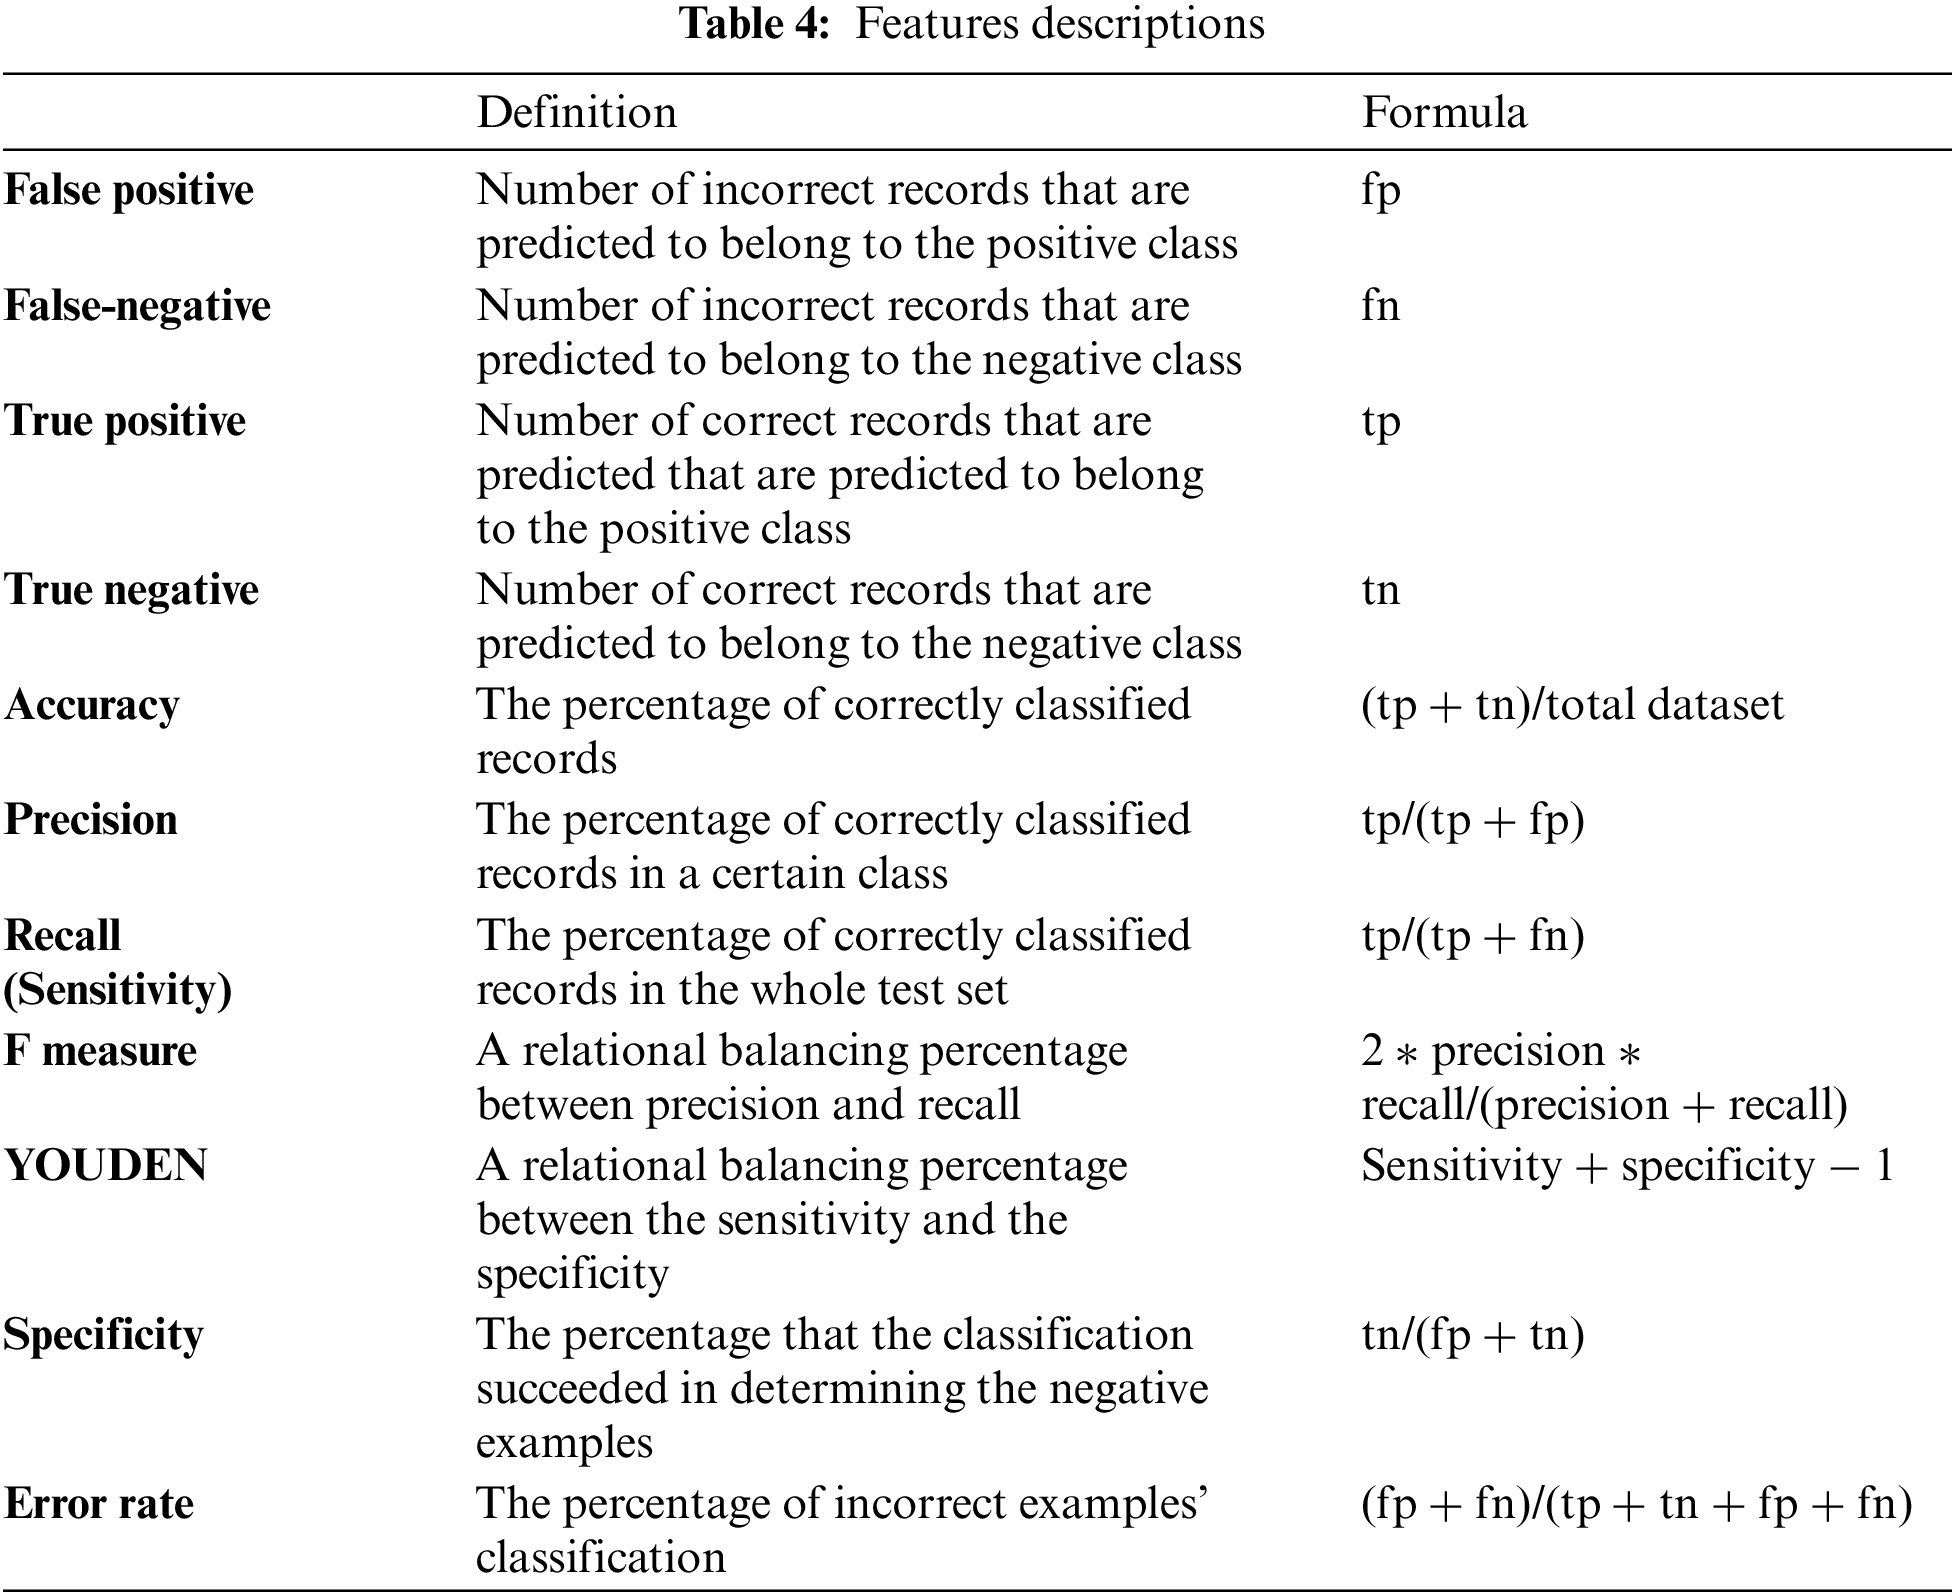
In this step, identifying the evaluation measures is vital for the classification algorithms evaluation. As discussed in the literature section [36], the most beneficial evaluation measures are determined. Table 4 presents the contributing evaluation measure and a brief description.
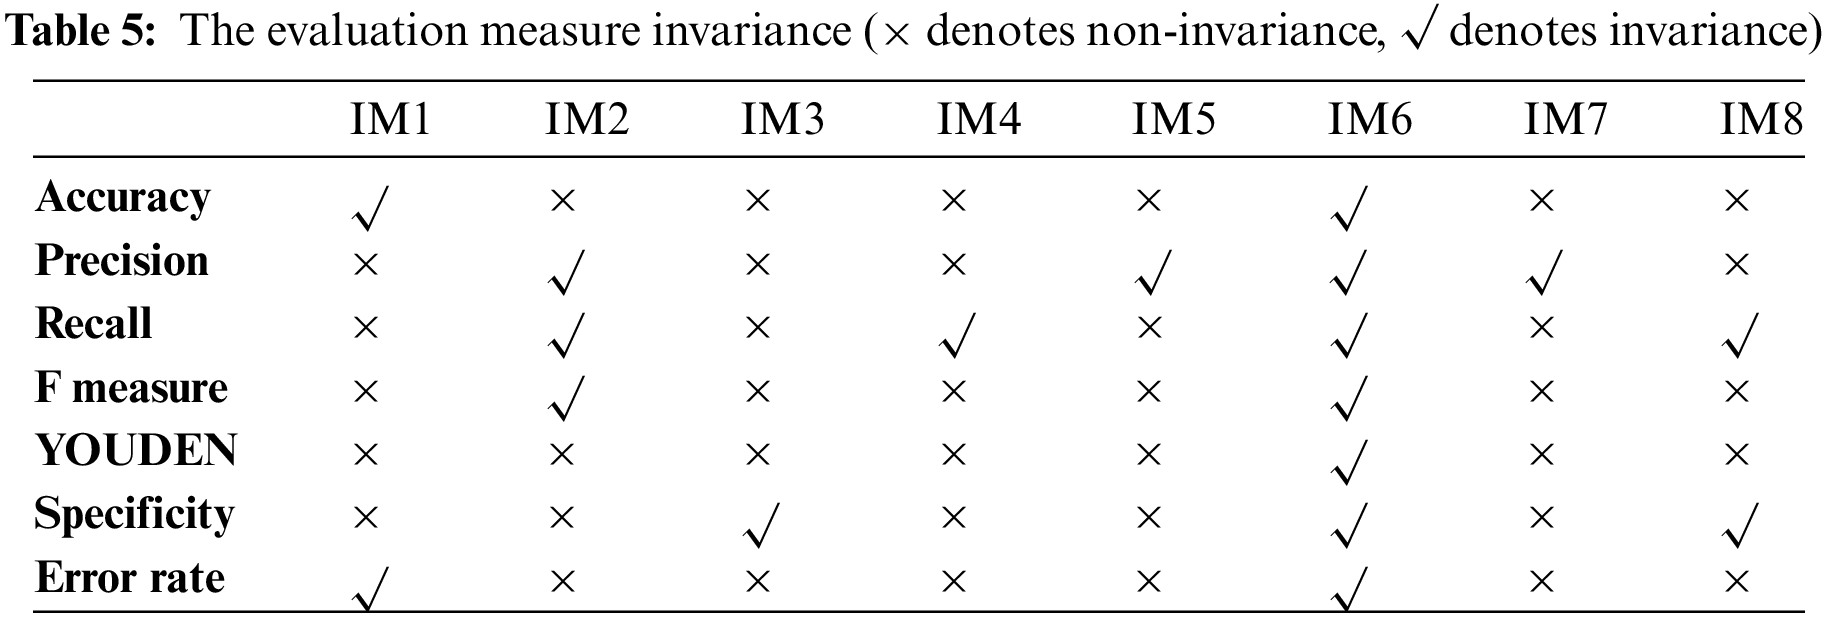
Applying the invariance measures to the contributing evaluation measures in this research resulted in the illustration in Table 5. For example, the accuracy evaluation measure follows the first and sixth invariance measures while it contradicts the remaining invariance measures.
Many researchers have confirmed that evaluating binary classification algorithms is preferred to be performed by non-invariant evaluation measures to reveal more accurate evaluation. Therefore, the final step is to set the weight for each evaluation measure based on its invariance level. The evaluation measure has 1 value for the invariance measure if it is non-invariant, and 0 otherwise. Table 6 reveals the weight for each evaluation measure according to this rule.
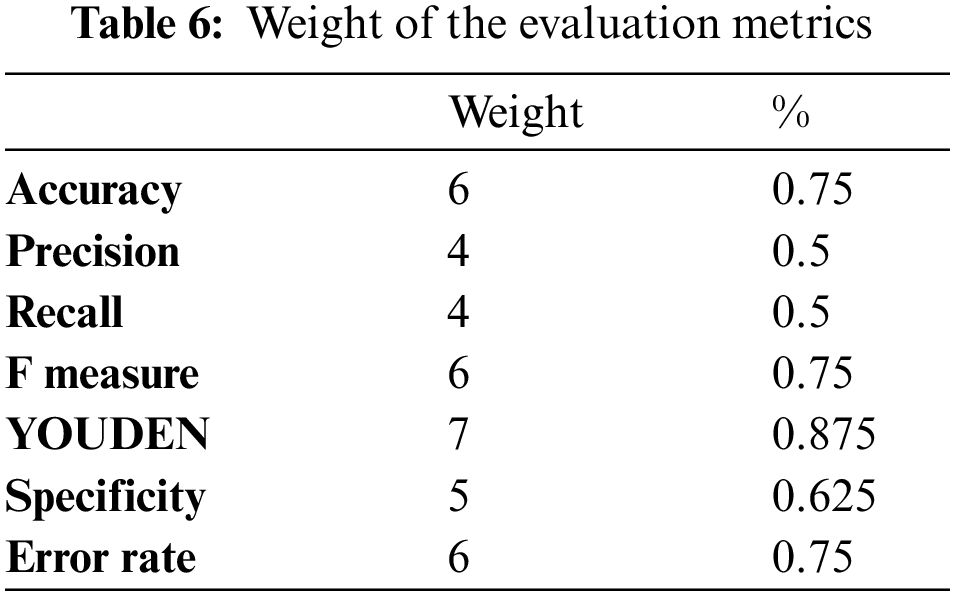
Tables 7 and 8 illustrate the final algorithms’ evaluation. This evaluation considered the evaluation measures weights. The value of the measure is multiplied by its weight to reveal the final value. For example, the accuracy of the random forest algorithm is 89.06 in the original evaluation while it is modified to be (89.06 * 0.75 = 66.795) as a final value. The evaluation results are also illustrated in Fig. 3.
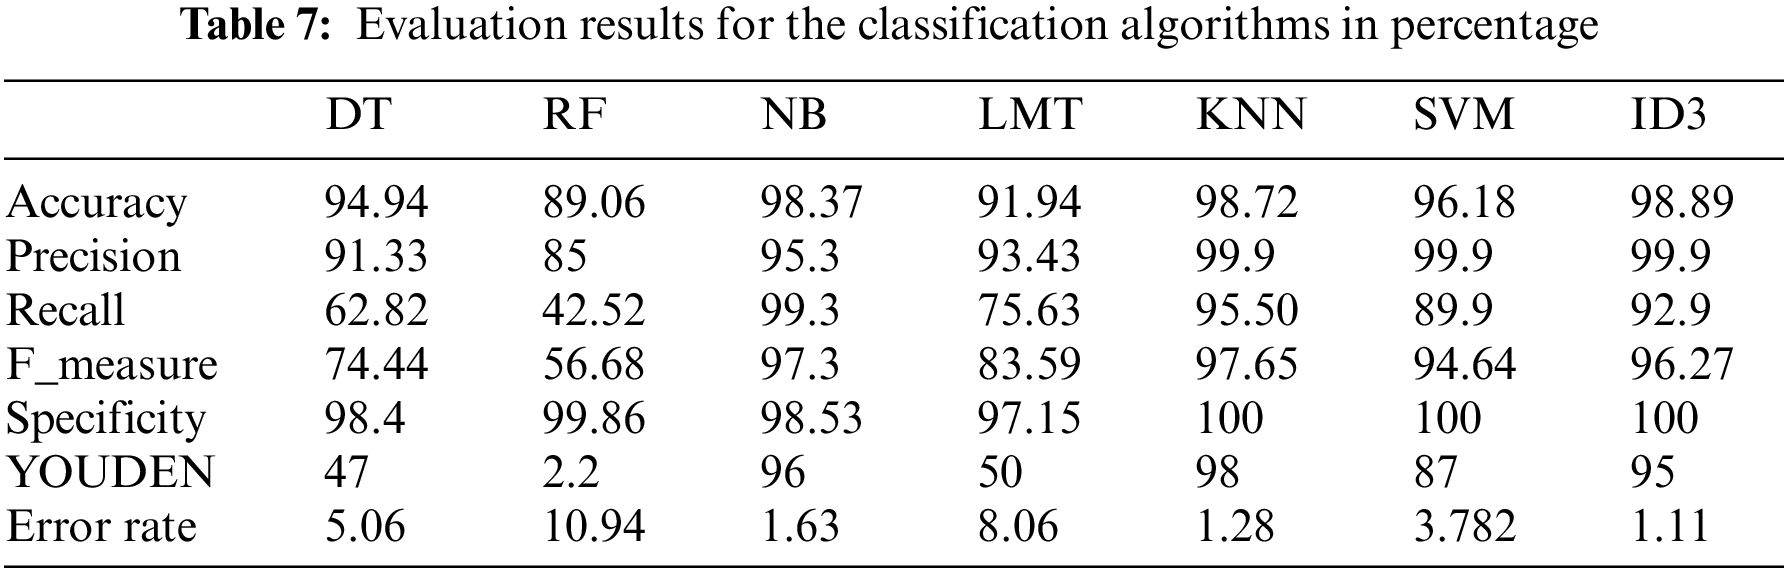
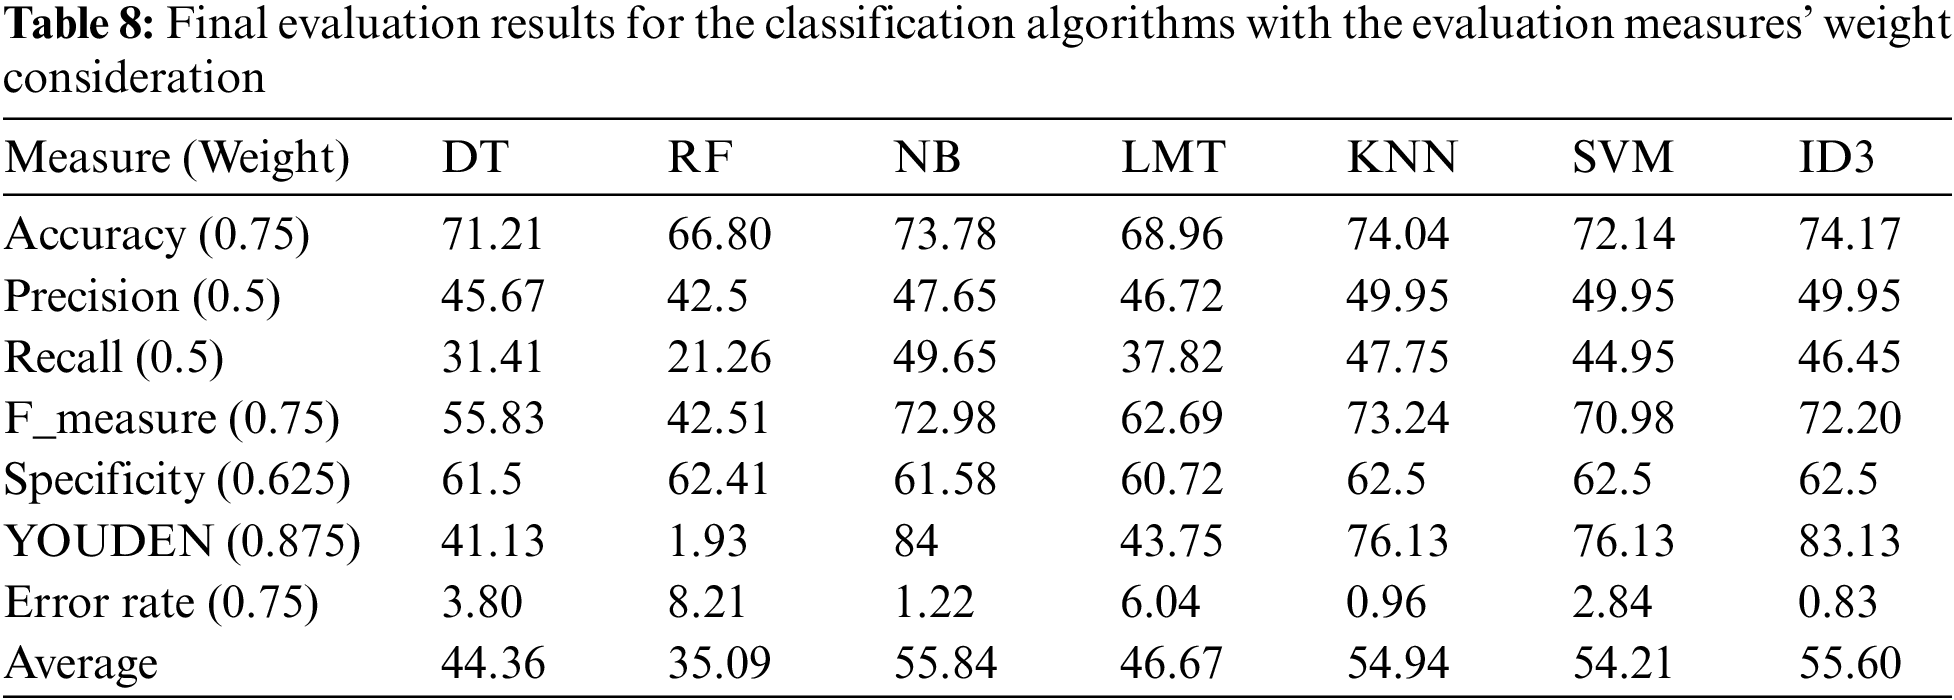
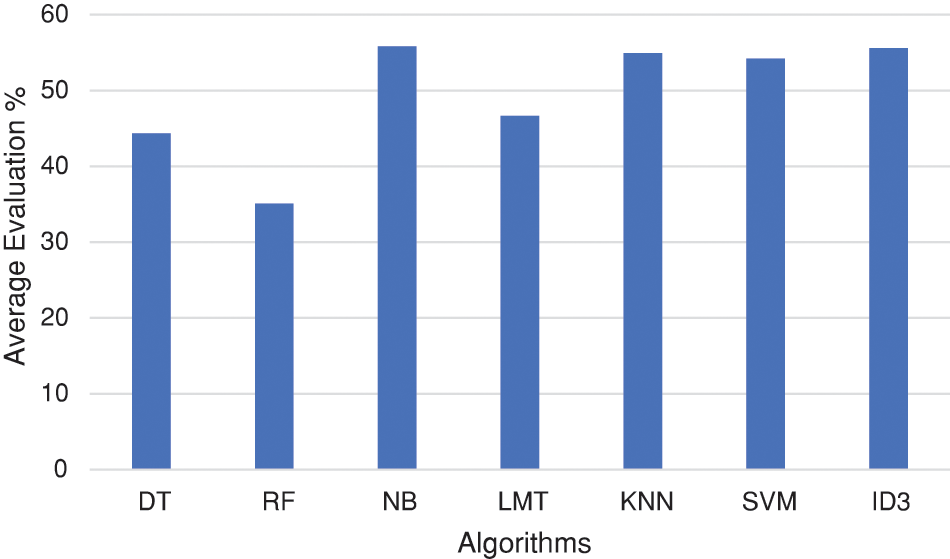
Figure 3: Average evaluation results for the classification algorithms
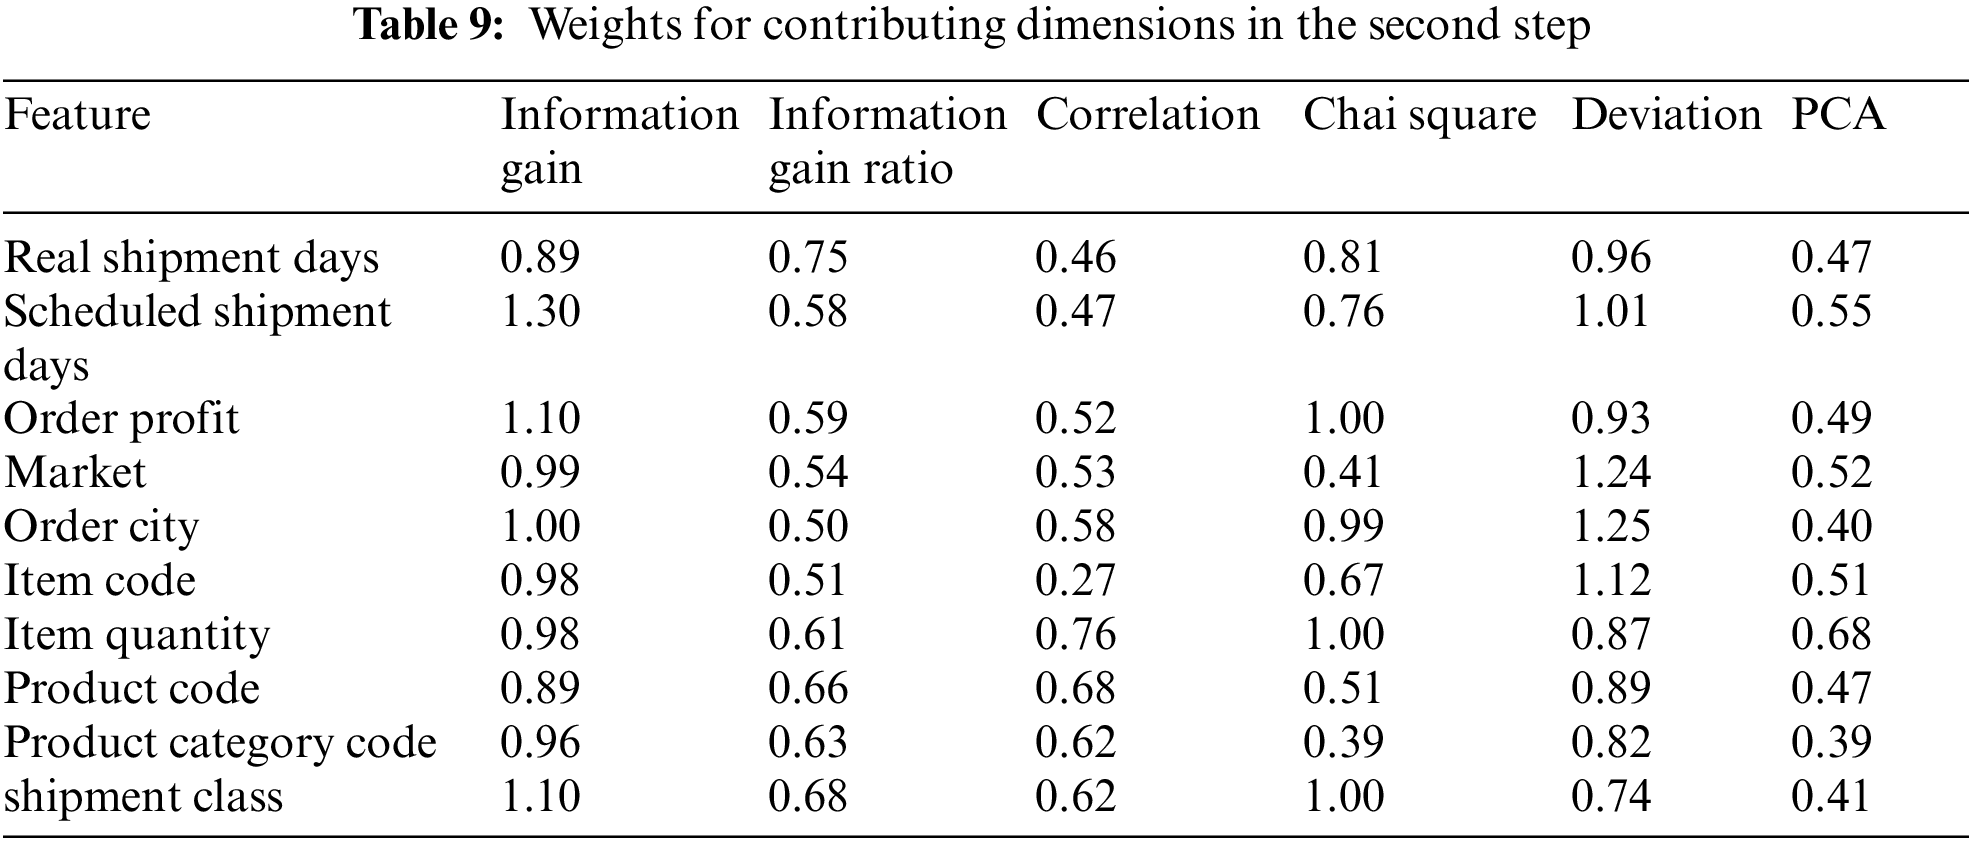
The previous discussion demonstrated the mechanism of the proposed APSO. After applying the proposed algorithm, the final feature subset includes the selected features by the proposed APSO algorithm. Ten features are determined and contributed to this stage; they are illustrated in Table 9 with their associated data.
Before proceeding to the next step of the experiment, further study for a sample of the features could be discussed. The study includes two features with different natures, one is categorical, and the other is numerical. The categorical feature is the department name. The Chi-square test is applied using R studio. The p value of the feature is determined, and the results revealed a value of 0.97 (x-squared = 3.48, df = 10, p = 97%) which highlights that the department does not affect the delivery status (see Fig. 4). This is consistent with the above results which revealed the insignificance of the department name feature to the label attribute.
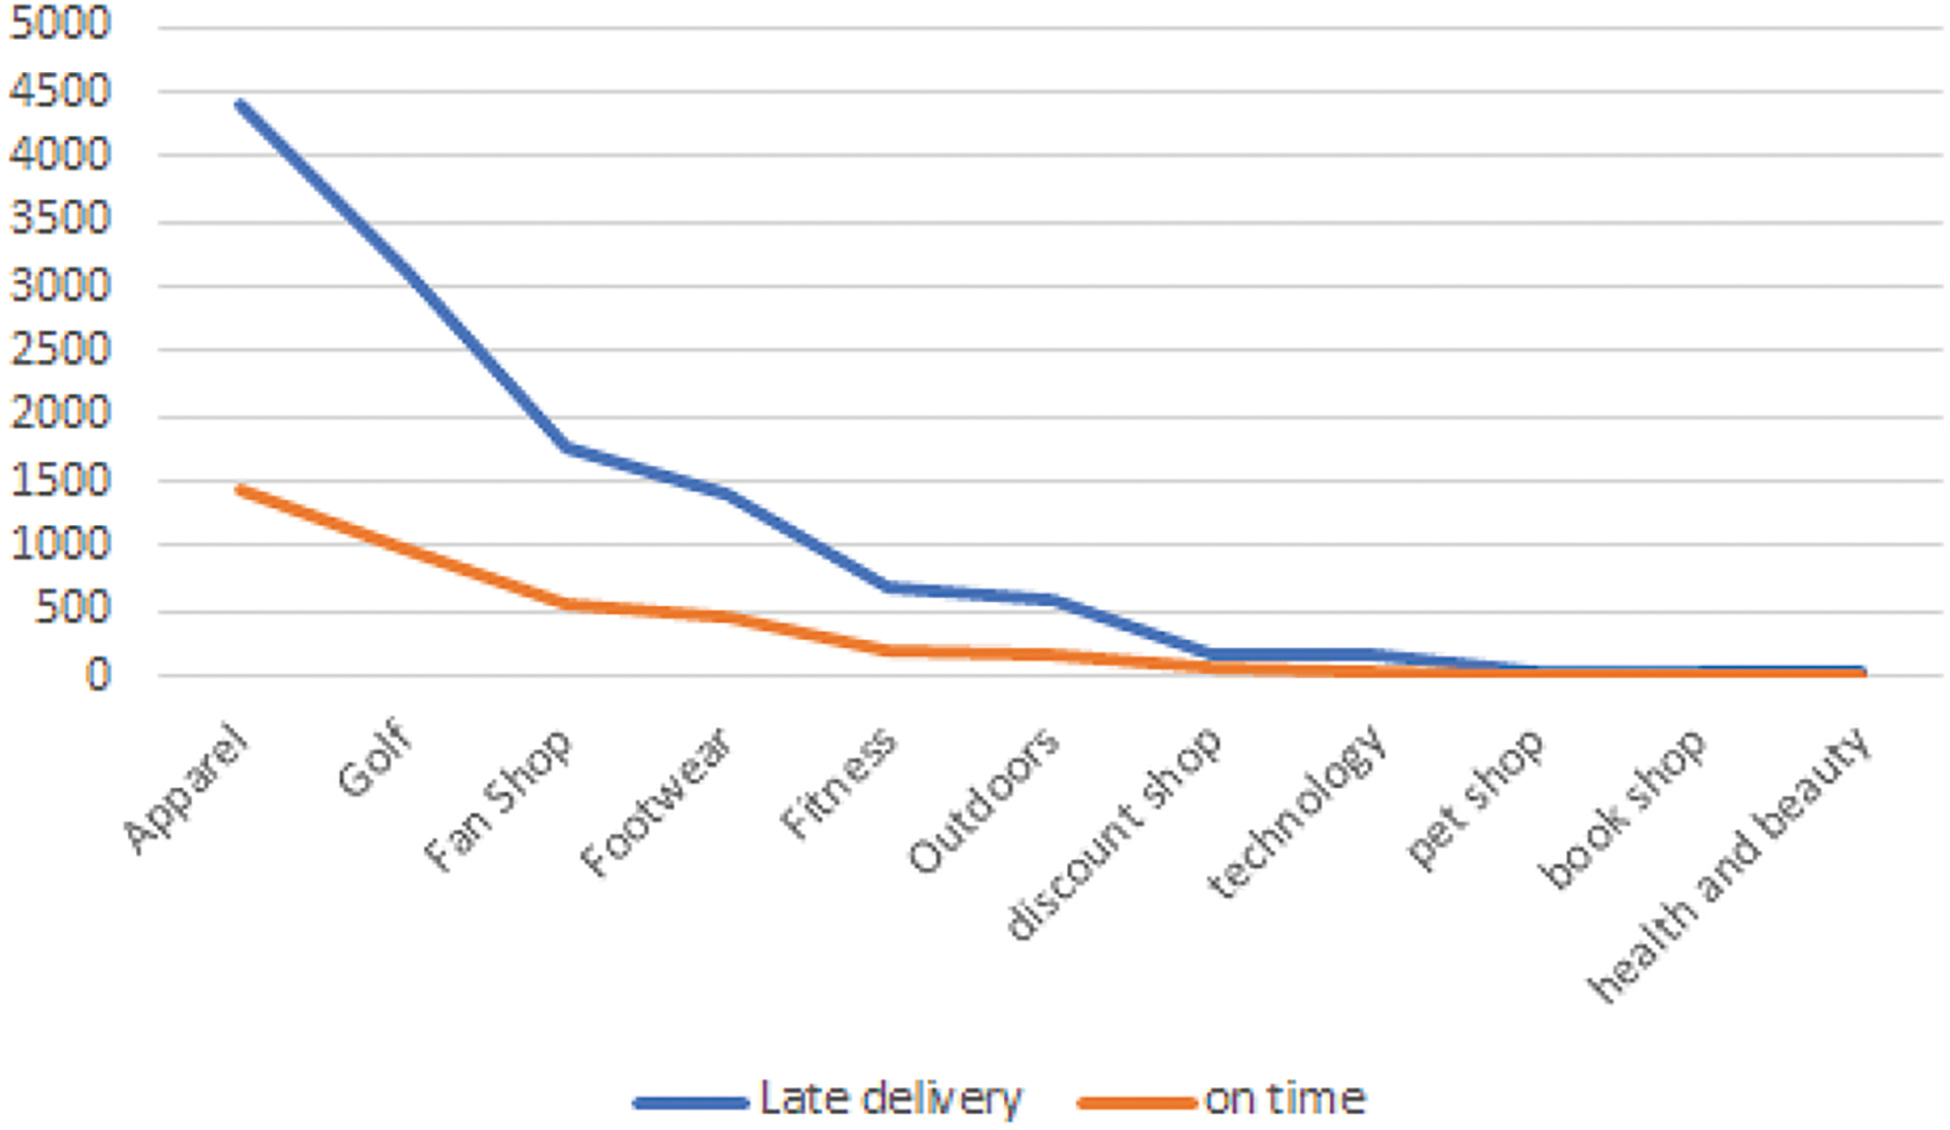
Figure 4: Department name distribution for both classes
Moving to another feature, the p-value of the shipping mode feature is determined to be equal to 2.3e16 (x-squared = 1724, df = 3, p ≈ 0.0%) which is below the threshold. This reveals that the shipping mode attribute affects the delivery status which is also consistent with the experiment results (see Fig. 5).
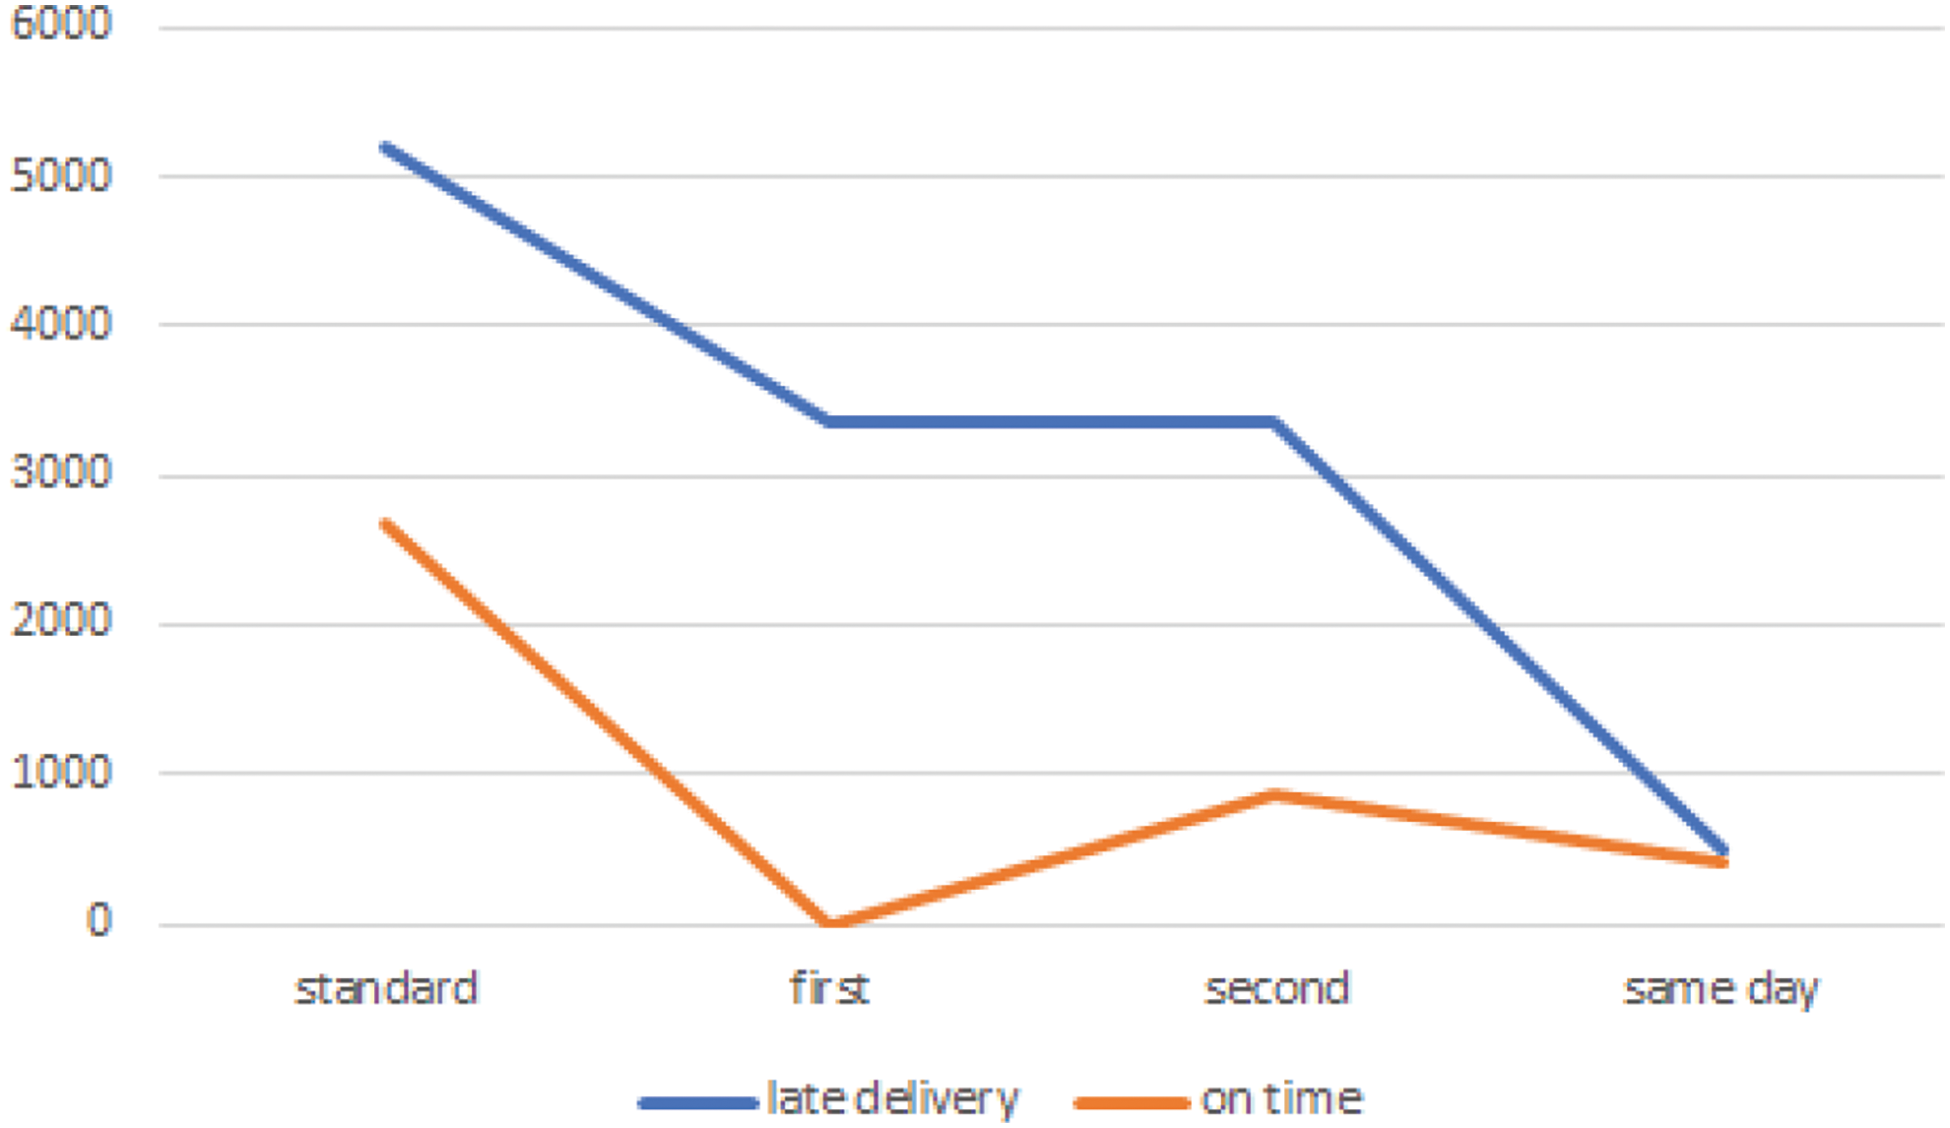
Figure 5: Shipping mode distribution for both classes
Focusing on the numerical features, comparing the scheduled days’ feature values and the actual shipment duration reveals inconsistency. The maximum actual shipment days are higher than the scheduled duration. This inconsistency reveals non-reliability in the estimated schedule time for the shipment and these features affect the delivery status (see Fig. 6). This analysis is consistent with the experiment results as both contribute to the final features subset.
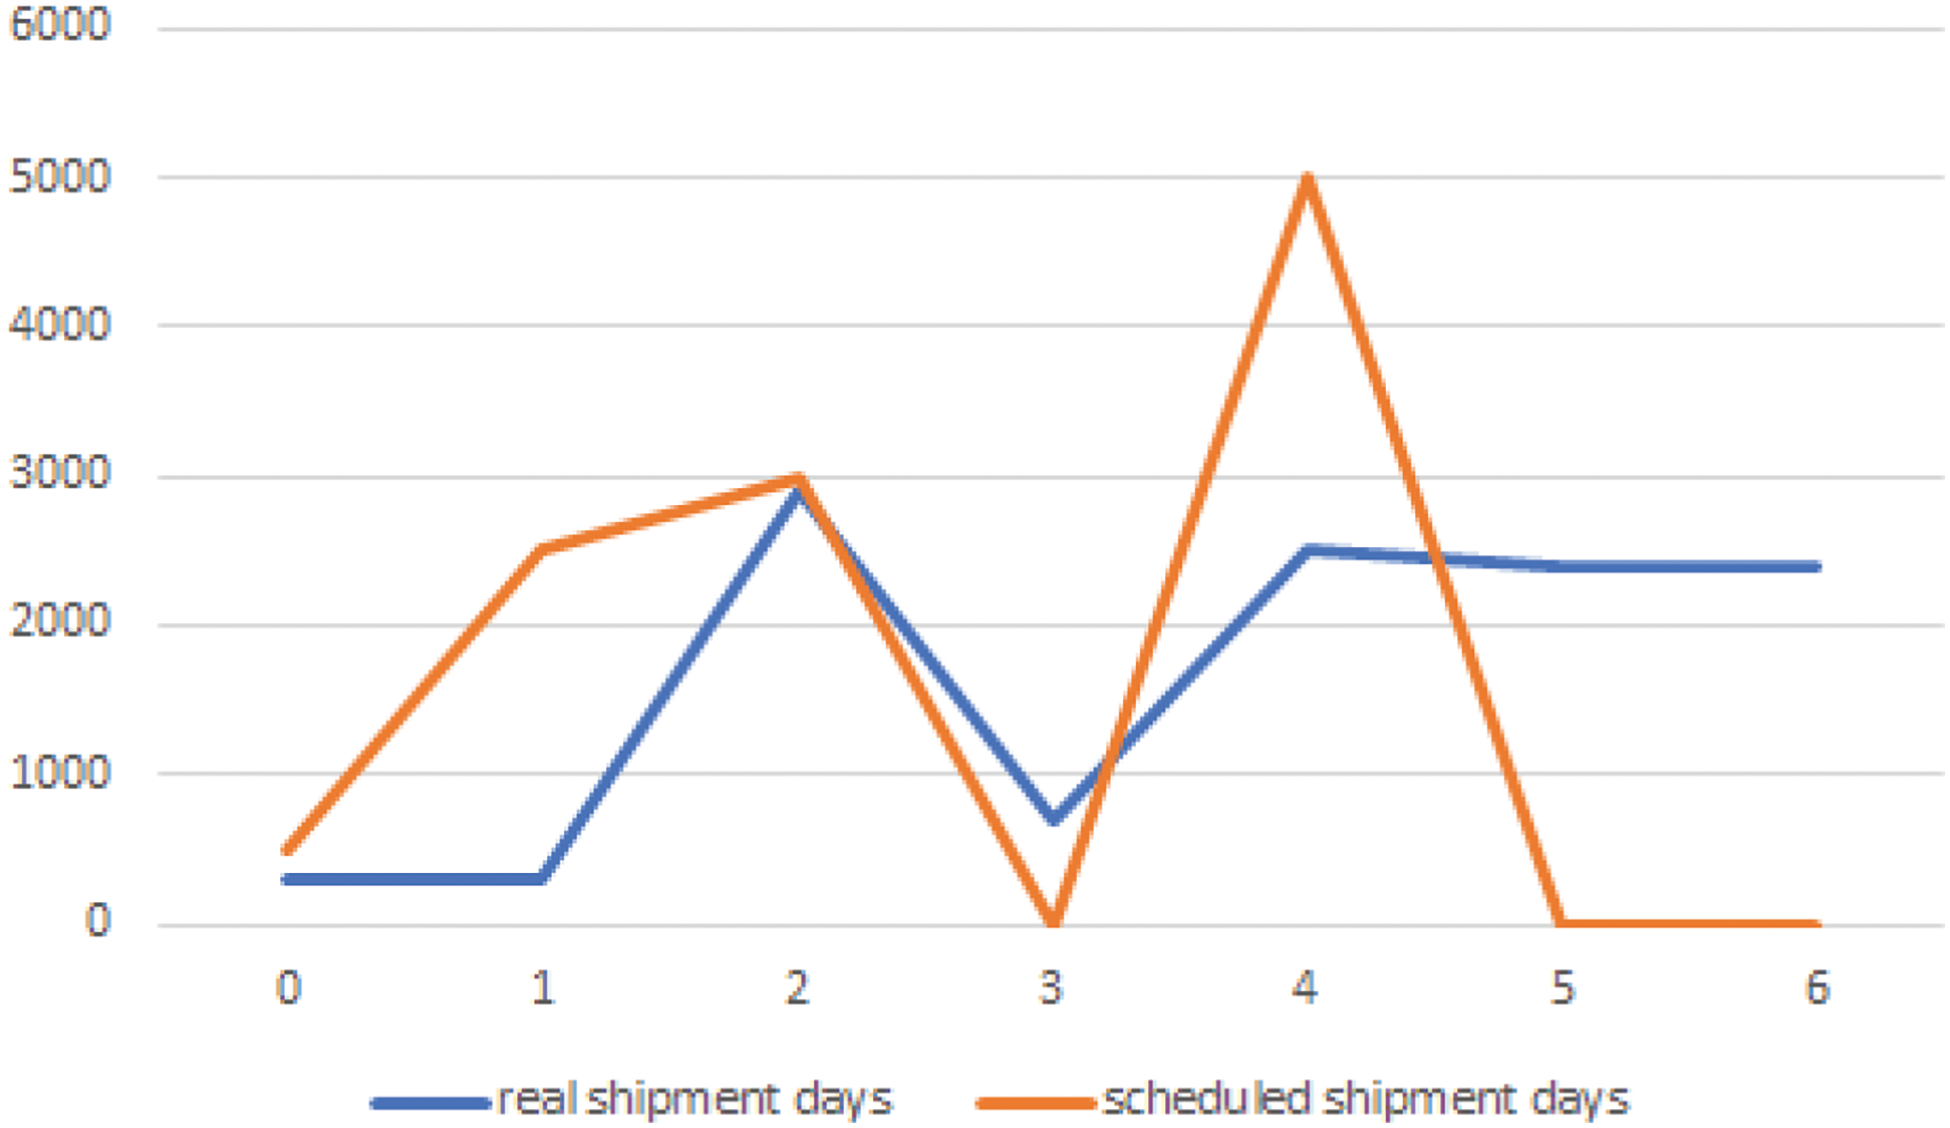
Figure 6: Line chart comparison between real and scheduled shipment days
5 Supply Chain Backlog Prediction
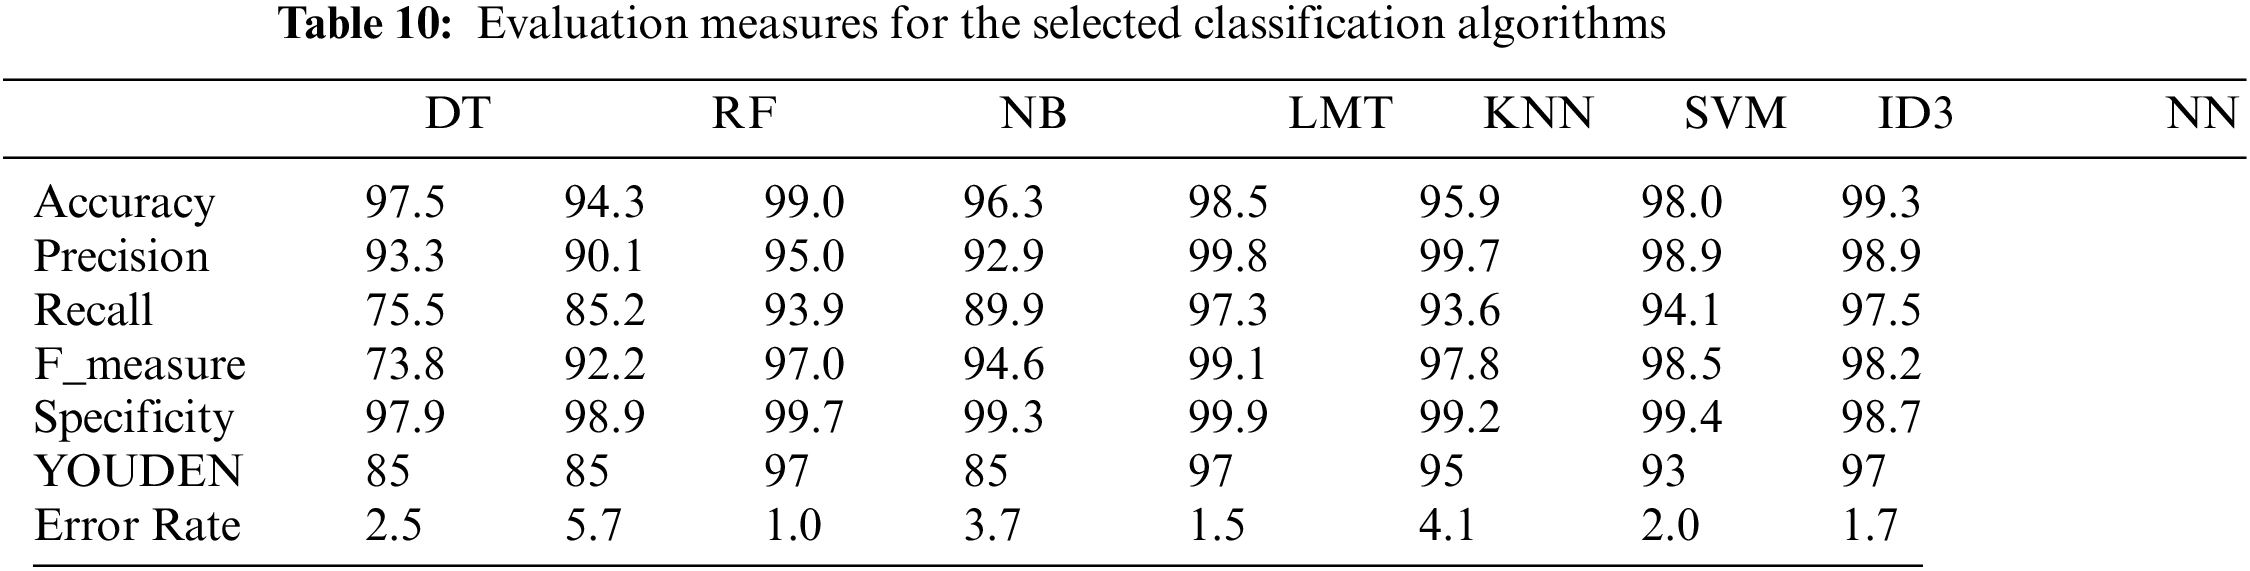
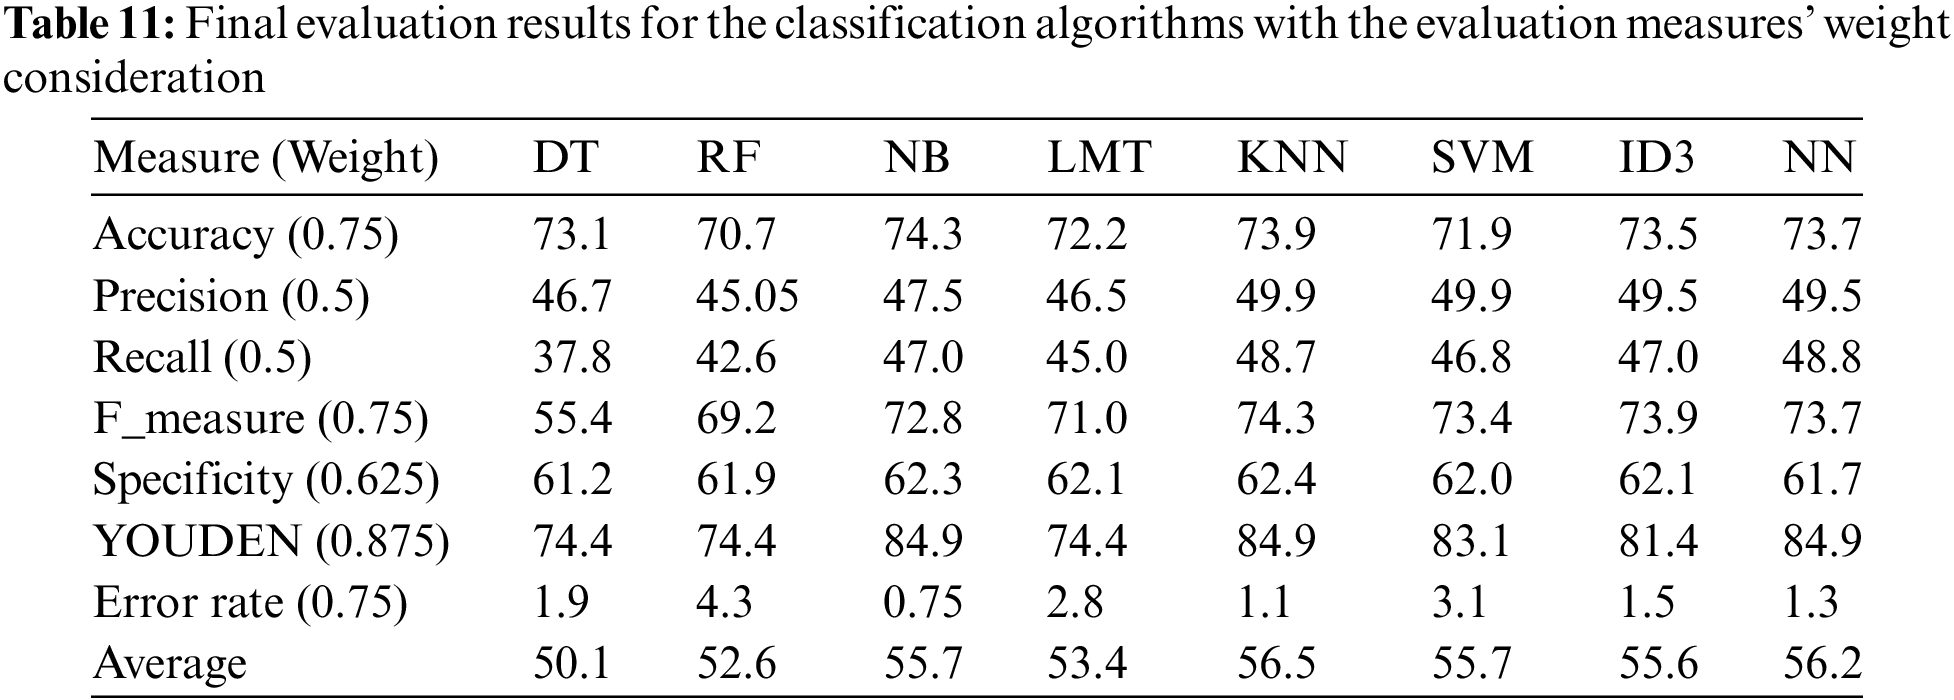
The prediction task followed the same approach as the fitness value step. However, this stage is applied with the contribution of the eight algorithms that have been applied in the testing set, the results are determined with the same approach, and the results are illustrated in Tables 10 and 11. The target of applying the evaluation approach is to confirm that the applied APSO has successfully explored the representative features that maintain high performance in the prediction task. The results reveal the success of all classification algorithms in reaching the threshold. Four out of the seven algorithms have the highest evaluation with minor upper/lower differences. They are NB, KNN, SVM, NN, and ID3. While two are slightly lower, LMT and RF, and DT is the lowest.
6 Proposed Algorithm Evaluation
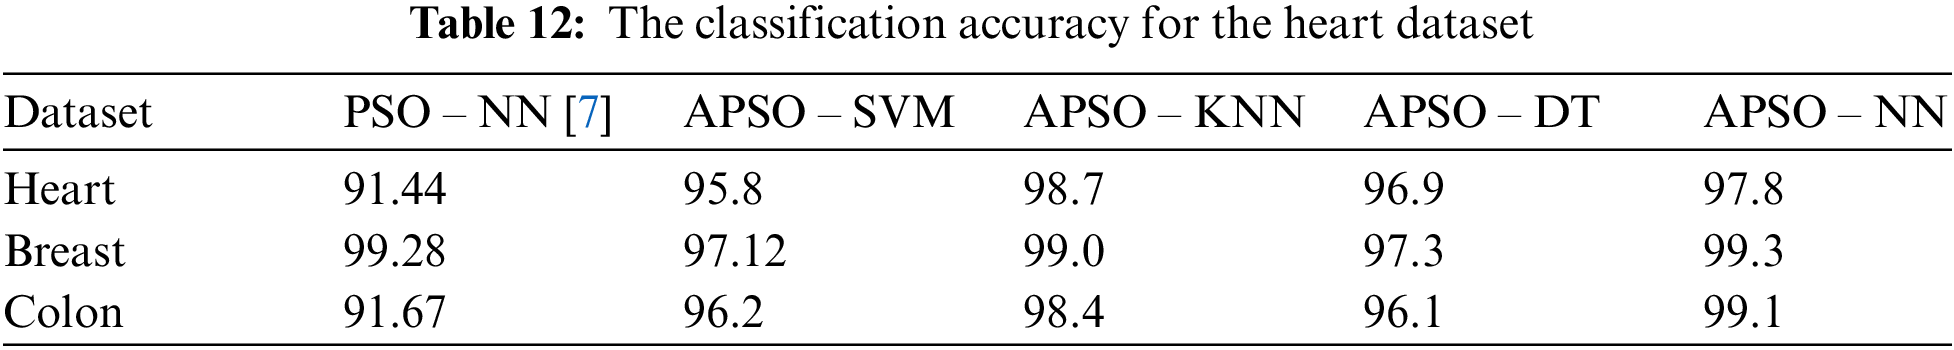
This section demonstrates a comparison between the classifications based on the proposed enhancements in the PSO algorithm with other classification tasks based on PSO algorithm adaptations that are discussed in the literature. The comparison includes the accuracy percentage of three adaptations for PSO in [5,7,8]. To provide a stable comparison, the first comparison demonstrates the results of the literature compared with the original accuracy results with no measures weighting as this was not included in other literature. The illustrated results in [7] highlight the best accuracy percentages of three algorithms including their proposed PSO adaptation. Table 12 presents the best accuracy results in [7] compared with the accuracy of the current research proposed algorithm. Moreover, the proposed adaptation is applied to eight classification algorithms over three of the datasets. These datasets are used in the evaluation [7] and produced the highest accuracy values (see Table 13). It is worth mentioning that the ovarian dataset is excluded as it produced 100% accuracy for all algorithms which does not provide any indication to the comparison process.
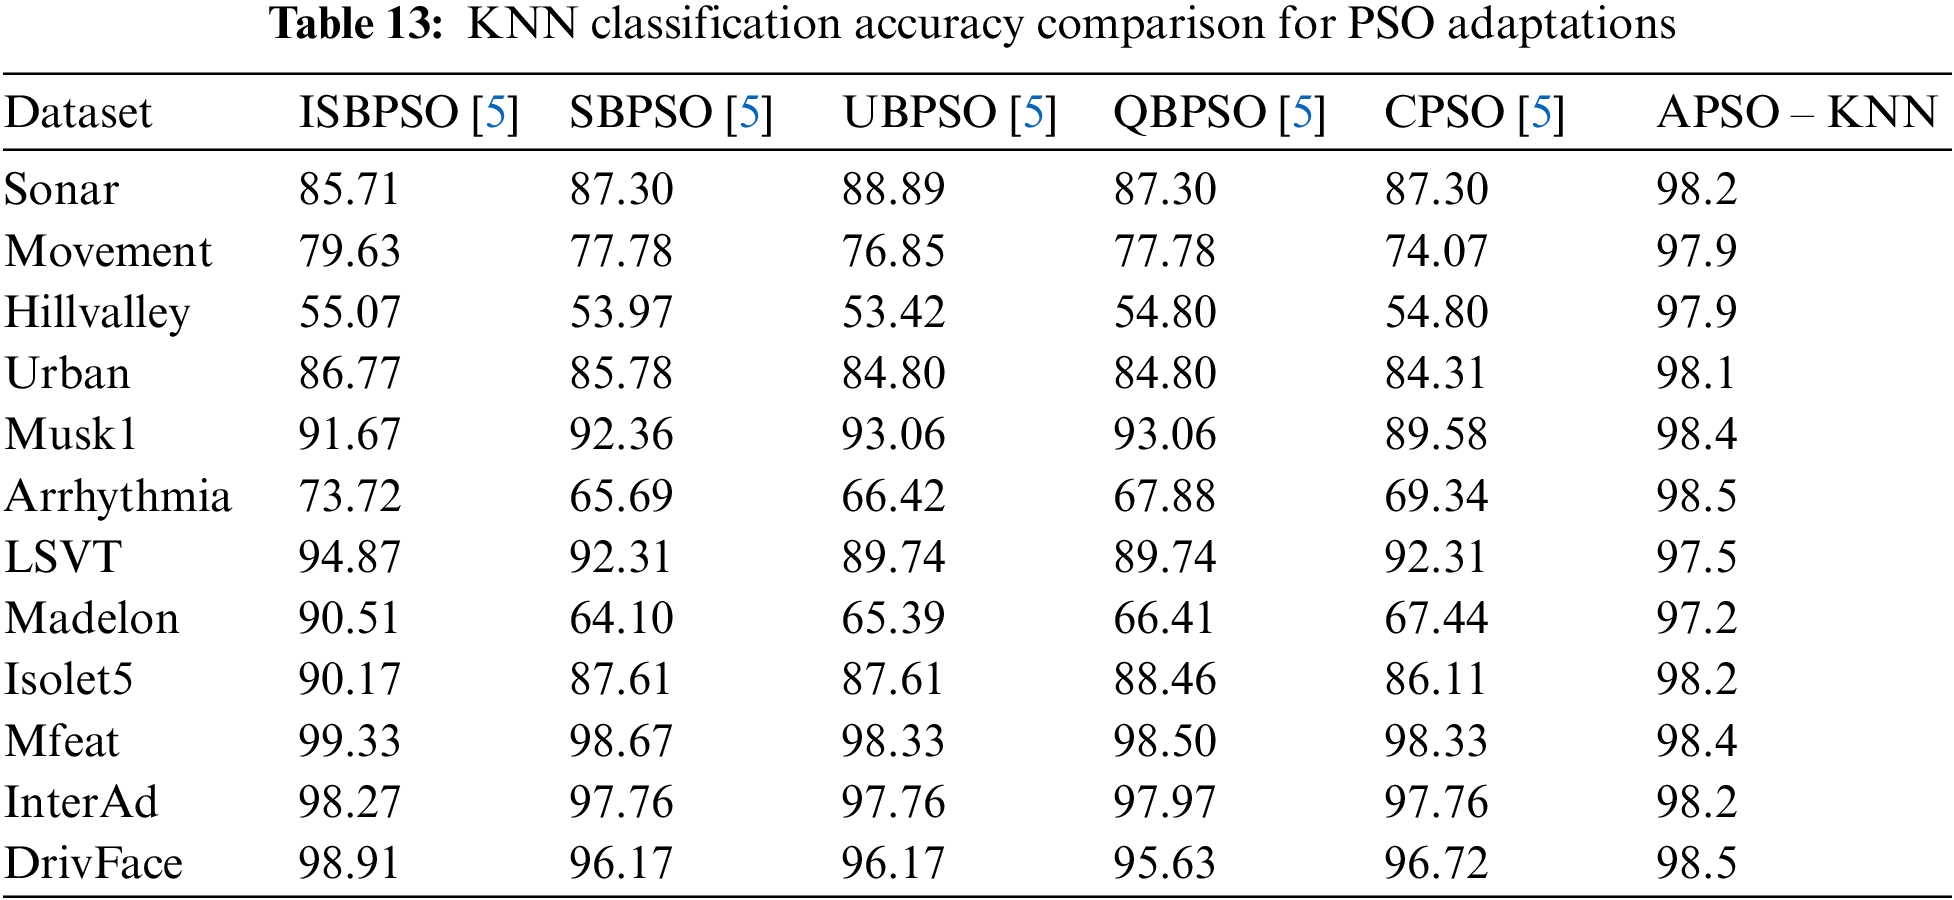
Another comparison is performed with [5]. The research [5] presented the best accuracy results of different adaptations of PSO with KNN classification algorithm. The evaluation included twelve datasets. The proposed adaptation is applied to the twelve datasets with KNN classifier and the results are illustrated in Table 13.
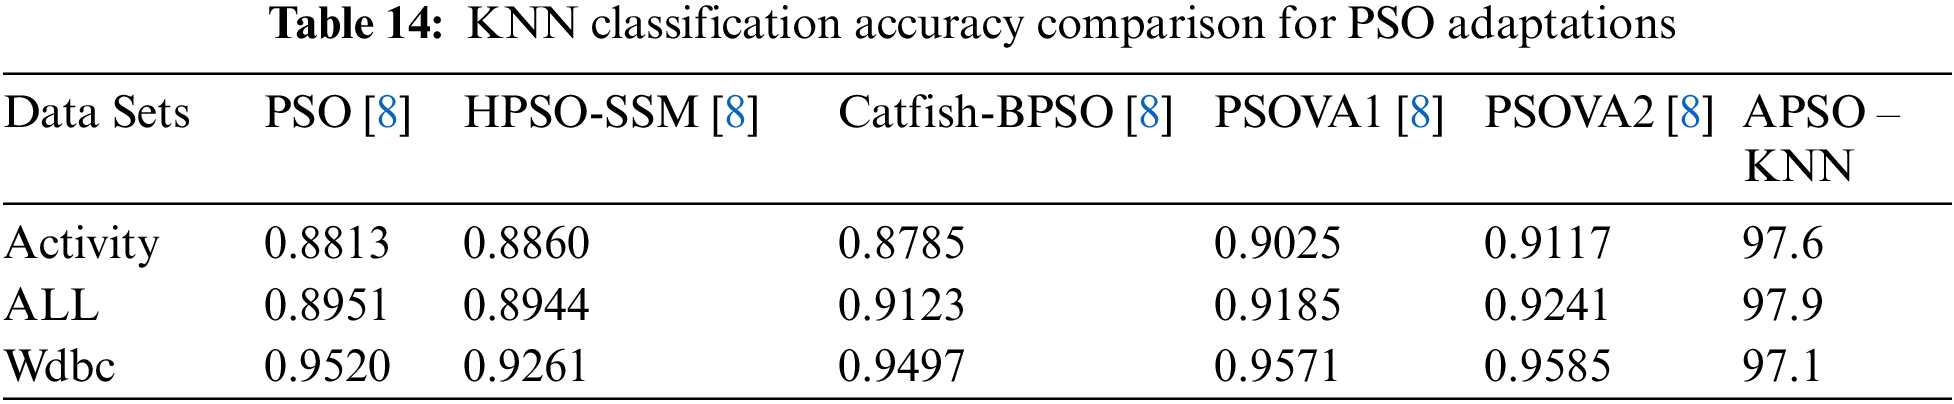
More comparison is performed with [8] which the best accuracy results of different adaptations of PSO with KNN classification algorithm. The evaluation included twelve datasets. The proposed adaptation is applied to three of the included datasets with KNN classifier and the results are illustrated in Table 14.
7 Findings Analysis and Discussion
The presented comparisons between ASPO and the state of the art have clearly shown that the proposed is more effective in increasing the performance in the search task that yields a higher accuracy in selecting the most significant features with a higher fitness value. The results have shown the positive contribution in most of the experiments to the systematic starting point rather than the randomness approach that is followed by the state of the art even with a minimum enhancement such as the comparison with [7]. This situation has resulted from the methodology of the prior contribution of the higher significant feature in the earlier particles. The advances of APSO have also resulted in stopping the least significant features from further contributing to the particles which resulted in enhancing the search space. From another perspective, the proposed method gradually confirms partial confirmation to the selected features’ set during the evolutionary process rather than at the end of the process. Once a feature is confirmed, there is no need for more effort by the optimizer to evolve the feature. This strategy simplifies the search space as the particle learns from the features’ significance which consequently results in a significance decrease in the swarm diversity. Moreover, The results also show the APSO stability in the accuracy results compared with the state of the art such as ISBPSO [5] which shows low accuracy results in the lower dimensions datasets. One of the reasons for the advancement of APSO is its consideration of the semantic relation among the features compared with ISBPSO which neglects this relation which leads to inaccurate information in initializing the particle. Another drawback of the state of the art is the possibility of precedence elimination of the features before selection in case they are not randomly selected by all the particles. This situation may lead to eliminating significant features before examination. Moreover, the proposed model proved its advancement over the research [8]. The current research method is a more accurate computation compared with the following aggregation methodology in [8] of the local and global optimal. The adaptation in [8] suffers from un-preserving the diversity in the search space and moving towards the stagnant optima over the particles. The alternative adaptation in [8] overcame this drawback by providing alternative search mechanisms, however, it may lead to conflicting solutions that eliminate reaching the optimal.
This research focuses on one of the most successful optimization algorithms which is Particle Swarm Optimization (PSO). PSO has proved its effectiveness in exploring the highest influencing features in the search space based on its fast convergence and the ability to utilize a small set of parameters in the search task. One of the main bottlenecks affecting the PSO performance is the randomness of the process in searching the data space. This randomness has been a main reason for performance degradation in one direction as well as lacking the ability to reach the local optima. This research proposes an effective enhancement of PSO that tackles the challenge of randomness search as one of the vital aspects that directly affects PSO performance. The proposed enhancement includes an approach in a systematic search strategy that reduces the search space in one direction and the computation time in another direction. The research proposes a method to identify the particle under examination based on the contribution of the feature in the dataset by moving the highly influencing features for early examination while introducing a novel collaborative approach of a set of weighting methods. The fitness value is also adapted by introducing the collaboration of a set of algorithms for measuring the performance. The evaluation is performed by applying a novel method that determines the evaluation measures invariance level and tackles its effectiveness in correctly evaluating the results.
According to the conducted experiments, the proposed adaptation outperformed other machine learning techniques. The experiment succeeded in confirming the applicability of the proposed adaptation for PSO and reaching the business goal with a minimum accuracy percentage equal to 94.3% for Random Forest and a maximum of 99.3 for Neural Networks. The proposed adaptation has been compared with other proposed adaptations in the previous research. Three previous research have contributed to the comparison task and the comparison results have revealed the advancement of the current research’s successful adaptation. The current research tackled two main enhancements. First, the randomness of the examination has been eliminated by the proposed systematic method in engaging the features in the particle. The proposed adaptation was successful in exploring the semantic relationship between the features which successfully provided earlier elimination with no exhaustive examination. Second, the success of the proposed adaptation in accurate evaluation for the fitness value to reach higher accuracy in the selection process. The comparison with the literature revealed an accuracy enhancement when applying the proposed adaptation for different datasets with different features’ granularity.
On the other hand, focusing on the business objective of this research, this research proposed an intelligent framework for early prediction of order delay and eliminating order backlogs which could be considered as an efficient potential solution for raining the supply chain performance. The business contribution of this research is the early prediction of order delays using the proposed model. Moreover, exploring the significant factors for order delays while identifying the significance of polarity and effect level is accomplished. The adapted PSO swarm intelligence optimization technique is utilized for this objective to ensure high performance. Recommendations for avoiding delivery delay are endorsed according to the explored features which ensure delivery fulfillment on time and attain the customers’ satisfaction. The proposed framework is generic and could be applied to any type of delivery phase or product category in any supply chain.
Future research could focus on other swarm algorithms to confirm the proposed approach’s applicability and generality as the concept of search could be utilized for other aspects. Investigating if the selection of the contributing measures and algorithms could be a parameter for results variation. This direction could be investigated to ensure the method’s generality and applicability in different situations. There is still room for further investigation in handling the exponential growth of the data dimensionality which increases the search space despite the data irrelevance. The current research focused on the supply chain backlog while more fields could have beneficial results from the proposed adaptation, therefore, applying the proposed adaptation to other fields. Additionally, considering different chains in the supply chain and including other diversity of parameters could confirm the generality.
Acknowledgement: The authors thank the University of Jeddah for its technical and financial support.
Funding Statement: This work was funded by the University of Jeddah, Jeddah, Saudi Arabia, under Grant No. (UJ-23-DR-26). Therefore, the authors thank the University of Jeddah for its technical and financial support.
Author Contributions: The authors confirm contribution to the paper as follows: Study conception and design: Yasser Hachaichi, Ayman E. Khedr, Amira M. Idrees; data collection: Yasser Hachaichi, Ayman E. Khedr, Amira M. Idrees; analysis and interpretation of results: Yasser Hachaichi, Ayman E. Khedr, Amira M. Idrees; draft manuscript preparation: Yasser Hachaichi, Ayman E. Khedr, Amira M. Idrees. All authors reviewed the results and approved the final version of the manuscript.
Availability of Data and Materials: The data is available upon request. the citation of data is mentioned.
Conflicts of Interest: The authors declare that there is no conflict of interest with any party.
References
1. S. Naiem, A. M. Idrees, A. E. Khedr, and M. Marie, “Iterative feature selection-based DDoS attack prevention approach in cloud,” Int. J. Electr. Comput. Eng. Syst., vol. 14, no. 2, pp. 197–205, 2023. doi: 10.32985/ijeces.14.2.9. [Google Scholar] [CrossRef]
2. A. E. Khedr, Y. S. Alsahafi, and A. M. Idrees, “A proposed multi-level predictive WKM_ID3 algorithm, towards enhancing supply chain management in healthcare field,” IEEE Access, vol. 11, no. 4, pp. 125897–125908, 2023. doi: 10.1109/ACCESS.2023.3330691. [Google Scholar] [CrossRef]
3. A. E. Khedr, A. M. Idrees, and R. Salem, “Enhancing the e-learning system based on a novel tasks’ classification load-balancing algorithm,” PeerJ. Comput. Sci., vol. 7, no. 8, pp. e669, 2021. doi: 10.7717/peerj-cs.669. [Google Scholar] [PubMed] [CrossRef]
4. Z. Ye, Y. Xu, Q. He, M. Wang, W. Bai and H. Xiao, “Feature selection based on adaptive particle swarm optimization with leadership learning,” Comput. Intell. Neurosci., vol. 2022, pp. 1–18, 2022. doi: 10.1155/2022/1825341. [Google Scholar] [PubMed] [CrossRef]
5. A. D. Li, B. Xue, and M. Zhang, “Improved binary particle swarm optimization for feature selection with new initialization and search space reduction strategies,” Appl. Soft Comput., vol. 106, pp. 107302, 2021. doi: 10.1016/j.asoc.2021.107302. [Google Scholar] [CrossRef]
6. A. G. Gad, “Particle swarm optimization algorithm and its applications: A systematic review,” Arch. Comput. Methods Eng., vol. 29, no. 5, pp. 2531–2561, 2022. doi: 10.1007/s11831-021-09694-4. [Google Scholar] [CrossRef]
7. N. Ganesh, R. Shankar, R. Cěep, S. Chakraborty, and K. Kalita, “Efficient feature selection usingweighted superposition attraction optimization algorithm,” Appl. Sci., vol. 13, no. 5, pp. 3223, 2023. doi: 10.3390/app13053223. [Google Scholar] [CrossRef]
8. H. Xie, L. Zhang, C. P. Lim, Y. Yu, and H. Liu, “Feature selection using enhanced particle swarm optimisation for classification models,” Sens., vol. 21, no. 5, pp. 1816, 2021. doi: 10.3390/s21051816. [Google Scholar] [PubMed] [CrossRef]
9. N. A. Saad, S. Elgazzar, and S. Mlaker Kac, “Linking supply chain management practices to customer relationship management objectives: A proposed framework,” Business: Theory and Practice, vol. 23, no. 1, pp. 154–164, 2022. doi: 10.3846/btp.2022.15475. [Google Scholar] [CrossRef]
10. A. Goli, A. Golmohammadi, and J. Verdegay, “Two-echelon electric vehicle routing problem with a developed moth-flame meta-heuristic algorithm,” Oper. Manag. Res., vol. 15, pp. 891–912, 2022. doi: 10.1007/s12063-022-00298-0. [Google Scholar] [CrossRef]
11. H. Aslam, M. Waseem, D. Muneeb, Z. Ali, D. Roubaud and O. Grebinevych, “Customer integration in the supply chain: The role of market orientation and supply chain strategy in the age of digital revolution,” Ann. Oper. Res., vol. 5, no. 1, pp. 59, 2023. doi: 10.1007/s10479-023-05191-y. [Google Scholar] [PubMed] [CrossRef]
12. A. A. Almazroi, A. M. Idrees, and A. E. Khedr, “A proposed customer relationship framework based on information retrieval for effective Firms’ competitiveness,” Expert. Syst. Appl., vol. 176, no. 5, pp. 114882, 2021. doi: 10.1016/j.eswa.2021.114882. [Google Scholar] [CrossRef]
13. K. E. L. Sakty, “The impact of the coronavirus pandemic on supply chain: A case of egyptian market,” Arab J. Adm., vol. 42, no. 3, pp. 401–412, 2022. doi: 10.21608/aja.2022.257461. [Google Scholar] [CrossRef]
14. X. F. Song, Y. Zhang, D. W. Gong, and X. Z. Gao, “A fast hybrid feature selection based on correlation-guided clustering and particle swarm optimization for high-dimensional data,” IEEE Trans. Cybern., vol. 99, pp. 1–14, 2021. doi: 10.1109/TCYB.2021.3061152. [Google Scholar] [PubMed] [CrossRef]
15. X. F. Song, Y. Zhang, Y. N. Guo, X. Y. Sun, and Y. L. Wang, “Variable-size cooperative coevolutionary particle swarm optimization for feature selection on high-dimensional data,” IEEE Trans. Evol. Comput., vol. 24, no. 5, pp. 882–895, 2020. doi: 10.1109/TEVC.2020.2968743. [Google Scholar] [CrossRef]
16. S. M. H. Bamakan, H. Wang, Y. J. Tian, and Y. Shi, “An effective intrusion detection framework based on MCLP/SVM optimized by time-varying chaos particle swarm optimization,” Neurocomput., vol. 199, no. 10, pp. 90–102, 2016. doi: 10.1016/j.neucom.2016.03.031. [Google Scholar] [CrossRef]
17. K. Chen, B. Xue, M. Zhang, and F. Zhou, “Hybridising particle swarm optimisation with differential evolution for feature selection in classification,” in Proc. IEEE Congr. Evol. Comput., Glasgow, UK, 2020, pp. 1–8. doi: 10.1109/CEC48606.2020.9185533. [Google Scholar] [CrossRef]
18. G. M. de Souza Dias, J. F. de Rezende, and R. M. Salles, “Semi-Markov model for delivery delay prediction in multi-copy opportunistic networks with heterogeneous pairwise encounter rates,” Ad Hoc Netw., vol. 123, no. 102655, pp. 102655, 2021. doi: 10.1016/j.adhoc.2021.102655. [Google Scholar] [CrossRef]
19. A. Loder and T. Otte, “Modeling interactions of cars and freight vehicles in urban areas for speed and travel,” Arbeitsberichte Verkehrs- und Raumplanung, vol. 1540, 2020. doi: 10.3929/ethz-b-000429738. [Google Scholar] [CrossRef]
20. T. Wahyudi and D. S. Arroufu, “Implementation of data mining prediction delivery time using linear regression algorithm,” J. Appl. Eng. Technol. Sci. (JAETS), vol. 4, no. 1, pp. 84–92, 2022. doi: 10.37385/jaets.v4i1.918. [Google Scholar] [CrossRef]
21. J. Khiar and C. Olaverri-Monreal, “Boosting Algorithms for delivery time prediction in transportation logistics,” in 2020 Int. Conf. Data Mining Workshops (ICDMW), Italy, 2020, pp. 251–258. doi: 10.1109/ICDMW51313.2020.00043. [Google Scholar] [CrossRef]
22. A. Viellechner and S. Spinler, “Novel data analytics meets conventional container shipping: Predicting delays by comparing various machine learning algorithms,” in Proc. 53rd Hawaii Int. Conf. Syst. Sci., Manoa, 2020. [Google Scholar]
23. H. Bousqaoui, S. Achchab, and K. Tikito, “Machine learning applications in supply chains: An emphasis on neural network applications,” in 3rd Int. Conf. Cloud Comput. Technol. Appl. (CloudTech), Morocco, 2017. doi: 10.1109/CloudTech.2017.8284722. [Google Scholar] [CrossRef]
24. B. R. Cochenour, Predicting Transit Times for Outbound Logistics, Purdue University ProQuest Dissertations Publishing, India, India, 2020, pp. 1–13. [Google Scholar]
25. J. Wolter and T. Hanne, “Prediction of service time for home delivery services using machine learning services using machine learning,” Appl. Soft Comput., vol. 28, no. 6, pp. 5045–5056, 2024. doi: 10.1007/s00500-023-09220-7. [Google Scholar] [CrossRef]
26. O. Erdi Erkmen, E. Nigiz, Z. Sude Sarı, H. Şebnem Arlı, and M. Fatih Akay, “Delivery time prediction using support vector machine combined with look-back approach,” in Int. Joint Conf. Eng., Sci. Artif. Intell.-IJCESAI, 2022. doi: 10.5281/zenodo.8070703. [Google Scholar] [CrossRef]
27. D. Wani, R. Singh, V. Khanapuri, and M. K. Tiwari, “Delay prediction to mitigate e-commerce supplier disruptions using voting mechanism,” IFAC-PapersOnLine, vol. 55, no. 10, pp. 731–736, 2022. doi: 10.1016/j.ifacol.2022.09.495. [Google Scholar] [CrossRef]
28. A. Brintrup et al., “Supply chain data analytics for predicting supplier disruptions: A case study in complex asset manufacturing,” Int. J. Prod. Res., vol. 58, no. 11, pp. 3330–3341, 2020. doi: 10.1080/00207543.2019.1685705. [Google Scholar] [CrossRef]
29. G. Baryannis, S. Dani, and G. Antoniou, “Predicting supply chain risks using machine learning: The trade-off between performance and interpretability,” Future Gener. Comput. Syst., vol. 101, no. 1, pp. 993–1004, 2019. doi: 10.1016/j.future.2019.07.059. [Google Scholar] [CrossRef]
30. A. Goli, A. Ala, and S. Mirjalili, “A robust possibilistic programming framework for designing an organ transplant supply chain under uncertainty,” Ann. Oper. Res., vol. 328, no. 1, pp. 493–530, 2023. doi: 10.1007/s10479-022-04829-7. [Google Scholar] [CrossRef]
31. A. M. Idrees, A. E. Khedr, and A. A. Almazroi, “Utilizing data mining techniques for attributes’ intra-relationship detection in a higher collaborative environment,” Int. J. Hum. Comput. Interact., vol. 40, no. 2, pp. 190–202, 2022. doi: 10.1080/10447318.2022.2112029. [Google Scholar] [CrossRef]
32. M. S. Abbas and D. F. Kocaoglu, “Consistency thresholds for hierarchical decision model,” in Proc. PICMET’16: Technol. Manag. Soc. Innov., Honolulu, HI, USA, 2016. doi: 10.1109/PICMET.2016.7806838. [Google Scholar] [CrossRef]
33. M. Sokolova and G. Lapalme, “A systematic analysis of performance measures for classification tasks,” Inf. Process. Manag., vol. 45, no. 4, pp. 427–437, 2009. doi: 10.1016/j.ipm.2009.03.002. [Google Scholar] [CrossRef]
34. S. Tiwari, “DataCo smart supply chain for big data analysis,” 2019. Accessed: Dec. 15, 2023. [Online]. Available: https://www.kaggle.com/datasets/shashwatwork/dataco-smart-supply-chain-for-big-data-analysis [Google Scholar]
35. I. Ahmed, “Feature selection using particle swarm optimization in intrusion detection,” Int. J. Distrib. Sens. Netw., vol. 11, no. 10, pp. 1–8, 2015. doi: 10.1155/2015/806954. [Google Scholar] [CrossRef]
36. A. E. Khedr, A. M. Idrees, and A. Elseddawy, “Adaptive classification method based on data decomposition,” J. Comput. Sci., vol. 12, no. 1, pp. 31–38, 2016. doi: 10.3844/jcssp.2016.31.38. [Google Scholar] [CrossRef]
Cite This Article
 Copyright © 2024 The Author(s). Published by Tech Science Press.
This work is licensed under a Creative Commons Attribution 4.0 International License , which permits unrestricted use, distribution, and reproduction in any medium, provided the original work is properly cited.
 Downloads
 Citation Tools