
 Submit a Paper
 Propose a Special lssue
 Open Access
ARTICLE

Simulation of Fracture Process of Lightweight Aggregate Concrete Based on Digital Image Processing Technology
Key Laboratory of Urban Security and Disaster Engineering, Ministry of Education, Beijing University of Technology, Beijing, 100124, China
* Corresponding Author: Yijiang Peng. Email:
(This article belongs to the Special Issue: Multiscale Computational Methods for Advanced Materials and Structures)
Computers, Materials & Continua 2024, 79(3), 4169-4195. https://doi.org/10.32604/cmc.2024.048916
Received 21 December 2023; Accepted 18 March 2024; Issue published 20 June 2024
 View Full Text
 Download PDF
Abstract
The mechanical properties and failure mechanism of lightweight aggregate concrete (LWAC) is a hot topic in the engineering field, and the relationship between its microstructure and macroscopic mechanical properties is also a frontier research topic in the academic field. In this study, the image processing technology is used to establish a micro-structure model of lightweight aggregate concrete. Through the information extraction and processing of the section image of actual light aggregate concrete specimens, the mesostructural model of light aggregate concrete with real aggregate characteristics is established. The numerical simulation of uniaxial tensile test, uniaxial compression test and three-point bending test of lightweight aggregate concrete are carried out using a new finite element method-the base force element method respectively. Firstly, the image processing technology is used to produce beam specimens, uniaxial compression specimens and uniaxial tensile specimens of light aggregate concrete, which can better simulate the aggregate shape and random distribution of real light aggregate concrete. Secondly, the three-point bending test is numerically simulated. Thirdly, the uniaxial compression specimen generated by image processing technology is numerically simulated. Fourth, the uniaxial tensile specimen generated by image processing technology is numerically simulated. The mechanical behavior and damage mode of the specimen during loading were analyzed. The results of numerical simulation are compared and analyzed with those of relevant experiments. The feasibility and correctness of the micromodel established in this study for analyzing the micromechanics of lightweight aggregate concrete materials are verified. Image processing technology has a broad application prospect in the field of concrete mesoscopic damage analysis.Keywords
The lightweight aggregate concrete is known for its lower density due to the use of lightweight aggregate [1]. Lightweight aggregate concrete is renowned for its several key benefits, including its superior workability, outstanding thermal insulation properties, and notably lower dead load, which collectively enhance its utility in diverse construction applications [2]. However, LWAC production has encountered challenges, notably in obtaining a uniform distribution of aggregates, which significantly affects the overall strength and durability of the concrete [3–5]. To address these challenges effectively, researchers have moved to Digital Image Processing (DIP) technology to study the mesoscopic characteristics of LWAC [6]. Digital Image Processing (DIP) technology, a non-destructive testing method, quantitatively assesses material attributes like pore size distribution, pore connectivity, and aggregate distribution [7,8]. Its integration with graphics processing enhances lightweight aggregate concrete studies, enabling a more precise simulation of microstructure. This breakthrough allows unprecedented detail in visualizing and analyzing concrete’s internal structure, offering novel insights. DIP, coupled with the base force element method, facilitates extensive mesoscopic damage analysis, enabling large-scale predictions of behavior under diverse stress conditions. This enhances our comprehension of material durability and structural integrity. DIP’s application in micromechanical analysis provides a microscopic perspective on damage and destruction mechanisms in lightweight aggregate concrete, focusing on the role of aggregates in material performance. These innovations highlight DIP’s substantial impact on advancing material science research, providing valuable tools for investigating and improving lightweight aggregate concrete.
Several studies have delved into the utilization of DIP technology in the context of LWAC. Fan et al. [9] presented a time-efficient method to determine the mechanical properties of geopolymer concrete. Dang et al. [10] offered green alternatives for lightweight aggregates, including the utilization of excavated soil and sewage sludge for the production of green lightweight aggregate (LWA). The study highlighted the potential of these materials in creating value-added materials that can address urban waste stockpile issues and environmental pollution. Sousa et al. [11] explored the shear behavior of recycled coarse aggregate concrete and concluded that recycled coarse aggregate concrete (RAC) dry joints exhibit similar behavior to conventional concrete but have lower normalized shear strength. They found that confining stress significantly enhances shear strength, and increasing the number of keys in joints improves resistance. They recommend a 0.7 reduction coefficient in the AASHTO (American Association of State Highway and Transportation Officials) equation for predicting RAC joint shear strength, highlighting the potential of RAC in sustainable construction and the need for further research on its structural applications. The AASHTO equation is a widely used method for predicting pavement design thickness. Specifically, it is employed in the design of flexible pavement structures, which include asphalt concrete surfaces overlying unbound base courses and subgrade materials. The AASHTO design equation considers factors such as traffic loads, material properties, and environmental conditions to determine the appropriate pavement thickness for a given application. Feng et al. [12] investigated the non-linear deformation and failure behavior of Expanded Polystyrene (EPS) concrete. Other studies have focused on enhancing the uniformity and performance of concrete, like those by Xiong et al. [13], and on novel approaches such as the use of high-strength synthetic fiber by Fu et al. [14]. Further investigations have looked at the thermal behavior of phase change material in lightweight aggregate [15,16], the effect of the aggregate-paste interface [17] and the application of some new methods in the analysis of concrete materials [18,19]. Additional work by Haghighat et al. [20] has provided insights into the shrinkage and creep behavior of concrete using image analysis. Sustainable approaches have also been considered, as in the works of Zhang et al. [21] and Xiong et al. [22] that focus on ecological reinforcement and the preparation of high-strength LWAC. Another recent study [23] introduces a fusion-based deep convolutional neural network model, combining features from Inception V3, VGG16, and AlexNet, Convolutional Neural Networks (CNN) architectures, to identify and classify concrete defects with high precision, achieving an overall accuracy of 98.31%. This method’s integration could offer a cutting-edge perspective on analyzing concrete’s mesoscopic damage, providing a bridge between traditional image processing techniques and the latest advancements in machine learning for construction material analysis. Research has not been limited to DIP technology alone but has also included numerical simulation to investigate mechanical responses, as evident in the studies by Lian et al. [24], Rim et al. [25], Wang et al. [26], Nguyen-Van et al. [27], and Tang et al. [28]. These studies have explored various factors influencing concrete’s mechanical properties, emphasizing the value of understanding size effects, material composition, and innovative reinforcements. In recent years, artificial neural network technology has also been applied in the mesoscopic damage analysis of concrete materials [29–31].
This study focuses on presenting a comprehensive approach to analyze the mechanical properties and failure modes of LWAC. The comprehensive approach combines the image processing technology with a new finite element method-the base force element method [19]. The mesoscopic models will be developed using digital image technology to represent aggregate distribution accurately. The methodology will involve numerical simulations of uniaxial compression tests on LWAC specimens, and the use of a three-point bending simulation to further understand the mechanical properties and failure modes. By comparing calculated results with experimental findings, this paper aims to bridge the gap between technology and practical application, contributing to the continuous evolution of LWAC in the construction industry.
In Section 1, the current situation of mechanical properties analysis and related technologies of LWAC are summarized. In Section 2, the innovative mesoscopic model using digital image processing (DIP) technology that accurately represents the distribution of aggregates in real LWAC specimens is introduced. In Section 3, the base force element method to analyze the mechanical properties and failure modes of LWAC under various loading conditions are implemented. The uniaxial tensile test, uniaxial compression test and three-point bending test of LWAC are simulated, respectively. In Section 4, the conclusions and prospects are presented. The approach offers a more precise simulation of the fracture process in LWAC, contributing to a deeper understanding of its structural behavior and potential applications in the construction industry. These advancements represent a significant step forward in the mesoscopic study of concrete materials.
The primary objectives of this research are to:
• Develop a comprehensive mesoscopic model of LWAC using advanced DIP technology, providing a more accurate representation of aggregate distribution within concrete specimens.
• Utilize the base force element method on microscopic damage analysis to simulate the mechanical behavior of LWAC under uniaxial compression and three-point bending tests.
• Compare the simulation results with experimental data to validate the effectiveness and reliability of the proposed model. By achieving these objectives, this study aims to enhance the understanding of LWAC behavior and contribute valuable insights to its application in construction and structural engineering.
2 Mesoscopic Model of LWAC Based on DIP Technology
In order to create a mesoscopic model of LWAC that more accurately reflects the distribution of aggregates in real concrete specimens, this section established a two-dimensional mesoscopic model of LWAC based on digital image technology.
The two-dimensional discrete function is used to represent a digital image with a total of m × n pixels. Its expression is:
where, m and n respectively represent the row and column of the corresponding pixel in the image. Different grayscale values correspond to different material information, which can be extracted by the different grayscale values of the pixels.
The establishment process of the digital image-based mesoscopic model of LWAC mainly adopts a combination of software and technology, namely Photoshop software, MATLAB software, and digital image processing technology. The modeling process is shown in Fig. 1.
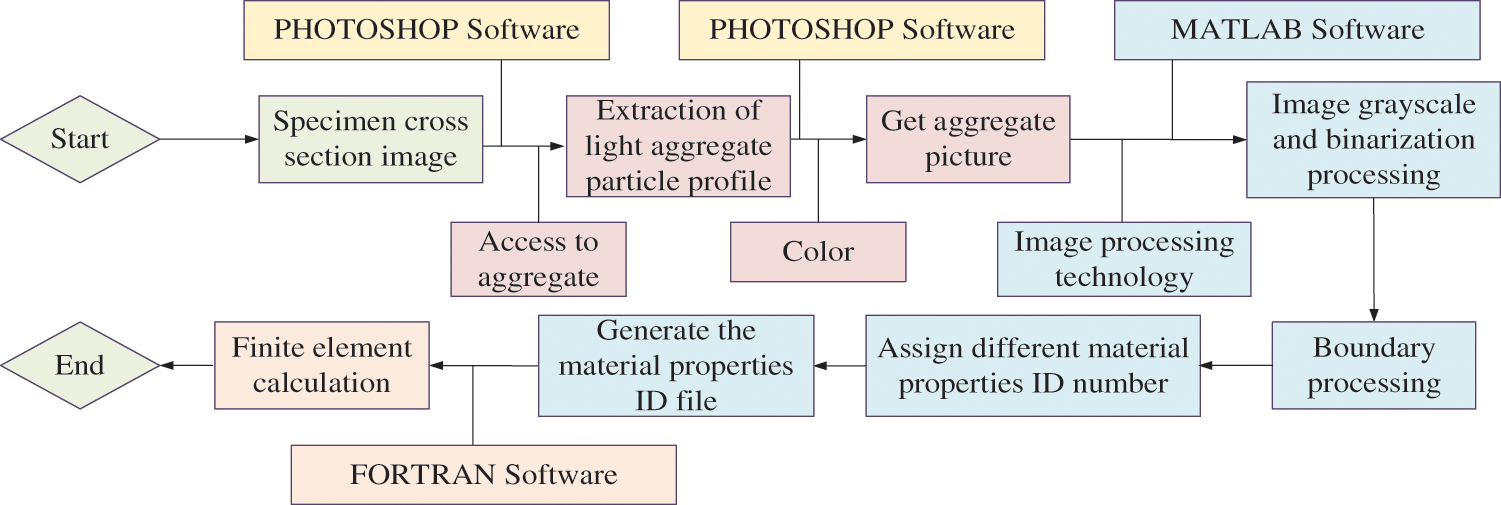
Figure 1: The flow chart of Building LWAC model
2.1 Acquisition of Cross-Sectional Images of Specimens
LWAC is a multiphase material. Due to the different internal structural densities of different phases, the obtained quality of CT images are also different, which are reflected in the brightness of the image and can intuitively reflect the internal structure of lightweight aggregate concrete. This makes it possible to observe internal pores, crack propagation, and other features. The density of cement mortar is higher than that of shale ceramics, so it appears gray in the CT scan. The density of shale ceramics is small, so the shale ceramics are shown in black and gray in CT images.
In Fig. 2, specimens 1 and 2 are cross-sectional images of high-strength shale LWAC specimens obtained from industrial CT scans introduced by the Highway Engineering Testing Center of Changsha University of Science and Technology [32]. Industrial CT scans emit X-rays from the emitter, which penetrate the concrete specimen. The detector then receives information attenuated by different phase materials in this work, which is then amplified and converted into electrical signals. The computer processes this information to obtain CT values, thereby forming a digital image of the cross-section of the concrete specimen.
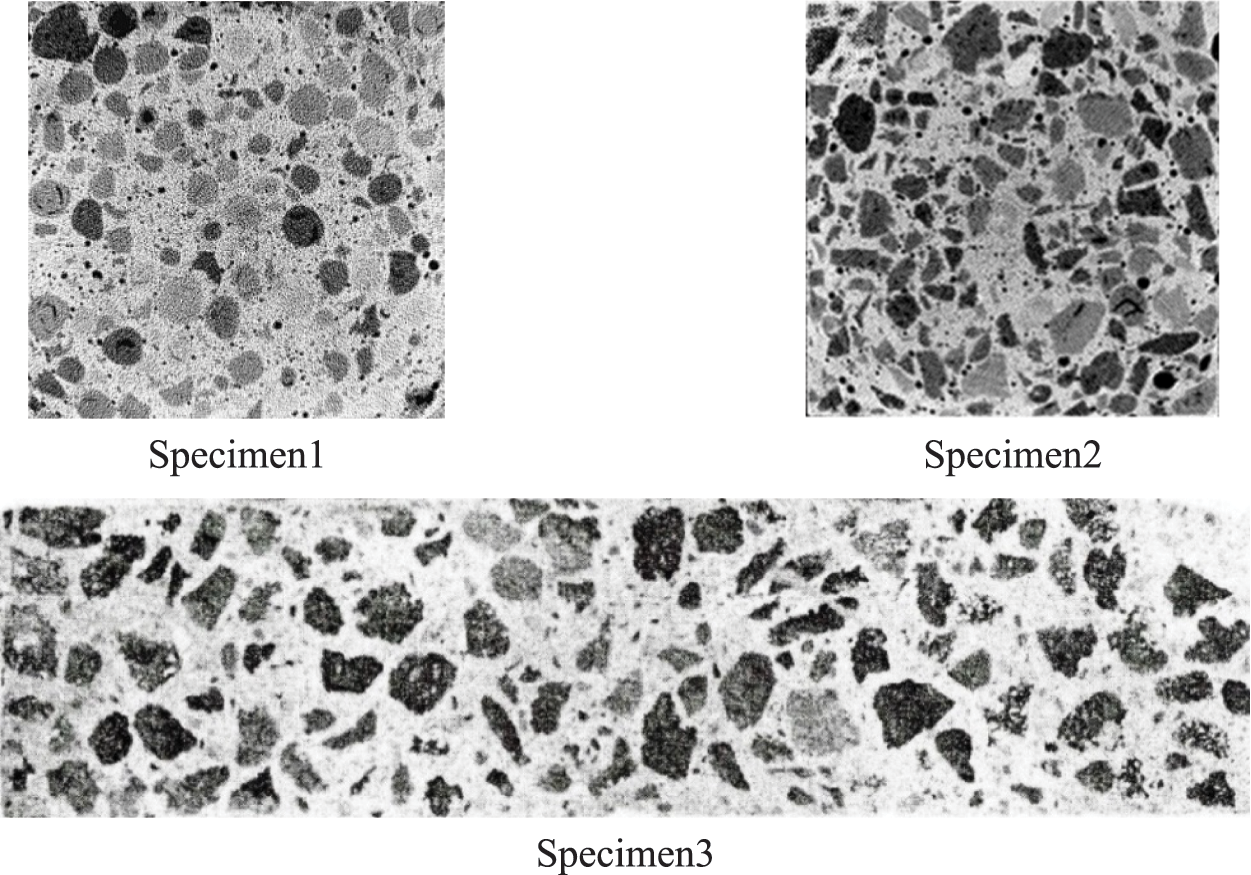
Figure 2: Sectional image of LWAC
Test specimen 3 is a cutting surface image of LWAC with high pyrophyllite clay. The image was taken using a digital camera to capture a true-color picture of the cut surface of the specimen before the experiment, which was then converted to a grayscale image. The distribution of cement mortar and lightweight aggregates can be observed in the image, where the black and gray color represents the lightweight aggregates, while the gray and white color represents the cement mortar.
2.2 Preliminary Processing of Cross-Sectional Images
The acquired images often suffer from uneven distribution of gray values and poor quality due to various objective factors such as impurities inside concrete, inadequate lighting during photography, and insufficient camera pixel resolution. Therefore, it is necessary to carry out preliminary processing of the acquired images to facilitate subsequent image analysis before performing finite element calculations.
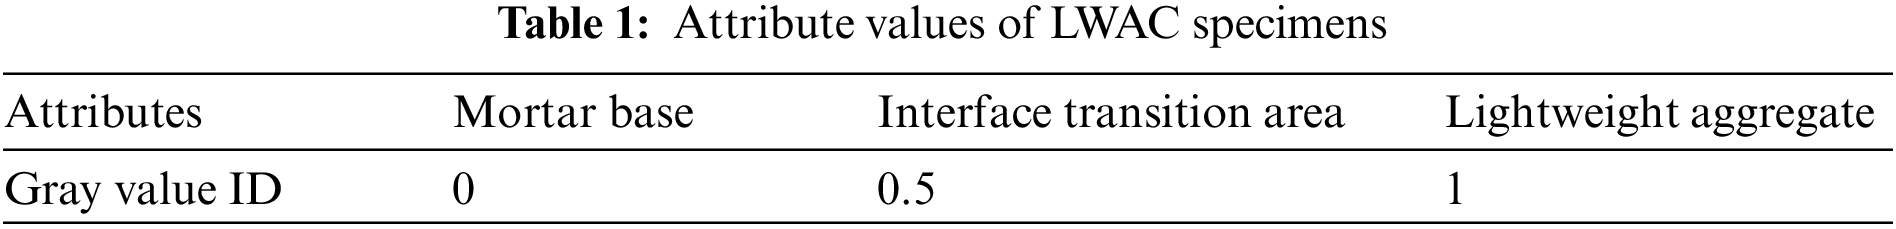
In this work, Photoshop is chosen to perform preliminary processing on the images. Firstly, the ‘Quick Selection Tool’ in Photoshop is used to select the lightweight aggregate in the obtained image, ignoring the smaller aggregates. Then, the edges of the selected aggregates are adjusted, and appropriate values for the aggregate radius, smoothness, and contrast are selected. After that, the aggregates are filled with black color, while the mortar part is filled with gray color. The processing process and results are shown in Fig. 3.
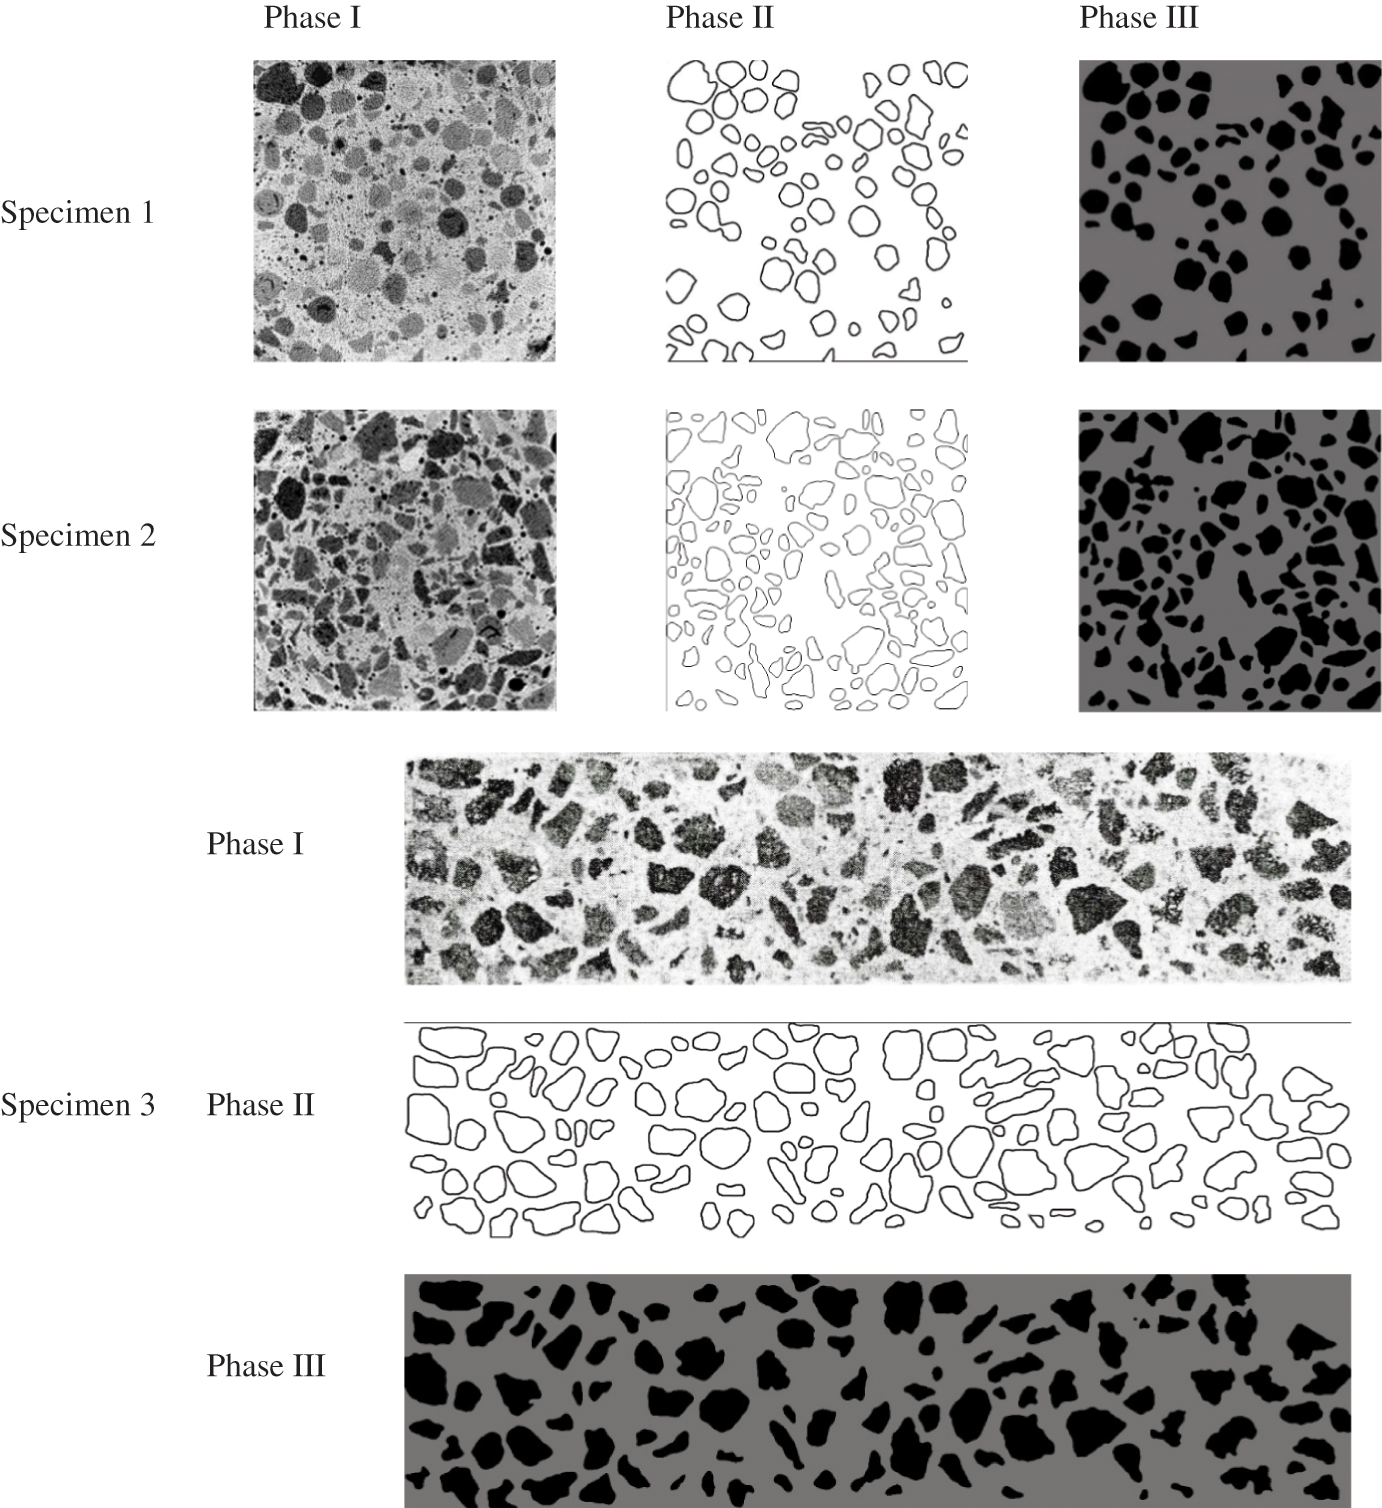
Figure 3: Results of preliminary treatment
2.3 Conversion the Image into Grayscale
After the preliminary processing of the cross-sectional photos of LWAC, it is necessary to digitize the obtained natural image by converting it into a digital image. Grayscale processing of the image is an essential step in digital image processing. Converting the image into a grayscale histogram is a simple and effective method of image digitization. The grayscale histogram can reflect both the number of pixels in the same gray level and the frequency of pixels in each gray level, reflecting the distribution of pixels and providing a basis for digital image processing.
The grayscale histogram of the image of LWAC exhibits two peaks, each corresponding to a different material. The valley between the two peaks represents the gray value where the two materials have the closest grayscale value. Selecting the grayscale value at this point as the threshold can clearly separate the interface between the lightweight aggregate and cement mortar, making it a crucial step in the image binarization process.
The gray-scale histogram of the specimen cross-sectional image obtained using MATLAB program code statements is shown in Fig. 4.
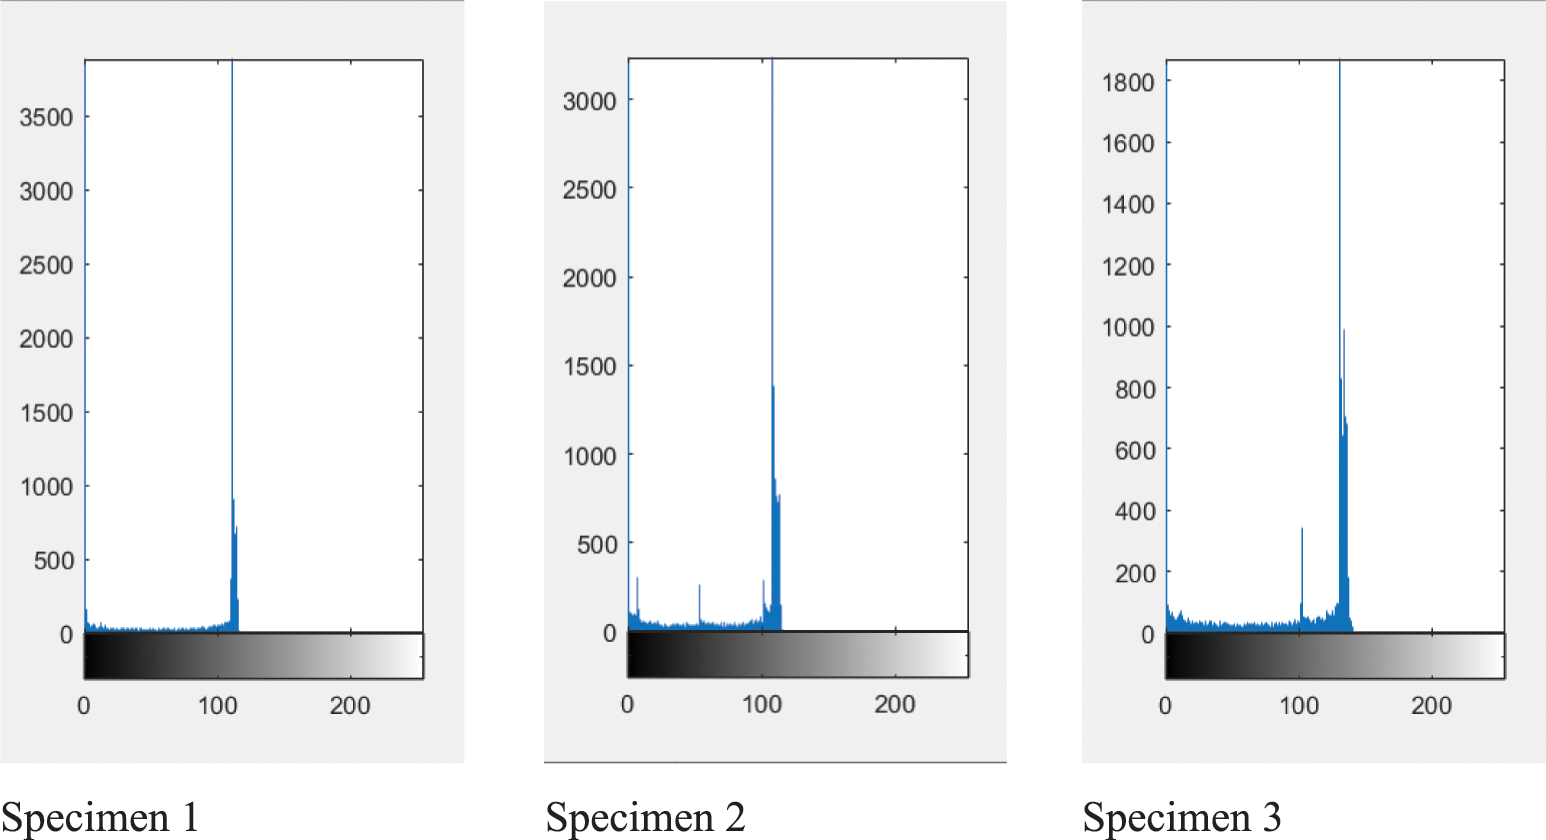
Figure 4: Gray histogram of specimens
The LWAC is composed of cement mortar and lightweight aggregates. The grayscale image is binarized, that is, these two phases are represented by different grayscale values. In this work, black is used to represent aggregates and white is used to represent cement mortar.
The gray value f of pixels in row x and column y in the image.
In the formula, h(x, y) after editing the functional expression in MATLAB, the gray value of the xth row and yth column pixel in the image is obtained. Where ‘a’ represents the threshold value that separates the gray values of the lightweight aggregates and the cement mortar. The most appropriate threshold value can be selected during image binarization to minimize the separation error between the lightweight aggregates and the cement mortar. Based on the histogram, a threshold value of a = 50 is determined. After applying the aforementioned functional transformation, the gray value of the lightweight aggregates set to 1, while the gray value of the cement mortar set to 0. The resulting binary image is shown in Fig. 5.
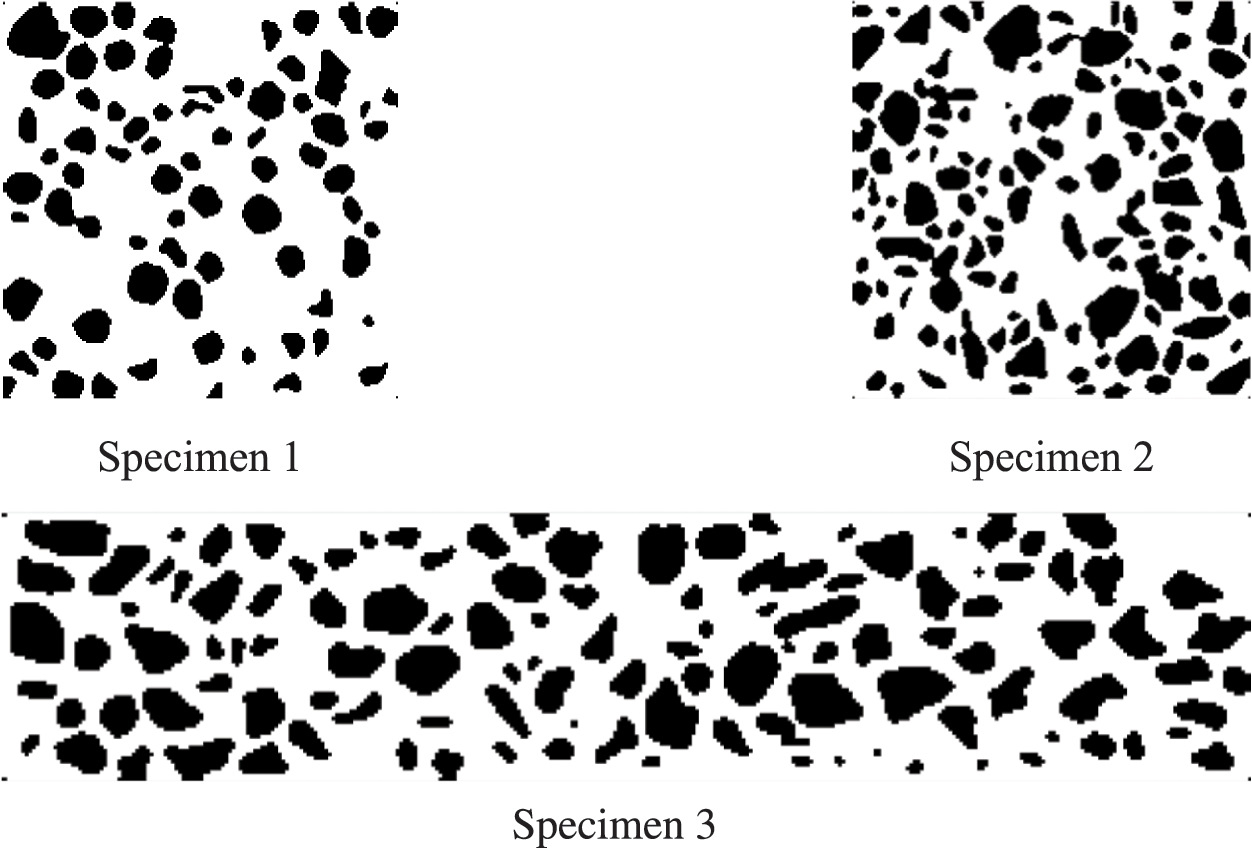
Figure 5: The image of the binarization of specimens
2.5 Processing of Interface Transition Zones
In the study, a specific method is utilized to analyze and work with images by focusing on the gray values of pixels. The process begins by sequentially determining the gray values of two adjacent pixels. Gray values in an image represent the intensity of the light, and they fall within a range that varies from black to white. By identifying these values in neighboring pixels, a comparison can be made.
In case the gray values of the two pixels are not the same, the pixel is defined as the interface transition area of the material, and the gray value of the pixel is changed. The position of the pixel where this change occurs is then categorized as the interface transition area between them. This identification of the interface transition area is a crucial part of understanding the structure within the image.
After defining the interface transition area, the gray value of the pixel at that location is modified, and this altered value is extracted as an Interfacial Transition Zone (ITZ) unit. The ITZ unit refers to a specific region within a composite material, and in the context of image analysis, it can represent a certain characteristic or property of the image. Furthermore, the ITZ size in this approach is defined as one unit, and it corresponds to a physical measurement of 0.5 mm × 0.5 mm.
Moving beyond the pixel analysis, the paper also provides an assessment of LWAC. The properties of each phase of this type of concrete are outlined clearly and systematically, with the comprehensive data organized and presented in Table 1.
By employing this approach, the paper offers an in-depth examination of both pixel values in images and characteristics of LWAC, and draws connections between them through the use of ITZ units with specific dimensions and comprehensive tabular data.
The dimensions of specimens 1 and 2 are 100 mm × 100 mm, and the dimensions of specimen 3 are 350 mm × 75 mm. The size of the grid can be changed using the image compression command “imresize” in MATLAB. Considering the clarity of the image as well as the accuracy and efficiency of the subsequent finite element calculation, a grid size of 0.5 mm × 0.5 mm was selected for specimens 1 and 2, and a grid size of 1 mm × 1 mm was selected for specimen 3. The LWAC images obtained after boundary processing are shown in Fig. 6. Taking specimen 2 as an example, Fig. 7 shows the gray values of each phase in the specimen with interfaces.
Figure 6: Lightweight aggregate concrete after digital processing
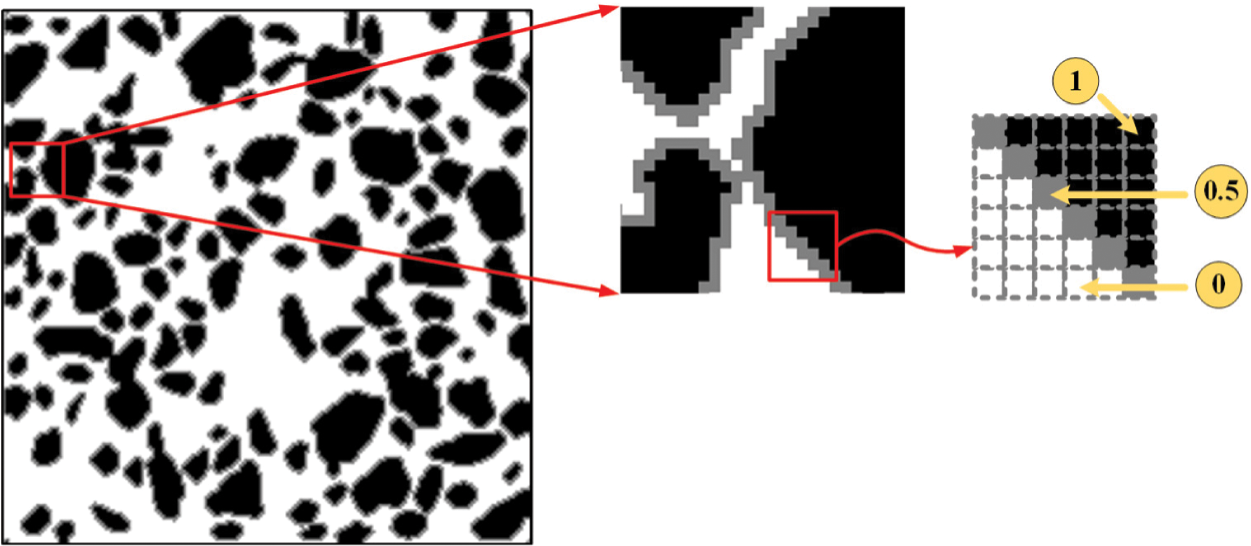
Figure 7: The image of LWAC with interface
These numerical simulation models, which are generated based on image processing techniques, will be applied in the calculations in Section 3.
3 Mesoscopic Damage Analysis of LWAC
3.1 Mesoscopic Simulation for Notched Three-Point Bending Beams of LWAC
3.1.1 Specimen Size and Calculation Model
In this study, a numerical model was established based on the three-point bending beam test in reference [33], and the material parameters and constitutive parameters of the specimens are shown in Tables 2 and 3, respectively.
Where β is the elastic-strength parameter of materials s; γ is the residual-strength parameter of materials; α is the residual tensile strength parameter of materials; λ is the elastic-strain parameter of materials; η is the residual strain parameter of materials; ξ is the ultimate-strain parameter of materials. The material parameters are shown in Table 3.
The geometric dimensions and boundary conditions of the specimen are shown in Fig. 8. The beam has a size of 100 mm × 500 mm, a notch width of 2 mm, a notch depth of 40 mm, and a span of 400 mm.
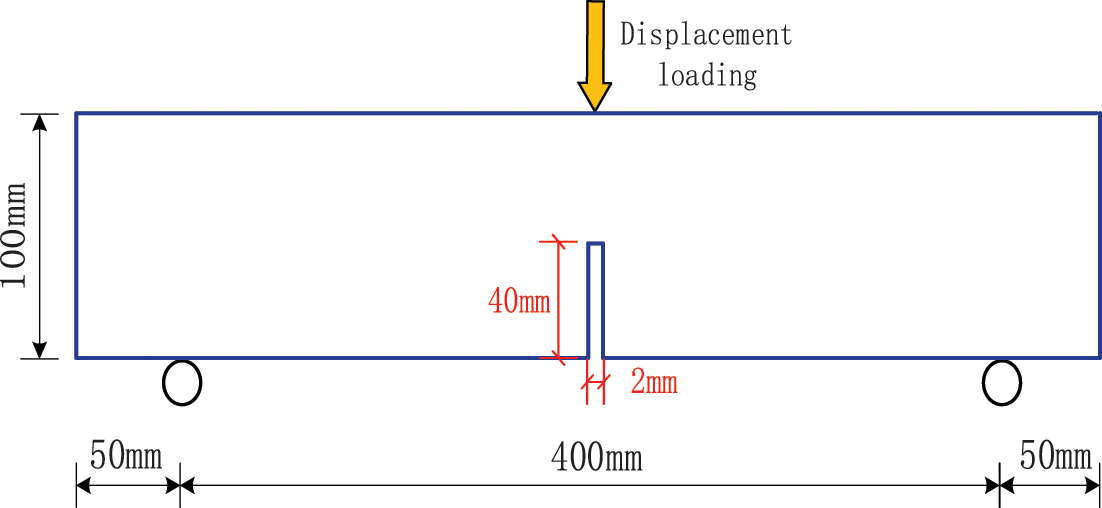
Figure 8: Schematic diagram of specimen geometry and boundary conditions
This work incorporates the findings of [34], where the main failure in the three-point bending beam experiment was observed in the central region of the beam. To streamline computational complexity and save computation time, the numerical test model of random aggregate concrete was positioned at the midspan. More specifically, a fine section of 100 mm at the center of the beam was selected as the detailed partitioned area, adopting the same mesh size as this research [34]. Fig. 9 shows the calculation model of LWAC three-point bending beam.
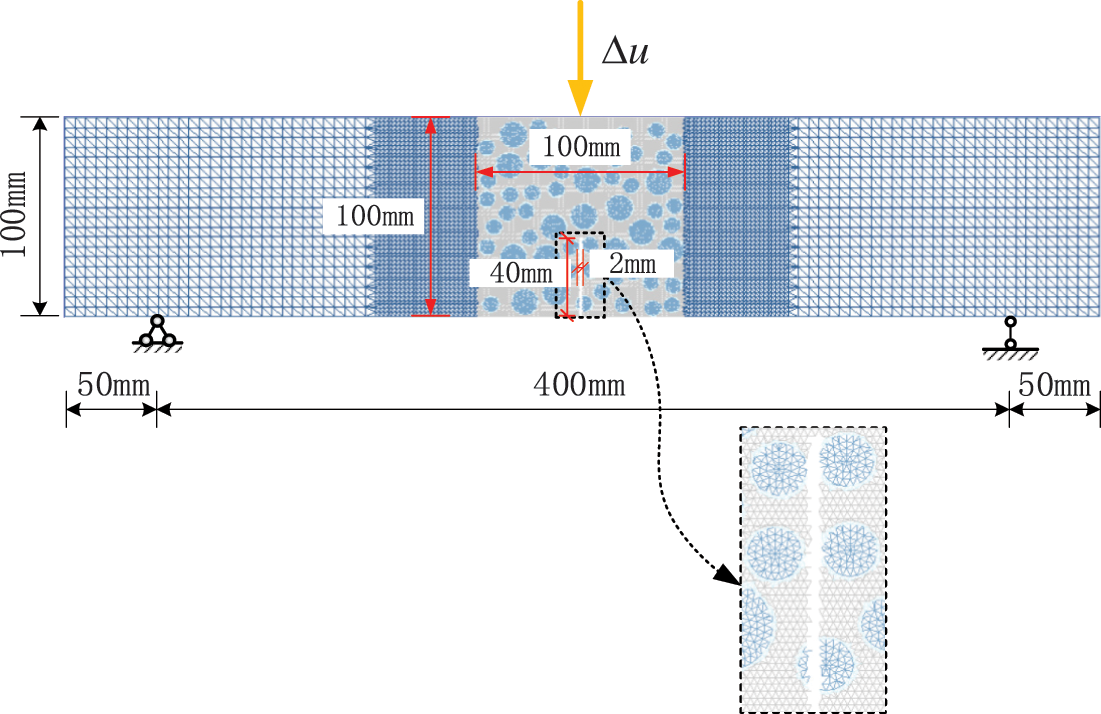
Figure 9: Calculation model of LWAC three-point bending beam
The computational model is shown in Fig. 9, with both sides set as mesoscopic LWAC material. The mesh size in the range of 50 mm on each side of the fine-mesh area is 2 mm, while the remaining mesh size is 5 mm. The bottom of the numerical specimen is equipped with hinged constraints at both ends and a vertical downward load is applied in the middle area of the beam top. The loading is carried out by stepwise static displacement, with a displacement value of 0.005 mm for each loading step.
3.1.2 Numerical Simulation Results
The maximum loading force of the notched LWAC three-point bending beam was obtained through numerical calculation. In this work is 1.94 kN, while the maximum loading force of the tested specimen in the experiment [33] is 1.92 kN, indicating a small error between the two. This suggests the rationality of the parameter selection in the numerical model. Fig. 10 shows the failure process of the three-point bending beam obtained in this study. As can be seen from the figure, damage first occurs in the upper part of the notch. As the loading progresses, cracks continue to propagate upwards along the notch. Due to the lowest strength and modulus of elasticity of the lightweight aggregate, cracks do not bypass the aggregate but directly penetrate through the middle of the lightweight aggregate and extend upwards along the notch, forming a relatively vertical and smooth crack, which is consistent with the phenomenon observed in the comparative experiment [33]. As shown in Fig. 11, the fracture surface of the experiment [33] shows that the lightweight aggregate particles were fractured in the middle.
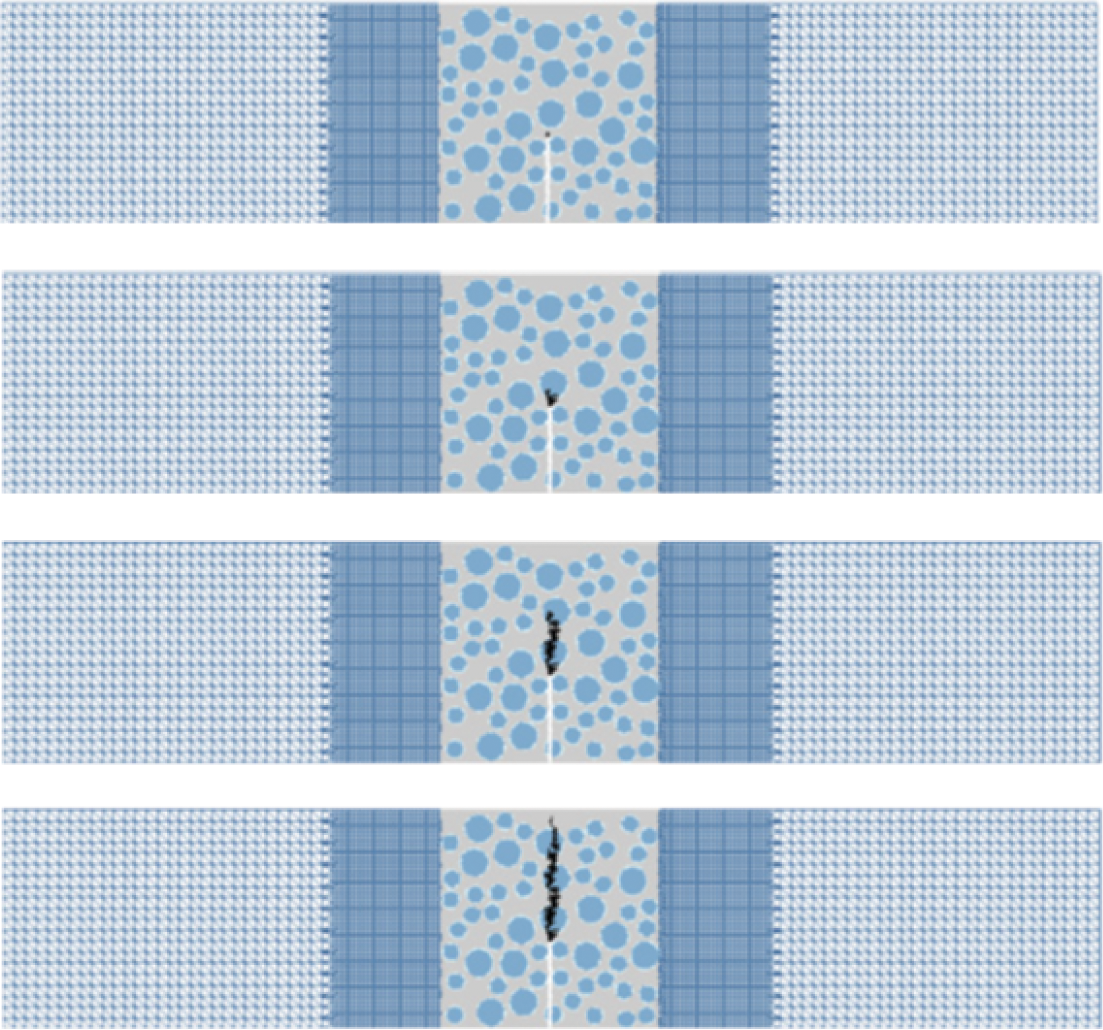
Figure 10: Failure process diagram of LWAC three-point bending beam
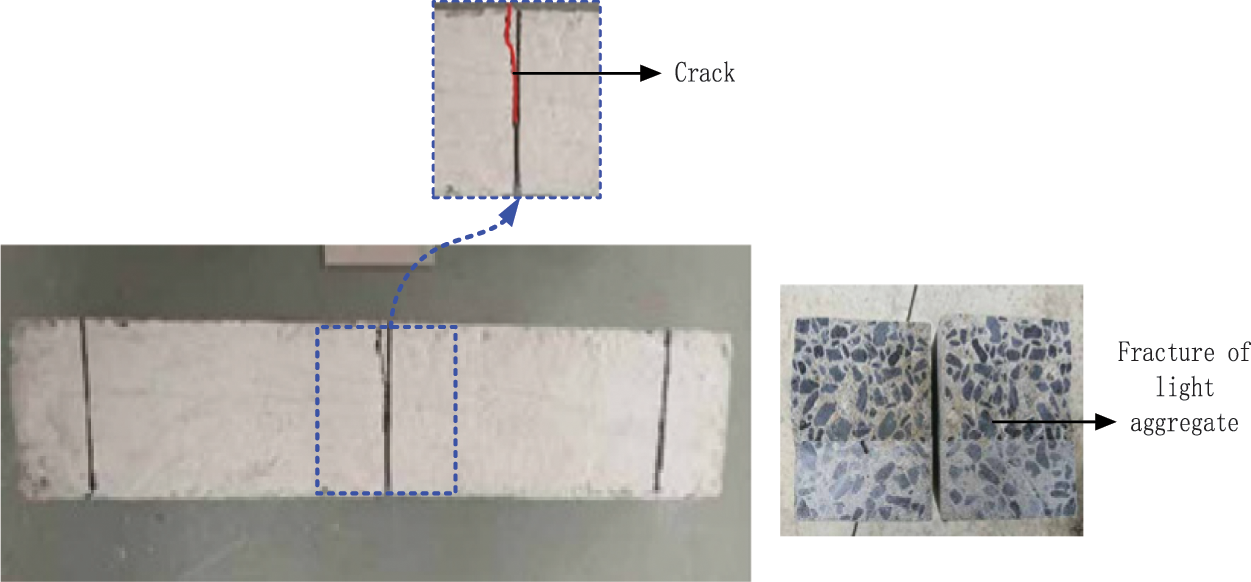
Figure 11: Experimental phenomena of LWAC three-point bending beam
Fig. 12 shows the stress distribution at the maximum load of the LWAC three-point bending beam obtained in this study. It can be seen that the area near the top of the notch is the most stress-concentrated region, which is consistent with reality.
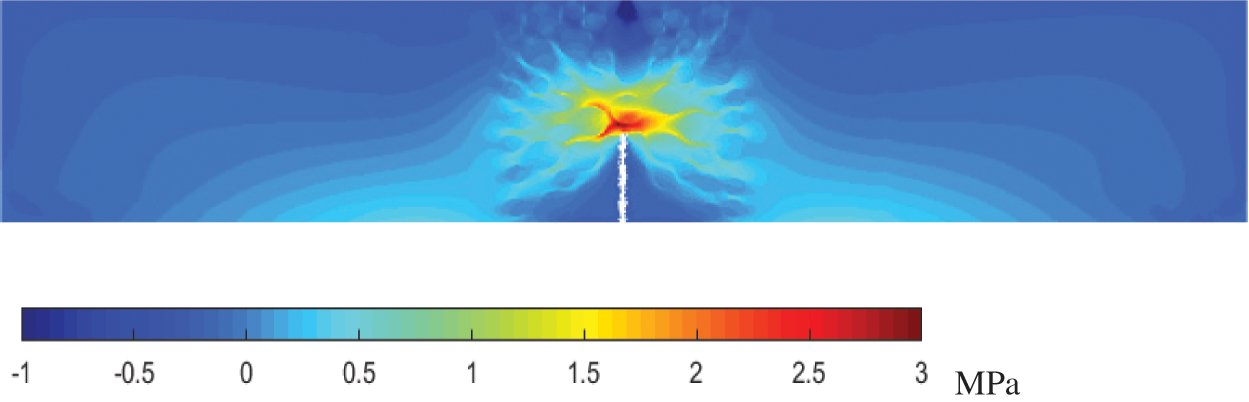
Figure 12: Stress diagram of LWAC three-point bending beam at maximum loading force
In a nutshell, the numerical simulation of the three-point bending test was performed on the notched beam, and the crack propagation path during the loading process and the maximum principal stress contour plot of the beam at the maximum loading force were obtained. The fine-scale numerical model of the notched LWAC beam established in this work can simulate the failure process of the specimen in the three-point bending test well. It can be seen that the crack in the experiment extends upward along the notch and finally forms a relatively vertical and smooth crack. The simulation results are consistent with the experimental results. Based on the numerical simulation results in this work, it can be concluded that the fine-scale numerical model established based on the random aggregate model is feasible and reasonable for simulating the mechanical properties and failure modes of LWAC.
3.2 Mesoscopic Simulation of Uniaxial Static Compression Test
3.2.1 Calculation Model of Uniaxial Compression
In this work, a mechanical calculation model based on the potential-based surface method is established to investigate the mechanical performance and failure process of high-strength lightweight aggregate concrete specimens with circular and non-circular type lightweight aggregates under uniaxial compression. The dimensions of the specimens are 100 mm × 100 mm.
The micro-scale model in this study is based on grid partitioning of pixel points, and the resolution of the image can be modified using the “imresize” image compression command in MATLAB. In order to ensure calculation efficiency and accuracy, a pixel size of 0.5 mm was selected, using a uniform grid partitioning method. Vertical static displacement loading was applied step by step along the vertical direction, with a displacement value of 0.01 mm for each step. During loading, the vertical displacement of all bottom edge nodes was restricted, and the center node of the bottom was subjected to horizontal and vertical displacement constraints. Taking the high-strength non-circular LWAC specimen as an example, the corresponding loading model is shown in Fig. 13.
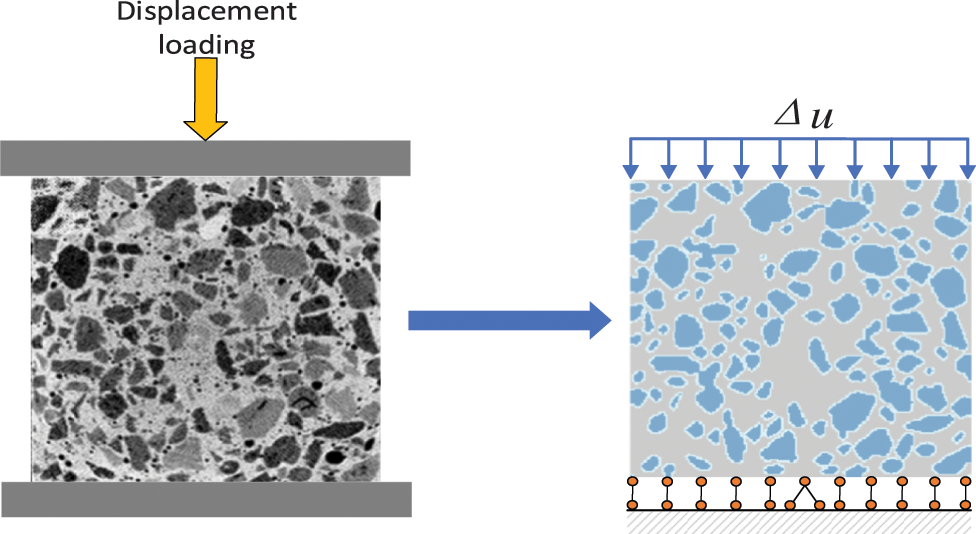
Figure 13: Loading model of uniaxial compression
Based on reference [31], the material parameters were determined as shown in Table 4. In the mechanical calculation model, a multi-linear damage constitutive model is used for all phase materials in the model. The parameters of the constitutive model are shown in Table 5.
3.2.2 Numerical Simulation Results
Using the micromechanical damage calculation program based on the base force element method of potential energy principle, this section performed uniaxial compression tests on the numerical specimens of high-strength circular LWAC and the numerical specimens of high-strength non-circular LWAC obtained using digital image processing techniques, and judged element failure using the maximum tensile strain criterion. Table 6 shows the compressive strength of the numerical model calculations and the specimens obtained from the experiments [31]. The small error between the two indicates the reasonableness of selecting parameters for the numerical model. Fig. 14 plots the stress-strain curve of the numerical simulation with stress as the vertical axis and strain as the horizontal axis. The lightweight aggregates used in the experiment were circular ceramic particles and non-circular ceramic particles, and the cylinder compressive strengths of the two types of ceramic particles were close, but the density of non-circular ceramic particles was greater than that of circular ceramic particles. Therefore, the strength of non-circular ceramic particles was slightly higher than that of spherical ceramic particles when selecting the micromechanical parameters. Additionally, the strength of the bonding interface is increased because the non-circular ceramic particles have irregular shapes, rough surfaces, and a closer bond with cement mortar. Therefore, the strength of the bonding interface in the non-circular lightweight aggregate specimens are higher. Since the performance of cement mortar in both specimens is the same, the strength of the specimens is mainly determined by the aggregates. Therefore, the strength of the LWAC specimens made of non-circular lightweight aggregate is higher than that of the specimens made of circular lightweight aggregate.

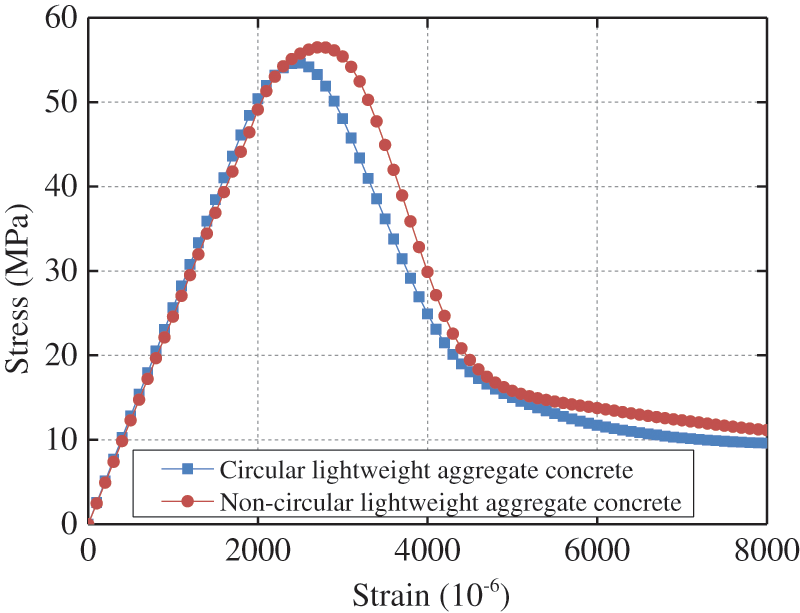
Figure 14: Stress-strain curve of high-strength LWAC under uniaxial compression
To investigate the micro-damage and failure process of high-strength LWAC under uniaxial compression, a Fortran program with a graphical display module was used to plot the damage and failure maps of the circular LWAC specimens and non-circular LWAC specimens under uniaxial compression, as shown in Figs. 15 and 16, respectively.
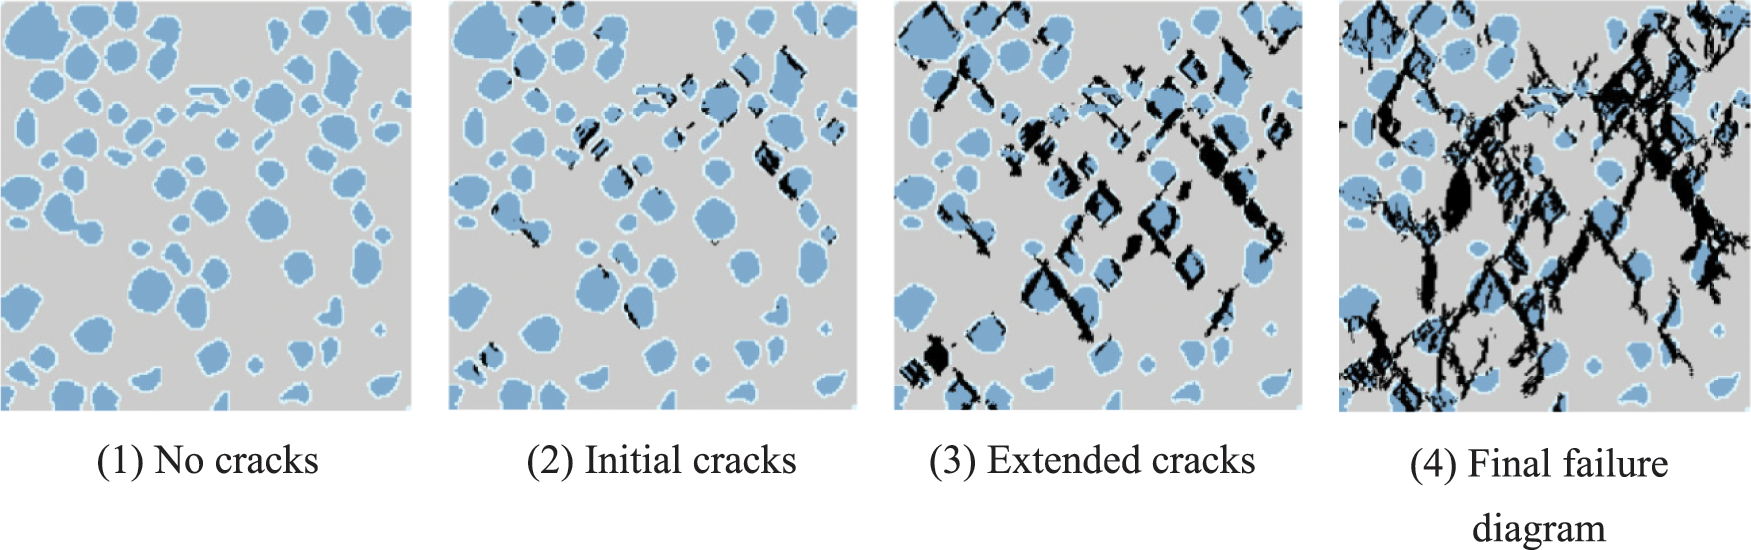
Figure 15: Failure process diagram for numerical calculation of circular LWAC
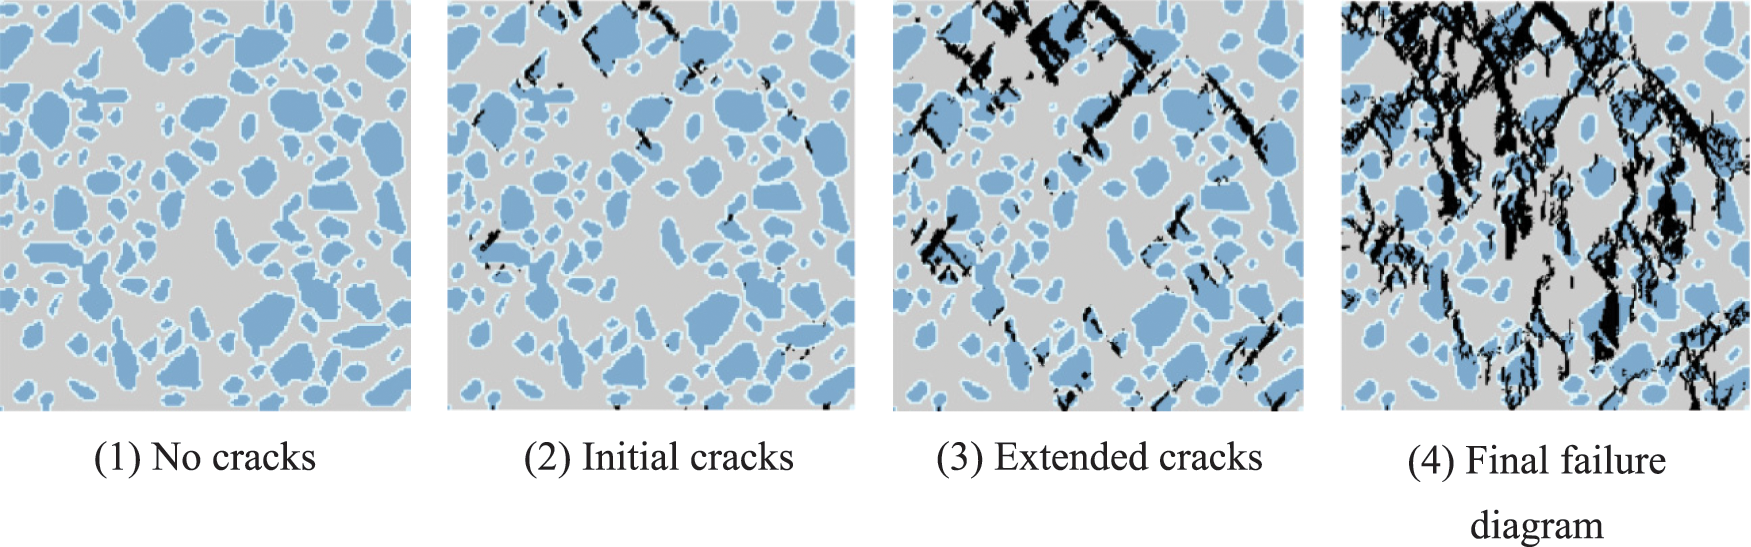
Figure 16: Failure process diagram for test of non-circular LWAC
These maps were then compared with the scanning results of industrial CT in the experiment (Figs. 17 and 18). In the damage process maps obtained from numerical simulations, the mortar is represented as light gray, lightweight aggregate as blue, interface elements as light blue, and failed elements as black.

Figure 17: Failure process diagram for test of circular LWAC
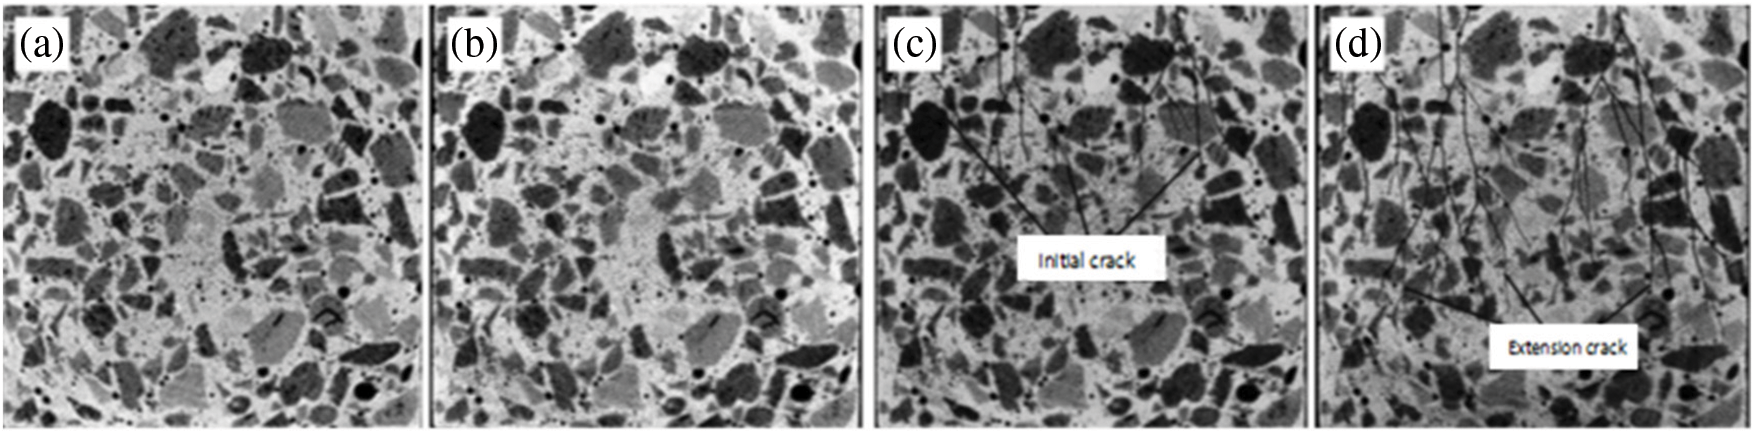
Figure 18: Failure process diagram for test of non-circular LWAC
The damage evolution of high-strength LWAC specimens under uniaxial compression loading can be observed from the damage diagrams. During the initial loading stage, all the constituent materials of the specimen undergo elastic deformation without significant damage. After the initiation of the first crack, the crack propagates further down the specimen in the direction of loading, with most of the cracks penetrating the lightweight aggregate particles and creating new cracks. The crack propagation path of high-strength LWAC specimens is different from that of normal concrete specimens.
Cracks in normal concrete specimens usually propagate along the bonding interface, while in this experiment, most of the cracks in the specimen directly penetrate the aggregate particles. This is mainly because in high-strength LWAC, the cement mortar has a higher strength, while the lightweight aggregate particles still have porous characteristics, making them the weak link in the lightweight aggregate concrete specimen [35,36].
3.3 Numerical Simulation under Uniaxial Static Tension of LWAC
3.3.1 Single-Axis Tensile Loading Model
In this work, a mechanical calculation model based on the base force element method is established to study the mechanical properties and failure process of high-strength LWAC specimens with circular lightweight aggregate and high-strength LWAC specimens with non-circular lightweight aggregate under uniaxial tension. Due to the difficulty in conducting uniaxial tension experiments, there is currently a limited amount of comparative experimental data available. Therefore, all parameters involved in the microscale model, except for the loading displacement value, are kept consistent with those used in uniaxial compression tests. Uniaxial compression numerical simulations are performed on the LWAC with a static displacement loading in a step-by-step manner, with a displacement value of 0.001 mm for each loading step. During loading, all nodes along the bottom edge are constrained in the vertical direction, while the central node at the bottom is constrained in both the horizontal and vertical directions. Taking the high-strength LWAC specimen with non-circular lightweight aggregate as an example, its corresponding loading model is shown in Fig. 19.
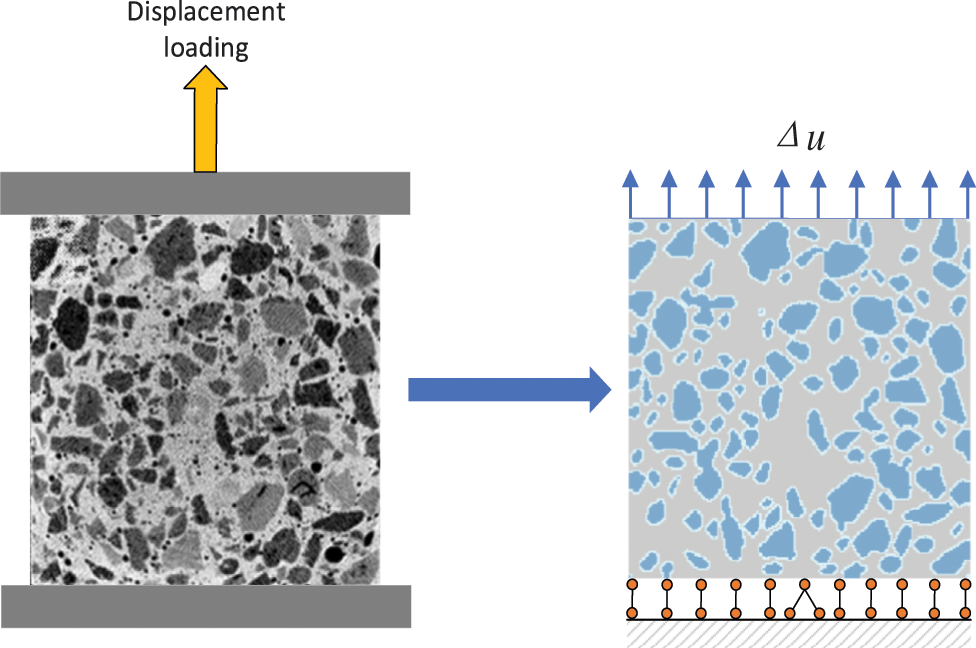
Figure 19: Loading model of uniaxial tension numerical test
3.3.2 Numerical Simulation Results
This section conducts uniaxial tension tests on numerical specimens of circular LWAC and non-circular LWAC obtained using digital image processing technology, and determines the failure of the elements based on the maximum tensile strain criterion. Table 7 shows the compressive strength of the specimens obtained by numerical modeling, and Fig. 20 plots the stress-strain curve of the numerical simulation with stress as the ordinate and strain as the abscissa. It can be observed that the tensile strengths of the two are similar, and also similar to the trend in uniaxial compression, due to the higher strength of the non-circular lightweight aggregate, the peak stress of its concrete specimen under tension is slightly larger than that of the circular LWAC specimen.
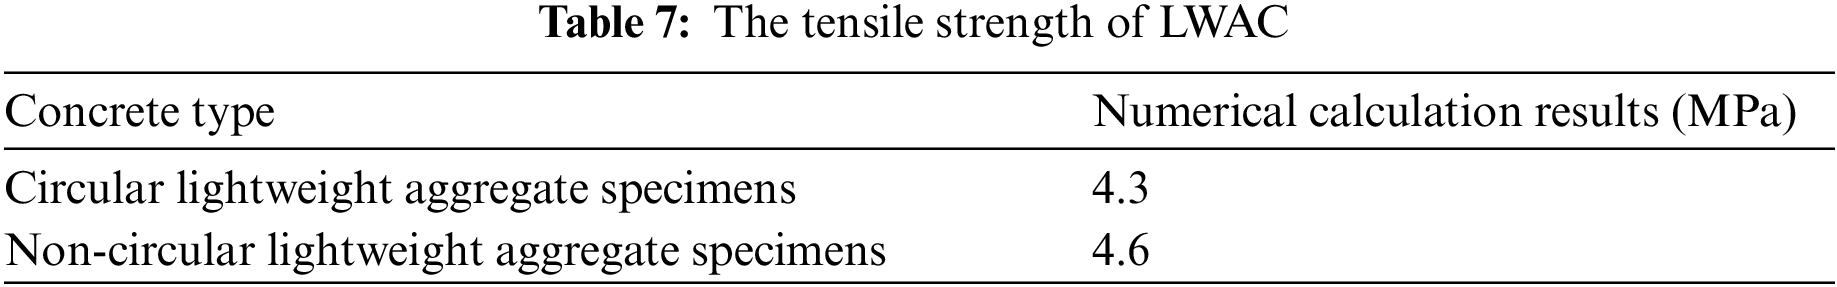
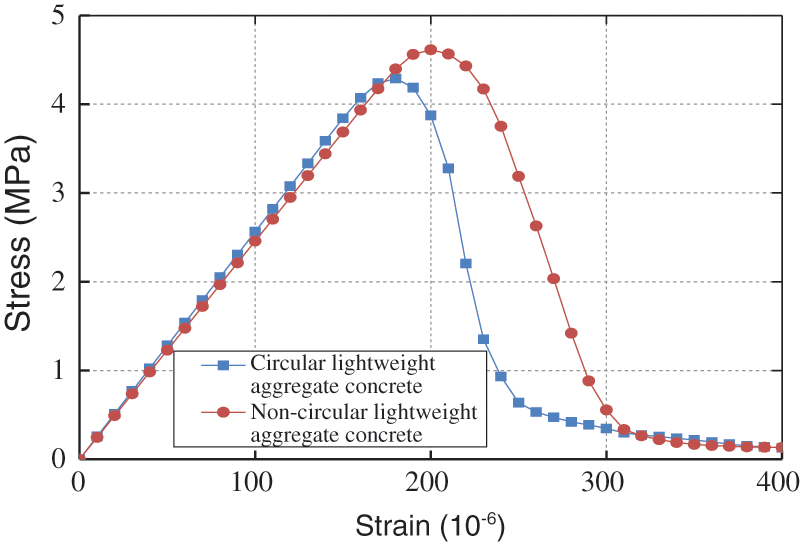
Figure 20: Stress-strain curve of high-strength LWAC under uniaxial tension
To investigate the micro-damage and failure process of high-strength LWAC under uniaxial tension, the graphical display module in the Fortran program was used to draw the damage and failure diagrams of the circular LWAC specimens and the non-circular LWAC specimens under uniaxial tension, as shown in Figs. 21 and 22. In the damage process diagrams obtained from numerical calculations, mortar is shown in light gray, lightweight aggregate in blue, interface elements in light blue, and failed elements in black.
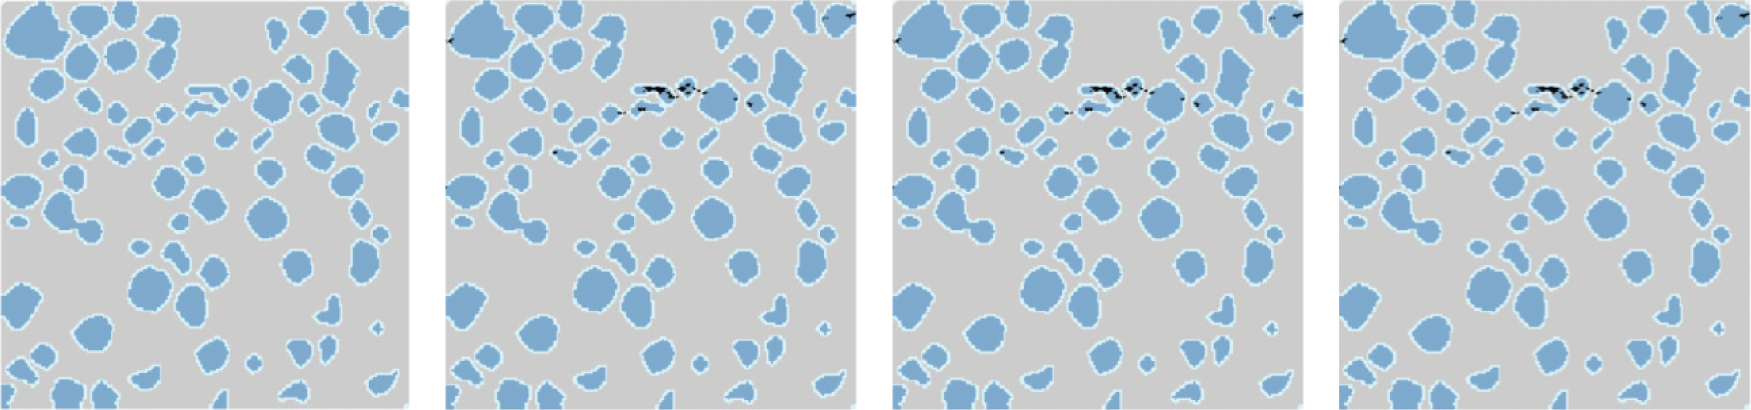
Figure 21: Failure process diagram for numerical calculation of circular LWAC
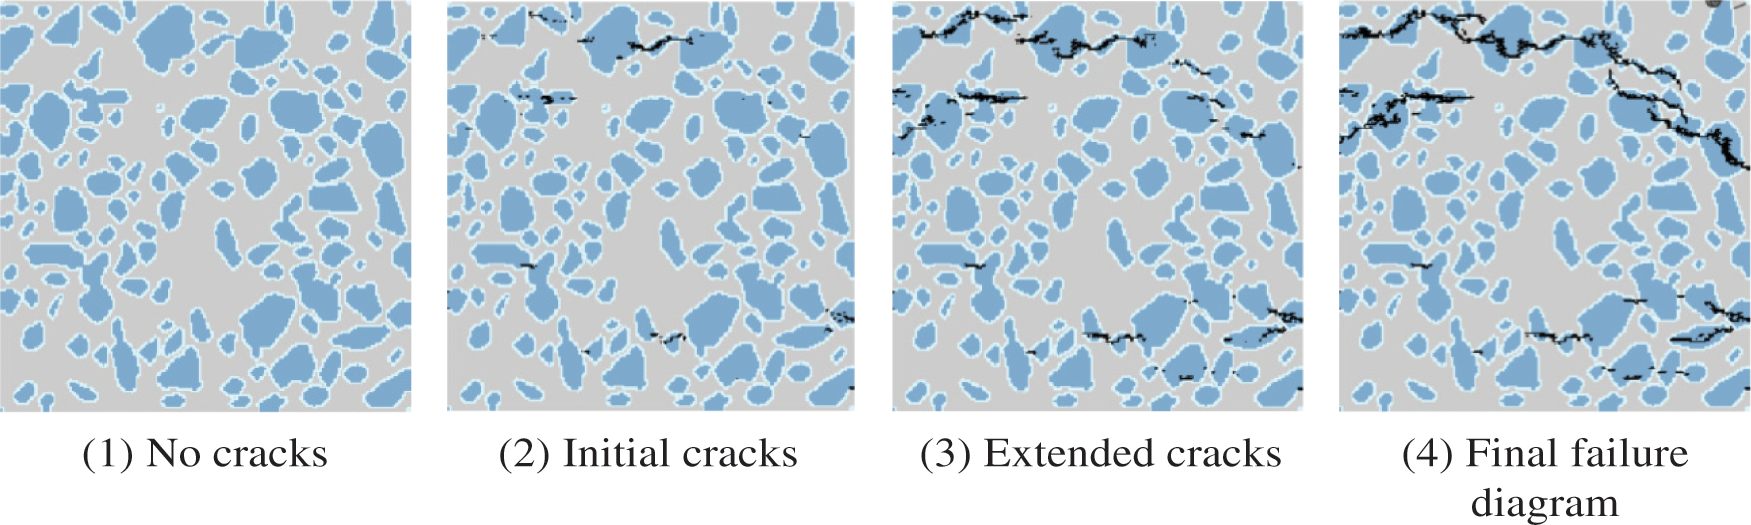
Figure 22: Failure process diagram for test of non-circular LWAC
The damage evolution of high-strength LWAC specimens during uniaxial tension can be observed from the damage diagrams. During the initial loading stage, all constituent materials of the specimen undergo elastic deformation, without apparent damage. As the tensile displacement continues to increase, the tensile strain gradually increases. Once the tensile strain exceeds the ultimate tensile strain of LWAC, the specimen is pulled apart, forming cracks perpendicular to the loading direction. It can be observed that in high-strength LWAC, the cracks formed in the specimen under tensile failure are not uniformly distributed throughout the specimen, but are concentrated in certain areas, mostly within the lightweight aggregate, with only a few bond interfaces failing. When the nearby lightweight aggregates are damaged, the cracks propagate through the mortar and interface layers to finally reach a main crack that penetrates the specimen and causes failure.
3.4 Mesoscopic Simulation for Notched Three-Point Bending Beams of LWAC
3.4.1 The Loading Model Beam of the LWAC
In Section 2, the mesoscopic model of the real aggregate distribution of the beam that was obtained by image processing technology, was used in this numerical simulation. In this work, a calculation model of the mechanical behavior of the three-point bending test of LWAC beams was established. The beam has a size of 75 mm × 350 mm and no notch. The numerical specimen was uniformly meshed with a pixel size of 1 mm and a uniform meshing method was used. The loading model is shown in Fig. 23, where the bottom of the numerical specimen is fixed with hinged constraints at both ends, and a vertical downward load is applied in the middle area of the top of the beam. The loading was performed by stepwise static displacement, and the displacement value of each loading step was set to 0.005 mm, which does not affect the calculation.
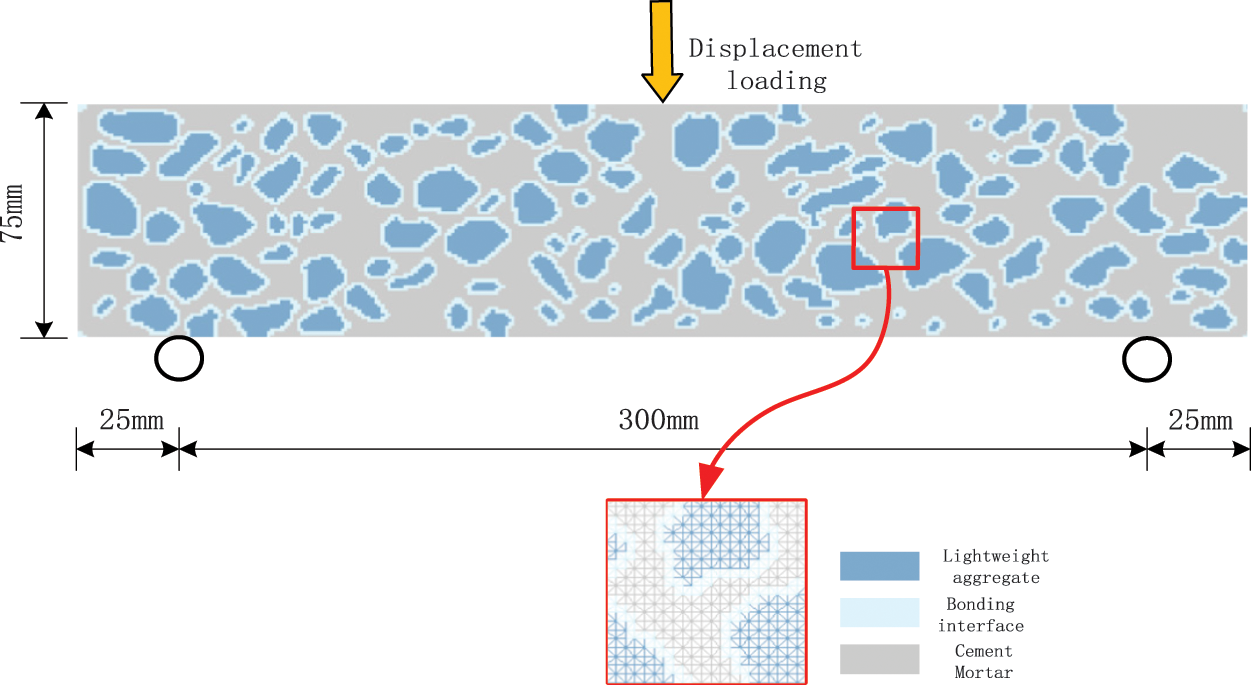
Figure 23: Loading model of lightweight aggregate beam
In the mechanical calculation model, the multiple broken-line damage constitutive model is adopted for each phase material in the model. The related parameters of the constitutive model are shown in Table 8. The material parameters of the beam are shown in Table 9.


3.4.2 Numerical Simulation Results
Fig. 24 presents the damage process of the LWAC beam obtained in this study. The crack propagation path can be observed from the figure. It can be seen that the damage is concentrated and forms a continuous main crack when the specimen is finally damaged, exhibiting strong brittleness, which is similar to the failure mode of the ordinary concrete three-point bending beam obtained from experiments (Fig. 25). The difference is that in the early stage of loading, the damage of the LWAC beam is mainly distributed in the lightweight aggregate particles at the bottom edge of the specimen’s mid-span, while the damage of the ordinary concrete beam mainly occurs at the bonding interface. This is because the tensile strength of lightweight aggregate particles is the weakest among the three-phase materials in concrete. Therefore, when subjected to loads, the interior of the lightweight aggregate particles in the stress concentration area at the bottom will be damaged first. With the continuation of displacement loading, the damaged area of the tensile zone at the bottom gradually increases, the damaged units are interconnected, and obvious cracks are formed, which quickly propagate upwards. In the later stage of loading, the lightweight aggregate at the loading point at the top of the beam also appears to have compressed cracks. Finally, the crack vertically penetrates the entire specimen, and the specimen reaches the failure state. Fig. 26 shows the failure mode of the mid-span width of 50 mm of the ceramic particle concrete beam. The calculation results of this section are consistent with this, indicating the rationality of the numerical model in this work.
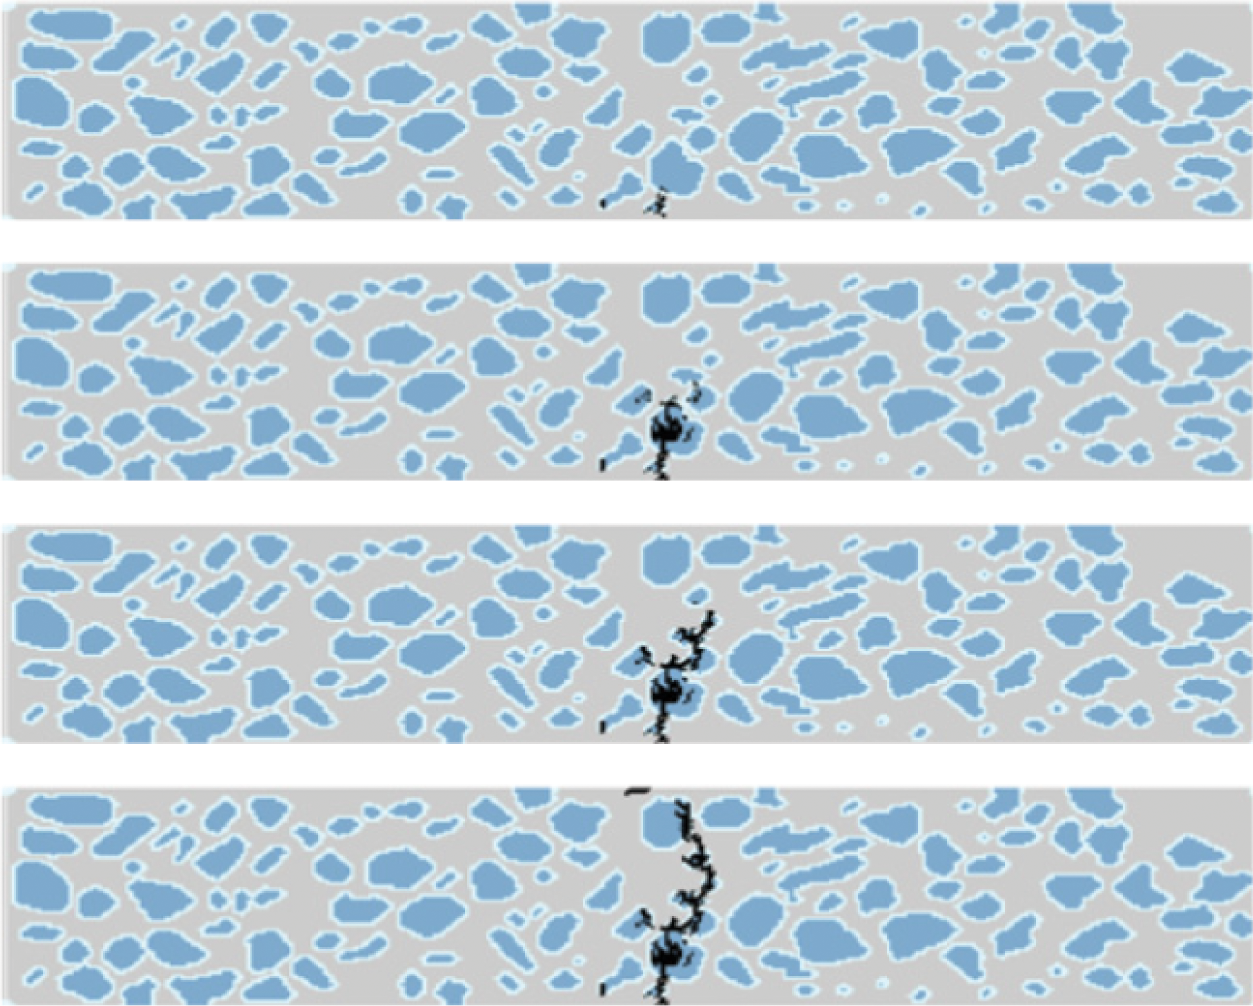
Figure 24: Failure process of LWAC three-point bending beam
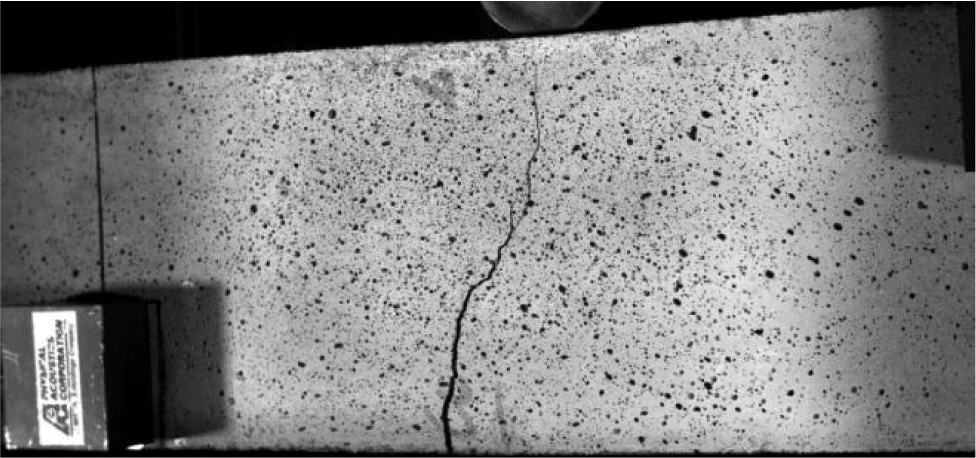
Figure 25: Failure diagram of concrete three-point bending beam obtained by test
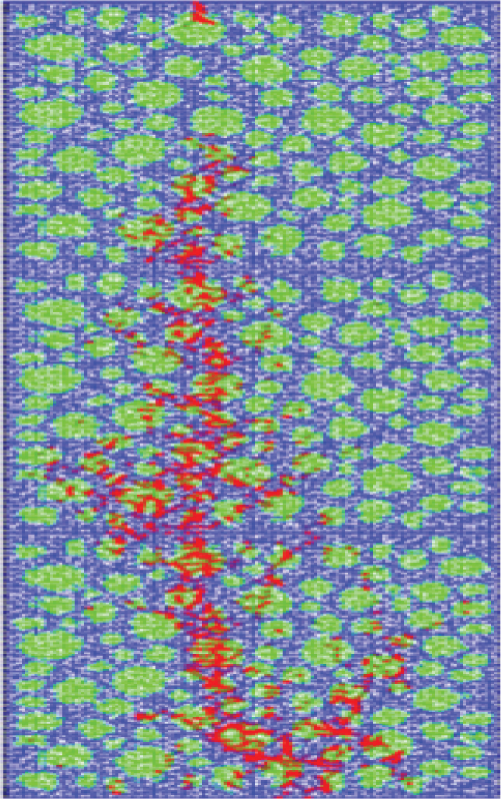
Figure 26: Failure mode in spans of LWAC three-point bending beam
The stress contour plot of the LWAC beam under the maximum loading capacity, generated using MATLAB programming, is shown in Fig. 27. From the plot, it can be observed that the top of the specimen is under compression stress, while the bottom is under tension stress. The stress values are relatively high at the top of the specimen where the load is applied and at the midspan bottom, which is consistent with the bending theory of the beam.
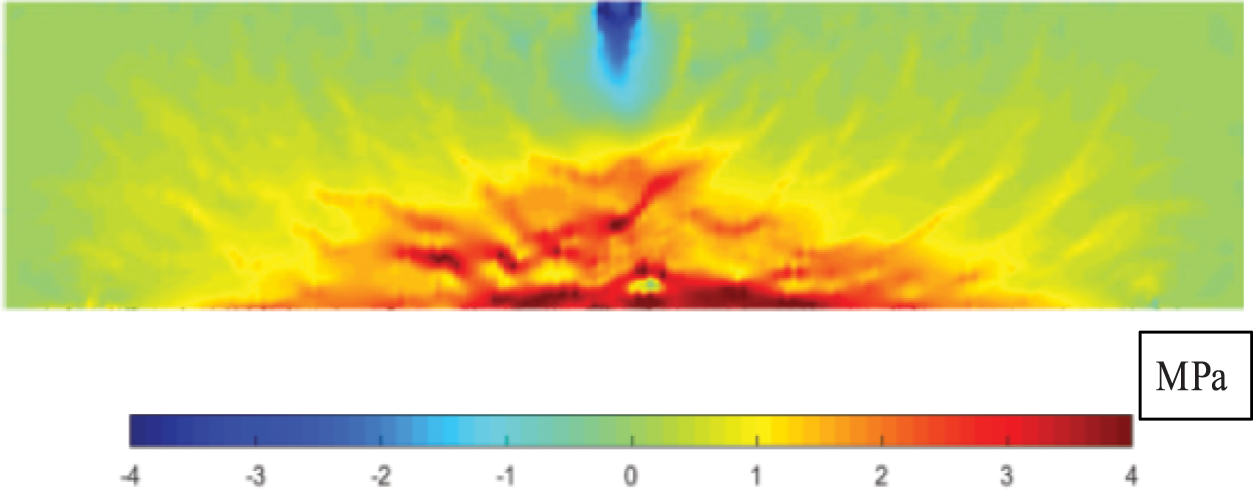
Figure 27: Nephogram of maximum principal stress at maximum loading force
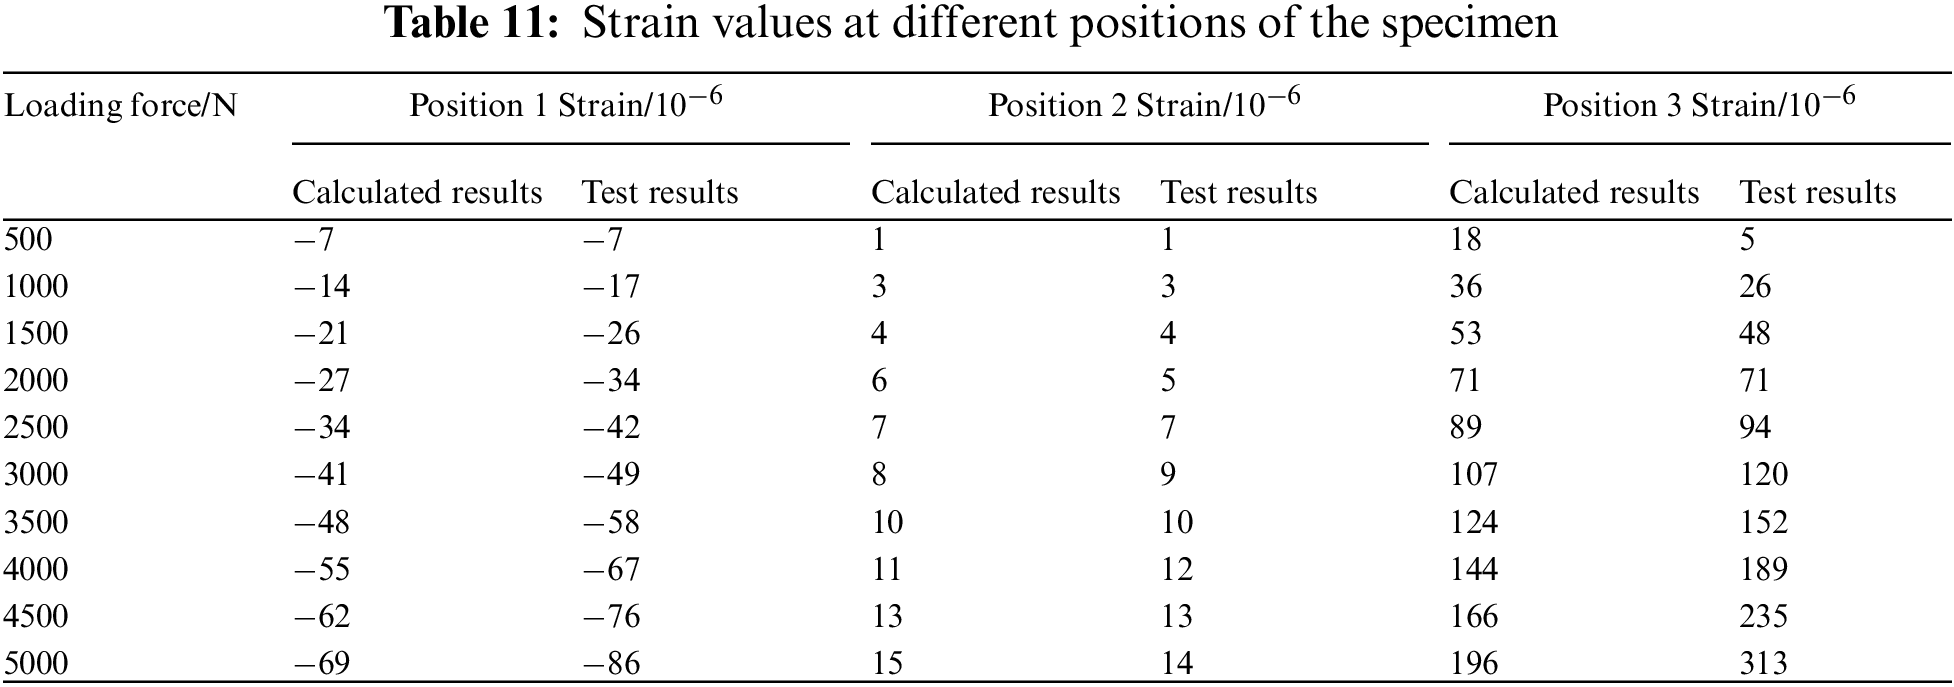
To further verify the rationality of the numerical model and the reliability of the numerical calculations, this study selected the stress and strain at the mid-point of the bottom of the specimen, as well as the strain values measured by the strain gauges at three locations (shown in Fig. 28) in the experiment [37], as comparative indicators. Tables 10 and 11 present the comparison results.
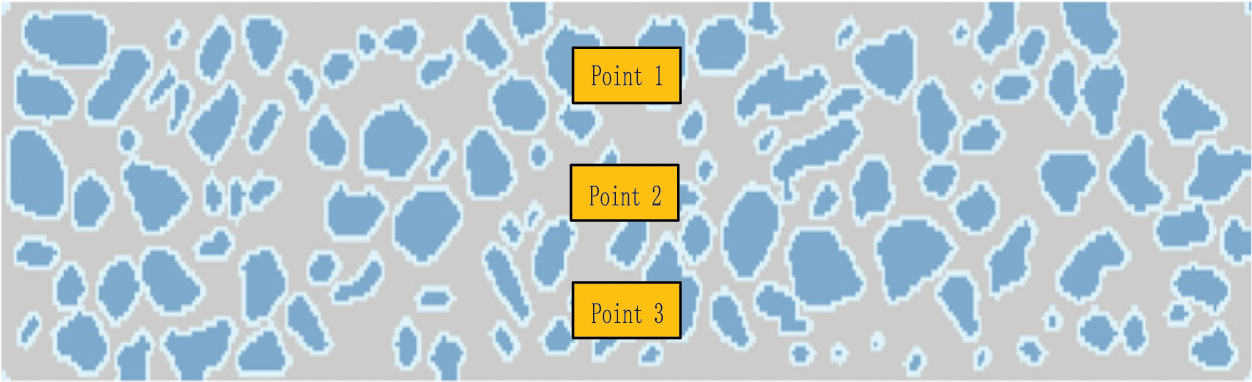
Figure 28: Schematic diagram of strain gauge test position
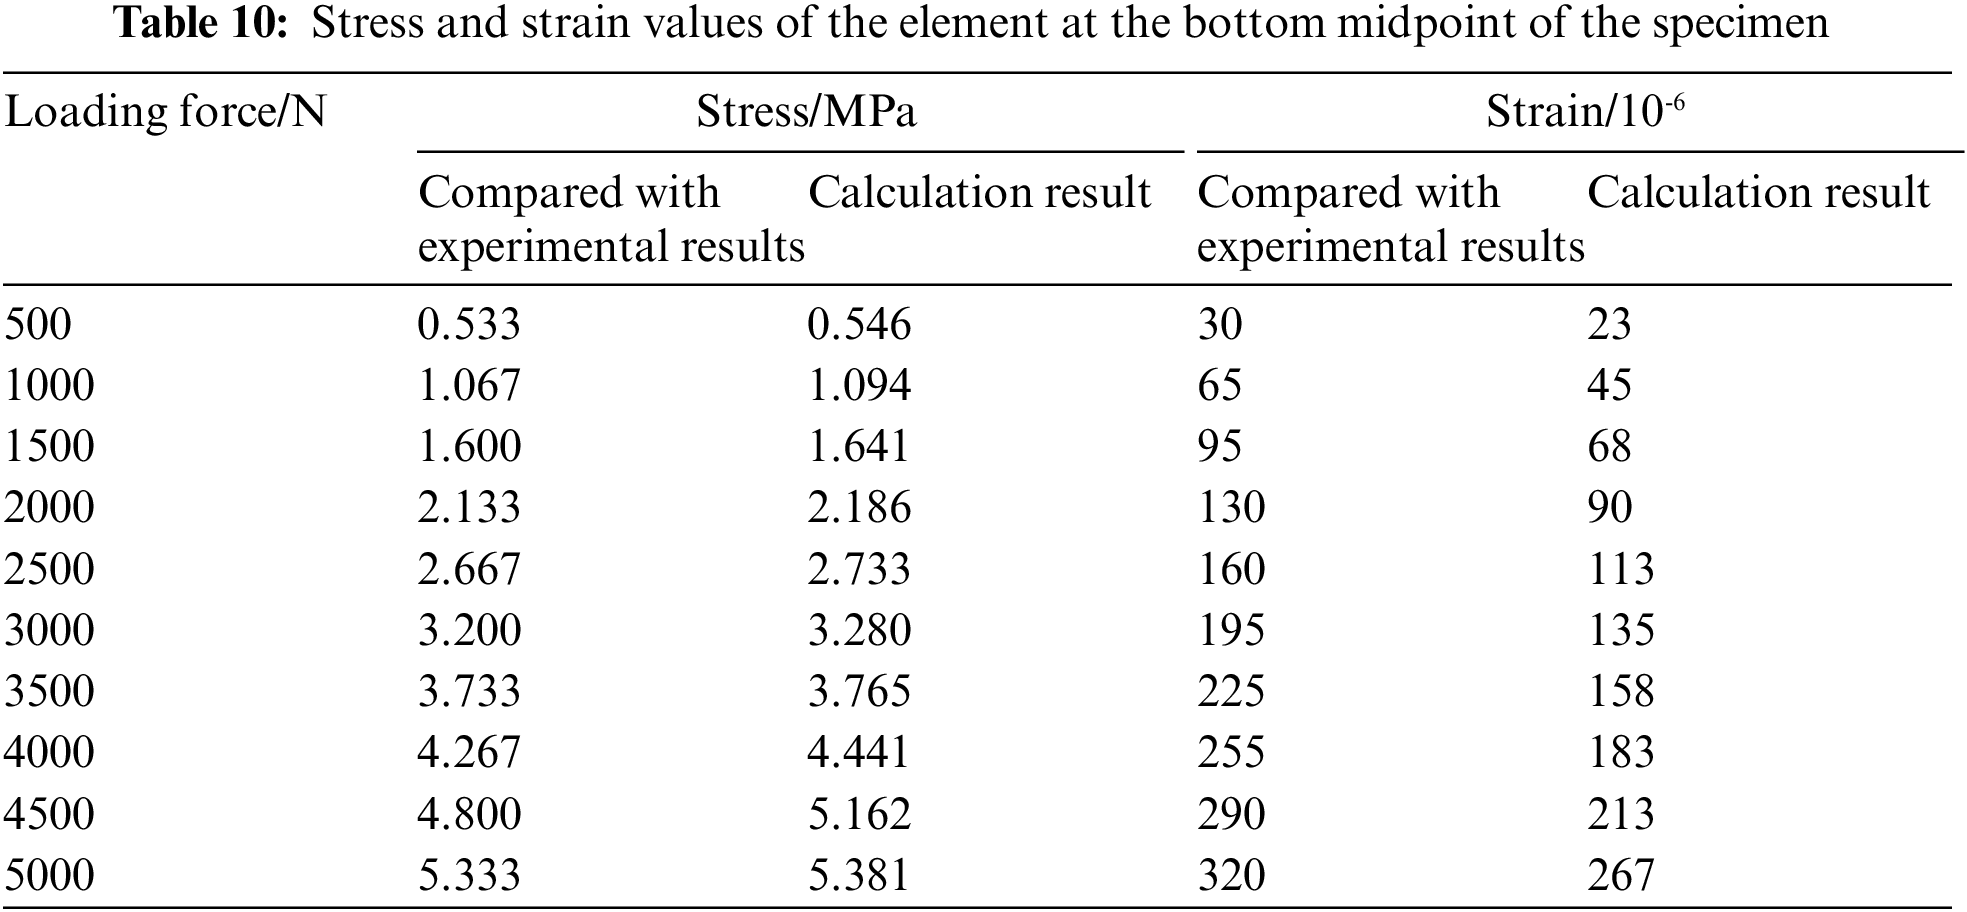
The numerical results of stress-strain calculations at the midpoint of the bottom of the numerical specimens under loading forces of 500, 1000, 1500, 2000, 2500, 3000, 3500, 4000, 4500, and 5000 N were selected for comparison with the experimental data, and the comparison results are shown in Table 10. It can be seen that the numerical calculation results are close to the experimental results, with a small error. This further verifies the rationality of the numerical model and the reliability of the numerical calculation.
Similarly, the measured strain values at three locations of the numerical specimen were compared with the experimental results for the loading forces of 500, 1000, 1500, 2000, 2500, 3000, 3500, 4000, 4500, and 5000 N, and the comparison results are shown in Table 11. From the table, it can be seen that position 1 is the compression zone at the top of the specimen, and both the measured and calculated strain values obtained by the numerical method and the experimental method are negative. Position 2 is the middle of the specimen, and the strain values obtained by both the experimental and numerical methods are relatively small, and the increase in strain values for both methods are also small as the loading force increases. Position 3 is the tension zone at the bottom of the specimen, and the strain values obtained by both the experimental and numerical methods are positive, with a relatively large value in the numerical method. Overall, the error between the measured values from the experiment and the calculated values from the numerical model is small, which verifies the reliability of the numerical model.
Similar to normal strength LWAC, in the numerical simulation process of static uniaxial compression and tension of high-strength LWAC specimens, most of the cracks in the specimens directly penetrate the aggregate particles. The cracks formed in the specimens under tension are not uniformly distributed throughout the specimens, but are concentrated in certain areas. When nearby lightweight aggregates are damaged, the cracks penetrate through the mortar and interfacial layers, and eventually there is a main crack that penetrates the entire specimen.
This study established a mesoscopic model of LWAC three-point bending beam based on digital image processing technology and conducted numerical simulation of the three-point bending test. The numerical simulation results were compared with the corresponding experimental results. The results showed that the stress value was higher at the loading position of the specimen and at the midpoint of the bottom of the specimen, and the strain was higher in the bottom tensile zone, which was following the bending theory and demonstrated the rationality of the numerical model in this work.
This work is based on the digital image-based mesoscopic model established in Section 2. Using the base force element method on the potential energy principle for damage analysis, the mesoscopic mechanical properties and mesoscopic damage and failure characteristics and patterns of lightweight aggregate concrete specimens under different types of loads were studied. The numerical calculation results were compared and analyzed with experimental results. The following observations can be made:
• In this investigation, the development of a two-dimensional mesoscopic model of LWAC based on digital image technology represents an innovative advancement. The accuracy of this model in reflecting the distribution of aggregates within real concrete specimens signifies a substantive contribution to the field.
• The introduction of a micromechanical damage calculation program employing the base force element method of the potential energy principle has enabled the numerical simulation of uniaxial compression tests with a significant reduction in error compared to traditional methods. This innovative alignment with experimental data underscores the robustness of the developed model.
• A comprehensive examination of the stress characteristics and damage process of LWAC under uniaxial compression was conducted, utilizing the Graphic Display Module and MATLAB for contour plotting. This methodology not only elucidates the outcomes but also serves as a potential platform for further investigation and development in the domain.
• This study innovatively developed a numerical simulation for three-point bending on a notched beam. The fine-scale numerical model elucidated here offers an evidence-based demonstration of feasibility and reasonableness in simulating LWAC’s mechanical properties and failure modes.
• Employing a pioneering approach, this research conducted uniaxial compression tests on high-strength circular and non-circular lightweight aggregate numerical specimens, employing digital image processing techniques. The findings regarding the differential strength of non-circular ceramic particles contribute to a nuanced and complex understanding of material properties, suggesting potential enhancements in construction methodologies.
• By executing uniaxial tension tests on numerical specimens of both circular and non-circular LWAC, the study innovatively explored the underlying mechanics of material behavior under tension, contributing significant insights to the body of knowledge in the field.
• The creation of a mesoscopic model of the real aggregate distribution of the beam, predicated on image processing technology, adds a novel dimension to this study. The congruity of the damage process and the occurrence of a continuous main crack at the point of ultimate damage substantiate the rationality and validity of the numerical model.
• The physical parameters of materials have a great influence on the results of finite element calculation. Further research on the physical parameters of materials should be carried out in the future. It is also possible to enter the artificial neural network for statistical analysis of the database sample of the test data. The combination of image processing technology and machine learning technology is a research direction for the future.
Based on the digital image mesoscopic model and employing the damage analysis program of the base force element method grounded in the principle of potential energy, this study investigated the macroscopic mechanical properties and mesoscopic damage and failure characteristics and patterns of LWAC specimens under different types of loads. A comparative analysis between the numerical calculation results and experimental results was conducted, leading to the following main conclusions:
1. The base force element method for damage analysis and the corresponding calculation and analysis program can be utilized to numerically simulate the uniaxial tensile, compression tests, and three-point bending tests of LWAC. The numerical analysis results are in basic agreement with the experimental results.
2. The study demonstrates that by employing image processing technology and an optimized MATLAB image recognition program, it is possible to obtain information from the cross-sectional images of LWAC. This can adequately characterize the mesoscopic heterogeneity of LWAC, accurately reflecting the shape and distribution of the aggregates.
3. A mesoscopic model of the LWAC three-point bending beam was established based on digital image processing technology. Numerical simulation of the three-point bending test was conducted and the simulation results were compared and analyzed with relevant experimental results. The research findings indicate that the stress values at the loading position of the specimen and the midpoint of the specimen’s bottom are higher, and the strain is greater in the bottom tensile zone. This aligns with the bending theory and confirms the accuracy of the numerical model.
4. Additionally, based on digital image processing technology, uniaxial tension and compression models of high-strength LWAC were established. The numerical simulation results were compared and analyzed with related experimental results. It was observed that, similar to normal-strength LWAC, in the numerical simulation process of static uniaxial compression and tension, most cracks in the specimens directly penetrate the aggregate particles. The cracks formed in the specimens under tension are not uniformly distributed throughout the specimens but are concentrated in certain areas, mostly within the lightweight aggregate. When nearby lightweight aggregates are damaged, the cracks propagate through the mortar and interface layers, eventually leading to a main crack that penetrates the entire specimen, leading to failure.
5. The application of graphic processing technology is one of the future directions for theoretical research on LWAC. It can more accurately reflect the real mesoscopic structure of LWAC. Future studies may focus on the in-depth research and widespread application of graphic processing technology and CT scanning technology in the three-dimensional mesoscopic analysis field of LWAC materials.
Acknowledgement: None.
Funding Statement: The work in this study was supported by the National Science Foundation of China (10972015, 11172015), the Beijing Natural Science Foundation (8162008).
Author Contributions: Study conception and design: Safwan Al-sayed, Xi Wang; data collection: Safwan Al-sayed, Xi Wang; analysis and interpretation of results: Safwan Al-sayed, Xi Wang; draft manuscript preparation: Safwan Al-sayed, Xi Wang, Yijiang Peng. All authors reviewed the results and approved the final version of the manuscript.
Availability of Data and Materials: Not applicable.
Conflicts of Interest: The authors declare that they have no conflicts of interest to report regarding the present study.
References
1. S. Y. Chung, P. Sikora, D. J. Kim, M. E. El Madawy, and M. Abd Elrahman, “Effect of different expanded aggregates on durability-related characteristics of lightweight aggregate concrete,” Mater. Charact., vol. 173, no. 585, pp. 110907, 2021. doi: 10.1016/j.matchar.2021.110907. [Google Scholar] [CrossRef]
2. M. S. Selman and Z. K. Abbas, “The use of lightweight aggregate in concrete: A review,” J. Eng., vol. 28, no. 11, pp. 1–13, 2022. doi: 10.31026/j.eng.2022.11.01. [Google Scholar] [CrossRef]
3. M. Marvila, P. de Matos, E. Rodríguez, S. Monteiro, and A. de Azevedo, “Recycled aggregate: A viable solution for sustainable concrete production,” Materials, vol. 15, no. 15, pp. 5276, 2022. doi: 10.3390/ma15155276. [Google Scholar] [PubMed] [CrossRef]
4. R. Prakash, N. Divyah, S. Srividhya, S. Avudaiappan, M. Amran and S. Naidu Raman, “Effect of steel fiber on the strength and flexural characteristics of coconut shell concrete partially blended with Fly Ash,” Materials, vol. 15, no. 12, pp. 4272, 2022. doi: 10.3390/ma15124272. [Google Scholar] [PubMed] [CrossRef]
5. J. Bao, R. Zheng, Y. Sun, P. Zhang, Y. Cui and S. Xue, “A state-of-the-art review on high temperature resistance of lightweight aggregate high-strength concrete,” J. Build. Eng., vol. 69, no. 12, pp. 106267, 2023. doi: 10.1016/j.jobe.2023.106267. [Google Scholar] [CrossRef]
6. S. Chaki and P. Krawczak, “Non-destructive health monitoring of Structural Polymer Composites: Trends and perspectives in the Digital Era,” Materials, vol. 15, no. 21, pp. 7838, 2022. doi: 10.3390/ma15217838. [Google Scholar] [PubMed] [CrossRef]
7. Z. Chang, Z. Wan, Y. Xu, E. Schlangen, and B. Šavija, “Convolutional neural network for predicting crack pattern and stress-crack width curve of air-void structure in 3D printed concrete,” Eng. Fract. Mech., vol. 271, no. 13, pp. 108624, 2022. doi: 10.1016/j.engfracmech.2022.108624. [Google Scholar] [CrossRef]
8. L. M. Evans, E. Sözümert, B. E. Keenan, C. E. Wood, and A. du Plessis, “A review of image-based simulation applications in high-value manufacturing,” Arch. Comput. Methods Eng., vol. 30, no. 3, pp. 1495–1552, 2023. doi: 10.1007/s11831-022-09836-2. [Google Scholar] [PubMed] [CrossRef]
9. L. F. Fan, H. Ding, W. L. Zhong, and C. B. Xu, “A rapid approach for determining the mechanical properties of geopolymer concrete based on Image Processing Technology (IPT),” Constr. Build. Mater., vol. 378, pp. 131165, 2023. doi: 10.1016/j.conbuildmat.2023.131165. [Google Scholar] [CrossRef]
10. J. Dang, L. Hao, J. Xiao, and T. Ding, “Utilization of excavated soil and sewage sludge for green lightweight aggregate and evaluation of its influence on concrete properties,” J. Clean. Prod., vol. 390, no. 8, pp. 136061, 2023. doi: 10.1016/j.jclepro.2023.136061. [Google Scholar] [CrossRef]
11. J. B. Sousa, S. L. Garcia, and R. M. Pierott, “Shear behavior of recycled coarse aggregates concrete dry joints keys using digital image correlation technique,” Infrastructures, vol. 8, no. 3, pp. 60, 2023. doi: 10.3390/infrastructures8030060. [Google Scholar] [CrossRef]
12. X. Feng, B. Gong, C. Tang, and T. Zhao, “Study on the non-linear deformation and failure characteristics of EPS concrete based on CT-scanned structure modelling and cloud computing,” Eng. Fract. Mech., vol. 261, no. 4, pp. 108214, 2022. doi: 10.1016/j.engfracmech.2021.108214. [Google Scholar] [CrossRef]
13. G. Xiong, C. Wang, S. Zhou, and Y. Zheng, “Study on dispersion uniformity and performance improvement of steel fibre reinforced lightweight aggregate concrete by vibrational mixing,” Case Stud. Constr. Mater., vol. 16, no. 3, pp. e01093, 2022. doi: 10.1016/j.cscm.2022.e01093. [Google Scholar] [CrossRef]
14. C. Fu, M. Chen, R. Guo, and R. Qi, “Green-engineered cementitious composite production with high-strength synthetic fiber and aggregate replacement,” Materials, vol. 15, no. 9, pp. 3047, 2022. doi: 10.3390/ma15093047. [Google Scholar] [PubMed] [CrossRef]
15. M. I. Waris, V. Plevris, J. Mir, N. Chairman, and A. Ahmad, “An alternative approach for measuring the mechanical properties of hybrid concrete through image processing and machine learning,” Constr. Build. Mater., vol. 328, no. 1851, pp. 126899, 2022. doi: 10.1016/j.conbuildmat.2022.126899. [Google Scholar] [CrossRef]
16. X. Sun, W. Liao, A. Kumar, K. H. Khayat, Z. Tian and H. Ma, “Multi-level modeling of thermal behavior of phase change material incorporated lightweight aggregate and concrete,” Cem. Concr. Compos., vol. 122, no. 1, pp. 104131, 2021. doi: 10.1016/j.cemconcomp.2021.104131. [Google Scholar] [CrossRef]
17. A. Montazerian, M. Nili, N. Haghighat, and N. Loghmani, “Experimental and simplified visual study to clarify the role of aggregate-paste interface on the early age shrinkage and creep of high-performance concrete,” Asian J. Civ. Eng., vol. 22, no. 8, pp. 1461–1480, 2021. doi: 10.1007/s42107-021-00392-x. [Google Scholar] [CrossRef]
18. A. J. Tenza-Abril, P. Compañ-Rosique, R. Satorre-Cuerda, A. M. Solak, and D. Gavotti Freschi, “Smartphone application for determining the segregation index of lightweight aggregate concrete,” Sustainability, vol. 13, no. 22, pp. 12564, 2021. doi: 10.3390/su132212564. [Google Scholar] [CrossRef]
19. Y. Peng, L. Ying, M. M. Kamel, and Y. Wang, “Mesoscale fracture analysis of recycled aggregate concrete based on digital image processing technique,” Struct. Concr., vol. 22, no. S1, pp. 61, 2020. doi: 10.1002/suco.201900338. [Google Scholar] [CrossRef]
20. N. Haghighat, M. Nili, A. Montazerian, and R. Yousef, “Proposing an image analysis to study the effect of lightweight aggregate on shrinkage and creep of concrete,” Adv. Civil Eng. Mater., vol. 9, no. 1, pp. 20190025, 2020. doi: 10.1520/ACEM20190025. [Google Scholar] [CrossRef]
21. L. W. Zhang, A. O. Sojobi, and K. M. Liew, “Sustainable CFRP-reinforced recycled concrete for cleaner eco-friendly construction,” J. Clean. Prod., vol. 233, no. 5, pp. 56–75, 2019. doi: 10.1016/j.jclepro.2019.06.025. [Google Scholar] [CrossRef]
22. G. Xiong, C. Wang, S. Zhou, X. Jia, W. Luo and J. Liu, “Preparation of high strength lightweight aggregate concrete with the vibration mixing process,” Constr. Build. Mater., vol. 229, no. 1, pp. 116936, 2019. doi: 10.1016/j.conbuildmat.2019.116936. [Google Scholar] [CrossRef]
23. G. Ashish et al., “A novel approach for industrial concrete defect identification based on image processing and deep convolutional neural networks,” Case Stud. Const. Mat., vol. 19, pp. e02392, 2023. doi: 10.1016/j.cscm.2023.e02392. [Google Scholar] [CrossRef]
24. H. Lian, X. Sun, Y. Lian, L. Xie, and Z. Yu, “Strain rate effect on the fracture parameters of concrete three-point bending beam with a small span-to-height ratio,” Eng. Fract. Mech., vol. 281, no. 1, pp. 109133, 2023. doi: 10.1016/j.engfracmech.2023.109133. [Google Scholar] [CrossRef]
25. C. Rim, Q. Sun, and C. Kim, “Experimental and numerical study on improving mechanical properties of new polyurethane-emery thin polymer overlay (TPO) structure using three-point bending test,” Constr. Build. Mater., vol. 364, no. 6, pp. 129992, 2023. doi: 10.1016/j.conbuildmat.2022.129992. [Google Scholar] [CrossRef]
26. B. Wang, E. Zhu, C. Zhu, and Z. Zhang, “Effect of microstructural characteristics of lightweight aggregate concrete on fracture parameters of three-point bending notched beams,” Theor. Appl. Fract. Mech., vol. 121, no. 7, pp. 103545, 2022. doi: 10.1016/j.tafmec.2022.103545. [Google Scholar] [CrossRef]
27. V. Nguyen-Van, N. K. Choudhry, B. Panda, H. Nguyen-Xuan, and P. Tran, “Performance of concrete beam reinforced with 3D printed bioinspired primitive scaffold subjected to three-point bending,” Autom. Constr., vol. 134, no. 13, pp. 104060, 2022. doi: 10.1016/j.autcon.2021.104060. [Google Scholar] [CrossRef]
28. Y. Tang, H. Chen, and J. Xiao, “Size effects on the characteristics of Fracture Process Zone of plain concrete under three-point bending,” Constr. Build. Mater., vol. 315, no. 6, pp. 125725, 2022. doi: 10.1016/j.conbuildmat.2021.125725. [Google Scholar] [CrossRef]
29. W. Qayyum et al., “Predicting characteristics of cracks in concrete structure using convolutional neural network and image processing,” Front. Mater., vol. 10, pp. 255, 2023. doi: 10.3389/fmats.2023.1210543. [Google Scholar] [CrossRef]
30. W. Qayyum, R. Ehtisham, A. Bahrami, C. Camp, J. Mir and A. Ahmad, “Assessment of convolutional neural network pre-trained models for detection and orientation of cracks,” Materials, vol. 16, no. 2, pp. 826, 14 Jan. 2023. doi: 10.3390/ma16020826. [Google Scholar] [PubMed] [CrossRef]
31. M. I. Waris, V. Plevris, J. Mir, N. Chairman, and A. Ahmad, “An alternative approach for measuring the mechanical properties of hybrid concrete through image processing and machine learning,” Constr. Build. Mater., vol. 328, no. 1851, pp. 126899, 18 Apr. 2022. doi: 10.1016/j.conbuildmat.2022.126899. [Google Scholar] [CrossRef]
32. Y. L. Gao, J. B. Chen, C. Zou, and L. Cheng, “Research on mesoscopic crack propagation law of lightweight aggregate concrete based on industrial CT test,” (in ChineseSilic. Bullet., vol. 33, no. 4, pp. 947–952, 2014. [Google Scholar]
33. J. Shengtao, “Fracture test and simulation research of lightweight aggregate concrete,” Univ. of Technology, China, 2019 (in Chinese). [Google Scholar]
34. S. Al-sayed, X. Wang, and Y. Peng, “Analysis of mechanical properties and failure mechanism of lightweight aggregate concrete based on Meso level,” Materials, vol. 16, no. 15, pp. 5283, 2023. doi: 10.3390/ma16155283. [Google Scholar] [PubMed] [CrossRef]
35. L. Kyung-Ho, K. H. Yang, J. H. Mun, and N. van Tuan, “Effect of sand content on the workability and mechanical properties of concrete using bottom ash and dredged soil-based artificial lightweight aggregates,” Int. J. Concr. Struct. Mater., vol. 13, no. 1, pp. 1–13, 2019. doi: 10.1186/s40069-018-0306-z. [Google Scholar] [CrossRef]
36. S. Fatima, K. Ezziane, and B. Setti, “Investigation of mechanical characteristics and specimen size effect of steel fibers reinforced concrete,” J. Adhes. Sci. Technol., vol. 34, no. 13, pp. 1426–1441, 2020. doi: 10.1080/01694243.2019.1709340. [Google Scholar] [CrossRef]
37. X. Q. Zhou and H. Hao, “Mesoscale modelling of concrete tensile failure mechanism at high strain rates,” Comput. Struct., vol. 86, no. 21–22, pp. 2013–2026, 2008. doi: 10.1016/j.compstruc.2008.04.013. [Google Scholar] [CrossRef]
Cite This Article
 Copyright © 2024 The Author(s). Published by Tech Science Press.
This work is licensed under a Creative Commons Attribution 4.0 International License , which permits unrestricted use, distribution, and reproduction in any medium, provided the original work is properly cited.
 Downloads
 Citation Tools