
 Submit a Paper
 Propose a Special lssue
 Open Access
ARTICLE

THAPE: A Tunable Hybrid Associative Predictive Engine Approach for Enhancing Rule Interpretability in Association Rule Learning for the Retail Sector
Information Technology Department, King Abdulaziz University, Jeddah, 21589, Saudi Arabia
* Corresponding Author: Monerah Alawadh. Email:
(This article belongs to the Special Issue: Intelligent Computing Techniques and Their Real Life Applications)
Computers, Materials & Continua 2024, 79(3), 4995-5015. https://doi.org/10.32604/cmc.2024.048762
Received 18 December 2023; Accepted 28 April 2024; Issue published 20 June 2024
 View Full Text
 Download PDF
Abstract
Association rule learning (ARL) is a widely used technique for discovering relationships within datasets. However, it often generates excessive irrelevant or ambiguous rules. Therefore, post-processing is crucial not only for removing irrelevant or redundant rules but also for uncovering hidden associations that impact other factors. Recently, several post-processing methods have been proposed, each with its own strengths and weaknesses. In this paper, we propose THAPE (Tunable Hybrid Associative Predictive Engine), which combines descriptive and predictive techniques. By leveraging both techniques, our aim is to enhance the quality of analyzing generated rules. This includes removing irrelevant or redundant rules, uncovering interesting and useful rules, exploring hidden association rules that may affect other factors, and providing backtracking ability for a given product. The proposed approach offers a tailored method that suits specific goals for retailers, enabling them to gain a better understanding of customer behavior based on factual transactions in the target market. We applied THAPE to a real dataset as a case study in this paper to demonstrate its effectiveness. Through this application, we successfully mined a concise set of highly interesting and useful association rules. Out of the 11,265 rules generated, we identified 125 rules that are particularly relevant to the business context. These identified rules significantly improve the interpretability and usefulness of association rules for decision-making purposes.Keywords
Association rule mining is a well-established technique in data mining and machine learning, widely used for discovering relationships or patterns within datasets [1]. The output of association rule mining consists of a set of rules that describe the associations between items or attributes in the dataset. However, these rules are often generated in large numbers, including irrelevant or redundant rules [2]. In association rule learning, post-processing is a crucial phase that aims to enhance the quality and quantity of the generated rules by removing pointless or repetitive ones, while uncovering intriguing and useful patterns.
Recently, several post-processing methods have been proposed, such as visualization, filtering, ontology-based summarization, meta-rule pruning, and clustering. These methods can be categorized into two main groups: Post-processing as representation, which encompasses visualization techniques like scatter plots, spanning trees, heat maps, and group matrices, among others. The second group is post-processing as technique, further divided into descriptive analysis techniques (e.g., filtering, pruning, merging) and predictive analysis techniques (e.g., clustering, classification, regression). Each method has its own strengths and weaknesses, and researchers are dedicated to identifying the most effective techniques for enhancing rule interpretability and improving the quality of generated rules.
One key post-processing method is visualization. Researchers, such as [3] and [4], have applied visualization techniques to gain a better understanding of the structure of the generated rule set. By visualizing the rules in a graphical format, it becomes easier to identify patterns and relationships among the different rules. However, it is worth noting that certain visualization methods may not be suitable for large, complex rule sets, as they can become difficult to interpret and navigate.
Another essential post-processing method is filtering, as suggested by researchers such as [5–7]. Filtering aims to remove irrelevant or redundant rules from the generated set, thereby reducing the size of the rule set and improving its quality. However, it is important to note that filtering methods may inadvertently eliminate important rules or introduce bias into the rule set, depending on the criteria used for selection. Summarization with Ontologies [6–9] and Pruning with Meta-rules [10,11] are other descriptive analysis techniques utilized in association rule learning. Summarization with Ontologies involves reducing the number of rules that need to be explored by iteratively incorporating the user’s knowledge during the post-processing stage. On the other hand, Pruning with Meta-rules involves generating rules about rules (meta-rules) to facilitate the interpretation of the original rules.
Clustering is another post-processing method that has been suggested for improving rule sets, as proposed by researchers such as [10,12,13]. This method involves grouping similar rules together based on their attributes or characteristics. Clustering can help identify patterns and relationships between different rules, making it easier to interpret the rule set. However, it is important to note that clustering methods may also group together rules that are not actually similar, leading to less accurate results.
The paper’s main contribution is to propose an association rule post-processing engine that is able to predict consumer buying behavior, explore most interesting and hidden association rules that may affect the sales, provide a backtracking ability; trace a given product and explore their associated product/s.
Association rule post-processing is a very important step in understanding consumer buying behavior. According to one of the biggest supermarket chains [14,15], the sales volume dramatically dropped when they removed a specific product (cat food) from one branch. This product is associated with many other products, and a large portion of their consumers come to this branch to buy cat food and then purchase other items. Therefore, understanding the associated products and backtracking (tunability) is also crucial [16,17]. Nowadays, there are different methods of association rule post-processing, as shown in Fig. 1 and discussed in the literature. Overall, each post-processing method has its own advantages and disadvantages, and researchers continue to explore new techniques for improving the quality and interpretability of generated rules. In this proposal, we are suggesting our own post-processing method that best aligns with our goals and is suitable for our specific data.
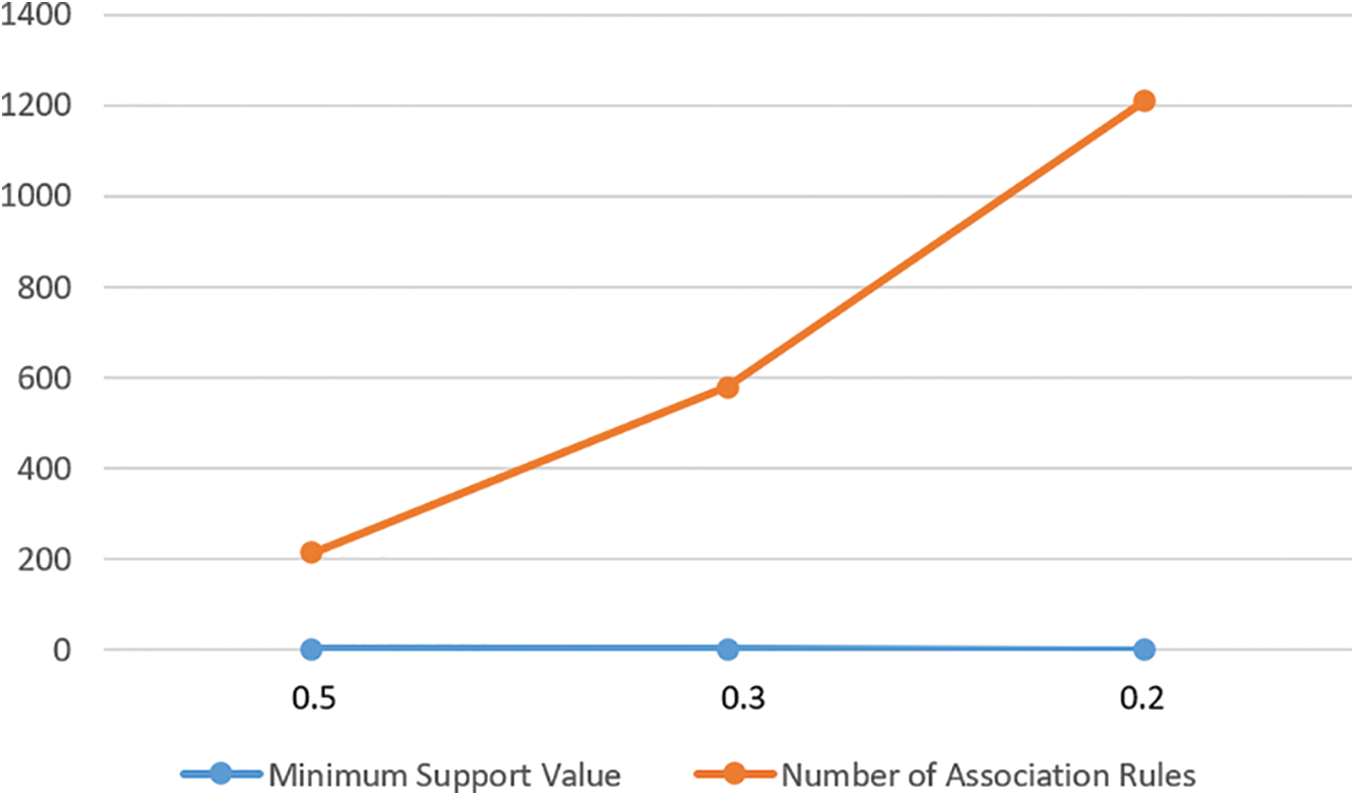
Figure 1: Impact of support value on the number of generated rules
In the area of association rule learning, the usefulness of association rule learning is strongly limited by the huge number of generated rules. Reference [2] shows that the resulted association rules become almost difficult to use when their number exceeds one hundred. At the same time, some interesting rules are represented by those rare (low support). Unfortunately, the lower the support is, the larger the volume of rules becomes. Thus, it is crucial to help the business owner and the decision maker with an efficient post-processing technique(s) to reduce the number of rules.
As shown in Fig. 1, we obtained 214 rules with a minimum support value of 0.5 (threshold), 578 rules with a minimum support value of 0.3, and 1,209 rules with a minimum support value of 0.2. However, setting the minimum support value too low would result in a significantly higher number of rules, which may not be practical for accurate predictions and actionable insights into consumers’ buying behavior. Therefore, it is crucial to choose a reasonable support value that allows the algorithm to generate a manageable yet informative set of rules (hidden rules).
Additionally, there are certain products that hold substantial importance for sales from a business perspective. It is crucial for the business to exercise caution when considering the removal or relocation of these products. Typically, these products belong to different sections, as defined by the business. Hence, our objective is to assist the business in identifying these products and uncovering their relationships by understanding the rules that connect products across different sections. To achieve this, we need to develop a post-processing engine that not only extracts previously unknown hidden rules that impact sales but also provides tunable functionality. This tunable engine will allow us to backtrace and analyze the relationships between specific products and all other products.
Therefore, it is essential to incorporate a post-processing approach that includes rule filtering, merging, or classification. This approach aims to reduce the number of rules while ensuring accurate consumer behavior prediction and identifying the most relevant and informative rules. It also enables the exploration of hidden association rules that may affect sales and provides backtracking capabilities to trace a given product and explore its associated products. By doing so, we can enhance the interpretability and usefulness of the association rules for decision-making purposes. The paper is organized as follows: Section 2 provides a literature review and current state of association rule post-processing. Section 3 presents the proposed approach THAPE. Sections 4–6 present the data labeling, classification, and filtering, respectively, which are the three major parts of the proposed approach. Section 7 is the discussion section, where we discuss the main findings out of the results. Lastly, Section 8 is the conclusion where we conclude the paper and provides some future work and research directions.
The main objective of post-processing in association rule learning is to enhance, trim, summarize, filter, and prioritize the generated rules, ensuring that the most significant and actionable insights are extracted [3–8]. The challenges in post-processing stem from the often-massive number of generated rules [4], many of which may be redundant, uninteresting, or irrelevant. To address these challenges, researchers have proposed various techniques and measures. References [3,4] discuss the need for a post-processing phase in association rule mining algorithms to effectively extract valuable knowledge from the generated rules. Reference [3] uses heatmaps (rule-item matrix) as a post-processing technique to visualize and analyze the strength and patterns of associations between items. The rule-item matrix is visualized as a heatmap, where the color intensity represents the strength of the association measure. Typically, darker colors indicate stronger associations, while lighter colors indicate weaker associations [3].
Reference [5] studies post-processing association rules using networks and transudative learning. This paper presents a post-processing approach that extracts the user’s knowledge during exploration. It discusses the main ideas of the approach and its potential for reducing the exploration space and directing the user to interesting knowledge. Experiments were conducted to demonstrate its feasibility and effectiveness. The proposed approach opens a wide area of research with many possible configurations and measures to explore.
The main goal of [6] is to use ontologies to facilitate the post-processing of association rules by domain experts. This paper presents a new hybrid method for processing association rules, which utilizes both domain knowledge and objective measures to extract interesting patterns and knowledge from databases. The method was applied to a medical domain dataset and demonstrated to facilitate the examination of association rules and increase domain knowledge. The use of ontologies and other representations of domain knowledge in the post-processing of association rules was found to be advantageous [6].
Additionally, another research proposes a new approach using ontologies and the Rule Schema formalism to prune and filter association rules, resulting in a significant reduction in the number of rules while maintaining their quality. Reference [7] describes knowledge-based interactive post-mining of association rules using ontologies. This paper discusses the problem of selecting interesting association rules from a large number of discovered rules. The authors propose a new approach called ARIPSO, which integrates user knowledge using ontologies and rule schemas. They also introduce a set of operators to guide the user in the post-processing step. By applying this approach to a questionnaire database, they were able to significantly reduce the number of rules. The quality of the filtered rules was validated by an expert.
A new approach using Domain Ontologies is proposed by [8] to prune and filter association rules, with an interactive framework to assist the user in analyzing the rules. Reference [8] proposes a domain knowledge model based on ontologies to improve the selection of interesting rules in the post-processing step of association rule mining. The authors also discuss the use of ontologies in data mining and present past studies related to domain and background knowledge ontologies. Furthermore, the paper introduces the concept of rule schemas and their role in representing user beliefs. Several operators for pruning and filtering discovered rules based on user expectations are proposed by the authors [8].
Reference [9] proposes a new algorithm called Context FOntGAR for mining generalized association rules under all levels of fuzzy ontologies. The algorithm addresses the problem of redundancy and includes a treatment for grouping rules. It reduces the number of rules and improves the semantics of the rules without relying on pruning measures. The experiments demonstrate the effectiveness of the algorithm and its efficient generalization treatment, resulting in a reduction in the number of rules.
The high dimensionality of massive data leads to a large number of association rules, making it difficult to interpret and react to all of them [10–12]. However, finding metarules can help organize and group related rules based on data-determined relationships. Reference [10] studies the use of metarules to organize and group discovered association rules. This paper proposes using metarules as an alternative to pruning and organizing the discovered rules. The focus is on summarizing a subset of association rules with the same consequent. The method involves grouping and pruning the rules based on their redundancy and containment. The paper introduces a graphical display to partition the rules into independent subgroups. The approach is demonstrated using manufacturing data and compared to existing clustering approaches. Reference [10] also discusses the challenges of defining an appropriate distance metric for clustering rules. The results show that the proposed method can effectively organize and summarize the discovered rules.
Reference [11] presents a novel approach for association rule post-processing using a meta-learning approach. In this approach, a subsequent association rule learning step is applied to the results of “standard” association rules. The authors obtain “rules about rules” concepts that help in better understanding the association rules generated in the first step. They define various types of such meta-rules and report some experiments on UCI data. During the evaluation of the proposed method, it is observed that the number of meta-rules is significantly lower than the number of ordinary rules.
Reference [12] presents the PAR-COM methodology, which combines clustering and objective measures to reduce the exploration space of association rules and guide users towards relevant knowledge. This approach aims to minimize user effort during the post-processing process and addresses the challenges of understanding and organizing rule collections using objective measures and clustering techniques.
On the other hand, reference [13] proposes the ARCS framework, a comprehensive framework that focuses on association rules with two quantitative qualities on the antecedent side and one categorical attribute on the subsequent side. The ARCS framework consists of four core components: Binner, association rule engine, clustering, and verification. The binner step divides quantitative characteristics into bins using the equi-width binning method, which are then transformed into integers. The BitOp algorithm conducts bitwise operations to enumerate clusters from the grid and locates them within the Bitmap grid, resulting in clustered association rules. However, this approach is limited to low-dimensional data and cannot handle high-dimensional data effectively.
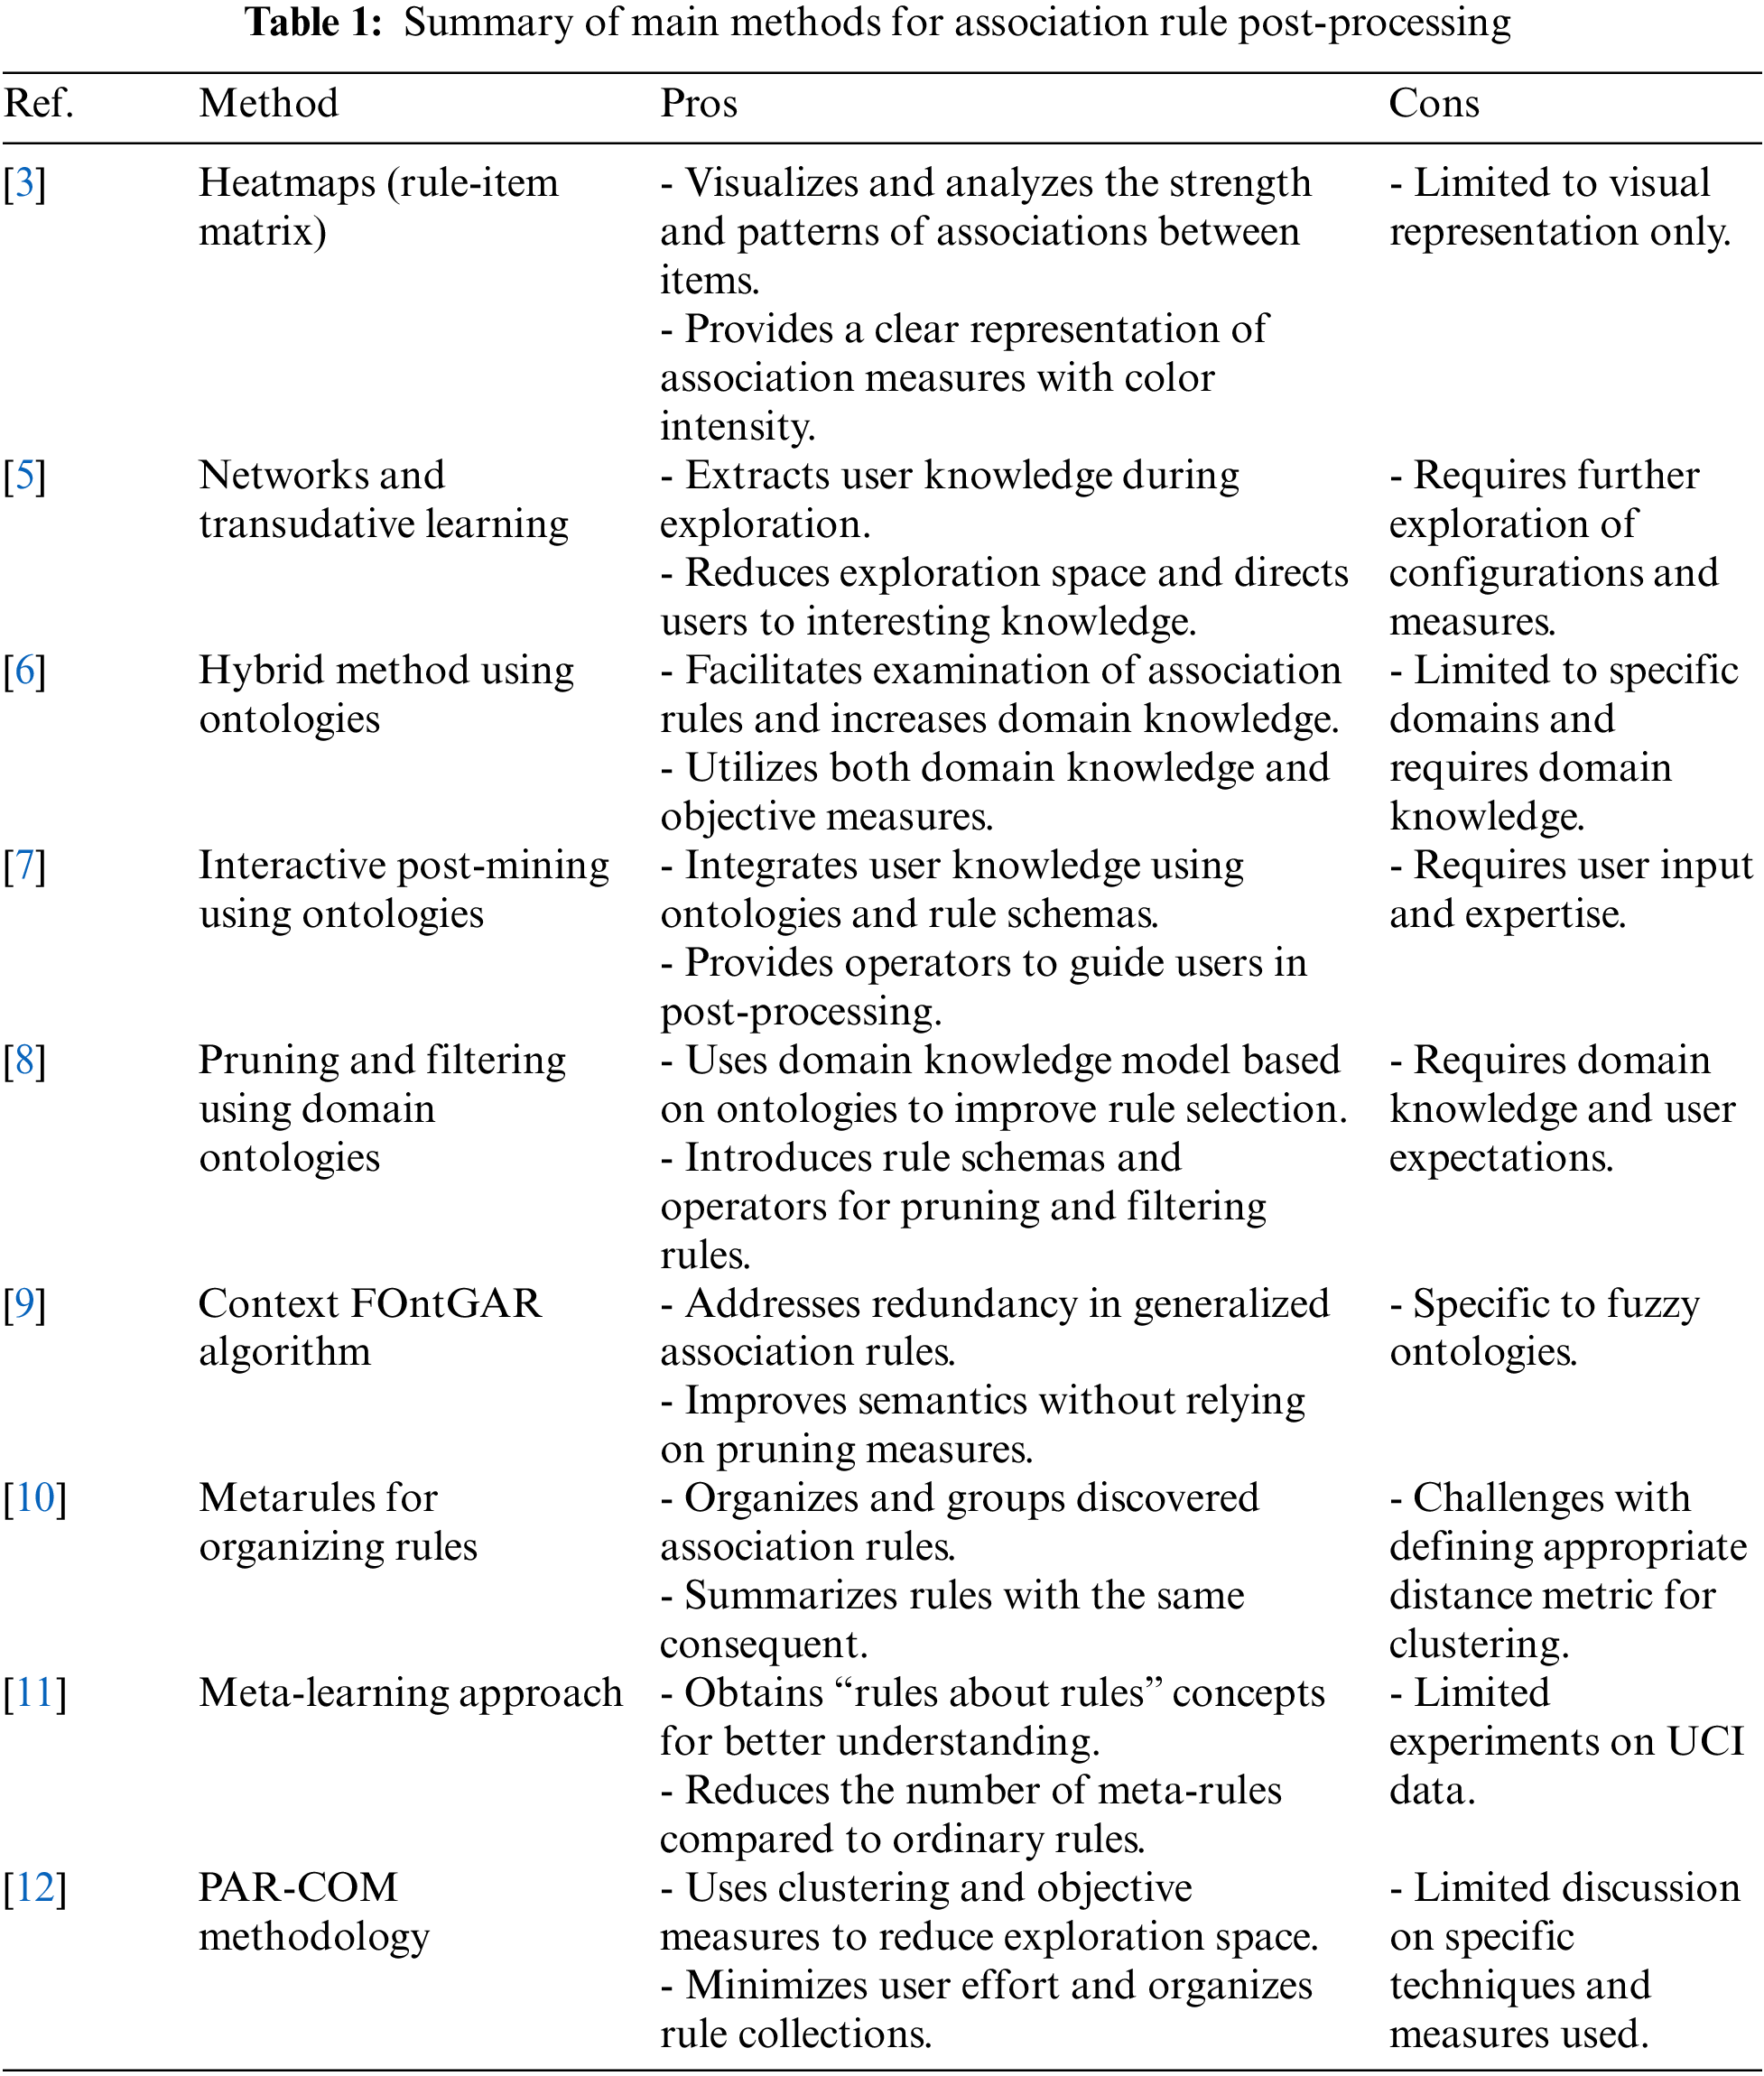
Table 1 provides a comprehensive summary of the main methods employed for association rule post-processing. It highlights the key techniques and methodologies utilized in each method, along with their respective advantages and limitations. By examining this summary table, researchers and practitioners can gain insights into the diverse range of post-processing methods available and make informed decisions regarding the most suitable approach for refining, pruning, summarizing, filtering, and ranking association rules. The table contributes to the existing body of knowledge by consolidating information from multiple references, facilitating a holistic understanding of the field of association rule post-processing.
3 THAPE: Post-Processing Approach
Post-processing of association rules can be approached using either traditional descriptive techniques or machine learning predictive techniques. References [5–9] have applied descriptive techniques, including merging, pruning, filtering, and more. Another option for post-processing is utilizing machine learning possibilities through descriptive techniques, as suggested by researchers such as [10,12,13].
In our proposed approach, we incorporate both descriptive and predictive techniques to form a new hybrid approach. As shown in Fig. 2, we aim to build a tunable post processing engine called: THAPE (Tunable Hybrid Associative Predictive Engine).

Figure 2: Post-processing approach
Our post-processing approach aimed to predict consumer buying behavior, explore hidden association rules that may affect the sales, and provide a backtracking ability where we can trace a given product and explore their associated product/s. This explains the tunable concept of this approach. For the technical facilities specifically, we use a combination of classification and filtering methods in the same pipeline after two data labeling: Price and distance, as shown in Fig. 2. This approach not only meets the business needs but also makes a new technical contribution to the field by exploring the deeper technical aspects of both techniques.
All data labeling processes will be explained in the next section. For the classification process, we built a classifier model as shown in Fig. 3.

Figure 3: The classifier model
The input features for the classification model will include the distance between items involved in the given association rule, the average prices of items involved, the rule weight, and the confidence level.
The “Set Role” step in Fig. 3 will involve indicating the class label and the type of the class label, which is a binary label indicating the interestingness of the rule. The next step involves splitting the dataset into two parts: The training data and the test data. The training data accounts for 70% of the dataset, and it is used to train the classifier algorithms. On the other hand, the remaining 30% of the dataset serves as the test data, which is utilized to evaluate the performance of the trained models.
During the training phase, three different classifier algorithms are applied: Decision tree, random forest, and Naïve Bayes. These algorithms learn from the training data and generate models that can classify new instances. The objective is to determine whether the association rule is interesting or not interesting based on the given data.
To assess the performance of each classifier algorithm, various performance measures are employed. These measures include accuracy, confusion matrix, and classification error. The output of the classification models is a binary classification indicating whether an association rule is considered interesting or not interesting based on the trained algorithms’ predictions.
The filtering and sorting process will be explained in Section 7, but the tunable concept in this context refers to the ability to adjust or customize the output of the association rules using a product backtracking process based on a given product. By providing a given product as input, the product backtracking allows us to trace back and identify any other products that are associated or linked to the given product. This backtracking capability enables us to explore the association rules and uncover the relationships between different products in a dataset. This tunable aspect enhances the flexibility and adaptability of the THARE approach allowing users to refine and narrow down the associations based on their specific interests. For a more detailed explanation and illustration of this concept, please refer to the “Smart Tv” example in Section 8.
Last but not least, there is one important point before start applying our post-processing approach is to decide and specify the support threshold value to work with. Generally, there is no single “best” support value for association rule mining, as the optimal value can vary depending on the specific dataset and analysis goals, as suggested by researchers [18–20]. On one hand, it can be argued that execution times generally increase inversely with the support values, as shown in [18], where most algorithms have higher execution times for the lowest support value of 0.1 compared to 0.5. On the other hand, it is important to note that a support value that is too high may result in important itemsets being missed, while a support value that is too low may result in too many itemsets being generated, making it difficult to identify meaningful patterns.
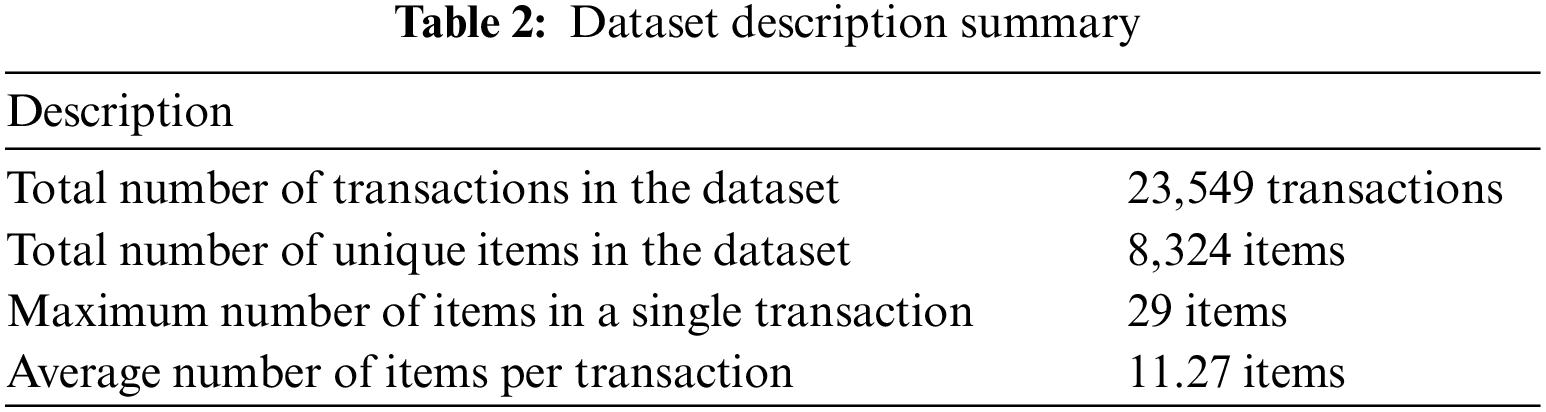
In our case, we have chosen to use a support value of 0.025 for the dataset described in Table 2. Choosing low support value allow the algorithm to generate more rules (hidden rule). We got 11,246 association rules but using our proposed post-processing approach will end up with a very interesting and useful associations rules.
We have a data hierarchy of all products provided by the supermarket owner, consisting of 19,532 unique items. This hierarchy will be used entire process; however, it does not include price information, and the distance between items is not calculated. Therefore, we need to create two new attributes and labels: The price of the items and the distance between the items involved in the rule. In this labeling process we care about the tunability concept, we create these attributes in a way that let us do some backtracking for any given product later when needed. Here are some detailed explanations about the labeling process for these two attributes.
The prices of the items are available in the sales transactions, which are recorded in bills. The sales transaction dataset includes 1,048,576 sealed items across all three consumer classes. These items have different quantities, sizes, and prices. To standardize the dataset, we have identified 12,933 unique items with a corresponding price calculated as the Net price divided by the quantity. This calculation ensures consistency in the pricing information.
For the purpose of the interesting analysis, we will focus on the D4 class name, considering the calculated price. This class name, along with the associated price, will be considered in the analysis to identify significant association rules. Fig. 4 shows a visual representation of this concept.

Figure 4: The bills data set with the new price column
As part of the price data cleaning process, we have removed all items with negative values (−) from the bills. These negative values indicate that the items have been removed or returned, and therefore, they are not relevant for the analysis. This step ensures that only valid and meaningful price data is considered. Fig. 5 shows a visual representation of this data cleaning step.
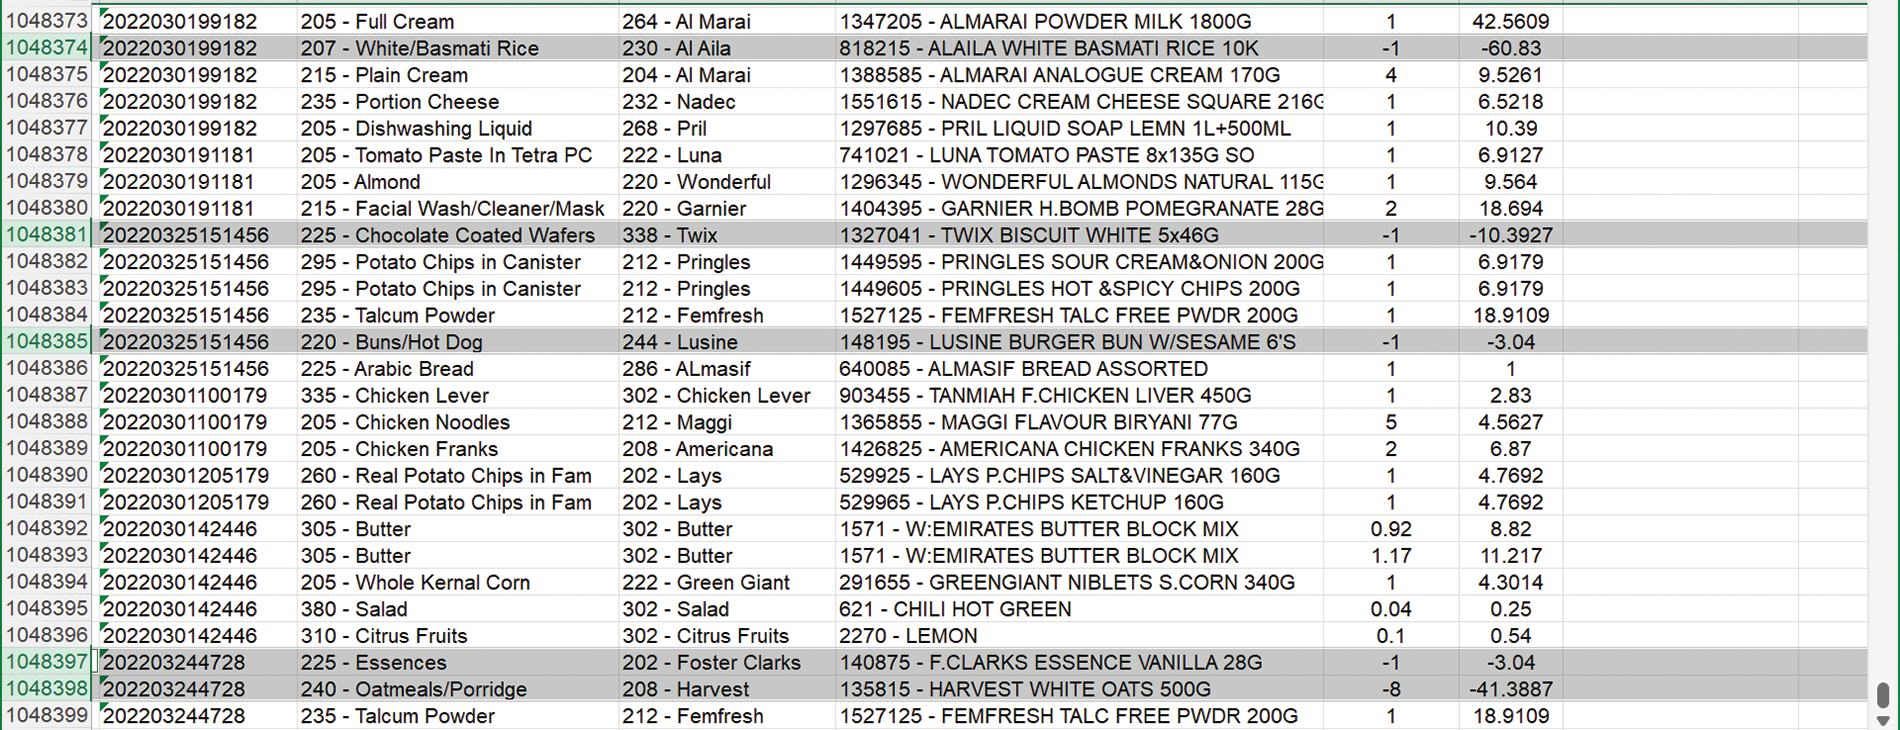
Figure 5: The bills data set in a cleaning process
In addition to the previous data cleaning steps, we have also addressed items with a quantity less than one, which typically represent weighted items, such as fruits, vegetables, cheese, olives, pickles, and so on. To ensure consistency and avoid treating them as separate products, we have standardized the prices based on the price per kilo. For example, if Transaction X includes 0.5 kilo of cucumbers priced at 2.3 SR, Transaction Y includes 0.25 kilo priced at 1.5 SR, and Transaction Z includes 0.8 kilo priced at 3.68 SR, we consider the price for all cucumber items as 4.6 SR per kilo.
This approach allows us to treat these weighted items consistently and avoids creating separate entries for each individual quantity. By unifying the prices in this manner, we enhance the stability and reliability of the data for analysis purposes. Furthermore, it is important to note that all prices have been rounded up to two decimal places to maintain consistency and precision in the dataset.
Notable finding here, that consumer who buy an expensive device such as smart TV or kitchen electronic appliances usually just buy it so we cannot find an associated items with it. Figs. 6 and 7 display the word representations image for items that have prices greater than the average price and smaller than the average price, respectively:

Figure 6: Items’ prices above the average

Figure 7: Items’ prices below the average
• Items price range (4477.50 to 86.69 SR) which is for (IPHONE 13PRO, ALAILA WHITE BASMATI RICE)
• Items price range (86.29 to 1.15 SR) which is for (MAZZA/SELLA BASMATI ABU SUNBULATEIN, HALEY PLAIN WATER)
4.2 The Distance between Items
Distance: This attribute represents the physical distance between the locations of the items involved in the rule [20,21]. In our case, the item distance will be based on the concept of cross-sections, where the distance value between items increases as the items involved in the association rule are from different sections. If the items are from the same section, the distance value will be one.
So, D represents the distance between items in the left-hand side and the right-hand side of the association rule. For the dataset, we obtained an item hierarchy dataset from the business owner, where all supermarket items are organized under sections and subsections. The main sections are:
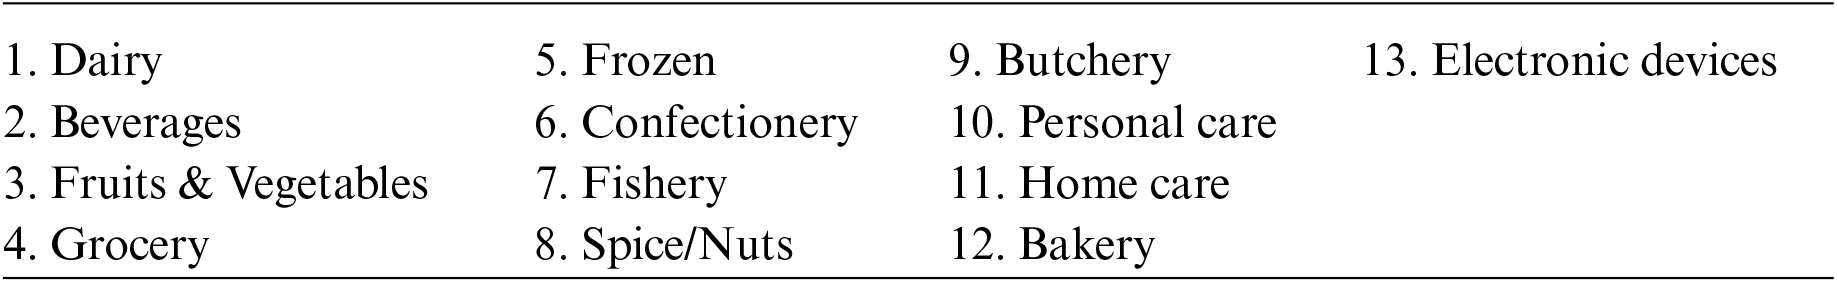
These are just the main category or the main classes. For example, Peanut Butter has 24 different brand categories, and it can be found under the D1: Food Grocery > D2: Grocery Sweet > D3: Breakfast Spread > D4: Peanut Butter Creamy > D5: 24 brand list. So, the complete data hierarchy is very divergent and complex. Therefore, we used network graph created using the NetworkX library, to find the distance between any two-items based on their category which reflect the items’ places in the actual supermarket lines and shelves. NetworkX library is a Python package designed for the creation, manipulation, and study of complex networks. Fig. 8 shows the resulting network graph with all relations and connections between products in different section. The distance between any two products calculated based on the number of sections separating them. This concept is explained in the following paragraph. Fig. 9 illustrates an example of the Dairy section and its connections with all other sections. The distance is indicated on the connected edges.

Figure 8: The network graph for all items’ categories

Figure 9: Example of the network graph using a sample of the given categories
In the analysis, the distance between items will be calculated based on their category hierarchy. If two items belong to the same category, they will have a distance of one. However, if the items are from different categories, the distance will be calculated as a path between the categories. For example, if one item is classified under “Dairy” and another item is classified under “Fishery”, the distance between them will be 7 (representing the path between the two categories). In another way, we could say that because there are 6 sections between them, So: Dairy with Dairy = 1, Dairy with Beverages = 2, Dairy with Fruits & Vegetables = 3, Dairy with Grocery = 4, Dairy with Frozen = 5, Dairy with Confectionery = 6. Then, Dairy with Fishery = 7.
Considering the distance between items is important in determining the level of interest in their relationship. Items that are closer in terms of distance may have a higher likelihood of being associated or related to each other, as they share more similar characteristics or belong to the same category. On the other hand, items with a greater distance may have more diverse properties or belong to different categories, indicating potentially interesting relationships that span across different product domains.
5 Association Rule Classification
In this step, we applied the classifier model explained in Section 4. The aim is to classify any given association rules into interesting and not interesting based on the given feature. The model has been trained on a labeled dataset that includes samples of association rules along with their corresponding classification (interesting or not interesting). Based on the item price and distance, the data records are labeled as interesting if the price is greater than the average price of the entire class, and if the distance between items involved is more than 3, as shown in formula (2).
After the classification model has been trained and deployed, it can automatically classify new association rules as interesting or not interesting based on their price, confidence, and distance attributes. This can help streamline the rule mining process and identify the most relevant and actionable rules for further analysis and decision-making.
One possible approach is to use a supervised learning algorithm such as a decision tree, random forest, or Naïve Based to build a classification model. As explained in Section 4, we applied all these three classifiers for three consumer classes, compare their performance metrics, and select the best one to classify our data. The classifier model has been evaluated using standard performance metrics such as accuracy, confusion matrix, and classification error as summarized in Table 3.
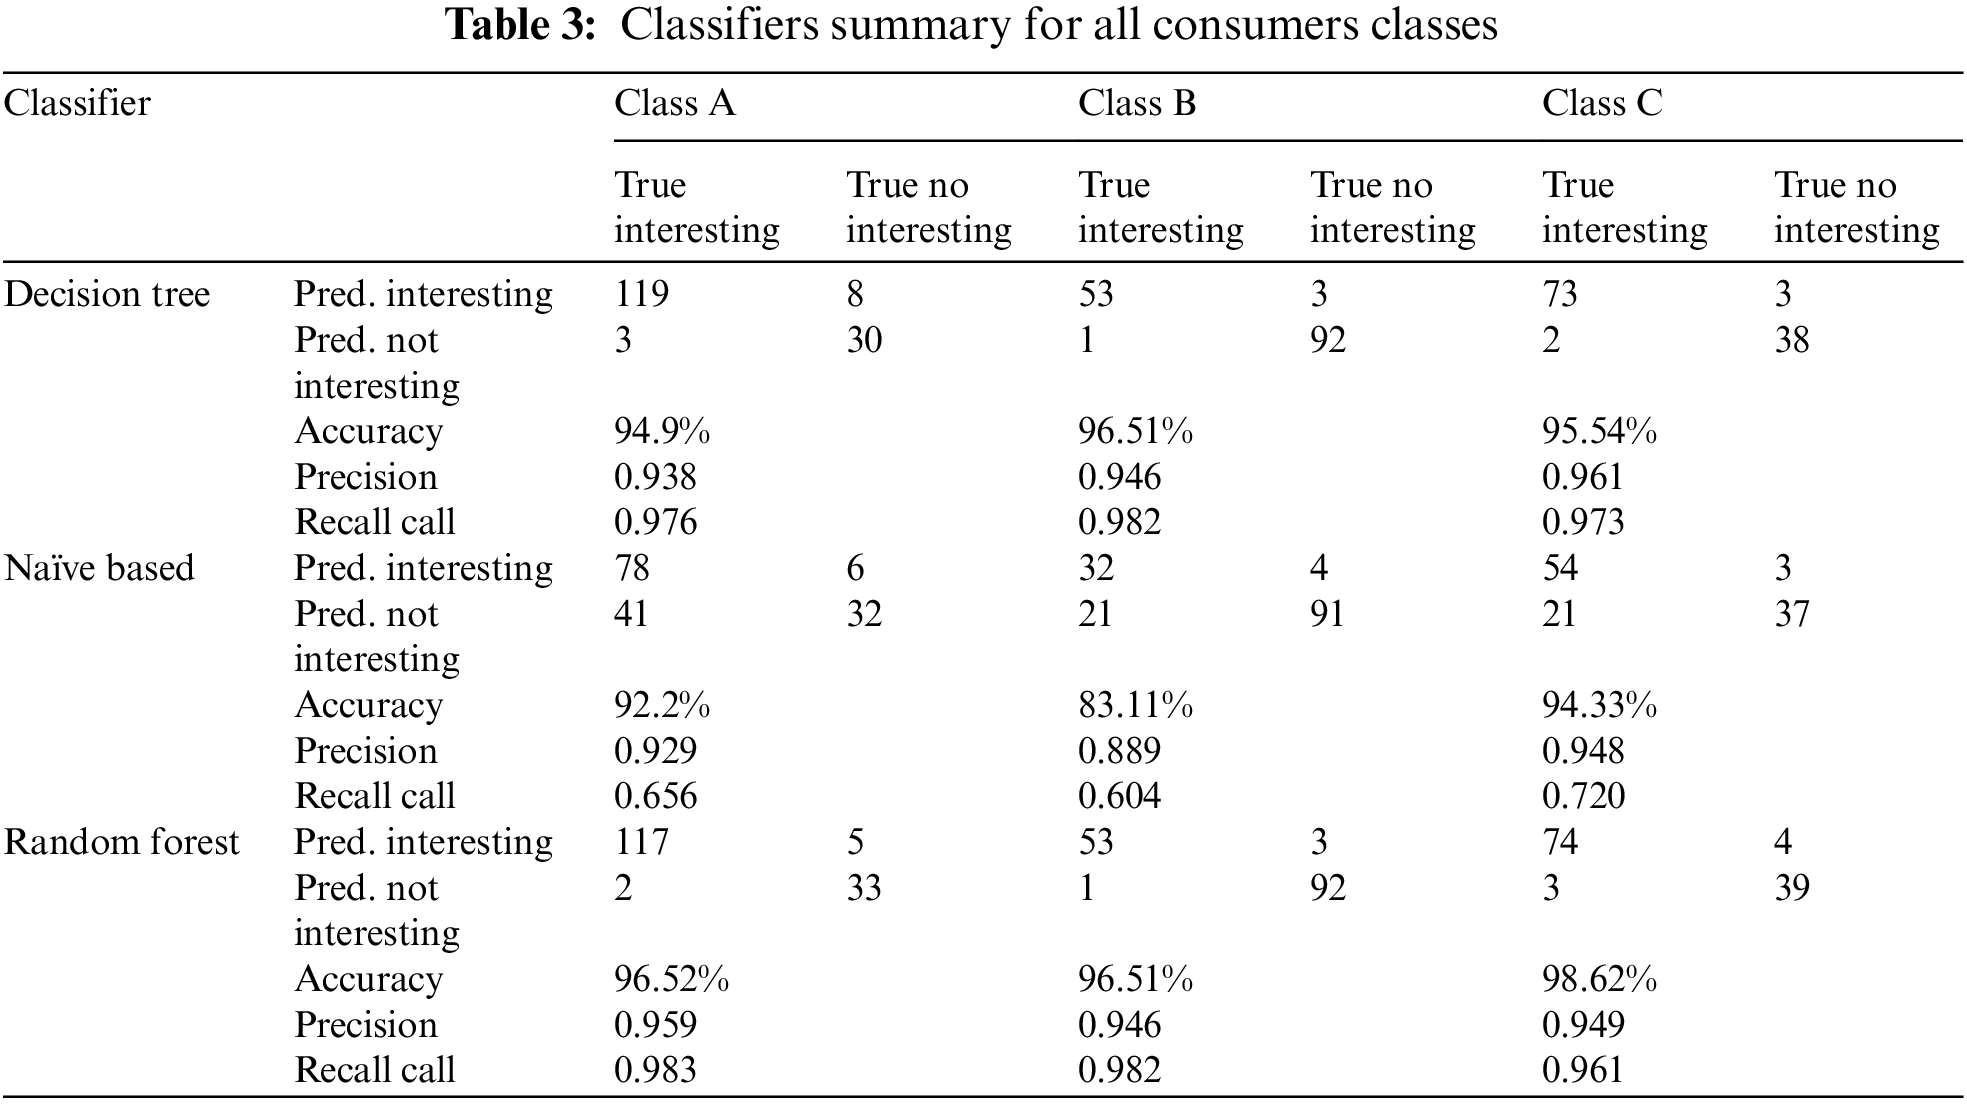
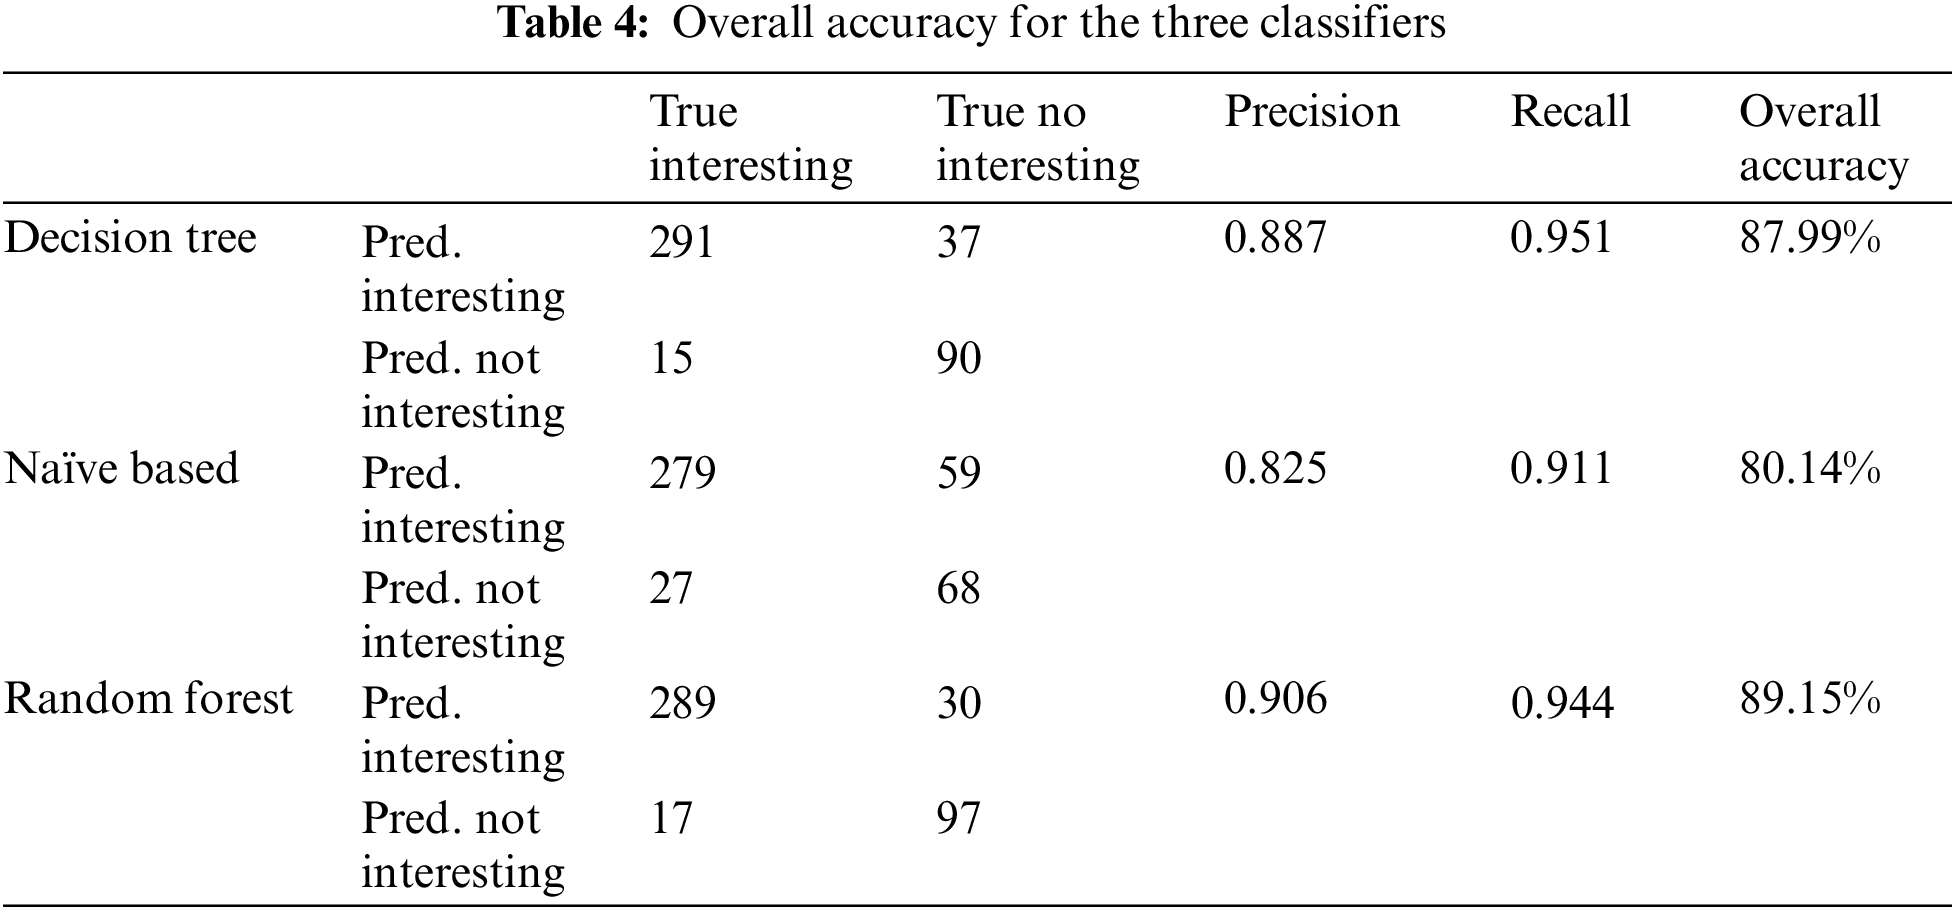
Table 4 below shows the overall accuracy percentage as well as the classification error for the classifiers. algorithms’ accuracy for each consumers’ class.
Figs. 10 and 11 below show each algorithms’ accuracy for each consumers’ class and the overall accuracy, respectively.

Figure 10: Algorithms’ accuracy for each consumers’ class

Figure 11: Algorithms’ overall accuracy
After classifying the association rules, we observed a reduction in the number of generated rules from 11,246 to 3,160. However, even with this reduction, 3,160 rules still constitute a large number. Research [2] suggests that association rules become increasingly challenging to use effectively when their quantity surpasses 100. To address this issue, we need to implement a filtering stage to identify the most relevant and valuable association rules. This filtering process will help us narrow down the rule set to a more manageable size, ensuring that the rules selected are the best candidates for further analysis and decision-making. By employing this filtering stage, we aim to enhance the usability and practicality of the association rules, enabling us to focus on the most meaningful insights for our specific objectives.
6 Association Rule Filtering and Sorting
Filtering Rules Using Lift Metrics:
Lift metrics is a well-known association rule learning metrics, has been used by many authors in the generation process but we will use it as a filtering metrics in the post-processing stage. Lift value pointing out the importance of the correlation between the two variables and according to [2], it is calculated as described in formula (3):
In our case, we already have the confidence of each association rule, but we are going to calculate P(Y) which is the probability of having the left-hand side of the given rule against all generated rules, in another word it is the coverage probability of the left-hand side of the given rule. In [22–26], similar metrics are discussed, but they are all applied during the generation of association rules. The threshold value of the lift metric in our case is set to 0.125.
Sorting Rules in Two Ways:
After applying the filtering stage, we will proceed with two types of sorting: Price-based sorting and distance-based sorting. Both sorting methods will arrange the association rules in descending order, and we will establish threshold values as follows:
1. Distance-based sorting: We already have the distance between items involve in each association rule. The distance values range from 1 to 13, and we will consider association rules with a distance-based sorting value up to 5.
2. Price-based sorting: We sort the resulting association rules based on the average price of the items involved in the left-hand side and the right-hand side of the association rule, as shown in formula (4).
Avgprice is the average price of items involved in the left-hand side and the right-hand side of the association rule.
By implementing these sorting methods, our goal is to prioritize association rules based on their distance (distance-based sorting) and the price of the items involved (price-based sorting). As a result, we have obtained 382 clear and interesting association rules across the three classes, with an average of 125 rules per class. Fig. 12 provides a summary of the data size changes throughout the post-processing stages, illustrating the progression of the dataset as we apply various techniques.

Figure 12: Data size changing through the post processing
Reducing the number of generated rules is to effectively manage and interpret the association rules generated in association rule learning. Therefore, reducing the number of generated association rules enhances interpretability, improves efficiency, reduces noise, and increases the actionability of the rules. It enables businesses and organizations to derive meaningful insights and make informed decisions based on a manageable and relevant set of association rules.
This paper introduces a novel post-processing approach called THAPE: A Tunable Hybrid Associative Predictive Engine for enhancing rule interpretability of association rule learning. By employing a hybrid methodology that combines descriptive and predictive techniques, including association rule classification, filtering based on the lift metric, and sorting.
The primary objective of THAPE approach is to accurately predict consumer buying behavior within each consumer class: Class A, Class B, and Class C. It is well-established in [2] that predicting consumer buying behavior becomes challenging when dealing with a large number of generated association rules. This can lead to inaccurate predictions [2]. To address this challenge, our approach focuses on reducing the number of generated rules while preserving the most interesting ones through the application of classification and filtering techniques.
The success of our approach is evident in the figures provided below for each class, which can be compared to Fig. 8 in Section 4.2. These figures demonstrate the effectiveness of THAPE in achieving our goals of improving rule interpretability and accurately predicting consumer buying behavior.
Fig. 13 illustrates the interaction between sections after applying THAPE’s post-processing for Class A, Class B, and Class C. Analysis of the critical paths reveals that the grocery section exhibits the highest level of interaction (→) with other sections within each class. Additionally, the electronic devices section emerges as the most related section (←) to the majority of other sections in each class. Through the post-processing with THAPE, the number of relations has been significantly reduced by 84.02% in Class A, 85.20% in Class B, and 85.21% in Class C.

Figure 13: Sections interaction after post-processing with THAPE for Classes A, B, and C
Furthermore, one of the primary objectives of the THAPE approach is to uncover hidden association rules that may have an impact on sales. The business acknowledges that products from different sections can influence sales. Hence, our aim is to assist the business in identifying the most important intersection association rules and comprehending the relationships that connect products from various sections. By exploring these associations, we can provide valuable insights into the relationships among products and assist in optimizing sales strategies.
Fig. 14 illustrates the most interesting association rules (cross-section) in each class. The x-axis represents the consequence of the rule, while the y-axis represents the antecedent of the rule in a grouped matrix graph. The support value is displayed using different colors, and the color scale is provided on the right-hand side of the figure.

Figure 14: Cross section association rules for three all classes
The last goal of the THAPE approach is to provide a backtracking ability, allowing us to trace any product that the business is concerned about and explore its associated products. It is important to note that the items are stored in the data repository in a hierarchical order. For instance, baby diapers are categorized as follows: 10-Personal Care, 325-Baby Care, 200-Baby Needs, 205-Baby Diaper, Diaper Babyjoy Mega Pack. Therefore, backtracking is not a straightforward task. However, we have designed our post-processing approach to be tunable, enabling us to backtrace any given item.
Let us discuss TV as an example of a critical and expensive product that presents some interesting observations. The sales volume of TVs for consumers in Class A over three months is 34,104 SR, for Class B it is 82,356 SR, and for Class C it is 16,730 SR. Class B stands out as the frontrunner with the highest sales. If we want to trace back and discover all the products associated with TVs, we found the following:
• SAHM Led Smart Tv → HOMMER Microwave Oven
• ARROW Led Smart TV → Impex Led Smart TV
• Impex Led Tv → Moulinex Food Preparation
• ARROW Led Smart Tv → Al-Saif Flask Deva
• Impex Led Smart TV → VICTO White Soft Cheese
• Impex Led Smart TV → Al-Marai Yoghurt Full Fat
• Impex Led Smart TV → Pantene Shampoos Regular
• ARROW Led Smart Tv → TANG Drink Powder, Orange
• SAHM Led Smart Tv → Tefal Deep Fryer
It has been proven that removing or replacing a product in the market can impact the sales of associated products [3,19]. The sales volume of the associated products: HOMMER microwave, Impex led smart tv, Molineux food preparation, al-Saif flask deva, etc., in this example is over 400,000 SR which is not a small amount and may affect the overall financial balance. Therefore, when the business wants to try new marketing strategies, Class C is the safest class to target those consumers. This is because Class C has the lowest sales volume, approximately 84.86% less than the sales in Class B and approximately 59.73% less than the sales in Class A. Class B dominates the market, followed by Class A with moderate sales, while Class C occupies a smaller but distinct segment. Thus, implementing new marketing strategies in Class C poses fewer risks for the business.
In this paper, we introduce a novel post-processing approach to enhance rule interpretability in association rule learning (ARL). ARL algorithms often generate a number of irrelevant and ambiguous rules, necessitating post-processing techniques to improve the quality and interpretability of the generated rules. This challenge is well-acknowledged in the literature, as various studies have highlighted the need for effective post-processing methods to refine the results of association rule mining algorithms. Our approach integrates a hybrid strategy that incorporates descriptive techniques and machine learning predictive methods, encompassing processes such as e association rule classification, filtering, and sorting.
• For association rule classification, we applied three classifiers: Decision tree, Naïve Bayes, and random forest.
• The random forest classifier achieved the highest overall accuracy (89.15%) across all consumer classes, indicating its effectiveness in classifying association rules.
• After classification, the number of generated rules dropped from 11,246 to 3,160, streamlining the rule mining process to identify the most relevant and actionable rules.
• The filtering technique using the lift metric, along with distance-based and price-based sorting, resulted in a reduced set of 125 clear and interesting association rules for each class.
• The number of relations between sections was reduced by 55.03%, improving the efficiency of the analysis.
• Our research contributes to association rule learning by providing a hybrid post-processing method that enhances rule interpretability and enables informed decision-making based on concise and relevant association rules.
As future work, we recommend a field experiment: Implementing field experiments in real-world settings to assess the framework’s results and recommendations in practical scenarios. Field experiments can provide valuable insights into the framework’s effectiveness in real-life situations. Moreover, future work can explore further enhancements to our approach, such as incorporating domain knowledge or exploring alternative machine learning algorithms.
Acknowledgement: None.
Funding Statement: This research received no external funding.
Author Contributions: All authors have reviewed the results and approved the final version of the manuscript.
Availability of Data and Materials: Data is unavailable due to privacy restrictions.
Conflicts of Interest: The authors declare that they have no conflicts of interest to report regarding the present study.
References
1. M. V. Babu and M. Sreedevi, “A comprehensive study on enhanced clustering technique of association rules over transactional datasets,” in 2021 Fifth Int. Conf. I-SMAC (IoT Social, Mobile, Analytics Cloud) (I-SMAC), Palladam, India, 2021, pp. 1–5. [Google Scholar]
2. C. Marinica, Association Rule Interactive Post-Processing Using Rule Schemas and Ontologies-ARIPSO. Université de Nantes: Artificial Intelligence, 2010. [Google Scholar]
3. M. Kavitha and S. Subbaiah, “Association rule mining using apriori algorithm for extracting product sales patterns in 683 groceries,” Int. J. Eng. Res. Technol., vol. 8, no. 3, pp. 1–4, 2020. [Google Scholar]
4. B. Baesens, S. Viaene, and J. Vanthienen, “Post-processing of association rules,” in Proc. Workshop Post-Processing in Machine Learning and Data Mining: Interpretation, Visualization, Integration, and Related Topics with Sixth ACM SIGKDD, 2000, pp. 20–23. [Google Scholar]
5. V. O. de Carvalho and S. O. Rezende, “Post-processing association rules using networks and transductive learning,” in 13th Int. Conf. Mach. Learn. Appl., IEEE, 2020, pp. 318–323. [Google Scholar]
6. H. Reichgelt and K. Osei-Bryson, “Using ontologies to facilitate post-processing of association rules by domain experts,” Inf. Sci., vol. 181, no. 3, pp. 419–434, 2021. [Google Scholar]
7. C. Marinica and F. Guillet, “Knowledge-based interactive postmining of association rules using ontologies,” IEEE T. Knowl. Data En., vol. 22, no. 6, pp. 784–797, 2010. doi: 10.1109/TKDE.2010.29. [Google Scholar] [CrossRef]
8. C. Marinica, F. Guillet, and H. Briand, “Post-processing of discovered association rules using ontologies,” in 2008 IEEE Int. Conf. Data Min. Workshops, IEEE, Dec. 2008, pp. 126–133. [Google Scholar]
9. R. M. J. Ayres and M. T. P. Santos, “Mining generalized association rules using fuzzy ontologies with context-based similarity,” in Proc. Int. Conf. Enterp. Inf. Syst., 2012, vol. 1, pp. 74–83. [Google Scholar]
10. A. Berrado and G. C. Runger, “Using metarules to organize and group discovered association rules,” Data Min. Knowl. Discov., vol. 14, no. 3, pp. 409–431, 2007. doi: 10.1007/s10618-006-0062-6. [Google Scholar] [CrossRef]
11. P. Berka and J. Rauch, “Meta-learning for post-processing of association rules,” in Data Warehousing Knowl. Discov.: 12th Int. Conf., DAWAK 2010, Bilbao, Spain, Springer Berlin Heidelberg, Aug. 30–Sep. 2, 2010, vol. 12, pp. 251–262. [Google Scholar]
12. V. O. de Carvalho, F. F. Dos Santos, S. O. Rezende, and R. de Padua, “AR-COM: A new methodology for post-processing association rules,” in Enterp. Inf. Syst.: 13th Int. Conf., ICEIS 2011, Beijing, China, Springer, Jun. 8–11, 2012, vol. 13, pp. 66–80. [Google Scholar]
13. B. Lent, A. Swami, and J. Widom, “Clustering association rules,” in Proc. 13th Int. Conf. Data Eng., Birmingham, UK, IEEE Computer Society, 1997, pp. 220–231. [Google Scholar]
14. A. Joyce, “Top executive management in the Arab world retail 2016,” Forbes Middle East, 2016. [Google Scholar]
15. Announcement Details, “Saudiexchange.sa,” Abdullah Al Othaim Markets Co. Accessed: Jun. 23, 2023. [Online]. Available: https://www.saudiexchange.sa/ [Google Scholar]
16. H. Al-Salamin and E. Al-Hassan, “The impact of pricing on consumer buying behavior in Saudi Arabia: Al-hassa case study,” Eur. J. Innov. Bus. Manag., vol. 8, no. 12, pp. 62–73, 2016. [Google Scholar]
17. O. S. Imbambi and M. Kinoti, “Consumer buying behaviour and adoption of green products in large supermar-705 kets in Nairobi City Kenya,” Glob. J. Econ. Bus., vol. 4, no. 2, pp. 269–279, 2018. doi: 10.12816/0047944. [Google Scholar] [CrossRef]
18. S. Khodabandehlou and M. Z. Rahman, “Comparison of supervised machine learning techniques for customer churn 633 prediction based on analysis of customer behavior’,” J. Syst. Inf. Technol., vol. 19, pp. 65–93, 2017. doi: 10.1108/JSIT-10-2016-0061. [Google Scholar] [CrossRef]
19. A. H. Mujianto, C. Mashuri, A. Andriani, and F. D. Jayanti, “Consumer customs analysis using the association rule and apriori algorithm for determining sales strategies in retail central,” in E3S Web Conf., 2019. [Google Scholar]
20. D. S. Pankaj, “Reduction of number of association rules with inter itemset distance in transaction databases,” Int. J. Database Manag. Syst., vol. 4, no. 5, pp. 61–82, 2012. doi: 10.5121/ijdms.2012.4505. [Google Scholar] [CrossRef]
21. M. Hamani, R. Maamri, Y. Kissoum, and M. Sedrati, “Unexpected rules using a conceptual distance based on fuzzy ontology,” J. King Saud Univ.-Comput. Inf. Sci., vol. 26, no. 1, pp. 99–109, 2014. [Google Scholar]
22. Alfiqra and A. U. Khasanah, “Implementation of market basket analysis based on overall variability of association rule (OCVR) on product marketing strategy,” IOP Conf. Ser. Mater. Sci. Eng., vol. 722, no. 1, pp. 1–8, 2020. [Google Scholar]
23. T. Kutuzova and M. Melnik, “Market basket analysis of heterogeneous data sources for recommendation system improvement,” Procedia Comput. Sci., vol. 136, no. 6, pp. 246–254, 2018. doi: 10.1016/j.procs.2018.08.263. [Google Scholar] [CrossRef]
24. A. Telikani, A. H. Gandomi, and A. Shahb, “A survey of evolutionary computation for AR mining,” Inf. Sci., vol. 524, no. 2, pp. 318–352, 2020. doi: 10.1016/j.ins.2020.02.073. [Google Scholar] [CrossRef]
25. Y. A. Ünvan, “Market basket analysis with association rules,” Commun Stat.–Theory Methods, vol. 7, pp. 1615–1628, 2021. doi: 10.1080/03610926.2020.1716255. [Google Scholar] [CrossRef]
26. A. Telikani, A. H. Gandomi, and A. Shahbahrami, “A survey of evolutionary computation for association rule mining,” Inf. Sci., vol. 524, pp. 318–352, 2020. [Google Scholar]
Cite This Article
 Copyright © 2024 The Author(s). Published by Tech Science Press.
This work is licensed under a Creative Commons Attribution 4.0 International License , which permits unrestricted use, distribution, and reproduction in any medium, provided the original work is properly cited.
 Downloads
 Citation Tools