
 Submit a Paper
 Propose a Special lssue
 Open Access
ARTICLE

Scientific Elegance in NIDS: Unveiling Cardinality Reduction, Box-Cox Transformation, and ADASYN for Enhanced Intrusion Detection
Department of Information Systems College of Computer and Information Sciences, King Saud University, Riyadh, 11451, Saudi Arabia
* Corresponding Author: Amerah Alabrah. Email:
Computers, Materials & Continua 2024, 79(3), 3897-3912. https://doi.org/10.32604/cmc.2024.048528
Received 11 December 2023; Accepted 14 February 2024; Issue published 20 June 2024
 View Full Text
 Download PDF
Abstract
The emergence of digital networks and the wide adoption of information on internet platforms have given rise to threats against users’ private information. Many intruders actively seek such private data either for sale or other inappropriate purposes. Similarly, national and international organizations have country-level and company-level private information that could be accessed by different network attacks. Therefore, the need for a Network Intruder Detection System (NIDS) becomes essential for protecting these networks and organizations. In the evolution of NIDS, Artificial Intelligence (AI) assisted tools and methods have been widely adopted to provide effective solutions. However, the development of NIDS still faces challenges at the dataset and machine learning levels, such as large deviations in numeric features, the presence of numerous irrelevant categorical features resulting in reduced cardinality, and class imbalance in multiclass-level data. To address these challenges and offer a unified solution to NIDS development, this study proposes a novel framework that preprocesses datasets and applies a box-cox transformation to linearly transform the numeric features and bring them into closer alignment. Cardinality reduction was applied to categorical features through the binning method. Subsequently, the class imbalance dataset was addressed using the adaptive synthetic sampling data generation method. Finally, the preprocessed, refined, and oversampled feature set was divided into training and test sets with an 80–20 ratio, and two experiments were conducted. In Experiment 1, the binary classification was executed using four machine learning classifiers, with the extra trees classifier achieving the highest accuracy of 97.23% and an AUC of 0.9961. In Experiment 2, multiclass classification was performed, and the extra trees classifier emerged as the most effective, achieving an accuracy of 81.27% and an AUC of 0.97. The results were evaluated based on training, testing, and total time, and a comparative analysis with state-of-the-art studies proved the robustness and significance of the applied methods in developing a timely and precision-efficient solution to NIDS.Keywords
In the constantly growing technological landscape of digital networks and their widespread application, the rise in information accessibility has led to a corresponding surge in global web users, exposing networks to possible threats such as network intrusion [1]. These attacks can generate a variety of abnormalities in the system, which could potentially damage the network. Generally, anomalies are discrepancies in system behavior that possibly indicate antagonistic activity [2]. To address this challenge, the development of an effective intrusion detection system (IDS) that detects irregularities in the system is required.
IDSs are designed to track web traffic and identify any unusual activities. They are critical in safeguarding web servers from cyber-attacks, spyware, service threats, and port scanning [3,4]. Intrusion prevention systems (IPS) represent a subset of IDS that actively stops or blocks identified intrusions. They can generate alerts, recognize fraudulent activities, restore interfaces, restrict traffic from irrelevant IP addresses, and filter out undesirable transportation and network-related options [5]. IDSs can be categorized based on the detection location (network or host) or the detection mechanism used (signature or anomaly-based). Network-based intrusion detection and prevention systems (NIDPS) analyze information across all network devices. They analyze all incoming traffic for potential threats by comparing it against a database of known attacks. When an attack or anomalous behavior is detected, an alert is sent to the administrator. Furthermore, host-based intrusion detection and prevention systems (HIDPS) are deployed on personal computers and analyze the computing system on which they are implemented. They examine overall traffic, log illicit behavior, and notify the appropriate authorities [6]. IDPS can use either signature-based or anomaly-based intrusion detection. Signature-based NIDPS scans internet traffic for irregularities in data streams, relying on known attack vectors identified within the dataset. Anomaly-based NIDPS is a recent technology that focuses on identifying unknown threats, primarily as a result of the rise in malware. The aforementioned detection approach uses machine learning (ML) to develop a predefined algorithm for reliable activity, which is then utilized to compare current behavior [7].
NIDPSs utilize innovative techniques provided by artificial intelligence (AI), notably ML and deep learning (DL). These methodologies enable NIDPSs to establish an adaptable and robust approach for detecting and categorizing network attacks, which improves overall detection rates [8]. The ML algorithms take preprocessed raw data as input and eliminate noise and unnecessary data while standardizing the data. The preprocessed data is subsequently transformed into a set of attributes used for training the ML/DL learning algorithm [9]. The algorithm employed to acquire the trends that indicate intrusions was developed on an enormous dataset containing regular and unusual internet traffic. Once trained, the model can identify network attacks in real-time. The model evaluates incoming network data, correlates it with previously learned features of network attacks, and generates an alert if the incoming data follows the trend of a known network intrusion pattern.
However, NIDPSs face challenges that impact their overall performance, including feature selection, class imbalances, and the presence of outliers [10]. Feature selection, a key step in the development of NIDPS, involves identifying the most appropriate features that can aid in intrusion detection. However, this task is complex because it requires a deep understanding of the information and the problem area. Selecting excessive features may lead to overfitting, while inadequate features may result in underfitting [11]. Additionally, the class imbalance is a common problem in NIDPS, where the occurrences in one class outnumber those in the other, potentially leading to biased models with reduced accuracy in identifying the minority class. The challenges of class imbalance can be handled using a variety of data and algorithm-based strategies [12].
One such strategy involves using the Synthetic Minority Over-sampling Technique (SMOTE) to regulate the instance counts for generating a new dataset with an improved NIDPS. However, to create a more accurate, dependable, and secure NIDPS, an advanced automatic feature selection technique is required [13,14]. To address this challenge, this study uses the UNSW-NB15 dataset, which has a substantial class imbalance problem. Notably, the dataset shows a huge disparity in the total number of cases between network intrusion data and the normal group. Furthermore, the presence of outliers in the data poses a significant challenge to the reliability of IDPS [15]. Outliers, characterized as points of information that differ considerably from the average, can introduce noise and skewness, which causes bias in the learning process and potentially reduces the efficiency of NIDPS [16]. Moreover, some ML algorithms are susceptible to outliers, leading to incorrect results. To address this challenge, several solutions have been proposed, such as deleting outliers, substituting them with the mean or median values, or utilizing robust methods that are less susceptible to outliers [17]. These challenges impact the overall efficacy of NIDPS by reducing reliability, increasing the error rate, and lowering the detection rate. Therefore, addressing these issues is important for developing an effective NIDPS that can reliably and effectively identify intrusions.
In this study, the following contributions have been incorporated to enhance the Network Intruder Detection System (NIDS) development:
• Adoption of appropriate preprocessing technique to eliminate the feature skewness and remove feature cardinality
• Application of synthetic resampling on appropriately normalized feature sets
• Introduction of a precise and timely efficient approach for binary and multiclass classification in NIDS development
The rest of this article is structured into four sections. Section 2 discusses related work. Section 3 outlines the materials and methods applied to develop the framework. Section 4 presents results and discussions from experiments on binary and multiclass classification, and a comparison is provided to prove the robustness of the applied methods. Section 5 concludes the article, stating the strengths and limitations of the applied framework, as well as potential avenues for future work.
The application of AI methods, including ML, DL, and evolutionary computing, has provided optimal solutions to real-world problems. Several advanced studies have focused on enhancing the security of the Internet of Things (IoT) through ML and DL techniques [18]. Additionally, evolutionary computing methods have been extensively applied to address real-life and mathematical problems [19,20]. However, only a limited number of these studies have specifically investigated how different feature selection methods can improve prediction and classification accuracy. Previously, some research has also tried to identify data with outlier distributions to enhance the success rate of classification [21]. However, diverse approaches have given rise to a wide range of perspectives on this research subject.
Kumar et al. [22] developed a calcification-based NIDS. They employed the decision tree (DT) method in conjunction with clusters created by the k-means approach and a filter feature selection approach. The study focused on a dataset consisting of 22 UNSW-NB15 attributes and four categories of network attacks. Furthermore, the RTNITP18 dataset was employed as an experimental dataset to evaluate the efficiency of the model. The suggested approach exhibited an accuracy of 84.83%, while the C5-based DT model achieved an accuracy of 90.74%.
Authors in [23] introduced a feature selection filter utilizing the XGBoost algorithm. In this approach, 19 features were selected from an initial dataset of 42, and five ML methods, such as Logistic Regression (LR), k-nearest neighbors (KNN), Artificial Neural Networks (ANN), DT, and Support Vector Machines (SVM) were applied for binary and multiclass classification using the UNSW-NB15 dataset. The findings revealed that the ANN approach achieved the highest multiclass test accuracy at 77.51%, while the DT showed the best results in binary classification with an overall accuracy of 90.85%.
Another study [24] proposed the Unified Intrusion Detection System (UIDS), which was designed to identify both normal network traffic and four specific categories of network attacks using the UNSW-NB15 dataset. The UIDS model was developed using an array of rules (R) generated from different DT models, such as k-means clustering and filter feature selection approach. The system was also trained with C5, ANN, and SVM algorithms. The resultant model outperformed all other methods in terms of accuracy, achieving 88.92%, while other algorithms attained accuracies of 89.76%, 86.7%, and 78.77% for C5, ANN, and SVM, respectively.
Ambusaidi et al. [25] developed a unique NIDPS to enhance the efficacy of classification algorithms by choosing the most effective features. They validated their model utilizing three datasets: NSL-KDD, KDD Cup 99, and Kyoto 2006. The model achieved an accuracy of 99.79% for the KDD99 dataset. However, the datasets employed were outdated, dating back to 2009 for NSL-KDD, 1999 for KDD Cup 99, and 2006 for the Kyoto dataset. These datasets failed to encompass all IoT cyberattacks, which limited the generalizability of the proposed approach.
Sasank et al. [26] employed strategies such as under-sampling, oversampling, SMOTE, and random oversampling. Their study revealed that SMOTE was the most effective approach for producing data manipulations that adequately balanced the dataset. The study retrieved a dataset from the Kaggle repository, which contains 492 cases of fraudulent transactions and 24,315 cases of legitimate transactions. Five distinct ML classifiers were used for classification, with LR yielding the highest accuracy, AUC, and recall scores. The SMOTE method was effective in solving the class imbalance issue by oversampling cases for the minority class.
Another study [27] applied CNN and Auto-Encoder algorithms to distinguish between illegal and legal activity. They used a new dataset that focused on fraudulent actions along with the Kaggle database to detect fraudulent activity. To address the class imbalance challenge, the datasets were preprocessed with random under-sampling and oversampling using the SMOTE method. The balanced datasets with both classes were used for training and evaluating the CNN and Auto-Encoder networks. Despite achieving 93% accuracy on the Kaggle dataset, the efficiency of the classifiers was reduced when evaluated on another private dataset. This revealed a limitation in the study’s robustness because of the potential variability across datasets. Furthermore, the study lacked features such as feature selection or outlier reduction in its approach.
A different and novel approach [28] used a unique text-to-image translation approach on the Kaggle dataset. Deep features were retrieved from the generated image dataset and integrated into a CNN classifier. The classification on the Kaggle dataset used both CNN and traditional ML classifiers. To address the class imbalance, class weights were assigned when presenting input data to DL and ML algorithms. The KNN-Coarse classifier achieved maximum accuracy of 99.87%. Notably, the study did not incorporate outlier extraction or feature selection, and the issue of class imbalance was not addressed before deploying classification algorithms. References [29,30] proposed a deep auto-encoder method for identifying enormous data attacks. The study was conducted using the NSL-KDD dataset, and the effectiveness of the approach was investigated utilizing cutoff characteristics in decreasing dimensionality within the context of intrusion detection. The generated findings proved more reliable than principal component analysis (PCA), factor analysis, and Kernel/PCA, with an accuracy rate of 95.25% for training data and 95.06% for testing data.
Authors in [31] employed the particle swarm optimization (PSO) approach for selecting features. The selected features, when incorporated into a deep neural network approach, achieved exceptional accuracy results of 99.60% on the NSL-KDD dataset. In contrast, the study presented in [32] introduced a complex structure for IDS based on DL. The framework identified 26 features using Cohen’s Kappa coefficient and Mathew correlation approaches, achieving a greater accuracy of 98.27%. Authors in [33] estimated the effectiveness of using a Markov blanket system and DT modeling for feature selection. This method demonstrated the capability to reduce the total number of features in the KDD Cup 99 dataset from 41 to 12. Additionally, reference [34] proposed an IDS based on the Flexible Neural Tree (FNT). The model incorporates the initial steps related to feature selection to improve detection accuracy. When evaluated on the KDD Cup 99 dataset, the FNT model achieved an outstanding detection accuracy of 99.19% with only four features.
Reference [35] used the SMOTE approach to oversample instances of the minority class, thereby increasing their visibility compared to the normal class. This method was applied to three datasets: NSL-KDD, KDD99, and UNSW-NB15. The Gini technique was utilized to select 24 characteristics from the KDD99 dataset, 20 from the NSL-KDD dataset, and 30 from the UNSW-NB15 dataset. The estimated weighted F1-scores for the three datasets showed that, for the UNSW-NB15 dataset, random forest (RF) achieved the highest weighted F1-scores, increasing to 78% after the implementation of SMOTE relative to the initial UNSW-NB15 F1-score of 77% for multiclass. The highest binary F1-score achieved by SMOTE-enhanced UNSW-NB15 with RF was 88.5%. For KDD99, the binary class F1-score was 94%, with the highest multiclass F1-score of 90 achieved using a DT. The NSL, when combined with SMOTE, produced a multiclass F1-score of 72 with RF and an overall binary class F1-score of 83 with k-means.
Another study proposed the use of an antigen and antibody solution to capture the attacked real-time network packets. This process included real-time packet capturing, record normalization, transformation into antibody sets, anomaly detection, and generation of new antibodies for similar future anomaly detection. The UNSW-NB15 and KDD99 datasets were used to validate the applied methods, including a feature selection approach to remove redundant and irrelevant features [36]. Another study focused on mutual information sharing [37], wherein real-time captured packet information and a training set based on normalized mutually shared information were chosen to propose an anomaly detection model. To address privacy issues for data data-sharing entities, Federated Learning (FL) was applied in a distributed manner, where only updates among different clients were shared. The NSL-KDD dataset was used to implement the FL approach for intrusion detection, providing a privacy solution to the information security domain [38].
All the above-cited studies have highlighted the challenges inherent in the development of NIDS. The majority of these studies have chosen the UNSW-NB15 dataset to perform experimentation, and this study follows suit by utilizing the same dataset. Analysis from previous studies revealed the application of various techniques, such as feature engineering and feature fusion, in NIDS development. However, certain challenges, such as class imbalance, the removal of outliers, and feature selection in an appropriate and timely manner, have not been comprehensively addressed. Therefore, there is a need to propose a single framework that effectively addresses all the aforementioned challenges.
The proposed framework employed multiple methods to address the inherent challenges in the development of NIDS, thereby offering a unified solution for intruder detection. First, preprocessing of the UNSW-NB15 dataset was performed to remove the ID column and instances with empty values. Subsequently, the features were classified into numeric and categorical columns to enable the application of feature engineering solutions for each type. To improve the distributional properties and to stabilize the variance of numeric features, a box-cox transformation was applied. Additionally, cardinality removal was implemented on categorical features to reduce the number of classes, such as ‘-’ with a single category, which enhances the results of the classifier. The Adaptive Synthetic Sampling (ADASYN) method was then used to address the class imbalance, which improved the classification performance of underrepresented classes. Finally, binary and multiclass classification were performed on refined feature sets. All steps are shown in Fig. 1.

Figure 1: Flowchart of the proposed framework with various employed methods for an efficient NIDS development
Detailed information about the proposed framework, the original and oversampled datasets, and a comprehensive description of the methods employed are presented in subsequent sections. Additionally, the comparison shows that binary and multiclass classification was improved by applying effective methods compared to previous state-of-the-art (SOTA) methods.
Mandatory preprocessing of the dataset was conducted before any subsequent operations to identify features or instances that may pose challenges. The ID column was removed as it lacked relevant information for the classification process. Furthermore, instances with missing values or non-alphanumeric characters were removed. The dataset was then classified into numeric and categorical features and separated for further processing.
3.2 Box-Cox Transformation Method for Normalized Distribution
To normalize the numeric features given in the dataset to a normal distribution and mitigate large differences between values, the box-cox transformation was employed instead of traditional min-max or z-score normalization. This method features a fine-tuned parameter (
In Eq. (1),
High cardinality in the feature set can lead to an increased number of dimensions in the dataset due to the presence of many unique categorical values. However, in machine learning modeling, the high cardinality may result in overfitting of the model, slow training time, and increased complexity. Experimentation revealed that the three categorical features in the dataset consistently had approximately five top labels. Therefore, the top 5 unique and most frequent labels were found, and the remaining labels were replaced with a ‘none’ class. This process converted each categorical column into a total of six categories. The mathematical representation can be expressed as follows:
where
3.4 Class Imbalance Removal via ADASYN Method
Synthetic data generation is an effective method of increasing instances for model training and testing. The functionality of the ADASYN method is shown in Eqs. (3)–(5). First, a set of k-nearest neighbors for majority and minority classes was established, resulting in the creation of an imbalance ratio. The determination of the number of synthetic samples to be generated is based on this imbalance ratio.
In Eq. (3), the ratio is calculated over a class of
In Eq. (4),
Eq. (5) represents the newly generated samples. The
In this way, the synthetic data is generated using original instances and their k-nearest neighbors from minority class samples. The newly generated data remains highly relevant to the original data. However, the class-wise frequency for binary and multiclass labels is shown in Fig. 2. The class sample frequencies for class 1 of attacked category instances indicate the presence of 119341 instances, whereas for the normal class, there are 56000 instances. Notably, a class imbalance is evident in both of these classes. However, for binary class instances, this imbalance is less problematic to use with machine learning models, whereas multiclass categories present significant challenges.

Figure 2: Flowchart of the applied framework using various applied methods for an efficient NIDS development
As shown in Fig. 2, the class instances are Normal 56000, Generic 40000, Exploits 33393, Fuzzers 18184, DoS 12264, Reconnaissance 10491, Analysis 2000, Backdoor 1746, Shellcode 1133, and Worms 130. The class-wise instances reveal that multiclass-level instances pose more challenges due to class imbalance.
3.5 Binary and Multiclass Classification
Given the presence of two types of responses in the chosen dataset, binary and multiclass classification were conducted. Four different classifiers (random forest, XGBoost, extra trees, and decision trees) were employed to assess the validity of applied methods for both binary and multiclass classification. The dataset was split into 80–20 ratios for training and testing the models. The chosen classifiers were based on their performances and existing literature. These classifiers and the results they achieved in classification were compared with previous studies, and they demonstrated improved performance. Furthermore, the training and testing times of classifiers were estimated for both binary and multiclass classification. The time analysis showed that the applied method is a lightweight solution that not only provides efficient results but also a unified solution for many challenges faced by NIDS.
The applied framework was employed for binary and multiclass classifications, with both types yielding satisfactory results. The binary class results exhibited higher precision compared to multiclass classification results. As mentioned earlier in the previous section, the dataset was split into an 80-20 (training-testing) ratio. The experimental setup used for conducting the experiments employed a core i7 Intel processor with 16 GB RAM, Python language, and the methods or APIs mentioned in Section 3.
In Experiment 1, the oversampled and preprocessed data, as described in Section 3, was used for binary classification. 80% of the data was used for training, and 20% was used for testing. Four different classification methods were employed, and the results from the testing data are presented in Table 1.
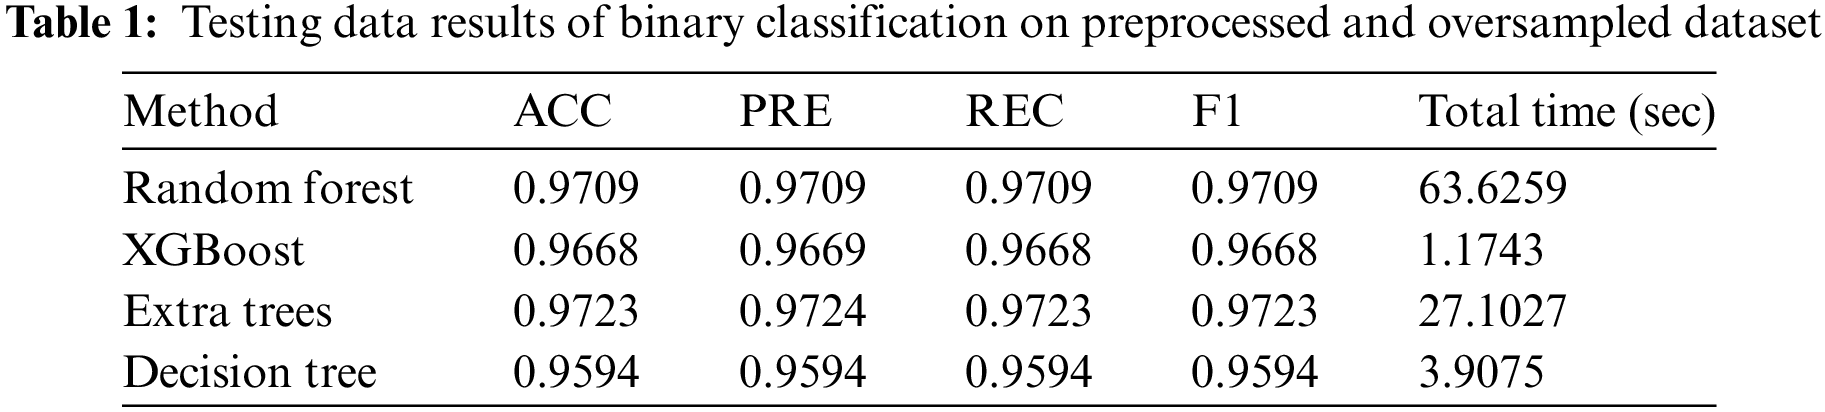
In Table 1, the performance of the applied classifiers on the oversampled dataset shows that all applied classification models remained efficient. The extra trees model achieved the highest performance at 97.23% accuracy, with other metrics closely aligned, presenting 97.24% precision, 97.24% recall, and F1-scores. Other models also showed excellent results, and notably, they maintained consistency across all metrics with similar scores.
However, considering the total time required for training and testing the models, the random forest consumed approximately 64 s, whereas the best-performing extra trees model took 27 s, which was less than half of the random forest. To evaluate the model’s effectiveness in addressing the class imbalance challenge, F1 and receiver operating characteristic (ROC) curves were proved to be valuable metrics. Given the proper processing of the dataset to address numeric and categorical features challenges and then creating the oversampled data to handle class imbalance, the achieved results were notably significant. The AUC scores and ROC curves for all applied methods are shown in Fig. 3.

Figure 3: ROC curves against false positive and true positive rates on 4 ML classifiers applied in Experiment 1
In Fig. 3, the AUC scores for all models are quite similar, all exceeding 0.99, except for the decision tree, which achieved an AUC score of 0.9605. Therefore, the class imbalance challenge is effectively resolved, thereby enhancing the confidence and reliability of the classification results.
In Experiment 2, the result of the multiclass classification showed a notable increase in training time, which subsequently increased the total time. However, the multiclass classification results were excellent, exhibiting consistency in accuracy, precision, recall, and F1-scores. The testing results of multiclass classification using four classifiers are presented in Table 2.
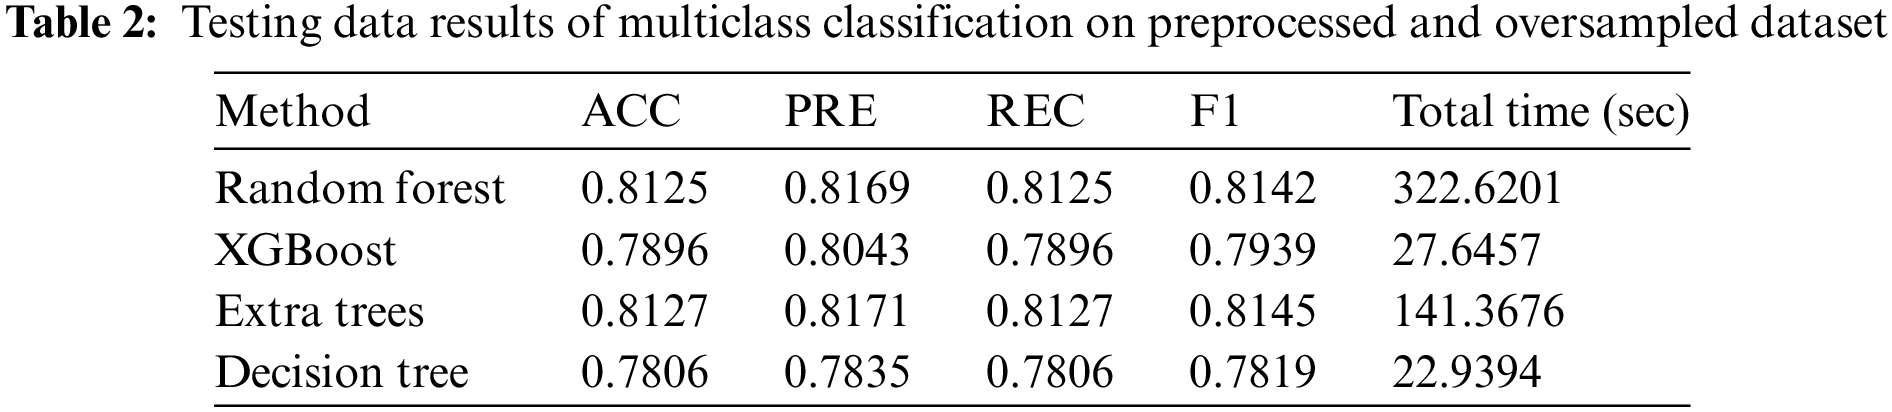
In Table 2, the highest classification results were achieved by the extra trees model, which consumed 142 s. The results closely aligned with those of the first classifier, random forest. However, due to the longer time taken by random forests, the extra trees were considered more suitable for achieving the best results among all four classifiers. The other two classifiers exhibited slightly lower results, with the XGBoost method achieving 78.96% accuracy and the decision tree yielding 78.06% accuracy. However, the F1-scores across all classifiers remained very similar, which indicated consistent performance. Further validation of the class imbalance solution was conducted using AUC curves based on micro and macro averages for multiclass classification with ROC curves, which are shown in Fig. 4.

Figure 4: ROC curves against false positive and true positive rates on 4 ML classifiers applied in Experiment 2: (a) random forest; (b) XGBoost; (c) extra trees; (d) decision tree
Fig. 4a shows that the random forest model achieved an AUC score of 0.98 and 0.97 on the micro and macro averages, respectively. In Fig. 4b, the XGBoost also achieved similar results to the random forest classifier. Fig. 4c shows that the extra trees achieved a 0.97 AUC score on both micro and macro averages. In Fig. 4d, the random forest model achieved lower AUC scores compared to the other three classifiers. The obtained scores demonstrate the promising results achieved by the applied approach and effectively address the various challenges faced by NIDS. The macro and micro averaging based on AUC scores for the 4 ML classifiers are presented in Table 3.
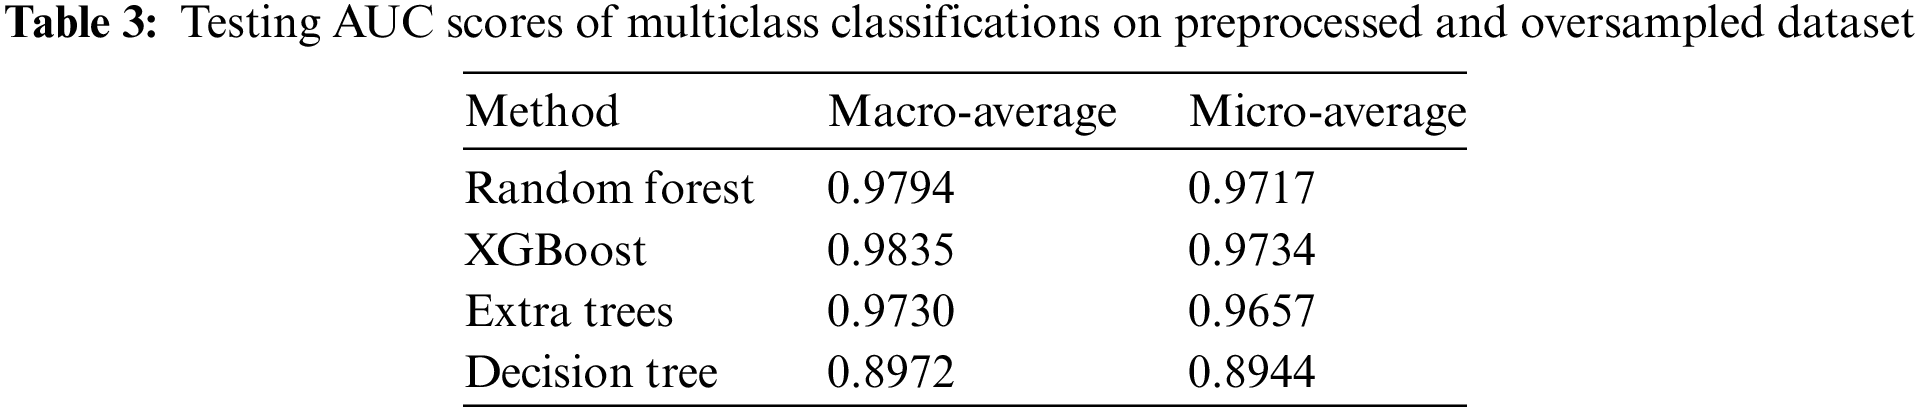
In Table 3, the AUC scores are calculated using the micro and macro averaging metrics. The macro method gives a score by assigning equal weightage to all classes present in the dataset, whereas the micro average considers equal weightage to all instances and gives an overall performance measure. The testing score across all classifiers was excellent, whether assessing class-wise AUC score or instance-wise AUC score.
4.3 Comparison with SOTA Studies
The results achieved for binary and multiclass classification demonstrated efficiency with reduced training and testing time. However, to prove the robustness of applied methods and achieved scores, a comparison with SOTA studies is essential, as detailed in this section. The comparison analysis is presented in Table 4. In the first comparison, a feature selection filter approach was employed using the XGBoost algorithm. In this approach, 19 features were selected from an initial dataset of 42, and five ML methods, such as LR, KNN, ANN, DT, and SVM, were employed for binary and multiclass classification. The highest accuracy results for multiclass was achieved by ANN at 77.51%, while for binary classification, the DT method achieved 90.85% accuracy.

In the second comparison, a UIDS was designed to identify both normal network traffic and four specific categories of network attacks using the UNSW-NB15 dataset. The attained accuracies were 89.76%, 86.7%, and 78.77% for C5, ANN, and SVM, respectively. In the third comparison, a two-phase feature selection approach was employed along with an MLP classifier. In the fourth comparison, the XGBoost method of feature selection was employed, and multiple ANN classifiers were adopted for binary and multiclass classification. The best scores attained were 78.40% accuracy for multiclass and 87.07% accuracy for binary classification. However, the proposed method used appropriate feature selection techniques to address challenges that are mostly ignored in NIDS development and made a precise, timely, and efficient framework for NIDS. By applying efficient methods to effectively address the inherent challenges in NIDS development, the performance has been improved. Therefore, the applied framework provides a robust, timely, and efficient method for NIDS development.
The extensive use of networks in national, international, and local organizations has increased concerns about network security. Networks are becoming more vulnerable to potential intrusion attacks, necessitating the installation of intelligent NIDS systems to detect abnormal patterns of intrusion activities and take appropriate preventive measures. Previous studies have proposed NIDS solutions, yet persistent challenges such as outlier removal, data normalization, feature cardinality reduction, and class imbalance still persist. Therefore, this study proposed a unified solution to address all these challenges and offers a robust framework for NIDS development. First, a box-cox transformation was employed to normalize the numeric features; then cardinality reduction was applied to remove less redundant categories and retain the top 5 frequent labels and a none label. The normalized and cardinality-reduced feature set was then fed into the ADASYN method, which created synthetic oversampled data for balancing minority class, and a new feature set was developed. Then, two experiments were conducted, one for binary class classification and one for multiclass classification. The conducted experiments used 4 ML classifiers and the data was split into a ratio of 80–20 for training and testing the models. The conducted experiments yielded a multiclass classification accuracy of 81.27% and a binary classification accuracy of 97.23%. A comparison analysis with SOTA studies proved that the applied methods provide a precise, appropriate, timely, and efficient approach to NIDS development.
The conducted study is based on the UNSW-NB15 dataset, which may cause issues as dataset-specific solutions. However, fine-tuning can be performed to extend its applicability to other datasets. Further experiments can be conducted to address additional challenges of NIDS, which can potentially improve results and time complexity.
Acknowledgement: This research was supported by the Researchers Supporting Project (RSP2024R476), King Saud University, Riyadh, Saudi Arabia.
Funding Statement: The author received no specific funding for this study.
Author Contributions: A. Alabrah conducted all experiments and results, and wrote and approved the final version of the manuscript.
Availability of Data and Materials: The data that support the findings of this study are openly available at https://www.kaggle.com/datasets/mrwellsdavid/unsw-nb15.
Conflicts of Interest: The author declares that she has no conflicts of interest regarding the present study.
References
1. S. Saeed, S. A. Altamimi, N. A. Alkayyal, E. Alshehri, and D. A. Alabbad, “Digital transformation and cybersecurity challenges for businesses resilience: Issues and recommendations,” Sensors, vol. 23, no. 15, pp. 6666, 2023. doi: 10.3390/s23156666. [Google Scholar] [PubMed] [CrossRef]
2. I. Rosenberg, A. Shabtai, Y. Elovici, and L. Rokach, “Adversarial machine learning attacks and defense methods in the cyber security domain,” ACM Comput. Surv., vol. 54, no. 5, pp. 1–36, 2021. [Google Scholar]
3. Ö. Aslan, S. S. Aktuğ, M. Ozkan-Okay, A. A. Yilmaz, and E. Akin, “A comprehensive review of cyber security vulnerabilities, threats, attacks, and solutions,” Electr., vol. 12, no. 6, pp. 1333, 2023. doi: 10.3390/electronics12061333. [Google Scholar] [CrossRef]
4. E. Rehman et al., “Intrusion detection based on machine learning in the internet of things, attacks and counter measures,” J. Supercomput., vol. 78, no. 6, pp. 1–35, 2022. doi: 10.1007/s11227-021-04188-3. [Google Scholar] [CrossRef]
5. J. R. Rose et al., “IDERES: Intrusion detection and response system using machine learning and attack graphs,” J. Syst. Arch., vol. 131, no. 22, pp. 102722, 2022. doi: 10.1016/j.sysarc.2022.102722. [Google Scholar] [CrossRef]
6. A. Alabrah, “An efficient NIDPS with improved salp swarm feature optimization method,” Appl. Sci., vol. 13, no. 12, pp. 7002, 2023. doi: 10.3390/app13127002. [Google Scholar] [CrossRef]
7. M. Naveed et al., “A deep learning-based framework for feature extraction and classification of intrusion detection in networks,” Wirel. Commun. Mob. Comput., vol. 2022, no. 1, pp. 1–11, 2022. doi: 10.1155/2022/2215852. [Google Scholar] [CrossRef]
8. K. N. Qureshi, G. Jeon, and F. Piccialli, “Anomaly detection and trust authority in artificial intelligence and cloud computing,” Comput. Netw., vol. 184, no. 15–16, pp. 107647, 2021. doi: 10.1016/j.comnet.2020.107647. [Google Scholar] [CrossRef]
9. L. Zhou, S. Pan, J. Wang, and A. V. Vasilakos, “Machine learning on big data: Opportunities and challenges,” Neurocomput., vol. 237, pp. 350–361, 2017. doi: 10.1016/j.neucom.2017.01.026. [Google Scholar] [CrossRef]
10. B. Uzun and S. Ballı, “A novel method for intrusion detection in computer networks by identifying multivariate outliers and ReliefF feature selection,” Neural Comput. Appl., vol. 34, no. 20, pp. 17647–17662, 2022. doi: 10.1007/s00521-022-07402-2. [Google Scholar] [CrossRef]
11. P. Nimbalkar and D. Kshirsagar, “Feature selection for intrusion detection system in Internet-of-Things (IoT),” ICT Express, vol. 7, no. 2, pp. 177–181, 2021. doi: 10.1016/j.icte.2021.04.012. [Google Scholar] [CrossRef]
12. M. Rani and Gagandeep, “Effective network intrusion detection by addressing class imbalance with deep neural networks multimedia tools and applications,” Multi. Tool. Appl., vol. 81, no. 6, pp. 8499–8518, 2022. doi: 10.1007/s11042-021-11747-6. [Google Scholar] [CrossRef]
13. Y. G. Damtew and H. Chen, “SMMO-CoFS: Synthetic multi-minority oversampling with collaborative feature selection for network intrusion detection system,” Int. J. Comput. Intell. Syst., vol. 16, no. 1, pp. 12, 2023. doi: 10.1007/s44196-022-00171-9. [Google Scholar] [CrossRef]
14. X. Liu, T. Li, R. Zhang, D. Wu, Y. Liu and Z. Yang, “A GAN and feature selection-based oversampling technique for intrusion detection,” Secur. Commun. Netw., vol. 2021, no. 1, pp. 1–15, 2021. doi: 10.1155/2021/9947059. [Google Scholar] [CrossRef]
15. P. Garcia-Teodoro, J. Diaz-Verdejo, G. Maciá-Fernández, and E. Vázquez, “Anomaly-based network intrusion detection: Techniques, systems and challenges,” Comput. Secur., vol. 28, no. 1–2, pp. 18–28, 2009. doi: 10.1016/j.cose.2008.08.003. [Google Scholar] [CrossRef]
16. O. Kayode-Ajala, “Anomaly detection in network intrusion detection systems using machine learning and dimensionality reduction,” Sag. Sci. Rev. Appl. Mach. Learn., vol. 4, no. 1, pp. 12–26, 2021. [Google Scholar]
17. A. M. Ikotun, A. E. Ezugwu, L. Abualigah, B. Abuhaija, and J. Heming, “K-means clustering algorithms: A comprehensive review, variants analysis, and advances in the era of big data,” Inf. Sci., vol. 622, no. 11, pp. 178–210, 2023. doi: 10.1016/j.ins.2022.11.139. [Google Scholar] [CrossRef]
18. U. Farooq, N. Tariq, M. Asim, T. Baker, and A. Al-Shamma’a, “Machine learning and the internet of things security: Solutions and open challenges,” J. Parallel Distrib. Comput., vol. 162, no. 1, pp. 89–104, 2022. doi: 10.1016/j.jpdc.2022.01.015. [Google Scholar] [CrossRef]
19. O. A. Arqub and Z. Abo-Hammour, “Numerical solution of systems of second-order boundary value problems using continuous genetic algorithm,” Inf. Sci., vol. 279, no. 6, pp. 396–415, 2014. doi: 10.1016/j.ins.2014.03.128. [Google Scholar] [CrossRef]
20. Z. Abo-Hammour, O. Abu Arqub, S. Momani, and N. Shawagfeh, “Optimization solution of Troesch’s and Bratu’s problems of ordinary type using novel continuous genetic algorithm,” Dis. Dyn. Nat. Soc., vol. 2014, pp. 1–15, 2014. doi: 10.1155/2014/401696. [Google Scholar] [CrossRef]
21. P. Hajek, M. Z. Abedin, and U. Sivarajah, “Fraud detection in mobile payment systems using an XGBoost-based framework,” Inf. Syst. Front., vol. 25, pp. 1985–2003, 2023. doi: 10.1007/s10796-022-10346-6. [Google Scholar] [PubMed] [CrossRef]
22. V. Kumar, D. Sinha, A. K. Das, S. C. Pandey, and R. T. Goswami, “An integrated rule based intrusion detection system: Analysis on UNSW-NB15 data set and the real time online dataset,” Cluster Comput., vol. 23, no. 2, pp. 1397–1418, 2020. doi: 10.1007/s10586-019-03008-x. [Google Scholar] [CrossRef]
23. S. M. Kasongo and Y. Sun, “Performance analysis of intrusion detection systems using a feature selection method on the UNSW-NB15 dataset,” J. Big Data, vol. 7, no. 1, pp. 1–20, 2020. doi: 10.1186/s40537-020-00379-6. [Google Scholar] [CrossRef]
24. V. Kumar, A. K. Das, and D. Sinha, “UIDS: A unified intrusion detection system for IoT environment,” Evol. Intell., vol. 14, no. 1, pp. 47–59, 2021. doi: 10.1007/s12065-019-00291-w. [Google Scholar] [CrossRef]
25. M. A. Ambusaidi, X. He, P. Nanda, and Z. Tan, “Building an intrusion detection system using a filter-based feature selection algorithm,” IEEE Trans. Comput., vol. 65, no. 10, pp. 2986–2998, 2016. doi: 10.1109/TC.2016.2519914. [Google Scholar] [CrossRef]
26. J. S. Sasank, G. R. Sahith, K. Abhinav, and M. Belwal, “Credit card fraud detection using various classification and sampling techniques: A comparative study,” in 2019 Int. Conf. Comm. Elect. Syst. (ICCES), IEEE, 2019, pp. 1713–1718. [Google Scholar]
27. Z. Zhang and S. Huang, “Credit card fraud detection via deep learning method using data balance tools,” in 2020 Int. Conf. Comp. Sci. Manag. Tech. (ICCSMT), IEEE, 2020, pp. 133–137. [Google Scholar]
28. A. Alharbi et al., “A novel text2IMG mechanism of credit card fraud detection: A deep learning approach,” Electronics, vol. 11, no. 5, pp. 756, 2022. doi: 10.3390/electronics11050756. [Google Scholar] [CrossRef]
29. B. Abolhasanzadeh, “Nonlinear dimensionality reduction for intrusion detection using auto-encoder bottleneck features,” in 2015 7th Conf. Inf. Know. Tech. (IKT), IEEE, 2015, pp. 1–5. [Google Scholar]
30. T. T. H. Le, Y. Kim, and H. Kim, “Network intrusion detection based on novel feature selection model and various recurrent neural networks,” Appl. Sci., vol. 9, no. 7, pp. 1392, 2019. doi: 10.3390/app9071392. [Google Scholar] [CrossRef]
31. B. A. Tama, and K. H. Rhee, “An integration of PSO-based feature selection and random forest for anomaly detection in IoT network,” in MATEC Web of Conf., EDP Sciences, 2018, vol. 159, pp. 1053. [Google Scholar]
32. M. Almiani, A. AbuGhazleh, A. Al-Rahayfeh, S. Atiewi, and A. Razaque, “Deep recurrent neural network for IoT intrusion detection system,” Simul. Model. Pract. Theory, vol. 101, pp. 102031, 2020. doi: 10.1016/j.simpat.2019.102031. [Google Scholar] [CrossRef]
33. S. Chebrolu, A. Abraham, and J. P. Thomas, “Feature deduction and ensemble design of intrusion detection systems,” Comput. Secur., vol. 24, no. 4, pp. 295–307, 2005. doi: 10.1016/j.cose.2004.09.008. [Google Scholar] [CrossRef]
34. Y. Chen, A. Abraham, and B. Yang, “Feature selection and classification using flexible neural tree,” Neurocomputing, vol. 70, no. 1–3, pp. 305–313, 2006. doi: 10.1016/j.neucom.2006.01.022. [Google Scholar] [CrossRef]
35. A. Divekar, M. Parekh, V. Savla, R. Mishra, and M. Shirole, “Benchmarking datasets for anomaly-based network intrusion detection: KDD CUP 99 alternatives,” in 2018 IEEE 3rd Int. Conf. Comput. Commun. Secur. (ICCCS), IEEE, 2018, pp. 1–8. [Google Scholar]
36. Z. Ling and Z. J. Hao, “An intrusion detection system based on normalized mutual information antibodies feature selection and adaptive quantum artificial immune system,” Int. J. Semant. Web Inf. Syst., vol. 18, no. 1, pp. 1–25, 2022. doi: 10.4018/IJSWIS. [Google Scholar] [CrossRef]
37. Z. Ling and Z. J. Hao, “Intrusion detection using normalized mutual information feature selection and parallel quantum genetic algorithm,” Int. J. Semant. Web Inf. Syst., vol. 18, no. 1, pp. 1–24, 2022. doi: 10.4018/IJSWIS. [Google Scholar] [CrossRef]
38. S. A. Rahman, H. Tout, C. Talhi, and A. Mourad, “Internet of things intrusion detection: Centralized, on-device, or federated learning?,” IEEE Netw., vol. 34, no. 6, pp. 310–317, 2020. doi: 10.1109/MNET.011.2000286. [Google Scholar] [CrossRef]
Cite This Article
 Copyright © 2024 The Author(s). Published by Tech Science Press.
This work is licensed under a Creative Commons Attribution 4.0 International License , which permits unrestricted use, distribution, and reproduction in any medium, provided the original work is properly cited.
 Downloads
 Citation Tools