
 Submit a Paper
 Propose a Special lssue
 Open Access
ARTICLE

A Power Data Anomaly Detection Model Based on Deep Learning with Adaptive Feature Fusion
State Grid Information & Telecommunication Co. of SEPC, Big Data Center, Taiyuan, 030000, China
* Corresponding Author: Liang Gu. Email:
Computers, Materials & Continua 2024, 79(3), 4045-4061. https://doi.org/10.32604/cmc.2024.048442
Received 07 December 2023; Accepted 28 March 2024; Issue published 20 June 2024
 View Full Text
 Download PDF
Abstract
With the popularisation of intelligent power, power devices have different shapes, numbers and specifications. This means that the power data has distributional variability, the model learning process cannot achieve sufficient extraction of data features, which seriously affects the accuracy and performance of anomaly detection. Therefore, this paper proposes a deep learning-based anomaly detection model for power data, which integrates a data alignment enhancement technique based on random sampling and an adaptive feature fusion method leveraging dimension reduction. Aiming at the distribution variability of power data, this paper developed a sliding window-based data adjustment method for this model, which solves the problem of high-dimensional feature noise and low-dimensional missing data. To address the problem of insufficient feature fusion, an adaptive feature fusion method based on feature dimension reduction and dictionary learning is proposed to improve the anomaly data detection accuracy of the model. In order to verify the effectiveness of the proposed method, we conducted effectiveness comparisons through elimination experiments. The experimental results show that compared with the traditional anomaly detection methods, the method proposed in this paper not only has an advantage in model accuracy, but also reduces the amount of parameter calculation of the model in the process of feature matching and improves the detection speed.Keywords
In the power grid system, the presence of multi-source and heterogeneous data structures can offer a broader range of data sources and richer information. However, this complexity also presents challenges in analyzing and processing data, making the implementation of power data anomaly detection increasingly difficult. For these problems, more and more intelligent power data anomaly detection methods based on edge computing, machine learning, and other technologies are widely used [1,2]. Machine learning focuses on the data itself rather than its physical significance, which makes it highly automated, so machine learning-based anomaly detection is a very efficient way to solve the current problem.
In light of the aforementioned background technology, this paper tackles the critical issues arising from inconsistent data dimensions and inadequate feature extraction caused by the heterogeneity of terminals in power data anomaly monitoring. These challenges, in turn, contribute to the diminished accuracy of data anomaly monitoring. In response, this paper makes significant contributions in the following key areas:
(1) Data Alignment Method: Leveraging the unique characteristics of power data collection points, this paper introduces a data alignment method based on random sampling. This technique enhances data quality and effectively elevates the efficacy of power data processing.
(2) Anomaly Detection Method: The paper proposes an anomaly detection method for electronic data termed Adaptive Feature Fusion for Data Anomaly Detection (AFF-DAD). This method forms the cornerstone of constructing a deep learning-based anomaly data detection model, resulting in a notable enhancement in data detection accuracy.
(3) Feature Dimension Reduction: In conjunction with adaptive feature fusion, the paper employs a feature dimension reduction method to streamline the model’s parameter count while preserving data feature quality. This approach enables parameter pruning in the model, thereby enhancing performance without compromising detection accuracy.
As early as many years ago, scholars studied anomaly detection through traditional methods. Among them, the traditional feature extraction method is an important branch of anomaly detection research [3–6]. With technological advancements, pattern recognition has become integral to anomaly detection. Instead of listing a multitude of related tasks directly, it is more effective to highlight representative literature or models with a logical connection. For instance, Lou et al. [7] proposed a fault pattern recognition method based on wavelet and statistical models. Building upon this, Chen et al. [8] explored fault pattern recognition using neural networks, and Xu et al. [9] investigated a method based on wavelet packet decomposition and neural networks, showcasing continuous improvements in the field. As technology progressed, the integration of deep learning algorithms into data anomaly detection became prevalent. Notably, papers [10,11] combined neural networks with various signal-processing methods for fault identification, while others [12–14] delved into the application of diverse data-driven methods in fault diagnosis. However, the challenge persists in the domain of power data due to its diverse sources, resulting in sub-optimal data quality that hampers the practical application of existing models.
2.2 Feature Dimension Reduction
Early dimension estimation methods can be divided into two categories: Projection-based and geometry-based methods [15–19]. Fukungaga et al. [20] introduced a dimension estimation method rooted in local Principal component analysis (PCA). Tenenbaum et al. [21] devised an equidistant mapping approach for dimension reduction, leveraging multidimensional scale transformations to maintain constant geodesic jumps between two points. Belkin et al. [22] proposed the Laplace feature mapping dimension reduction method. This method addresses the assumption that the image projected onto the low-dimensional space by a very close point in the high-dimensional space should also be very close. The solution involves solving the generalized eigenvalue problem attributed to the graph Laplace operator. As research progresses, an increasing array of methods emerges for feature dimension reduction, particularly those based on dictionary learning [23,24]. The above methods effectively deal with the data noise problem, and are also of some significance for compression pruning of models.
Deep learning stems from the study of artificial neural networks [25–27]. A neural network is a hierarchical network structure consisting of many nonlinear neurons. Lu et al. [28] constructed a Convolutional Neural Network model, leveraging the advantages of image recognition and visual perception for data anomaly detection. The model adopts a deep hierarchical structure for diagnosing and identifying features. Mestav et al. [29] proposed the independent component analysis generative adversary networks (ICA-GAN) model using a generative adversarial approach, effectively improving anomaly detection. Additionally, Shao et al. [30,31] constructed various deep network models grounded in deep learning theory. These models successfully extracted rolling bearing fault features, offering diverse and effective methods for abnormal data diagnosis. In recent years, the rapid development of deep learning technology has been notable [32,33]. There is still a lot of research space to apply the new technology in the abnormality detection of power systems.
The model architecture of this paper is shown in Fig. 1, which contains three entities and four application layers.

Figure 1: System architecture diagram
The three entities are the user terminal, edge, and cloud.
User Terminal: The user terminal consists of a number of domestic, municipal, and industrial power consumption areas. Each power area is equipped with detection points to collect power consumption data. It is the data-providing end of the power system.
Edge: The edge terminal cleans, verifies, aggregates, and extracts features from the power data uploaded by the user terminal. The extracted data features are stored and backed up in the edge database, and the feature results are encrypted and transmitted to the cloud.
Cloud: The cloud also refers to the cloud server, which collects power data features from different power consumption areas, performs large model training, analyses the data features, and performs real-time detection of anomalies in the power consumption data.
The four application layers are the “Data Sampling Layer”, “Feature Fusion Layer”, “Edge Model Layer” and “Cloud Model Layer”.
4 Adaptive Feature Fusion Methods
4.1 Feature Dimension Reduction
In this paper, we take the example of reducing an
The optimal projection direction in the new space with the largest variance of the data is defined by the
First obtain the 1-dimension with the largest variance and generate the complementary space of that dimension. Continue to obtain the 1 dimension with the largest variance in the complementary space and generate a new complementary space. The cycle continues sequentially to obtain a space of
Define a set of unit-orthogonal
Then
Equivalent to a coordinate transformation
The derivative is set to zero to get
Then there is
That is
Constructing the Lagrangian function gives
Applying the partial derivative to A and setting it to 0 yields
The
The steps of the algorithm shown in this method are as follows:

In this paper, we introduce dictionary learning into the feature fusion process of power data. Dictionary learning operates on the principles of sparse modeling, wherein redundant data elements are eliminated, retaining only the most pertinent information essential for optimizing model parameters. This sparse representation effectively preserves crucial data features while simplifying the datasets, thus constituting an adaptive feature fusion approach.
In the study of this paper, the objective function is set as follows equation:
where
In this paper, K-Singular Value Decomposition is used to learn the optimal dictionary. The implementation of K-SVD consists of three main steps: Dictionary Initialization; Sparse Coefficient Solving; Dictionary Updating. The detailed process is described as follows:
(1) A randomly selected sample in the power data sample set used for training is used as the initialization atom, or given a DCT dictionary for initialization. The initialization dictionary is noted as
(2) For each sample
where
(3) For the
The overall representation error matrix
To encapsulate, the combination of PCA dimension reduction, K-Singular value decomposition (K-SVD) dictionary learning, and Orthogonal matching pursuit algorithm (OMP) feature sparse decomposition offers a parameter-free feature with no need for manual intervention or parameter setting based on prior experience. The resultant outcome solely depends on the intrinsic characteristics of the data, culminating in an adaptive feature fusion capability.
5 Data Anomaly Detection Model Based on Deep Learning
Based on the adaptive feature fusion method proposed in the previous section, the design process of this paper mainly includes several steps in Fig. 2. Within the time series

Figure 2: Data anomaly detection model data processing flowchart
Repeat the above steps according to different time series. The fused data features are fed into the anomaly score prediction model, and the prediction model is optimized according to the loss function. The obtained anomaly score and model parameters are fed into the cloud data anomaly monitoring model.
5.1.1 Data Alignment Based on Sliding Window
Assuming that the power data collected from the

Figure 3: Data dimension alignment
where
Take
Take

Figure 4: Sliding window data alignment method
The data is dimension compressed, and the principle of the algorithm here is derived from a Convolutional Neural Network with an
Through the above operation, the power data collected from different sources can be realized as dimensional aligned neat data. The operation of directly complementing 0 to the data can ensure that the features of the data will not be lost and will not introduce too much data noise. In the experimental analyses in Section 6, we specifically demonstrate the experimental demonstration of such an approach.
The normalized value of row
When
Then
The standard deviation
5.2 Data Anomaly Detection Model Based on Adaptive Feature Fusion (AFF-DAD)
The convolution operation is an important content in analytical mathematics, mainly including continuous convolution and discrete convolution. The network structure used in this paper is shown in Fig. 5. The specific description of each part of the structure is as follows:
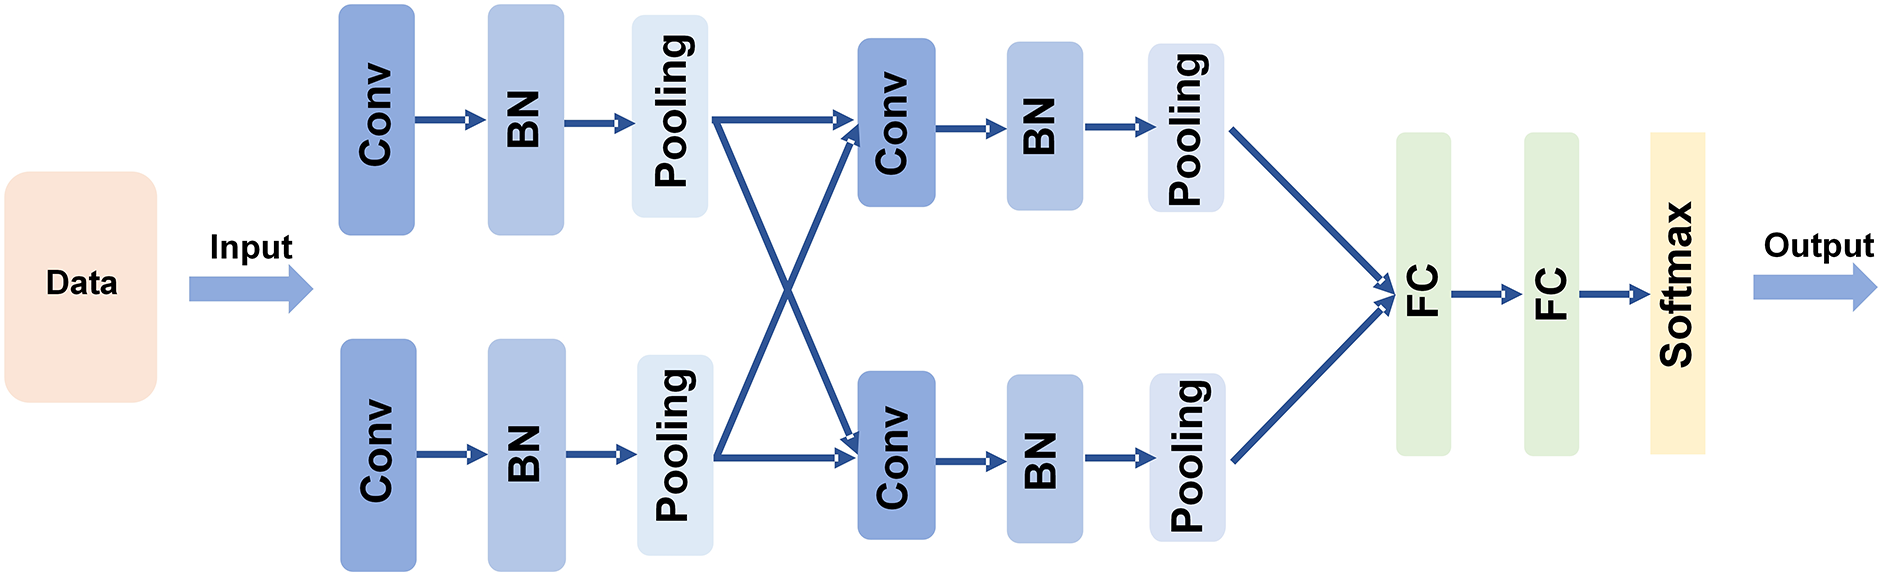
Figure 5: Neural network architecture for data anomaly detection
For the matrix
Then, for the anomaly score of each time segment, the principle of clustering-based decision classification is used. The anomaly scores of all time segments are sorted in descending order, and the first
Specifically, divide all the data samples into
where
The power data anomaly detection model, which is essentially a binary classification problem, aims to input a collected power data value and output whether this data is anomalous or not. In detail, a score will be output for this data in the model, and then the anomaly of the data will be judged based on the score threshold. In this paper, different ablation experiments are done on whether to enable the sliding window data alignment method, adaptive feature dimension reduction method, and adaptive feature fusion method, respectively. Experiments are also done to compare our model (AFF-DAD) with other conventional methods (DAD).
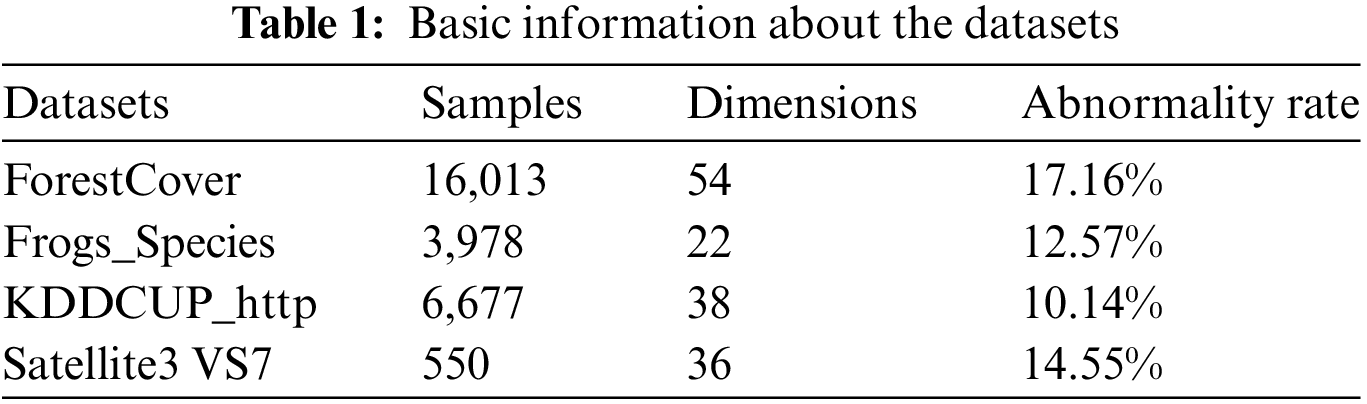
In terms of datasets, the PMU dataset is selected in this paper as the comparison benchmark for power data anomaly detection. In addition, in order to validate the data enhancement method, this paper makes an experimental comparison of four datasets, ForestCover, Frogs_Species, KDDCUP_http, and Satellite3 VS7, respectively. The datasets information is shown in Table 1.
In terms of model comparison, this paper has done experimental comparisons on KNN, LOF, MCD, PCA, OCSVM, AE, and CNN-DAE models respectively. Among them, the first five are machine learning methods and the last two is deep learning methods. In addition, experimental comparisons are made with the latest method ICA-GAN in this paper. Meanwhile, this paper migrates the proposed AFF method to ICA-GAN, which also brings better experimental results.
6.2.1 Comparison of Starting Time Series
We optimize the model training process step by step by dividing the time series. First, initialize the model parameters. Starting from the second time series, the current collected power data is used as the real value of the data, and the model output is used as the predicted value. The two fit a loss function to continuously optimize the model. Table 1 below demonstrates the effect of culling the number of data collections in the prepared on the model, and the effect of our model compared to conventional anomaly data detection models.
where “AFF-DAD” refers to the model proposed in this paper, and “DAD” refers to the conventional data anomaly detection model. “Starting time series” refers to the data collection time point used. 0T represents training with the collected data from the very beginning, and 500T refers to after 500 time series, the model is then iterations of the model. As mentioned above, the predicted data scores are not accurate enough due to the insufficient amount of data in the early stage.
As can be seen from the Table 2, the conventional method DAD is not sensitive to the starting time series.
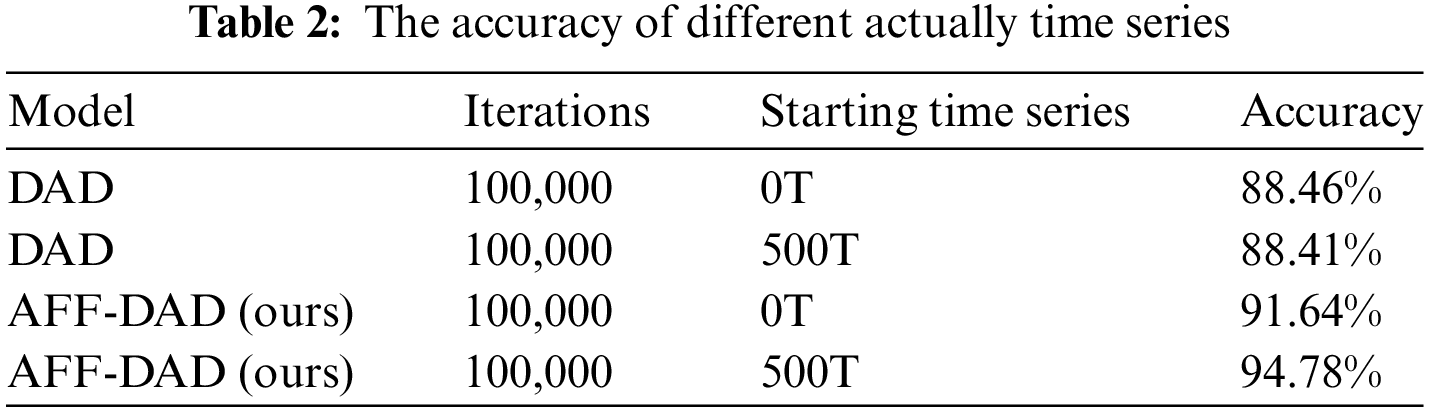
In the method proposed in this paper, starting from 500T is able to improve the accuracy by 3 percentage points compared to starting from 0T. After comparison, the best result of our method brings 6 percentage points of accuracy improvement compared to the conventional method.
6.2.2 Comparison of Data Enhancement Methods
In this paper, a data alignment method based on sliding window (SW) is proposed. It can maximize the retention of data features while ensuring dimensional alignment. Neither edge features are discarded nor additional data noise is added.
By controlling the variables to ensure that the model structure, power datasets, and feature fusion method remain unchanged, and only the data enhancement method is changed, this paper compares with the three data complementation and alignment methods, namely mean value interpolation (MVI), nearest neighbor interpolation (NNI), and regression interpolation (RI), as well as without data enhancement method, and the experimental results are shown in Fig. 6.

Figure 6: Impact of the data enhancement approach on the model
As can be seen from the Fig. 6, our method has comparable effect in the early stage compared to the conventional method, but the conventional method starts to converge in the middle of the iteration and the accuracy no longer increases. Our method can improve the accuracy by nearly 5 percentage points compared to the best regression interpolation method. At the same time, our method can improve the accuracy by more than 26 percentage points compared to the method without any data augmentation. It can be seen that data augmentation has a great impact on the training of the model.
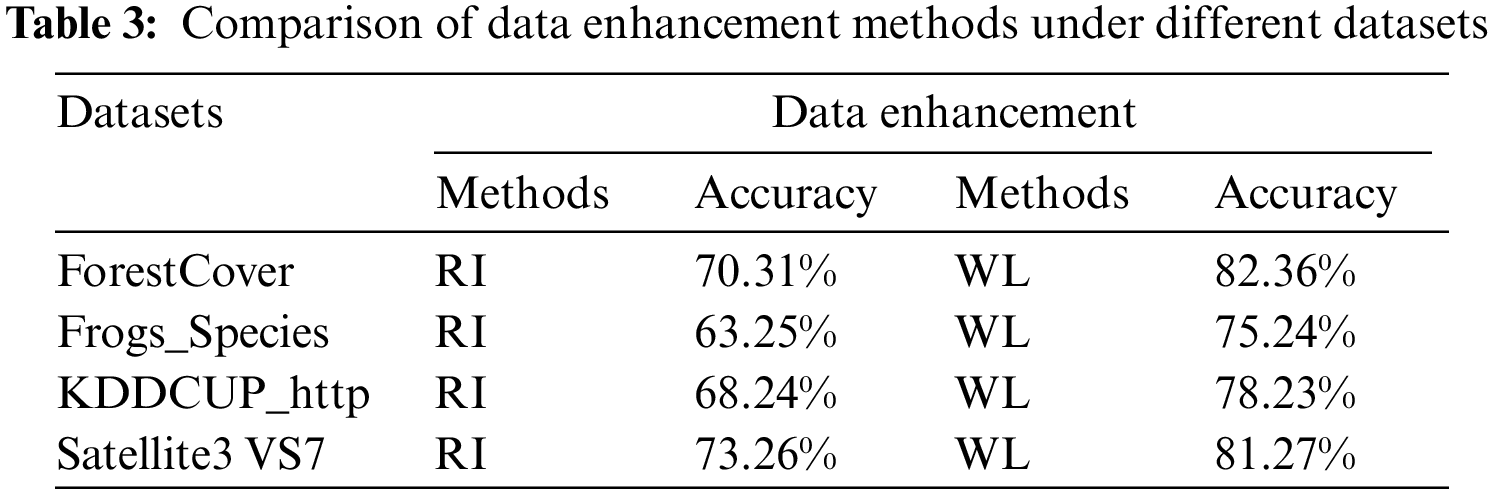
Regarding the comparison of data enhancement, ablation experiments are done in this paper on each of the four datasets. The experiments adjusted only the data enhancement method by controlling the model variables. The results, as shown in Table 3, show that the data processing method based on sliding window can significantly improve the accuracy of anomaly detection.
6.2.3 Comparison of Feature Fusion Methods
This paper also proposes an adaptive feature fusion method (AFF) based on feature dimension reduction and dictionary learning. The experimental results are shown in Fig. 7.

Figure 7: Impact of the data feature fusion on the model
In this subsection, we experimentally compare our method with traditional SVM methods, as well as advanced deep learning based models such as NRT and GAN. As can be seen from the Fig. 7, with neither using data augmentation, our proposed adaptive feature fusion method can improve the detection accuracy by about 3 percentage points compared to both principal component analysis and independent component analysis.
Based on the models listed in Subsection 6.1, the comparison experiments in this paper are shown in the following Table 4.

These include machine learning models, and the latest deep learning models. Take CNN-DAE as an example, which is a data anomaly detection model based on deep autoencoder [34]. It can effectively solve the problem that traditional machine learning-based data anomaly detection methods are ineffective and feature extraction is insufficient when facing high-dimensional data. Experiments prove that our method is comparable to it.
We reproduce the modeling approach of ICA-GAN. Unlike the original paper, we did not use the evaluation metrics of generative adversarial networks but converted them to the accuracy rates used in this paper. The results of the accuracy comparison are shown in Table 5.

In addition, we modified ICA-GAN by applying the adaptive feature fusion method used in this paper to GAN networks. By validating it on the PUM datasets, the experimental results are shown in Table 6.

Adaptive feature fusion (AFF) brings improvement in all aspects compared to independent component analysis (ICA). We also compare our method in this paper with NRT, Meas models, etc., and the experiments prove that our method has some effect enhancement.
6.3 Algorithm Performance Analysis
In summary, the data anomaly detection model proposed in this paper brings advantages in all processing aspects. Fig. 8 shows the convergence of the AFF-DAD model proposed in this paper compared to other models during the whole process of training iterations.
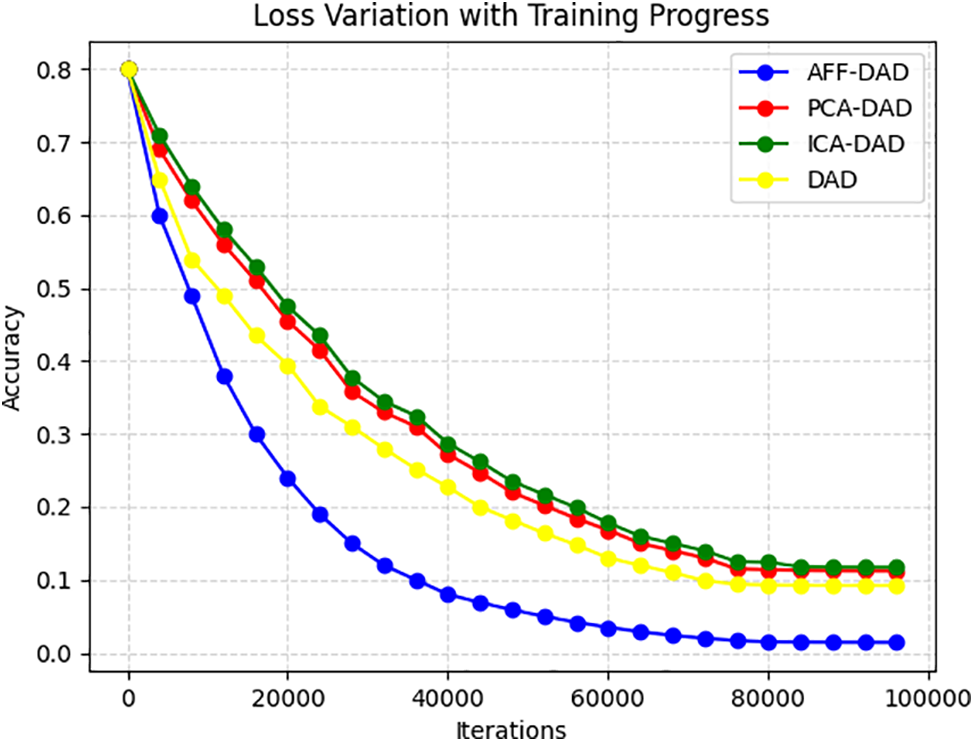
Figure 8: Loss variation with training progress
Table 7 below gives a comprehensive comparison of the experiments in this paper respectively in terms of feature fusion approach, data enhancement approach, number of model iterations, data dimension, and so on.

From the table, we can see that our method can improve the accuracy of the model to 94.78% by adjusting the data enhancement method and optimizing the feature fusion method, along with the increase of data dimension.
Table 8 below gives the computation of the model under different feature fusion methods.

Our proposed AFF-DAD model can reduce the parameter computation of the model by about 26%. Even compared to the PCA dimension reduction approach, it can reduce the computation of the model by about 11.5. This is mainly due to the introduction of the adaptive feature dimension reduction approach, which greatly reduces the dimension of the data features while maintaining the model accuracy.
In smart grid, there are three major systems, which are equipment operation and maintenance lean management system, dispatch management system, and energy management system. The power data anomaly detection model proposed in this paper can be applied in the dispatch management system.
Taking power distribution as an example, the safety threshold is set in advance for the detection results in this paper. For each power data detection result, one as normal and zero as abnormal, the model will output a probability value. Assuming that this probability value is 0.8, it is considered that there is an 80% chance that the power data is normal and a 20% chance that the power data is abnormal. By comparing the probability value with the threshold value, if the probability of abnormality is greater than the threshold value, an alarm is triggered to notify the safety officer for attention.
In response to the challenges posed by insufficient data feature fusion and low accuracy in anomaly detection within multi-source power terminal data, this study proposes a novel approach. Our method integrates a data alignment enhancement technique based on random sampling and an adaptive feature fusion method leveraging dimension reduction. By constructing an adaptive feature fusion data anomaly detection model using deep learning algorithms, our approach not only enhances detection accuracy but also reduces the number of model parameters through feature dimension reduction, enabling model pruning. The efficacy of our method is substantiated through multiple ablation experiments, validating its practical utility. This methodology holds promise for enhancing detection precision in real-world power systems while also offering scalability to larger datasets and more complex scenarios.
Acknowledgement: Thanks to State Grid Information & Telecommunication Co. of SEPC for supporting this paper.
Funding Statement: The authors received no specific funding for this study.
Author Contributions: Study conception and design: Xiu Liu, Liang Gu; data collection: Liang Gu; analysis and interpretation of results: Xiu Liu, Liang Gu, Xin Gong, Juying Wu; draft manuscript preparation: Long An, Xurui Gao. All authors reviewed the results and approved the final version of the manuscript.
Availability of Data and Materials: Due to the nature of this research, participants of this study did not agree for their data to be shared publicly, so supporting data is not available.
Conflicts of Interest: The authors declare that they have no conflicts of interest to report regarding the present study.
References
1. H. Liu et al., “Multi-perspective social recommendation method with graph representation learning,” Neurocomputing, vol. 468, no. 1, pp. 469–481, 2022. doi: 10.1016/j.neucom.2021.10.050. [Google Scholar] [CrossRef]
2. H. Liu, C. Zhang, Y. Deng, T. Liu, Z. Zhang and Y. F. Li, “Orientation cues-aware facial relationship representation for head pose estimation via transformer,” IEEE Trans. Image Process., vol. 32, no. 1, pp. 6289–6302, 2023. doi: 10.1109/TIP.2023.3331309. [Google Scholar] [PubMed] [CrossRef]
3. C. G. Cooley and R. G. Parker, “A review of planetary and epicyclic gear dynamics and vibrations research,” Appl. Mech. Rev., vol. 66, no. 4, pp. 1–15, 2014. doi: 10.1115/1.4027812. [Google Scholar] [CrossRef]
4. T. Barszcza and R. B. Randall, “Application of spectral kurtosis for detection of a tooth crack in the planetary gear of a wind turbine,” MechanicalSyst. Signal Process., vol. 23, no. 4, pp. 1352–1365, 2009. doi: 10.1016/j.ymssp.2008.07.019. [Google Scholar] [CrossRef]
5. Y. Jing and V. Makis, “Wavelet analysis with time-synchronous averaging of planetary gearbox vibration data for fault detection and diagnostics,” in Proc. CSAE, Shanghai, China, 2011, pp. 417–421. [Google Scholar]
6. R. B. Randall, “Vibration-based diagnostics of gearboxes under variable speed and load conditions,” Meccanica, vol. 51, no. 1, pp. 3227–3239, 2016. doi: 10.1007/s11012-016-0583-z. [Google Scholar] [CrossRef]
7. X. S. Lou, “Fault detection and diagnosis for rolling element bearing,” Ph.D. dissertation, Case Western Reserve Univ., USA, 2000. [Google Scholar]
8. P. Chen, “Bearing condition monitoring and fault diagnosis,” Ph.D. dissertation, The Univ. of Calgary, Canadian, 2000. [Google Scholar]
9. P. Xu, “Neural network based wheel bearing fault detection and diagnosis using wavelets,” Ph.D. dissertation, Texas A and M Univ., 2002. [Google Scholar]
10. S. Liu, Y. Sun, and L. Zhang, “Fault diagnosis based on dependent feature vector and probability neural network for rolling element bearings,” Appl. Math. Comput., vol. 247, no. 1, pp. 835–847, 2014. [Google Scholar]
11. M. Unal, M. Onat, and M. Demetgul, “Fault diagnosis of rolling bearings using agenetic algorithm optimized neural network,” Measurement, vol. 58, no. 1, pp. 187–196, 2014. doi: 10.1016/j.measurement.2014.08.041. [Google Scholar] [CrossRef]
12. Z. Wang, W. Zhao, and W. Du, “Data-driven fault diagnosis method based on the conversion of erosion operation signals into images and convolutional neural network,” Process Saf. Environ. Prot., vol. 149, no. 1, pp. 591–601, 2021. doi: 10.1016/j.psep.2021.03.016. [Google Scholar] [CrossRef]
13. T. Li, Y. Zhao, and C. Zhang, “A knowledge-guided and data-driven method for building HVAC systems fault diagnosis,” Build. Environ., vol. 198, no. 1, pp. 107850, 2021. doi: 10.1016/j.buildenv.2021.107850. [Google Scholar] [CrossRef]
14. Y. Zhang, T. Zhou, and X. Huang, “Fault diagnosis of rotating machincry based on recurrent neural networks,” Measurement, vol. 171, no. 1, pp. 108774, 2021. doi: 10.1016/j.measurement.2020.108774. [Google Scholar] [CrossRef]
15. X. Wang, Y. Zheng, and Z. Z. Zhao, “Bearing fault diagnosis based on statistical locally linear embedding,” Sensors, vol. 15, no. 1, pp. 16225–16247, 2015. doi: 10.3390/s150716225. [Google Scholar] [PubMed] [CrossRef]
16. M. Gan, C. Wang, and C. A. Zhu, “Multiple-domain manifold for feature extraction in machinery fault diagnosis,” Measurement, vol. 75, no. 1, pp. 76–91, 2015. doi: 10.1016/j.measurement.2015.07.042. [Google Scholar] [CrossRef]
17. J. Wand, Q. B. He, and F. R. Kong, “Automatic fault diagnosis of rotating machines by time-scale manifold ridge analysis,” Mech. Syst. Signal. Process., vol. 40, no. 1, pp. 332–339, 2013. [Google Scholar]
18. A. Hyvärinen and E. Oja, “Independent component analysis: Algorithms and applications,” Neural Netw., vol. 13, no. 4, pp. 411–430, 2000. doi: 10.1016/S0893-6080(00)00026-5. [Google Scholar] [PubMed] [CrossRef]
19. Q. B. He, “Vibration signal classification by wavelet packet energy flow manifold learning,” J. Sound Vib., vol. 332, no. 7, pp. 1881–1894, 2013. doi: 10.1016/j.jsv.2012.11.006. [Google Scholar] [CrossRef]
20. K. Fukunaga and D. R. Olsen, “An algorithm for finding intrinsic dimensionality of data,” IEEE Trans. Comput., vol. 20, no. 1, pp. 176–183, 1971. doi: 10.1109/T-C.1971.223208. [Google Scholar] [CrossRef]
21. J. Tenenbaum, V. de Silva, and J. C. Langford, “A global geometric framework for nonlinear dimensionality reduction,” Science, vol. 290, no. 5500, pp. 2319–2323, 2000. doi: 10.1126/science.290.5500.2319. [Google Scholar] [PubMed] [CrossRef]
22. M. Belkin and P. Niyogi, “Laplacian Eigen maps for dimensionality reduction and data representation,” Neural Comput., vol. 6, no. 15, pp. 1373–1396, 2003. [Google Scholar]
23. H. T. Zhou, J. Chen, and G. M. Dong, “Detection and diagnosis of bearing faults using shift-invariant dictionary learning and hidden Markov model,” Mech. Syst. Signal. Process., vol. 72, no. 73, pp. 65–79, 2016. doi: 10.1016/j.ymssp.2015.11.022. [Google Scholar] [CrossRef]
24. T. Han, D. X. Jiang, and X. C. Zhang, “Intelligent diagnosis method for rotating machinery using dictionary learning and singular value decomposition,” Sensors, vol. 17, no. 689, pp. 1–18, 2017. doi: 10.3390/s17040689. [Google Scholar] [PubMed] [CrossRef]
25. L. Hai et al., “TransIFC: Invariant cues-aware feature concentration learning for efficient fine-grained bird image classification,” IEEE Trans. Multimed., 2023. doi: 10.1109/TMM.2023.3238548. [Google Scholar] [CrossRef]
26. T. Liu, H. Liu, B. Yang, and Z. Zhang, “LDCNet: Limb direction cues-aware network for flexible human pose estimation in industrial behavioral biometrics systems,” IEEE Trans. Ind. Inform., 2023. doi: 10.1109/TII.2023.3266366. [Google Scholar] [CrossRef]
27. H. Liu, T. Liu, Y. Chen, Z. Zhang, and Y. F. Li, “EHPE: Skeleton cues-based gaussian coordinate encoding for efficient human pose estimation,” IEEE Trans. Multimed., 2022. doi: 10.1109/TMM.2022.3197364. [Google Scholar] [CrossRef]
28. C. Lu, Z. Wang, and B. Zhou, “Intelligent fault diagnosis of rolling bearing using hierarchical convolutional network based health state classification,” Adv. Eng. Inform., vol. 32, no. 1, pp. 139–151, 2017. doi: 10.1016/j.aei.2017.02.005. [Google Scholar] [CrossRef]
29. K. R. Mestav, X. Wang, and L. Tong, “A deep learning approach to anomaly sequence detection for high-resolution monitoring of power systems,” IEEE Trans. Power Syst.:, vol. 38, no. 1, pp. 4–13, 2023. [Google Scholar]
30. H. D. Shao, H. K. Jiang, and X. Q. Li, “Rolling bearing fault detection using continuous deep belief network with locally linear embedding,” Comput. Ind., vol. 96, no. 1, pp. 27–39, 2018. doi: 10.1016/j.compind.2018.01.005. [Google Scholar] [CrossRef]
31. H. D. Shao, H. K. Jiang, and Y. Lin, “A novel method for intelligent fault diagnosis of rolling bearings using ensemble deep auto-encoders,” Mech. Syst. Signal. Process., vol. 102, no. 1, pp. 278–297, 2018. doi: 10.1016/j.ymssp.2017.09.026. [Google Scholar] [CrossRef]
32. G. R. Reddy, C. Xanthopoulos, and Y. Makris, “On improving hotspot detection through synthetic pattern-based database enhancement,” IEEE Trans. Comput. Aided Des. Integr. Circuits Syst., vol. 40, no. 12, pp. 2522–2527, 2021. doi: 10.1109/TCAD.2021.3049285. [Google Scholar] [CrossRef]
33. Y. Wei, N. Luong, D. Hoang, Y. Jiao, and C. Miao, “Federated learning in mobile edge networks: A comprehensive survey,” IEEE Commun. Surv. Tutor., vol. 22, no. 3, pp. 1063–2031, 2022. [Google Scholar]
34. S. Zhang, L. Yao, and A. Sun, “Deep learning based recommender system: A survey and new perspectives,” ACM Comput. Surv., vol. 52, no. 1, pp. 1–38, 2019. [Google Scholar]
Cite This Article
 Copyright © 2024 The Author(s). Published by Tech Science Press.
This work is licensed under a Creative Commons Attribution 4.0 International License , which permits unrestricted use, distribution, and reproduction in any medium, provided the original work is properly cited.
 Downloads
 Citation Tools