
 Submit a Paper
 Propose a Special lssue
 Open Access
ARTICLE

Deep Learning Based Efficient Crowd Counting System
1 Department of Computer Engineering, College of Computer and Information Sciences, King Saud University, Riyadh, 12372, Saudi Arabia
2 Centre of Excellence in Cybercrime and Digital Forensics, Naif Arab University for Security Sciences, Riyadh, 14812, Saudi Arabia
3 Center of Excellence for Information Assurance (COEIA), King Saud University, Riyadh, 12372, Saudi Arabia
* Corresponding Author: Emad Ul Haq Qazi. Email:
(This article belongs to the Special Issue: Intelligent Computing Techniques and Their Real Life Applications)
Computers, Materials & Continua 2024, 79(3), 4001-4020. https://doi.org/10.32604/cmc.2024.048208
Received 30 November 2023; Accepted 08 March 2024; Issue published 20 June 2024
 View Full Text
 Download PDF
Abstract
Estimation of crowd count is becoming crucial nowadays, as it can help in security surveillance, crowd monitoring, and management for different events. It is challenging to determine the approximate crowd size from an image of the crowd’s density. Therefore in this research study, we proposed a multi-headed convolutional neural network architecture-based model for crowd counting, where we divided our proposed model into two main components: (i) the convolutional neural network, which extracts the feature across the whole image that is given to it as an input, and (ii) the multi-headed layers, which make it easier to evaluate density maps to estimate the number of people in the input image and determine their number in the crowd. We employed the available public benchmark crowd-counting datasets UCF CC 50 and ShanghaiTech parts A and B for model training and testing to validate the model’s performance. To analyze the results, we used two metrics Mean Absolute Error (MAE) and Mean Square Error (MSE), and compared the results of the proposed systems with the state-of-art models of crowd counting. The results show the superiority of the proposed system.Keywords
The concept of crowd monitoring and crowd management are becoming major issues and main concerns in political geography nowadays as the crowd of small cities from their virtual reality are coming out and are connecting to the physical world which has raised the need to monitor and manage the grown crowd. Overcrowded area necessitates strict crowd management methods for public safety using video surveillance, urban planning models, and crowd behavior understanding techniques; for this purpose, security analysts are taking advantage of artificial intelligence to monitor and manage the crowd activities in crowded areas. By using these cautious methods, they are making great progress and better observational designs for administration and data archiving for subsequent use by insight devices and associations [1]. Ada-HAR (Qi et al.) presented the idea of crowd detection using the cellular phone for this purpose they presented a framework for Human Activity Recognition (HAR) with the help of online supervised learning [2]. Later, Su et al. implemented the same methodology to identify the tool dynamics using deep neural networks for the surgery of teleoperations [3].
Some conventional methods for crowd prediction were presented, which detect the number of people from the moving window within that environment [4]. Some techniques have trained the classifiers by using feature extraction for crowd detection that targets the whole body to extract the features like edges [4], temples [5], and histogram-oriented gradients [6] since these methods perform effectively in scenarios where individuals are observable, but failed to detect in those situations where the presences of people are difficult or where parts of body and appearances are not visible clearly and the scenes are congested. To overcome these problems different researchers proposed different techniques such as different classifiers being trained to detect the different parts of bodies. In [7–11], multiple classifiers were used to detect certain body parts, comprising arms, legs, head, etc. The features were discriminated based on parts of the body. However, these proposed methods still do not detect the satisfactory number of persons or person’s activity and other features of the crowd. Over the years, many different approaches such as regression approaches and others were introduced for crowd monitoring and crowd detection but still, it is a worthy task to estimate the crowd in dense crowd areas. Various techniques have attempted to figure out the people count from the image by employing feature detection on it using learning of maps between the people present inside the image and each patch present inside that image [9].
Linear regression [10,11] is one of the popular types of regression techniques used to perform mappings for crowd management. In [12], Idrees et al. employed regression models and attempted to develop an approach that emphasized the significance of crowd detection in crowded areas. In their approach, the authors attempted to identify the crowd actions with the feature mapping using these mappings between the people present inside the picture, however, the proposed method does not fetch any spatial information about the crowd. In [13], Lempitsky et al. have presented a method for the detection of crowd and density mapping by employing a linear mapping function between local characteristics and a patch inside the images, however, the method does not collect the local features of an image that are needed for crowd estimation.
Since deep neural networks (DNN) are employed to capture the local features of image and video, it enables to capture of the minimal details of the image from the wider area and wide architecture. The multi-layer architecture of DNN with its better self-learning capabilities enables the models to recognize more complicated and effective system characteristics and functions in more intensive computational tasks in a very short amount of time. DNNs have been designed specifically to capture the density mapping characteristics as well as the accuracy count estimate of the crowd as deep learning has grown over the past few years, operating on the concept of the human neural network. All DNN models work well for feature detection such as audio detection, image detection, similarity detection, color detection, patch detection, traffic detection, etc. Therefore, there are varieties of deep neural network models available for different computational requirements: Convolutional Neural Networks (CNN), Recurrent Neural Networks (RNN), Encoder-Decoders, Long Short-Term Memory (LSTM), and Transformers are the most common models of DNN.
The author proposed a technique for locating crowds in light of the regulation of DNN called Multicolumn Neural Network (MCNN), the reason for this approach is to take advantage of the count of the group of a single picture by utilizing the multicolumn CNN model [14]. This work was utilized by different specialists over the years to find the group count utilizing a static picture. In [15], Boominathan et al. proposed a CrowdNet architecture for the reduction of versions in the static image of deeply dense areas using the CNN model, later Simonyan et al. [16] involved a similar philosophy but eliminated the associated layers in it. The researcher has proposed a novel technique neural network hydra CNN for ongoing groups which is supposed to be a scale-aware model for crowd counting that can estimate the thickness guide of individuals’ vehicles and most of the general items tracked down in the picture of the group [17].
In [18], Sam et al. proposed a method with the assistance of a crowd sense patch that estimates the crowd count utilizing regressor convolutional neural networks called switching. Influenced by the work [14] of Zhang et al., the authors Sindagi et al. used the CNN model in their study [19] where they used five different layers of CNN and proposed a Cascading Multi-Task Learning architecture (CMTL) for the counting of the crowd where they estimated the density maps and the contextual classifier were trained to estimate ten different types of crowds.
In 2017, Vaswani et al. presented a new concept named transformers [20] which are one of the main models of deep neural networks. Transformers are designed on the principle of knowledge learning and can solve more complex problems than CNNs and provide more accurate results in a short time [21]. The transformers use the knowledge from the pre-trained models that are trained on large datasets and provide similar work on smaller or similar tasks, transform provides better accurate results. For this reason, the Keras library [22] provides multiple state-of-the-art pre-trained models that can be used directly or finetuned as per the requirements of the given problem.
Based on the scaling type, weight, parameters, and size of the model there are various types of pre-trained models available in the Keras library. Starting from AlexNet [23] in 2012 to EfficientNet [24] in 2022 training models have achieved an accuracy of 63.5% to 90% above, respectively. Similarly, we have used EfficientNet in our model which is a scaled version of CNN to obtain better accurate results for large datasets. EfficientNet [24] works on the technique called compound coefficient where (Tan et al.) used the scaling method and AutoML framework. We used an EfficientNet-B3 pre-trained model in our proposed methodology that is fine-tuned for obtaining the maximum accuracy and takes less time for computation. The main contributions of this work are the following:
i) Proposed a state-of-the-art deep learning-based model for crowd counting. The proposed model is relatively lightweight and less computationally expensive.
ii) The proposed methodology is designed on multi-head layers architecture for the density crowd counting.
iii) Extensive analysis of existing techniques is presented. It is concluded from the analysis that the proposed methodology outperforms state-of-the-art techniques.
The rest of the paper is structured in the following manner: the literature review is presented in Section 2, the proposed approach is presented in Section 3 the findings are discussed in Sections 4, and 5 provides a conclusion and recommendations for further work.
Over the years, numerous techniques have been suggested to detect crowd management and different authors have worked on different methods and techniques to provide the best out of all methods to trace and manage crowds under different situations. In this study, we performed a literature review in two ways: Traditional methods and advanced methods; traditional methods are those methods that define crowd activities using a variety of techniques like regression method, linear method, machine learning algorithms, etc. whereas the advanced methods including deep neural network methods to find and estimate crowds.
Traditional methods for the detection of crowd detection involve regression approaches, holistic approaches, logical approaches, detection-based approaches, and many others.
According to the image, features such as textures, foreground pixels, and edge features primarily contribute to determining the crowd size. In 1995, Davies et al. [25] showed well-established techniques of image processing from monitoring to collecting the data of the crowd based on its behavior for security surveillance by using semi-global and global pixel intensity values to tackle pedestrians to infer the crowd behavior avoiding the recognition. In 1999, for the monitoring of complex sceneries of the platform underneath the station [26], a hybrid algorithm containing least squares and a global search algorithm was developed as a neural learning-based system for the estimation of the crowd with the results being accurate. From the sequence of pictures, the huge elements are removed, and these highlights are displayed by the neural network to assess the crowd density.
In 2006, Li et al. [27] proposed techniques using a support vector machine and multi-scale analysis, that may determine the density of a crowd. Wavelet transform was used to convert the pictures into a multi-image format, and then the vectors were removed to extract the features from the image. The proposed techniques were compared to the statistical conventional approaches and the results showed that the technique outperforms the better understanding. In 2007, Roqueiro et al. [28] suggested a method for video surveillance in which the ratio of foreground pixels from each grid cell was used to estimate the number of individuals visible in the crowd. By using the intermediate filter to predict the evaluated data and a highlighted extraction method from data mining methods were used to provide a working accuracy of 85%.
In 2008, Chan et al. [29] proposed a privacy-preserving system consisting of pedestrians that travel in different directions based on the estimation of the size of the inhomogeneous crowd without utilizing the explicit segments or the tracks of the video; where the turned crowd segments into a component of homogeneous motions by using dynamic texture and then set their holistic features form each segment than by comparing the segment the found out the learning rate using Gaussian process regression. In 2009, Chan et al. [30] proposed an approach for the surveillance system to count the crowd based on the segmentation of the crowd into sub-parts for analyzing the number of people employing analyzing the holistic properties of each subpart in the video. They also performed crowd modeling using dynamic textual mode and training event classification on that using the PETS 2009 dataset.
In 2009, Chan et al. [9] proposed an approach based on holistic properties for the counting of the crowd utilizing the low-level features of the segments, The authors analyzed Poisson regression by introducing the prior distribution on the weight of linear function in a Bayesian setting. The Hyper-parameters of the kernel were optimized using the kernelized approximation. The main benefit of the proposed work was to remove noise from the Gaussian process.
Using local techniques, it is possible to capture details that are specific to a person or group of pedestrians in an image. These local features are further categorized into two methods: The Detection Method and the Localization Method. Below mentioned are the methods of the local approach.
In 2005, Dalal et al. [6] proposed an approach for robust object visualization and recognition using linear SVM-based human detection as a test case. They used the girds of the histograms of the oriented gradient (HOG) that help to detect the existing features of detection estimation. The experimental work performed over 1800 images from the MIT dataset of the pedestrian.
In 2010, Conte et al. [31] introduced a method employing Support Vector Regression (SVR) aimed at enhancing the accuracy and robustness of crowd counting and estimation. The approach helps to find more accurate results for the estimation of the crowd. For low-density crowds, statistical data from pixels and feature points can depict changes in highly dense crowds. The authors in this study fuse the pixels and corners, while SVR is used to learn the corresponding connection between the feature and the number of persons [32]. In 2010, Felzenszwalb et al. [7] proposed a system based on a latent support vector machine (SVM) framework, which incorporates a mixture of parts with multi-scale deformations within the model. Considering [31], the authors have combined a multi-sensitive approach for data mining and provided better results.
In 2012, Chen et al. [33] proposed a methodology because of a multi-output regression model for the inclusion of the group in open scenes which can include packs in nearby districts and is more versatile without the requirement for preparing countless corresponding planning in neighborhood locales. The assessed low-level features and multi-level features of the result were designed for crowd estimation. In 2013, Idrees et al. [12] utilized multi-source data to figure the estimation for the number of pictures to distinguish the very thick group noticeable in a solitary picture by utilizing a Filter and the recurrence space examination or the estimation count of worldwide steady count utilizing the picture locales and the Markov random field.
The advanced methods for the estimation, surveillance, and detection of crowds include machine learning and deep learning algorithms.
In the proposed study, Zhang et al. [14] proposed a framework where they used a multi-column convolutional neural network to map the image using the crowd density map, and to accurately estimate the crowd count from the individual with an arbitrary crowd they used those images of density map. In 2016, Shang et al. [34] proposed an approach in which they first feed the image to the pre-trained CNN to fetch the most relevant features of the image for surveillance. Then with the memory cell using the recurrent network, they mapped those features to the local counting number. A Contextual pyramid of information based on CNN for crowd estimation was also presented which utilized CNN and Image processes at different density classes to generate high-quality crowd density maps. The proposed approach attained 295.8 MAE & 320.9 MSE [35].
In 2017, Sindagi et al. [19,36] presented contextual pyramid CNN for the mapping of crowd density and the count estimation of the crowd based on worldwide and local context data for crowd photos. It classifies images into different densities and then trains to perform the pitch-wise classification of the image. In 2019, Zhang et al. [37] proposed an approach for crowd counting and estimation using the rational attention model to perform pixel-wise short-range and long-range pixel capturing. LSA and GSA ration modules were introduced for the more informative aggregate features.
In 2020, Mazzeo et al. proposed the progressive MH-MetroNet plan that presents multi-head layers for swarm appraisal of density. On notable, freely open datasets, MH-MetroNet beats the top cutting-edge draws near. the execution of populace density gauges in tram-trains, where MH-MetroNet performs better compared to the latest cutting-edge designs where openly accessible source code is accessible. In 2021, Ahmed et al. [38] proposed a video detection framework for crowd detection. By counting distinct individuals and then conducting crowd analysis, the presence of a crowd is discovered. The gender and age of everyone in the crowd are identified during the study of crowds. In 2021, Bhuiyan et al. [39] proposed a way for performing the multiplicity analysis accurately in a separate video using any perspective and multitude density. The analysis of intervention and correlation of these reliable methods was performed with an accentuation on late recent CNN networks. The extensive literature review that is presented in this research highlights the historical evolution of crowd detection methods, transitioning from traditional techniques to advanced deep learning approaches. While traditional methods demonstrate early efforts, they often rely on manual feature engineering and face challenges in accuracy and adaptability. The proposed methodology focuses on EfficientNet-B3 and multi-headed layers, which addresses these limitations, leveraging recent advancements in neural network architectures. The extensive literature review is also summarized below in Table 1.

By designing the convolutional neural network into two parts we have estimated the density maps: In the first part we have used the base architecture for the feature extraction and in the other part we have used the multi-headed layers that combine these features which are obtained from the density maps for the estimation of the number of people inside the image which is given as the input to the design model. Other key resources involved in the study include high-quality crowd datasets, such as the UCF_CC_50 dataset, which contribute to the diverse training and evaluation scenarios. The use of NVIDIA’s CUDA toolkit for GPU-accelerated parallel computing is also common in deep learning workflows. Overall, the combination of NVIDIA RTX TITAN GPU and PyTorch, alongside relevant datasets and tools, forms a powerful and widely adopted setup for conducting deep learning experiments in the field of crowd counting and density estimation.
To enhance the performance of the base layer, we have grown the base deeper and more complicated over time. Typically, we have employed the pre-trained model from the Keras library named EfficientNet-B3, and we have enhanced the depth of the network by including new convolutional layers for better procedures by fine-tuning the performance of the model. We have also employed several base layers intending to improve the performance in terms of both the map’s density and the counting. Furthermore, we also compare the proposed approach with relevant researchers such as CSRNet, DenseNet, and SeNet [41–43].
ResNet: The ResNet is a collection of architectures that are motivated by the VGG network. It makes use of “Residual Learning” to improve output and performance and its convolutional layers are mostly 3 × 3 kernels in size. The ResNet family has five alternative configurations, ranging in size from 18 layers to 152 layers. Although training slows down as network depth grows, performance improves. ResNet-152 is the version that was utilized in this research. Particularly, the fourth layer and later layers are stripped away. The base produces a picture with output dimensions that are equivalent to one-eighth of the original ones in this way.
DenseNet: The DenseNet network was proposed by Huang et al. [42]. In this study, we have utilized the constrained version of the model called the DenseNet-121 model. Only level one is used for the model, the dense 2 layer is those up by it. The major of this is that the organization has been created to tackle the classification problems and by going through each layer the size of the picture will generally lessen. Contrasted with the firsts, the form used decreases the size by an eighth.
EfficientNet-B3: A new architecture named EfficientNet was suggested by Tan et al. in 2019 [24]. With less computing, this new network can outperform previous models in the categorization of the ImageNet dataset. The network resolution, breadth, and depth have been properly tuned by the creators to deliver a group of EfficientNets that reach from the B3 architecture up to the B3 plan. The EfficientNet-B3 model employed in this study is a constrained version of the model. Particularly, only the initial levels up to MBConvLayer 9 are utilized. Like earlier base layers, this one likewise employs a reduced version to produce an output image with dimensions equivalent to one-eighth of the original.
SetNet: Squeeze and Excitation is a novel layer that SeNet, as described by [43], proposes to support in increasing channel reliance while enhancing performance with almost little computational expense. After receiving the input tensor, the layer performs average pooling, a fully connected level, a ReLU, and finally another completely linked level, then a sigmoid. This layer’s results are scaled such that it may be linked to the input tensor. A collection of SE layers can be stacked on top of one another to create an SE network. In this study, a scaled-down version of the SeNet-154 is employed. Specifically, all layers beginning with layer 3 are removed. As a result, the base becomes significantly lighter, and pictures that are just one-eighth of their original size can be produced.
The choice of ResNet, DenseNet, EfficientNet, and SetNet for crowd counting is driven by a strategic balance between model complexity, computational efficiency, and their respective strengths in capturing complicated patterns within crowd scenes. ResNet’s skip connections address gradient issues, DenseNet’s dense connectivity promotes efficient feature reuse, EfficientNet-B3 optimizes performance with fewer parameters, and SetNet’s attention mechanism is tailored for spatial dependencies in crowd structures. These architectures are selected to maximize performance while addressing specific challenges associated with crowd-counting scenarios and provide a strong comparison with the proposed methodology. Fig. 1 shows the proposed architecture.
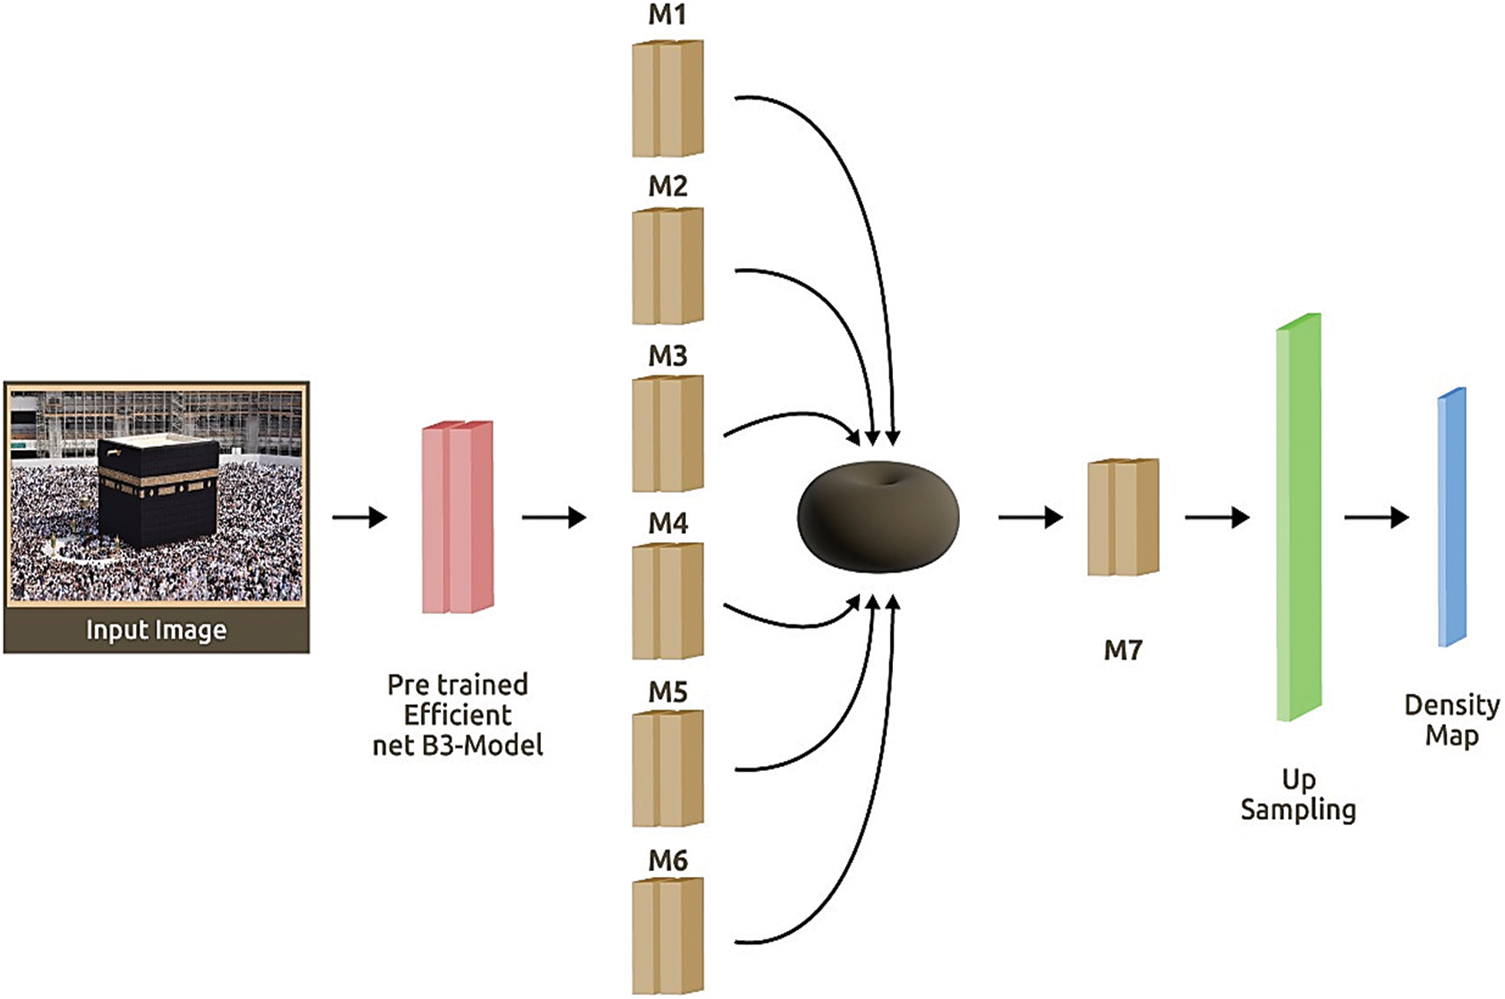
Figure 1: Proposed model for crowd counting using pre-train EfficientNet-B3
In this study, three datasets were used to develop the model and the evaluation of the proposed network’s demonstration to assess the performance of the suggested approach in the field of crowd inspection like UCF CC 50, and ShanghaiTech parts A and B. The data has been partitioned into an 80-20 ratio for training and testing, respectively.
The ShanghaiTech is a dataset introduced by [14] in 2016. This is further divided into two parts called ShanghaiTech part A and ShanghaiTech part B it contains 1198 images of a congested crowd and has 330165 people inside the image.
ShanghaiTech A data contains 482 records of the congested crowd images with different resolutions starting from pixel 300-200 to 1024-1024. Out of the total 482 images, 300 images are training images and 182 are tested images. The dataset contains about 10 individuals per photograph samples are shown in Fig. 2.
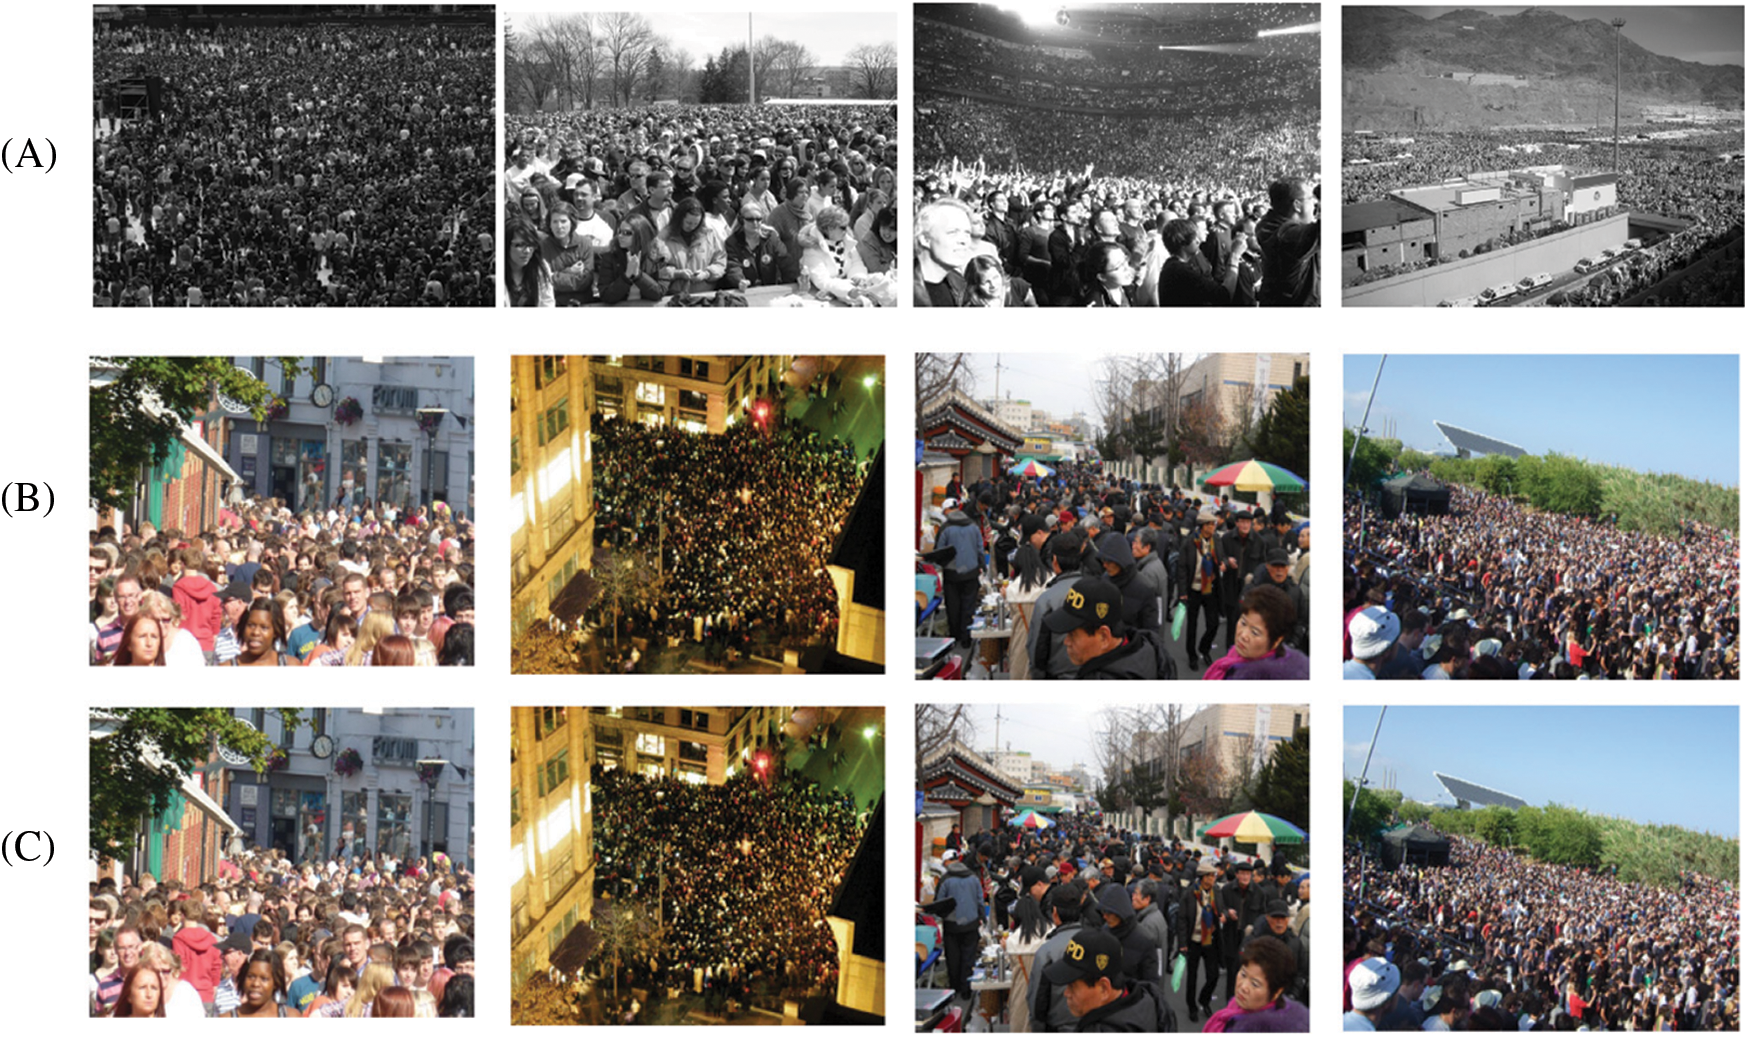
Figure 2: Images of datasets (A) an image of UCF CC 50 dataset (B) an image of ShanghaiTech part A dataset (C) an image of ShanghaiTech part B dataset
The dataset ShanghaiTech part B contains 716 records with the same image resolution of 1024 * 768 pixels presented in Fig. 2. The total number of images, there are 400 images of trained data and 316 are test data. In contrast, the total population inside the image is lesser as compared to the ShanghaiTech A dataset and they are present in a few hundred only.
The authors presented a dataset referred to as UCF CC 50 in [13]. The UCF CC 50 comprises 50 black and white photographs from the internet, most of which are from the FLICKR, depicting highly crowded settings in various sizes ranging from 368-496 to 1024-1024. The collection contained 63.974 distinct people or an average of 1.279 per picture. The sample images from the dataset are shown in Fig. 2.
In the preprocessing pipeline for crowd analysis using the UCF CC 50 and ShanghaiTech part A, B dataset, to guarantee a proper depiction of head positions and their spatial relationships, several pre-processing steps have been performed. A ground-truth density map is generated by transforming the discrete representation of individual heads into a smoothed density function. This is achieved by convolving a function (H(x)) representing the sum of delta functions for all heads in the image with a Gaussian kernel (G(x)). The resulting density map Dgti(x) = H(x) ∗ G(x)) captures the spatial distribution of heads in a more defined manner. To enhance the density maps, information about the distances between heads is incorporated. The distances to nearest neighbors (k) are calculated, and the average distance (d–) is derived. Applying a Gaussian filter with a standard deviation (σ) proportional to the average distance (d–), the density map is further refined (Dgti(x) = H(x) ∗ G σ (x)).
Lastly, the processed data is stored in easily accessible formats, such as CSV files. This facilitates seamless integration into the training phase of neural networks, ensuring that the generated ground-truth density maps contribute to the accurate analysis of crowd dynamics based on the UCF CC 50 and ShanghaiTech part A, and B datasets.
The proposed architecture contains six parallel layers, and the characteristics retrieved are utilized to create a representation of a density map (M1,…, M6). Every single layer has 3 layers of convolution with various sizes of filter kernels. Unlike the layer’s initial layer, which consists of either a 3 × 3, 5 × 5, 7 × 7 filter with various channels, the second convolutional layer of the Mi layer compresses the depths at the same values or 32 channels. The six parallel layer configurations are shown in Table 1. When it is demonstrated that data along the second layer’s channels are compressed down to 32 and combined utilizing a mean or a connection once the activation map, delivered by a conv1-1 activity, is gotten by adding a subsequent convolution layer M7, and it fills in as the main sub-tested estimate of the density map. The spatial resolution of this is comparable to one-eighth of the size of the first picture. An interpolation process is used to accomplish an up-sampling to produce a map with a better resolution. In comparison to standard un-pooling operations or dilated convolutions, the interpolation operation produces better results. Table 2 below has a view of multi-head layer configuration details.

M1, which has three convolutional layers stacked on top of each other, is the first feature extractor. On the other hand, M2 uses a similar structure but shallower filter depths to expand on the features that M1 extracted. The M3 module is designed to extract broader contextual information from the input, emphasizing the importance of larger receptive fields. Similar to M2, M4 follows a structure of decreasing filter depths. It focuses on refining the features obtained from M3, emphasizing the importance of mid-level features in the overall model. M5 introduces an even larger convolutional kernel, emphasizing the extraction of very long-range dependencies in the input data. This module aims to capture more patterns and relationships. M6 has a structure similar to M4, but with bigger convolutional kernels. Its main objective is to combine and enhance the features acquired from M5, readying them for further processing. M7 uses a 1 × 1 convolutional kernel to function as a bottleneck layer. Before final processing, it is probably used for dimensionality reduction and feature fusion, to combine data from various scales and levels of abstraction. Certainly, with a learning rate of 0.01 and a batch size of 32, the model’s training is completed accordingly. The learning rate of 0.01 sets the step size for parameter updates, impacting the steps of convergence and overall model performance. A batch size of 32 strikes a balance between computational efficiency and model generalization, affecting how the model generalizes patterns from the training to testing data.
4 Evaluation Metrics and Experimental Results
This section presents the findings obtained from the conducted experiments. The experimental results have shown two experiments on different datasets, e.g., ShanghaiTech part A, B [14] and UCF CC 50 [12] but using a distinct well-known base like DenseNet-121 [42], SeNet-154 [43], ResNet-152 [44], and EfficientNet-B5 [24]. The second fold of results was derived using the same state-of-the-art model that was used for the last experiment and using the same dataset.
Two performance metrics Mean Absolute Error and Mean Squared Error have been used in this section to obtain the results to analyze the performance.
4.1.1 Mean Absolute Error (MAE)
An average of the error made on the estimation of the number of people in the crowd, which is the difference between the original and computed values. This is called the L1 loss function. It is formally shown in Eq. (1).
where the number of the test sample is donated by N, the estimated count is C
The MSE is the average of the square error of the number of people in the crowd. which presents the distinct computed and real values. The L2 loss function is formally shown in Eq. (2).
The number of test samples donated by N, C
Due to the limited images, this dataset is very challenging to handle. We mention below shows the performance of the achievement using the different bases among which the ResNet-152 received the best results in MSE and MAE. Given are the examples of density maps produced on this dataset. Table 3 depicts the performance of the model compared with different Baselayers. Fig. 3 illustrates the crowd image, ground truth, and estimated density maps generated on the UCF CC 50 dataset.

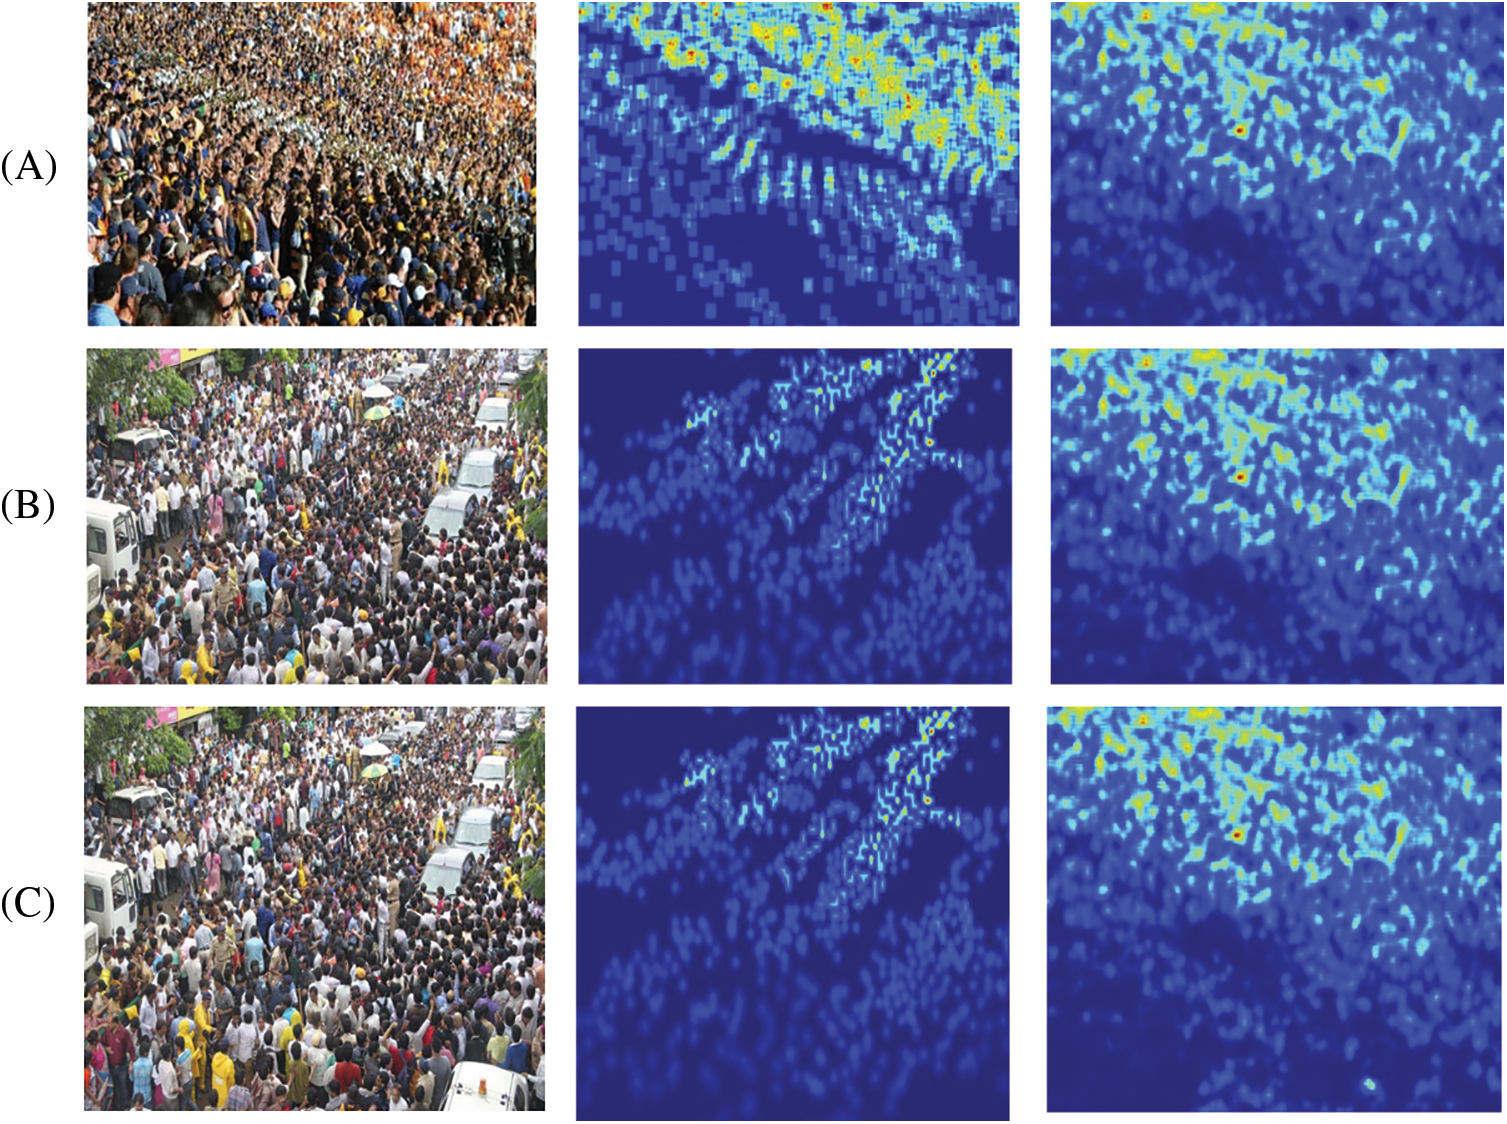
Figure 3: Density map estimation (A) Density map estimation using UCF CC 50 dataset, with crowd image, ground truth, and estimated density map, respectively. (B) Density map estimation using ShanghaiTech part A dataset, with crowd image, ground truth, and estimated density map respectively. (C) Density map estimation using ShanghaiTech dataset part B dataset, with crowd image, ground truth, and estimated density map, respectively
ShanghaiTech’s component of the data includes pictures in various resolutions with plenty of people in it. While the ShanghaiTech portion B has a lower-quality image with lower resolutions and several individuals. The performance of the network utilizing various bases is presented in Table 3. below, along with the performance of our model using the ResNet-152 base, which produces the most optimal results in terms of MSE and MAE. Fig. 3 depicts the density map estimations on the ShanghaiTech part A and B datasets. An example of the density map produced on our dataset this shown in Table 3 below. In this section, we present the comparison between different methodologies and our proposed approach based on MSE and MAE for the UCF CC 50 and the ShanghaiTech Part A and B datasets. Table 4 presents studies that have shown promising performance on the state-of-art methodologies, the studies using the UCF CC 50 are shown in Table 4 below.

Our proposed approach achieves the best results out of all methodologies and has shown promising results for the ShanghaiTech dataset. It presents different studies in which authors have used the UCF CC 50 dataset for their experimental results and achieved different values for the MSE and MAE. Among the mentioned studies, our proposed methodology has achieved the lowest MSE and MAE rate 162.3 and 213.3, respectively, which is closer to the PADNet [48] 185.8 MSE and 278.3 MAE. Table 4 presents various experimental results of different research methodologies with comparison to our proposed methodology using ShanghaiTech part A and part B datasets. The experimental analysis verifies that our proposed lightweight CNN model has achieved the lowest rate for the MSE and MAE for part A 61.3 and 107.6, respectively, whereas for part B 6.25 and 11.2 is respectively obtained that is again closest to the PADNet [48], CSRNet [47] and SANet [45] MAE and MSE rates for both. ShanghaiTech part A and part B datasets. The study evaluates the performance of a proposed lightweight CNN model on ShanghaiTech datasets A and B, comparing it with various methodologies, particularly focusing on MSE and MAE metrics. Notably, the proposed approach outperforms other methodologies on both datasets, achieving the lowest MSE and MAE rates. The comparison extends to the UCF CC 50 dataset, where the proposed model exhibits superior performance, surpassing established benchmarks such as PADNet, CSRNet, and SANet in terms of MSE and MAE rates.
Furthermore, the authors in [51] propose a deep learning-based method, utilizing a convolutional autoencoder and YOLOv3 architecture, to estimate passenger occupancy on buses in real-time, improving scheduling for transport operators and enhancing travel convenience for passengers but the proposed model is resource-constraining. Moreover, the authors in [52] propose incorporating IoT sensors into public transit networks to develop a “smart” crowd control solution. While it provides a well-structured reference architecture and predicts advantages beyond pandemic concerns, it lacks critical features. The design has not been tested in real-world applications, and critical issues such as privacy, cost-benefit analysis, and data fusion algorithm performance have been overlooked. A smart city leverages innovative technologies and data acquisition elements to enhance operations, optimize resources, and improve citizen services through the integration of information, digital, and telecommunication technologies, fostering sustainability and efficiency [53]. Addressing the dynamic distribution of crowds in smart cities, a deep-reinforcement-learning-based smart routing algorithm is designed to mitigate network congestion, balance loads, and ensure viability and low-latency support for smart city services in the context of advanced technologies like mobile edge computing, ultra-dense networking, and software-defined networking [54].
In conclusion, our research addressed the need for a novel multi-head Convolutional Neural Network approach for crowd counting using EfficientNet-B3 as the base. Our proposed model incorporates six parallel convolutional layers as head layers combining features from the convolutional backbone to estimate density maps and counting the number of people. We tested our approach on three benchmark crowd-counting datasets including UCF CC 50 and ShanghaiTech parts A, and B to confirm its effectiveness. The results demonstrated that our proposed architecture outperformed the state-of-the-art models in terms of performance. The model excels in tasks like crowd counting, showcasing its adaptability and superior performance across various applications in crowd analysis.
In the future, we will focus on the base model EfficientNet-B5 and B7 by enhancing modifications to their architectures. Our focus will also be on the reduction of the computational complexity of the model.
Acknowledgement: The author would like to express their deep thanks to the Vice Presidency for Scientific Research at Naif Arab University for Security Sciences for their kind encouragement of this work.
Funding Statement: This research was funded by Naif Arab University for Security Sciences under grant No. NAUSS-23-R10.
Author Contributions: Conceptualization, Waleed Khalid AL-Ghanem; data curation, Emad Ul Haq Qazi and Muhammad Hamza Faheem; formal analysis, E Waleed Khalid AL-Ghanem, Emad Ul Haq Qazi, Muhammad Hamza Faheem, and Syed Shah Amanullah Quadri; methodology, Waleed Khalid AL-Ghanem, Emad Ul Haq Qazi, Muhammad Hamza Faheem, Syed Shah Amanullah Quadri; software, Emad Ul Haq Qazi and Muhammad Hamza Faheem; supervision, Waleed Khalid AL-Ghanem; validation, Waleed Khalid AL-Ghanem, Emad Ul Haq Qazi, Muhammad Hamza Faheem, and Syed Shah Amanullah Quadri; visualization, Waleed Khalid AL-Ghanem, Emad Ul Haq Qazi, Muhammad Hamza Faheem, and Syed Shah Amanullah Quadri; writing—original draft, Emad Ul Haq Qazi and Muhammad Hamza Faheem; writing—review and editing, Waleed Khalid AL-Ghanem, Emad Ul Haq Qazi, Muhammad Hamza Faheem, Syed Shah Amanullah Quadri. All authors have read and agreed to the published version of the manuscript.
Availability of Data and Materials: Not applicable.
Conflicts of Interest: The authors declare that they have no conflicts of interest to report regarding the present study.
References
1. H. Ullah, A. B. Altamimi, M. Uzair, and M. Ullah, “Anomalous entities detection and localization in pedestrian flows,” Neurocomput., vol. 290, no. 7, pp. 74–86, 2018. doi: 10.1016/j.neucom.2018.02.045. [Google Scholar] [CrossRef]
2. W. Qi, H. Su, and A. Aliverti, “A smartphone-based adaptive recognition and real-time monitoring system for human activities,” IEEE Trans. Hum. Mach. Syst., vol. 50, no. 5, pp. 414–423, Oct. 2020. doi: 10.1109/THMS.2020.2984181. [Google Scholar] [CrossRef]
3. H. Su, W. Qi, C. Yang, J. Sandoval, G. Ferrigno and E. Momi, “Deep neural network approach in robot tool dynamics identification for bilateral teleoperation,” IEEE Robot. Autom. Lett., vol. 5, no. 2, pp. 2943–2949, Apr. 2020. doi: 10.1109/LRA.2020.2974445. [Google Scholar] [CrossRef]
4. P. Sabzmeydani and G. Mori, “Detecting pedestrians by learning shapelet features,” in Proc. IEEE Comput. Soc. Conf. Comput. Vis. Pattern Recognit. (CVPR), Minneapolis, MN, USA, Jun. 18–23, 2007. [Google Scholar]
5. B. Wu and R. Nevatia, “Detection of multiple, partially occluded humans in a single image by bayesian combination of edgelet part detectors,” in Proc. IEEE Int. Conf. Comput. Vis. (ICCV), Beijing, China, vol. 1, Oct. 17–20, 2005, pp. 90–97. [Google Scholar]
6. N. Dalal and B. Triggs, “Histograms of oriented gradients for human detection,” in Proc. IEEE Comput. Soc. Conf. Comput. Vis. Pattern Recognit. (CVPR), San Diego, CA, USA, Jun. 20-25, 2005, vol. 1, pp. 886–893. [Google Scholar]
7. P. F. Felzenszwalb, R. B. Girshick, D. McAllester, and D. Ramanan, “Object detection with discriminatively trained part-based models,” IEEE Trans. Pattern Anal. Mach. Intell., vol. 32, no. 9, pp. 1627–1645, 2010. doi: 10.1109/TPAMI.2009.167. [Google Scholar] [PubMed] [CrossRef]
8. W. Zhang, X. Sun, K. Fu, C. Wang, and H. Wang, “Object detection in high-resolution remote sensing images using rotation invariant parts based model,” IEEE Geosci. Remote Sens. Lett., vol. 11, no. 1, pp. 74–78, Jan. 2014. doi: 10.1109/LGRS.2013.2246538. [Google Scholar] [CrossRef]
9. A. B. Chan and N. Vasconcelos, “Bayesian poisson regression for crowd counting,” in Proc. IEEE Int. Conf. Comput. Vis. (ICCV), Kyoto, Japan, Sep. 29–Oct. 2, 2009, pp. 545–551. [Google Scholar]
10. X. Huang, Y. Zou, and Y. Wang, “Cost-sensitive sparse linear regression for crowd counting with imbalanced training data,” in Proc. IEEE Int. Conf. Multimed. Expo (ICME), Seattle, WA, USA, 2016, pp. 1–6. [Google Scholar]
11. D. Ryan, S. Denman, S. Sridharan, and C. Fookes, “An evaluation of crowd counting methods, features and regression models,” Comput. Vis. Image Underst., vol. 130, no. 3, pp. 1–17, 2015. doi: 10.1016/j.cviu.2014.07.008. [Google Scholar] [CrossRef]
12. H. Idrees, I. Saleemi, C. Seibert, and M. Shah, “Multi-source multi-scale counting in extremely dense crowd images,” in Proc. IEEE Comput. Soc. Conf. Comput. Vis. Pattern Recognit. (CVPR), Portland, OR, USA, 2013, pp. 2547–2554. [Google Scholar]
13. Lempitsky, V. Lempitsky, and A. Zisserman, “Learning to count objects in images,” in 24th Annu. Conf. Neural Inform. Proc. Syst. (NIPS), Vancouver, BC, Canada, Dec 6–9, 2010. [Google Scholar]
14. Y. Zhang, D. Zhou, S. Chen, S. Gao, and Y. Ma, “Single-image crowd counting via multi-column convolutional neural network,” in Proc. IEEE Comput. Soc. Conf. Comput. Vis. Pattern Recognit. (CVPR), Las Vegas, NV, USA, 2016, pp. 589–597. [Google Scholar]
15. L. Boominathan, S. S. S. Kruthiventi, and R. Venkatesh Babu, “CrowdNet: A deep convolutional network for dense crowd counting,” in 24th ACM International Conf. Multimed. (MM ‘16), New York, NY, USA, Association for Computing Machinery, 2016, pp. 640–644. [Google Scholar]
16. K. Simonyan and A. Zisserman, “Very deep convolutional networks for large-scale image recognition,” in Proc. 3rd Int. Conf. Learn. Representations (ICLR), San Diego, California, USA, May 7–9, 2015. [Google Scholar]
17. D. Oñoro-Rubio and R. J. López-Sastre, “Towards perspective-free object counting with deep learning,” in Computer Vision–ECCV 2016, Amsterdam, The Netherlands: Springer, Oct. 11–14, 2016, pp. 615–623. doi: 10.1007/978-3-319-46478-7_38. [Google Scholar] [CrossRef]
18. D. B. Sam, S. Surya, and R. V. Babu, “Switching convolutional neural network for crowd counting,” presented at the 2017 IEEE Conf. Comput. Vis. Pattern Recogn. (CVPR), Honolulu, HI, USA, 2017, pp. 4031–4039. [Google Scholar]
19. V. A. Sindagi and V. M. Patel, “CNN-based cascaded multi-task learning of high-level prior and density estimation for crowd counting,” presented at the 31st Int. Conf. Neural Inform. Process. Syst. (NIPS'17), Lecce, Italy, 2017, pp. 1–6. [Google Scholar]
20. A. Vaswani et al., “Attention is all you need,” presented at the 31st Int. Conf. Neural Inform. Process. Syst. (NIPS'17), Red Hook, NY, USA, Curran Associates Inc., Dec. 2017, pp. 6000–6010. [Google Scholar]
21. M. Popel and O. Bojar, “Training tips for the transformer model,” Prague Bull. Math. Linguist., vol. 110, no. 1, pp. 10–25, 2018. doi: 10.2478/pralin-2018-0002. [Google Scholar] [CrossRef]
22. F. Chollet, “Keras: The python deep learning library, github repository,” 2015. Accessed: Dec. 15, 2023. [Online]. Available: https://keras.io/ [Google Scholar]
23. A. Krizhevsky, I. Sutskever, and G. E. Hinton, “ImageNet classification with deep convolutional neural networks,” presented at the 25th Int. Conf. Neural Inform. Process. Syst., Red Hook, NY, USA, Curran Associates Inc, vol. 1, 2012, pp. 1097–1105. [Google Scholar]
24. M. Tan and Q. V. Le, “EfficientNet: Rethinking model scaling for convolutional neural networks,” in Proc. 36th Int. Conf. Mach. Learn. (ICML), Long Beach, California, USA, Jun. 9–15, 2019. [Google Scholar]
25. A. C. Davies, J. H. Yin, and S. A. Velastin, “Crowd monitoring using image processing,” Electron. & Commun. Eng. J., vol. 7, no. 1, pp. 37–47, 1995. doi: 10.1049/ecej:19950106. [Google Scholar] [CrossRef]
26. S. Y. Cho and T. W. S. Chow, “Fast neural learning vision system for crowd estimation at underground stations platform,” Neural Process. Lett., vol. 10, no. 2, pp. 111–120, 1999. doi: 10.1023/A:1018781301409. [Google Scholar] [CrossRef]
27. X. H. Li, L. S. Shen, and H. Q. Li, “Estimation of crowd density based on wavelet and support vector machine,” Trans. Inst. Meas. Contr., vol. 28, no. 3, pp. 299–308, 2006. doi: 10.1191/0142331206tim178oa. [Google Scholar] [CrossRef]
28. D. Roqueiro and V. A. Petrushin, “Counting people using video cameras,” Int. J. Parallel, Emergent Distrib. Syst., vol. 22, no. 3, pp. 193– 209, 2007. doi: 10.1080/17445760601139096. [Google Scholar] [CrossRef]
29. A. B. Chan, Z. S. J. Liang, and N. Vasconcelos, “Privacy preserving crowd monitoring: Counting people without people models or tracking,” presented at the 26th IEEE Conf. Comput. Vis. Pattern Recogn. (CVPR), Anchorage, AK, USA, 2008, pp. 1–7. doi: 10.1109/CVPR.2008.4587569. [Google Scholar] [CrossRef]
30. A. B. Chan, M. Morrow, and N. Vasconcelos, “Analysis of crowded scenes using holistic properties,” presented at the Twelth IEEE Int. Workshop Perform. Eval. Track. Surveill. (PETS), Miami, USA, Dec. 7–9, 2009. [Google Scholar]
31. D. Conte, P. Foggia, G. Percannella, F. Tufano, and M. Vento, “A method for counting people in crowded scenes,” presented at the 7th IEEE Int. Conf. Adv. Video Signal Based Surveill., Boston, MA, USA, 2010, pp. 225–232. doi: 10.1109/AVSS.2010.78. [Google Scholar] [CrossRef]
32. J. Yuan, H. Lou, H. Bao, and C. Xu, “A method for people counting using feature fusion based on SVR with PSO optimization,” presented at the IEEE 9th Int. Conf. Commun. Softw. Netw. (ICCSN), Guangzhou, China, 2017, pp. 1443–1446. doi: 10.1109/ICCSN.2017.8230347. [Google Scholar] [CrossRef]
33. K. Chen et al., “Feature mining for localised crowd counting,” in Electron. Proc. Br. Mach. Vis. Conf. (BMVC), Surrey, UK, Sep. 3–7, 2012. [Google Scholar]
34. C. Shang, H. Ai, and B. Bai, “End-to-end crowd counting via joint learning local and global count,” in IEEE Int. Conf. Image Process. (ICIP), Phoenix, AZ, USA, 2016, pp. 1215–1219. doi: 10.1109/ICIP.2016.7532551. [Google Scholar] [CrossRef]
35. V. A. Sindagi and V. M. Patel, “Generating high-quality crowd density maps using contextual pyramid CNNs,” in IEEE Int. Conf. Comput. Vis. (ICCV), Venice, Italy, 2017, pp. 1879–1888. doi: 10.1109/ICCV.2017.206. [Google Scholar] [CrossRef]
36. P. L. Mazzeo et al., “MH-MetroNet–A multi-head CNN for passenger-crowd attendance estimation,” J. Imaging, vol. 6, no. 7, pp. 62, 2020. doi: 10.3390/jimaging6070062. [Google Scholar] [PubMed] [CrossRef]
37. A. Zhang et al., “Relational attention network for crowd counting,” in 2019 IEEE/CVF Int. Conf. Comput. Vis. (ICCVSeoul, Korea (South2019, pp. 6787–6796. doi: 10.1109/ICCV.2019.00689. [Google Scholar] [CrossRef]
38. A. Ahmed, P. Bansal, A. Khan, and N. Purohit, “Crowd detection and analysis for surveillance videos using deep learning,” in Second Int. Conf. Electron. Sustain. Commun. Syst. (ICESC), Coimbatore, India, 2021, pp. 1–7. doi: 10.1109/ICESC51422.2021.9532683. [Google Scholar] [CrossRef]
39. M. R. Bhuiyan, D. J. Abdullah, D. N. Hashim, F. Al Farid, D. J. Uddin and N. Abdullah, “Crowd density estimation using deep learning for Hajj pilgrimage video analytics,” F1000Research, vol. 10, pp. 1190, 2021. doi: 10.12688/f1000research.73156.2. [Google Scholar] [PubMed] [CrossRef]
40. T. Alafif, B. Alzahrani, Y. Cao, R. Alotaibi, A. Barnawi and M. Chen, “Generative adversarial network based abnormal behavior detection in massive crowd videos: A Hajj case study,” J. Ambient Intell. Humaniz. Comput., vol. 13, no. 8, pp. 4077– 4088, 2022. doi: 10.1007/s12652-021-03323-5. [Google Scholar] [CrossRef]
41. Y. Li, X. Zhang, and D. Chen, “CSRNet: Dilated convolutional neural networks for understanding the highly congested scenes,” in 2018 IEEE/CVF Conf. Comput. Vis. Pattern Recognit., Salt Lake City, UT, USA, 2018, pp. 1091–1100. doi: 10.1109/CVPR.2018.00120. [Google Scholar] [CrossRef]
42. G. Huang, Z. Liu, L. van der Maaten, and K. Q. Weinberger, “Densely connected convolutional networks,” in IEEE Conf. Comput. Vis. Pattern Recognit. (CVPR), Honolulu, HI, USA, 2017, pp. 2261–2269. doi: 10.1109/CVPR.2017.243. [Google Scholar] [CrossRef]
43. J. Hu, L. Shen, S. Albanie, G. Sun, and E. Wu, “Squeeze-and-excitation networks,” IEEE Trans. Pattern Anal. Mach. Intell., vol. 42, no. 8, pp. 2011–2023, 2020. doi: 10.1109/TPAMI.2019.2913372. [Google Scholar] [PubMed] [CrossRef]
44. K. He, X. Zhang, S. Ren, and J. Sun, “Deep residual learning for image recognition,” in IEEE Conf. Comput. Vis. Pattern Recognit. (CVPR), Las Vegas, NV, USA, 2016, pp. 770–778. doi: 10.1109/CVPR.2016.90. [Google Scholar] [CrossRef]
45. X. Cao, Z. Wang, Y. Zhao, and F. Su, “Scale aggregation network for accurate and efficient crowd counting,” in Computer Vision–ECCV 2018, Munich, Germany, Sep. 8–14, 2018, pp. 757–773. doi: 10.1007/978-3-030-01228-1_45. [Google Scholar] [CrossRef]
46. L. Zhang, M. Shi, and Q. Chen, “Crowd counting via scale-adaptive convolutional neural network,” in IEEE Winter Conf. Appl. Comput. Vis. (WACV), Lake Tahoe, NV, USA, 2018, pp. 1113–1121. doi: 10.1109/WACV.2018.00127. [Google Scholar] [CrossRef]
47. Z. Shen, Y. Xu, B. Ni, M. Wang, J. Hu and X. Yang, “Crowd counting via adversarial cross-scale consistency pursuit,” in IEEE/CVF Conf. Comput. Vis. Pattern Recognit., Salt Lake City, UT, USA, 2018, pp. 5245–5254. doi: 10.1109/CVPR.2018.00550. [Google Scholar] [CrossRef]
48. Y. Tian, Y. Lei, J. Zhang, and J. Z. Wang, “PaDNet: Pan-density crowd counting,” IEEE Trans. Image Process., vol. 29, pp. 2714–2727, 2020. doi: 10.1109/TIP.2019.2952083. [Google Scholar] [PubMed] [CrossRef]
49. V. Sindagi, R. Yasarla, and V. Patel, “Pushing the frontiers of unconstrained crowd counting: New dataset and benchmark method,” in IEEE/CVF Int. Conf. Comput. Vis. (ICCV), Seoul, Korea (South2019, pp. 1221–1231. doi: 10.1109/ICCV.2019.00131. [Google Scholar] [CrossRef]
50. J. Wan and A. Chan, “Adaptive density map generation for crowd counting,” in IEEE/CVF Int. Conf. Comput. Vis. (ICCV), Seoul, Korea (South2019, pp. 1130–1139. doi: 10.1109/ICCV.2019.00122. [Google Scholar] [CrossRef]
51. Y. W. Hsu, Y. W. Chen, and J. W. Perng, “Estimation of the number of passengers in a bus using deep learning,” Sens., vol. 20, no. 8, pp. 2178, 2020. doi: 10.3390/s20082178. [Google Scholar] [PubMed] [CrossRef]
52. D. Darsena, G. Gelli, I. Iudice, and F. Verde, “Sensing technologies for crowd management, adaptation, and information dissemination in public transportation systems: A review,” IEEE Sens. J., vol. 23, no. 1, pp. 68–87, 2023. doi: 10.1109/JSEN.2022.3223297. [Google Scholar] [CrossRef]
53. D. Garcia-Retuerta, P. Chamoso, G. Hernández, A. S. R. Guzmán, T. Yigitcanlar and J. M. Corchado, “An efficient management platform for developing smart cities: Solution for real-time and future crowd detection,” Electronics, vol. 10, no. 7, pp. 765, 2021. doi: 10.3390/electronics10070765. [Google Scholar] [CrossRef]
54. L. Zhao, J. Wang, J. Liu, and N. Kato, “Routing for crowd management in smart cities: A deep reinforcement learning perspective,” IEEE Commun. Mag., vol. 57, no. 4, pp. 88–93, Apr. 2019. doi: 10.1109/MCOM.2019.1800603. [Google Scholar] [CrossRef]
Cite This Article
 Copyright © 2024 The Author(s). Published by Tech Science Press.
This work is licensed under a Creative Commons Attribution 4.0 International License , which permits unrestricted use, distribution, and reproduction in any medium, provided the original work is properly cited.
 Downloads
 Citation Tools