
 Submit a Paper
 Propose a Special lssue
 Open Access
ARTICLE
An Imbalanced Data Classification Method Based on Hybrid Resampling and Fine Cost Sensitive Support Vector Machine
College of Mechanical and Electrical Engineering, Kunming University of Science & Technology, Kunming, 650500, China
* Corresponding Author: Bo Zhu. Email:
Computers, Materials & Continua 2024, 79(3), 3977-3999. https://doi.org/10.32604/cmc.2024.048062
Received 26 November 2023; Accepted 22 March 2024; Issue published 20 June 2024
 View Full Text
 Download PDF
Abstract
When building a classification model, the scenario where the samples of one class are significantly more than those of the other class is called data imbalance. Data imbalance causes the trained classification model to be in favor of the majority class (usually defined as the negative class), which may do harm to the accuracy of the minority class (usually defined as the positive class), and then lead to poor overall performance of the model. A method called MSHR-FCSSVM for solving imbalanced data classification is proposed in this article, which is based on a new hybrid resampling approach (MSHR) and a new fine cost-sensitive support vector machine (CS-SVM) classifier (FCSSVM). The MSHR measures the separability of each negative sample through its Silhouette value calculated by Mahalanobis distance between samples, based on which, the so-called pseudo-negative samples are screened out to generate new positive samples (over-sampling step) through linear interpolation and are deleted finally (under-sampling step). This approach replaces pseudo-negative samples with generated new positive samples one by one to clear up the inter-class overlap on the borderline, without changing the overall scale of the dataset. The FCSSVM is an improved version of the traditional CS-SVM. It considers influences of both the imbalance of sample number and the class distribution on classification simultaneously, and through finely tuning the class cost weights by using the efficient optimization algorithm based on the physical phenomenon of rime-ice (RIME) algorithm with cross-validation accuracy as the fitness function to accurately adjust the classification borderline. To verify the effectiveness of the proposed method, a series of experiments are carried out based on 20 imbalanced datasets including both mildly and extremely imbalanced datasets. The experimental results show that the MSHR-FCSSVM method performs better than the methods for comparison in most cases, and both the MSHR and the FCSSVM played significant roles.Keywords
Imbalanced data classification is not uncommon in various applications. The identification of financial fraud [1] and market research [2] in the financial field, pathological image recognition [3] and disease detection [4] in the medical field, network intrusion detection [5] and spam information identification [6] in the network security field, as well as fault detection [7] and object inspection task [8] in the industrial field are all too often encountered with imbalanced data. The available samples of the more noteworthy class, such as the fraudulent instance, the positive case, the spam, and the machine failure are usually far less than those of the opposite class, which can be obtained relatively easily but are not so noteworthy. The noteworthy class is commonly called a positive class or minority class, while the opposite class is called a negative class or majority class. Although the positive class is accompanied by higher misclassification costs, it always gets poor classification precision for the traditional classifiers taking no account of data imbalance are naturally biased to the negative class. Scholars have proposed many methods to conquer this problem, which can be divided into three types, namely the data preprocessing approaches, the algorithm approaches, and the hybrid approaches.
The data preprocessing approaches are mainly based on resampling methods, which can be divided into over-sampling, under-sampling, and hybrid sampling methods, and experts in the field consider the hybrid sampling methods to be the best [9]. The Synthetic Minority Over-Sampling Technique (SMOTE) proposed by Chawla et al. [10] is the most famous over-sampling method, which randomly selects one from k nearest neighbors of the positive sample to generate a new positive sample by linear interpolation with a random number within the range (0, 1) as the parameter. However, the SMOTE does not fully consider the distribution of adjacent samples, so it may cause serious inter-class overlap. Han et al. [11] proposed the Borderline SMOTE method, which only performs nearest-neighbor linear interpolation on a few samples on the borderline, making the distribution of the synthesized positive samples more reasonable. He et al. [12] proposed Adaptive Synthetic Sampling (ADASYN), which automatically determines the number of generated samples based on the density of positive samples in the feature space. More samples are generated in areas with lower density, while fewer samples are generated in areas with higher density, which is beneficial for preventing the production of noisy samples. Random Under-Sampling (RUS) is the simplest under-sampling method, which randomly removes negative samples to achieve data balance, so there is a high risk of information loss. Compared to the over-sampling and the under-sampling methods, the hybrid sampling strategy has significant advantages. Goel et al. [13] proposed the SMOTE-Tomek, which firstly oversamples positive samples using SMOTE and then uses Tomek links to clean up the Tomek sample pairs on the borderline to reduce noisy samples. Agrawal et al. [14] proposed the SMOTE and Clustered Under-sampling Technique (SCUT), the SMOTE is used for over-sampling positive samples, while Expectation Maximization (EM) clustering is used for under-sampling negative samples, which performs better on datasets with high imbalance ratio. Batista et al. [15] proposed SMOTEENN, which uses SMOTE to over-sample data first and then uses the Edited Nearest Neighbor (ENN) to clean out the samples with most near neighbors belonging to the opposite class. Due to its significant effect in removing noisy samples, it has become a research hotspot. In recent years, Generative Adversarial Networks (GANs) have been introduced as an oversampling method in imbalanced data processing. Sharma et al. [16] proposed a novel hybrid approach including SMOTE and GAN (SMOTifed-GAN), which lets the samples SMOTE-generated as input for GAN instead of random numbers, to some extent, improve classification performance. Furthermore, Alberto et al. [17] proposed a new method based on pseudo-negative sampling (PNS), which refers to the samples labeled as negative but very close to the positive samples. The Pseudo-negative samples need to be identified and corrected to be the positive samples to balance the dataset. The PNS needs not to change the overall number of samples, so it does not introduce new noisy samples or cause potential information loss. But it simply identifies pseudo-negative samples based on the Euclidean distance between samples, lacking consideration of the overall distribution of the dataset.
Dealing with imbalanced data problems from an algorithmic perspective is mainly based on cost-sensitive learning and ensemble learning. The cost-sensitive learning corrects the classifier’s discrimination against negative classes by assigning a greater misclassification cost to the positive class compared to that of the negative class. The academic community has proposed cost-sensitive versions of various traditional classifiers, such as Logistic Regression (LR), Support Vector Machine (SVM), and Back Propagation Neural Network (BPNN), among which SVM, as a classification model that performs well under small sample size, has received research on its cost sensitivity. Article [18] effectively solved the problem of dataset imbalance based on cost-sensitive semi-supervised laplacian support vector machines. Iranmehr [19] improved the performance of classifiers by modifying the loss function based on SVM combined with cost-sensitive algorithms. These proposed methods all introduce cost weights into SVM, and to some extent alleviate the problem of low accuracy of positive classes caused by data imbalance. However, they only roughly determine class cost weights based on the imbalanced ratio of the dataset, because classification accuracy is not only impacted by data imbalance, but also by distribution characteristics such as inter-class overlap, sub-concepts, and abstractly small sample size. Therefore, these types of methods cannot get a higher classification effect, even greatly sacrificing the accuracy of the negative classes while improving the accuracy of the positive class, and then damaging the overall classification performance. Moreover, Adaptive Cost-Sensitive Boosting (Ada-Cost), Easy Ensemble, and e-Xtreme Gradient Boosting (XG-Boost) [20] are ensemble learning algorithms designed to address class imbalance issues. Article [21] successfully applied the Ada-Cost algorithm with SVM as the base classifier to address imbalanced data, achieving promising results. Article [22] validated the feasibility and effectiveness of the proposed Easy Ensemble approach, which transforms the imbalanced class learning problem into a subproblem of ensemble-based balanced learning. In general, ensemble learning can enhance overall performance by leveraging the strengths of multiple models, while also possessing favorable characteristics such as robustness and strong generalization ability.
Some scholars have combined data resampling with classification algorithms for imbalanced data learning to improve recognition accuracy. Liu [23] proposed an integrated classification algorithm based on random hybrid resampling and genetic algorithm. Firstly, random sampling was used to reduce the number of negative class samples, and the SMOTE method was used to generate positive samples to obtain multiple balanced training data subsets. Based on these, multiple XG-Boost classifiers were trained, and then the outputs were integrated by using a simple voting method to obtain the final classifier. Khattak et al. [24] proposed an improved Balance Cascade algorithm that integrates Bootstrap and XG-Boost, in which, the positive samples are sampled using Bootstrap and the negative samples are sampled using the Balance Cascade algorithm, while XG-Boost is used as the base classifier. Zhao et al. [25] proposed an imbalanced data classification method based on under-sampling and an improved SVM. The proposed method is more stable in classifying imbalanced data and exhibits better performance in many cases. Hussein et al. [26] proposed a hybrid approach combining data pre-processing techniques and SVM optimized by improved Simulated Annealing (SA). It generated new minority samples removed redundancy and duplicated majority samples to equalize the number of samples between classes first, and then used the improved SA algorithm to search optimum penalty parameters for the SVM. Their experimental results demonstrate that the approach performs better on ten public imbalanced datasets in comparison with the conventional SVM.
To sum up, the existing resampling methods have the problems of not fully considering the spatial distribution of data and requiring manual specification of sampling ratios, and the existing cost-sensitive and ensemble learning methods have the problems of the decision of cost weights are too simple to accurately capture sample distribution characteristics. To overcome these problems, this article proposes a new method named MSHR-FCSSVM for imbalanced classification. Where the MSHR means a Hybrid Resampling method based on Silhouette values calculated on Mahalanobis distance and the FCSSVM means a Fine Cost Sensitive SVM.
The contributions of this article are as follows:
• A new hybrid resampling method called MSHR is proposed, which uses Mahalanobis distance to calculate Silhouette values of samples to better reflect the distribution of the data. The physical phenomenon of the rime-ice (RIME) algorithm is used to find more reasonable pseudo-negative samples, which are based on generating new positive samples that are more correspond to the distribution of existing positive samples.
• Proposed a fine cost-sensitive SVM model called FCSSVM, the cost weights of which are finely determined by the RIME algorithm to make the classification hyper-plane more in accord with the distribution of the imbalanced data.
• Combining the proposed hybrid resampling method with the fine cost-sensitive SVM model to handle imbalanced data classification.
The remainder of this article is organized as follows. Section 1 introduces the key theoretical knowledge that supports the proposed method in this article; Section 2 provides a detailed explanation of the proposed methods and models; Section 3 introduces the experimental datasets and evaluation metrics; Section 4 presents the data experiments and result analysis; Section 5 concludes this article.
2.1 Silhouette Value Is Calculated Based on Mahalanobis Distance
The Silhouette score [27] is usually used to evaluate the performance of a clustering algorithm, which is achieved by averaging the Silhouette value of each sample. The Silhouette value measures the similarity between each sample and the class it belongs to, as well as the difference between it and the other classes. The silhouette value of the sample
where
The Silhouette value of a sample is within the range (−1, 1). It means that the sample more strongly belongs to its class than to other classes as it is approaching 1, and the opposite is true as it is approaching −1. So, the bigger the Silhouette value, the better the separability of this sample. Silhouette value is usually calculated based on Euclidean distance. It is proposed in this article to calculate Silhouette values based on Mahalanobis distance.
Mahalanobis distance was proposed by Indian statistician P. C. Mahalanobis [28]. Unlike Euclidean distance, it is based on the overall sample set, considering the connections between the various features of the samples. By introducing the correlation and variance between samples, it can better measure the similarity between samples, so it is commonly used in clustering [29], anomaly detection [30], and pattern recognition [31]. The Mahalanobis distance
where,
2.2 Cost-Sensitive SVM (CS-SVM)
CS-SVM is a variant of SVM designed for imbalanced data and has been commonly used in binary classification [34], multi-classification [35], and regression problems. CS-SVM assigns different misclassification cost weights to different classes and sets higher weights for the positive samples to give them to be given more attention when making predictions, thereby to some extent improving accuracy for the positive class.
Assuming that there are
where the
The RIME optimization algorithm proposed by Su et al. [36] in February 2023 is a new meta-heuristic algorithm inspired by the growth behavior of frost ice in nature. It includes three steps: (1) Simulate the motion of soft fog particles in fog and ice. This step continuously switches between large-scale exploration and small-scale exploration, so it can achieve high efficiency and precision. (2) Simulate the cross behavior between hard fog agents. This step achieves effective information exchange between ordinary agents and optimal agents. (3) Select the most optimal solution by filtering out suboptimal solutions in the population by greedy selection.
The initial population
The updated position of each rime agent in the condensation process can be calculated by Eq. (5).
where the
where the
where the
In strong gale conditions, hard-rime growth is simpler and more regular than soft-rime growth, which can be used to update the algorithm between agents, so that the particles of the algorithm can be exchanged and the convergence of the algorithm and the ability to jump out of the local optimum can be improved.
where
3 Methodology and Model Structure
3.1 Hybrid Resampling Based on Silhouette Value
As mentioned earlier, the PNS method proposed in recent years implements hybrid sampling by replacing pseudo-negative samples with positive samples directly. It has the advantage of not changing the overall number of the imbalanced dataset used in this experiment, so introducing no new noisy samples and causing no information loss. However, it simply identifies pseudo-negative samples by calculating Euclidean distances between samples, lacking consideration of the overall distribution of the dataset. In addition, directly flipping the class label to obtain a new positive sample also lacks exploration of the classification borderline.
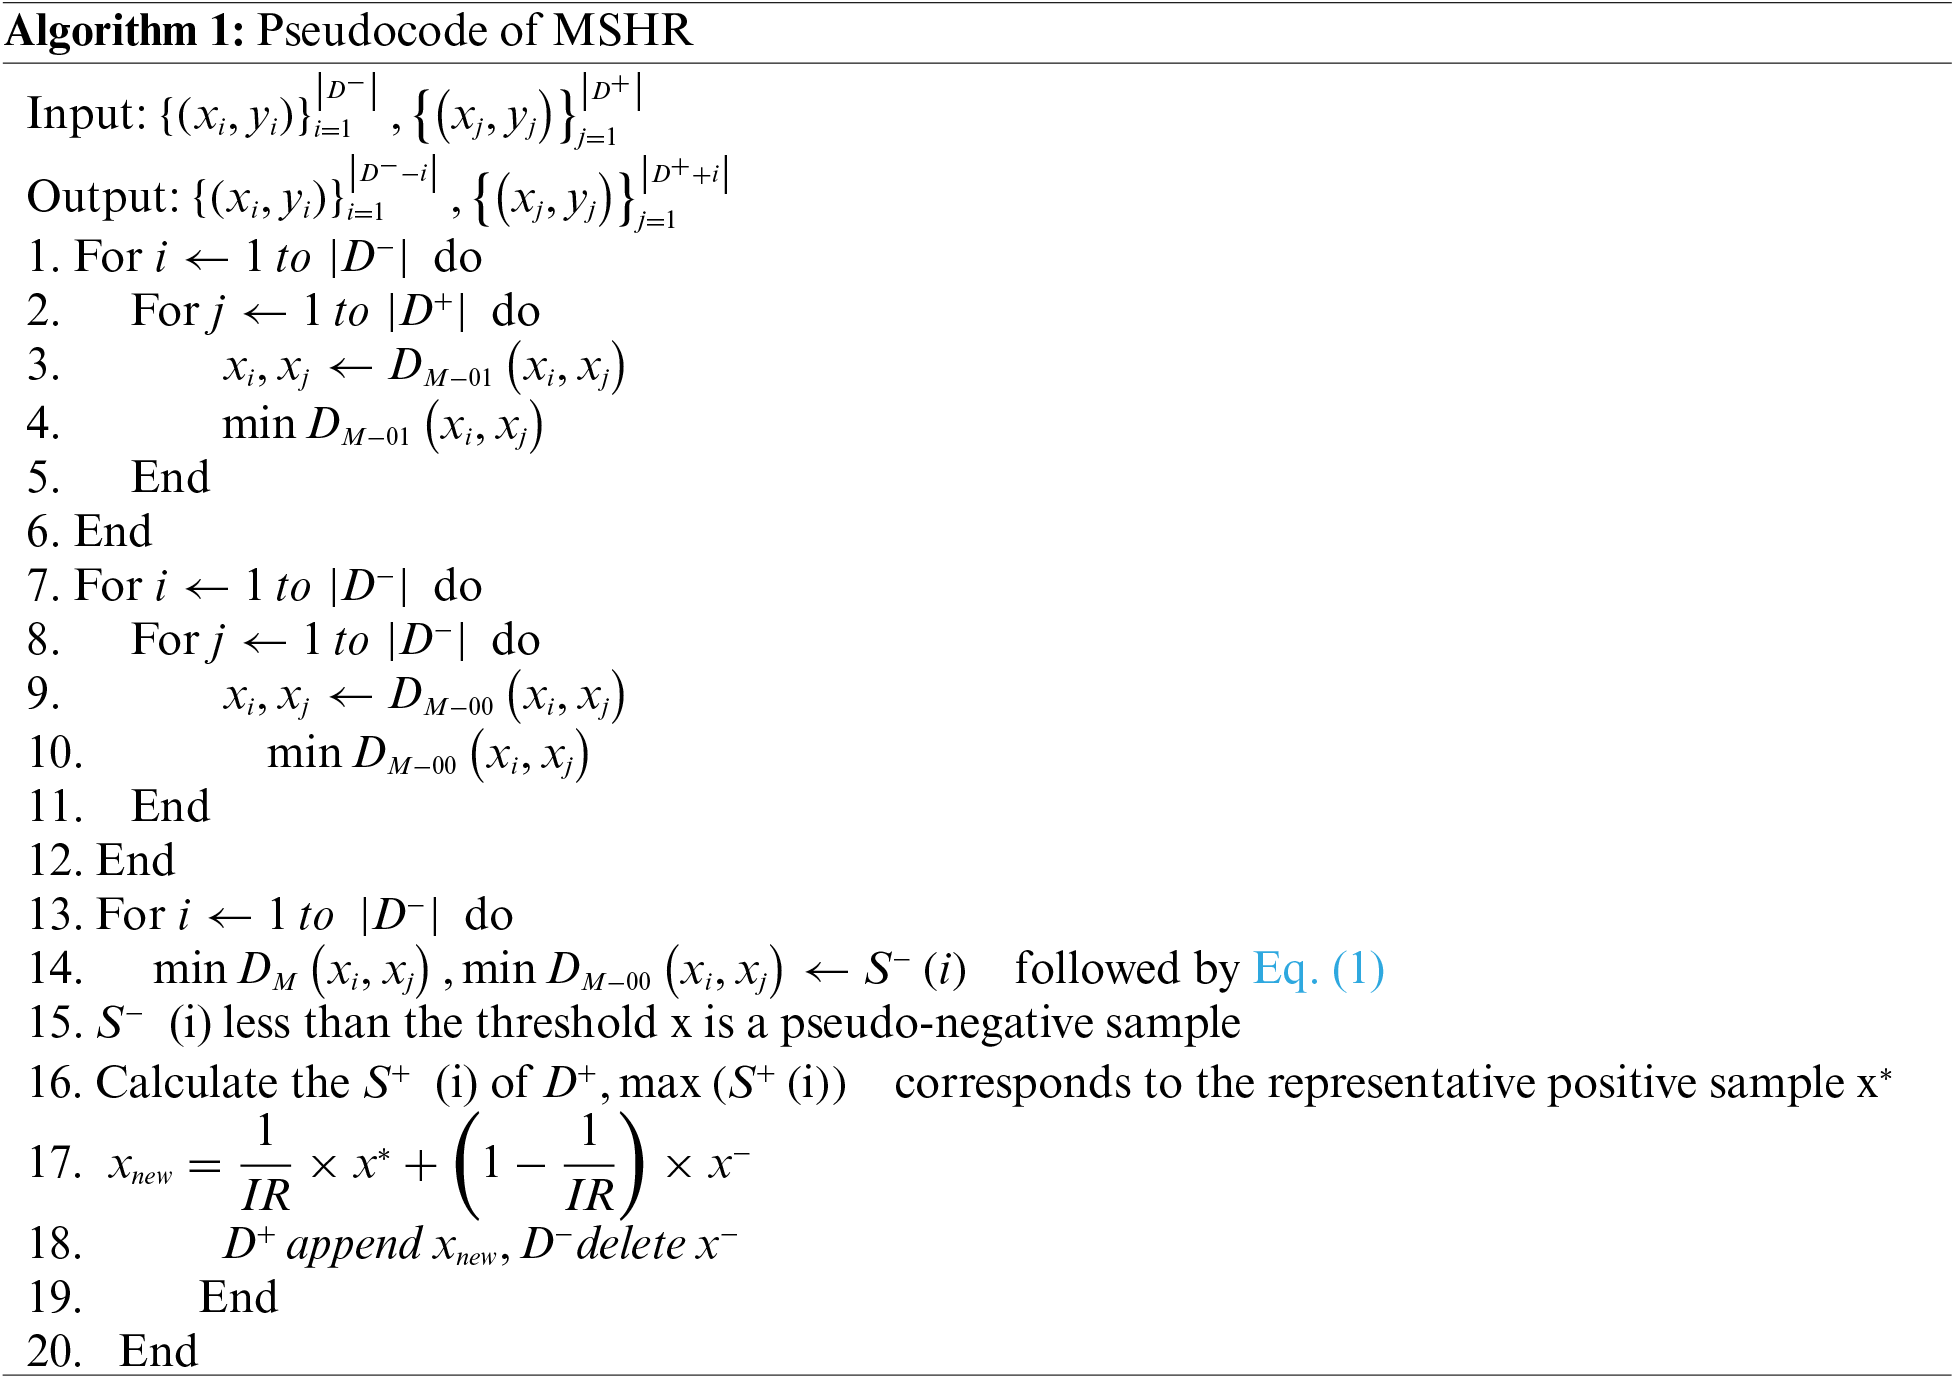
The MSHR proposed in this article has made two improvements to the PNS. One is to identify pseudo-negative samples by calculating the Silhouette value of each negative sample based on Mahalanobis distance. As mentioned earlier, the Mahalanobis distance incorporates the distribution information of samples, and the Silhouette value is essentially an accurate measure of the intra-class similarity and the inter-class difference. Therefore, it is more suitable for identifying the pseudo-negative samples, which are marked as negative but closer to positive. In addition, the RIME together with a validation dataset and SVM classifier are used to determine the threshold for identifying pseudo-negative samples more cautiously. The second is to linearly interpolate each pseudo-negative sample with the most representative positive sample, which has the maximum Silhouette value, to generate a new positive sample to replace the pseudo-negative sample. Where the reciprocal of the Imbalance Ratio (IR) of the dataset is used as the interpolation parameter to make the generated new positive sample retreat from the distribution range of the negative class to that of the positive class precisely. Therefore, the risk of inter-class overlap is reduced effectively.
The schematic diagram of the proposed hybrid sampling method is shown in Fig. 1, and the specific measurement depends on different datasets.

Figure 1: Example plot of MSHR
The MSHR algorithm process is shown in the pseudo-code (Algorithm 1: MSHR). In the pseudocode below,
3.2 Fine Cost-Sensitive SVM Method
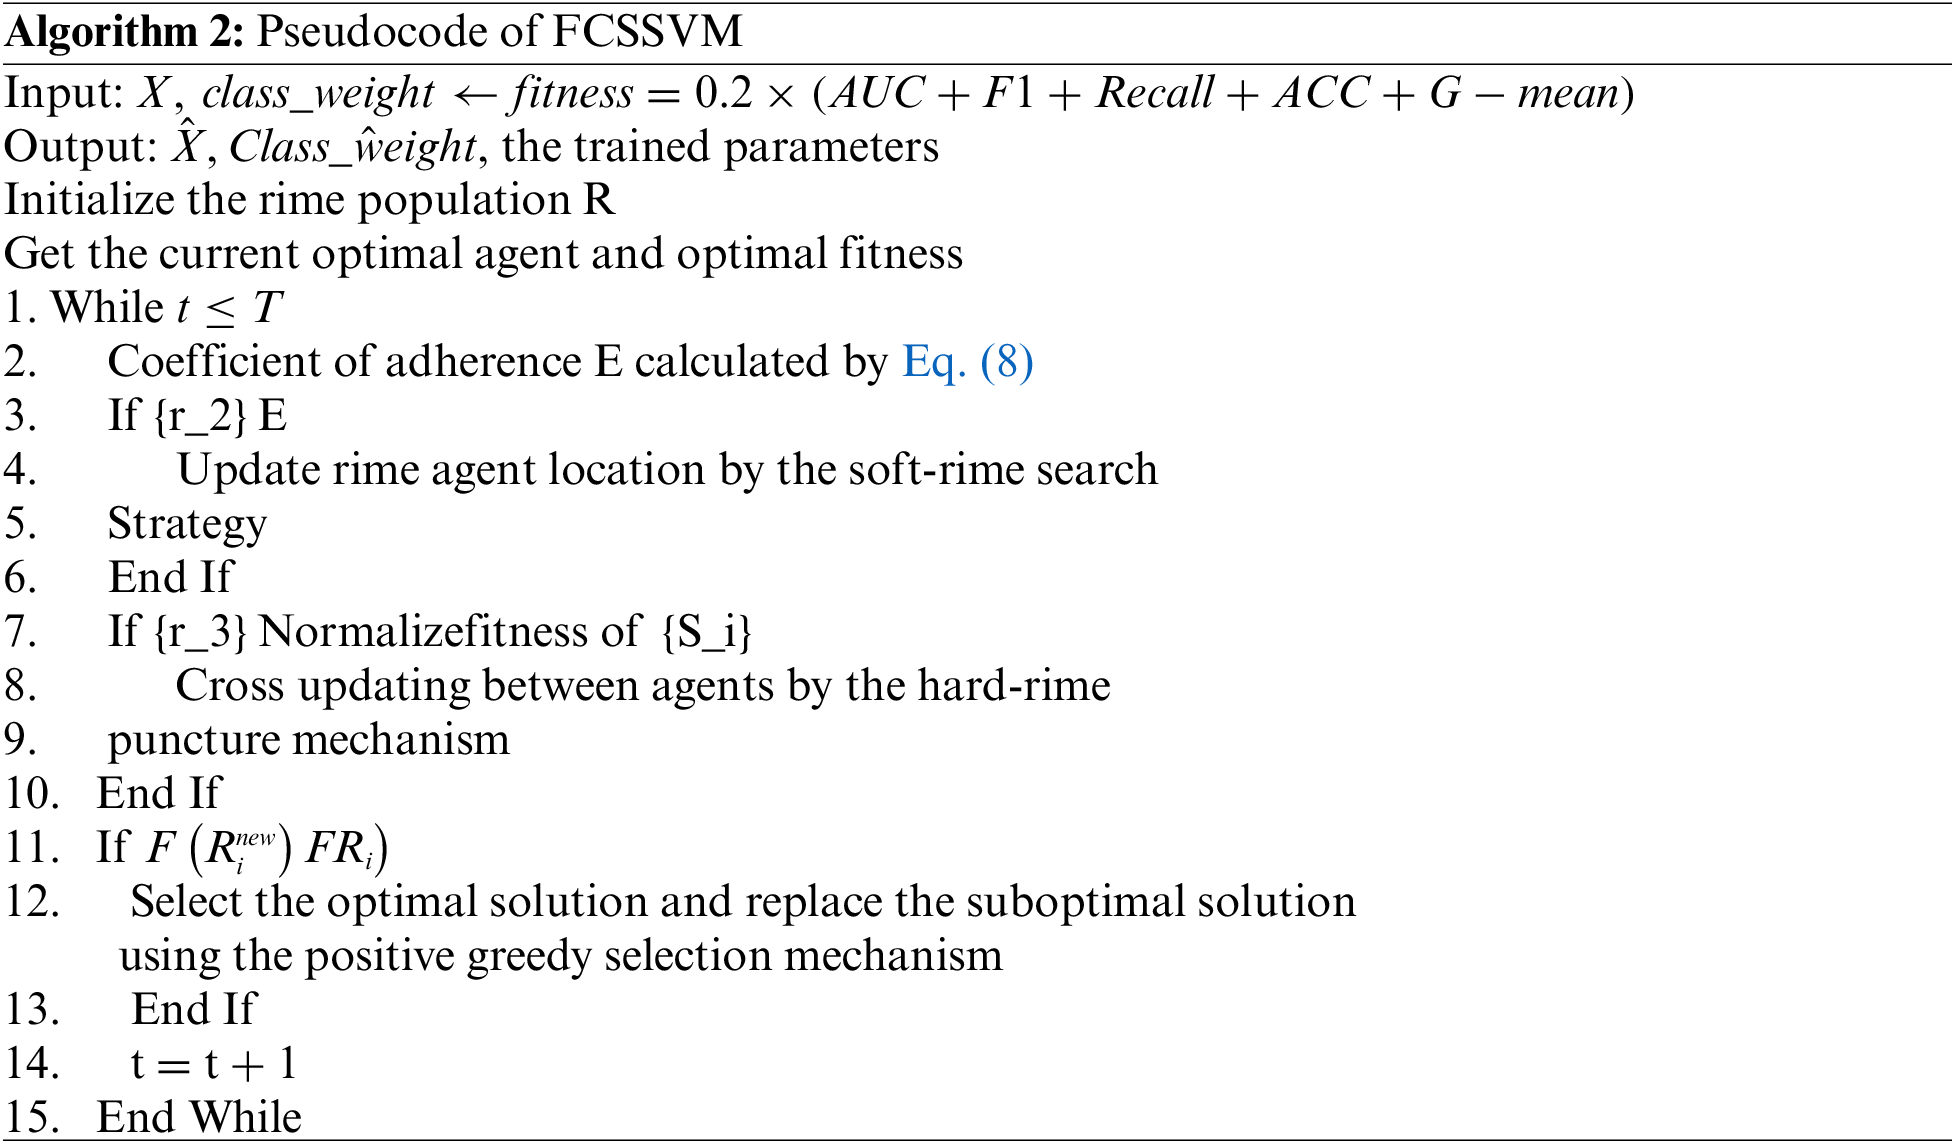
Unlike most of the existing cost-sensitive models and ensemble learning algorithms that solve imbalanced classification problems by simply determining cost weights based on IR, the FCSSVM applies the RIME algorithm to finely tune the class cost weights. The class cost weights are set to be particles, and the mean of five performance evaluation metrics (described in Section 3.2) obtained on a given validation dataset is set as the fitness function value. FCSSVM considers the impact of class distribution as well as data imbalance to achieve better overall performance. The specific algorithm process is shown in the pseudo-code (Algorithm 2: FCSSVM):
The structure of the proposed MSHR-FCSSVM is shown in Fig. 2.

Figure 2: The structure of MSHR-FCSSVM
4 Dataset and Evaluation Metrics
Eighteen datasets are selected from the UCI database (https://archive.ics.uci.edu/datasets) and the Keel database (https://sci2s.ugr.es/keel/datasets.php) and two datasets are synthesized for the experiment, eleven of which are mildly imbalanced, and the others are extremely imbalanced. According to Noorhalim et al. [37], a dataset with 1.9 < IR < 9 can be defined as mildly imbalanced, and a dataset with IR>=9 is extremely imbalanced. These datasets are described in detail in Table 1.

Six commonly used performance metrics for imbalanced data classification, namely Precision, accuracy (ACC), Recall, F1 score, the area under curve (AUC), and geometric mean of sensitivity (G-mean) [38] are introduced, which are given by the Eqs. (10) to (15). These metrics are calculated based on the confusion matrix shown in Table 2, where True Positive (TP) represents the number of actual positive samples predicted as positive, True Negative (TN) represents the number of actual negative samples predicted as negative, False Negative (FN) represents the number of actual positive samples predicted as negative, and False Positive (FP) represents the number of actual negative samples predicted as positive.

The ACC metric reflects the overall classification accuracy of the model; The Precision and Recall metrics respectively reflect the model’s ability to eliminate negative samples and recognize positive samples; The F1 score, G-mean, and AUC all reflect the comprehensive performance of the model in identifying positive and negative samples.
4.3 Experimental Confirmation and Results Discussion
4.3.1 Experimental Environment
The experiments are conducted on a computer with an i7-12700F CPU and 32 GB memory. The related software includes the Windows 11.0 OS, PyCharm 2020, the Python 3.8 library, and the Scikit-learn1.1.1 library. All the algorithms proposed in this article are implemented through programming with Python language.
4.3.2 Performance Experiment on the MSHR Method
To verify the effectiveness of the proposed MSHR method, it is applied to experiment on the given 20 imbalanced datasets. A standard SVM considering no cost sensitivity is used as the classifier here to ensure the result is only caused by the resampling method. To make the experimental results more reliable, the 5-fold cross-validation method is applied, and a quarter of the training data are used for running the RIME to set up the Silhouette value threshold X for finding out the pseudo-negative samples. Some resampling methods mentioned earlier, i.e., the SMOTE, the ADASYN, the RUS, the SMOTEENN, the SMOTifed-GAN, and the PNS are used for comparison. The experimental results are shown in Table 3.

As can be seen from Table 3, compared with the other methods, the MSHR takes an advantage in the overall performance. For three of the extremely imbalanced datasets (i.e., the ecoli, winequalityred3vs5, and winequalitywhite39vs5), and two of the mildly imbalanced datasets (i.e., the wine_red and pima), it gets the highest values on 4 of the 5 metrics.
Fig. 3 contrasts the sample numbers of the two classes in each dataset before and after being resampled by the MSHR. It can be seen that the number imbalance of each dataset is reduced, nonetheless, it is still far from being eliminated. It is because the MSHR is by nature to make the classification borderline cleaner by diminishing the pseudo-negative samples and generating new positive samples accordingly, but not to pursue merely an abstract balance on sample numbers.

Figure 3: Positive and negative sample numbers before and after using MSHR
To further study how the MSHR acts on an imbalanced dataset, a simulated imbalanced dataset (IR = 10) containing only 3 features is generated for visualization. Fig. 4a shows the raw dataset displayed in a 3D scatter chart. The positive samples and the negative samples overlapped on the borderline. Figs. 4b to 4hshow the results given by the MSHR and the other resampling methods.
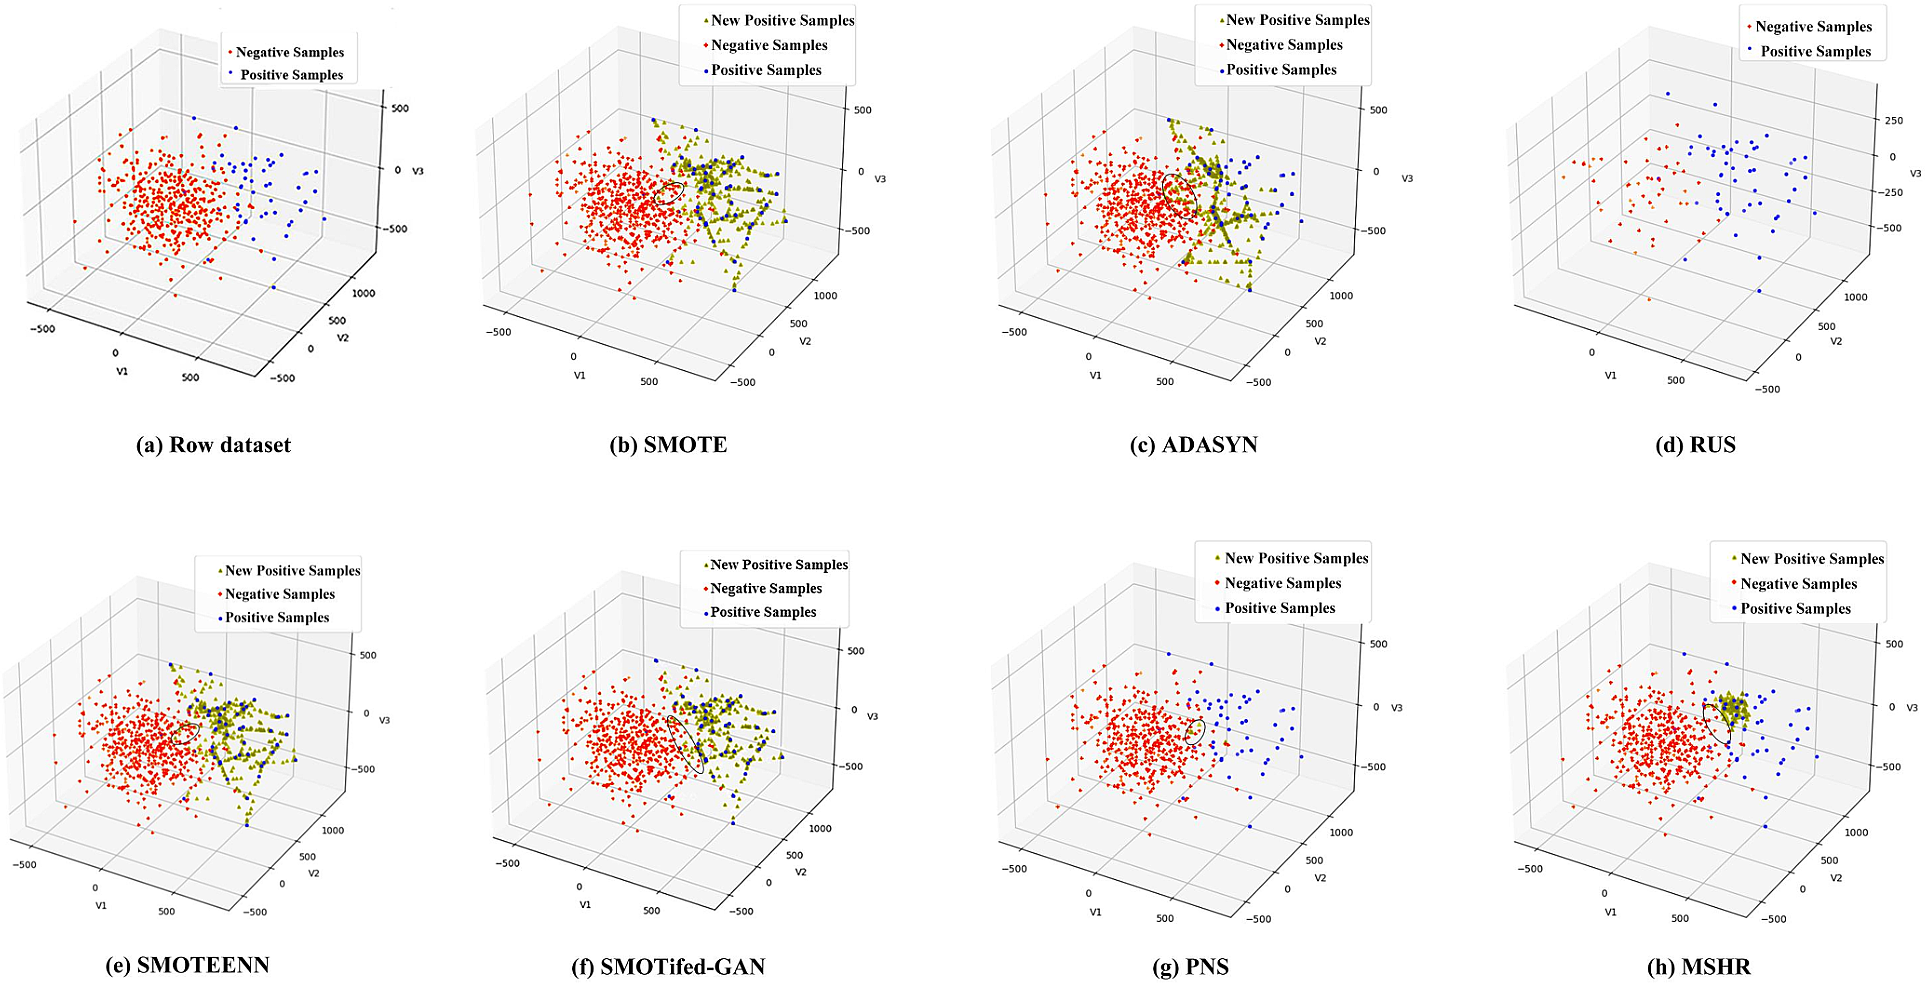
Figure 4: Results given by the MSHR and the other resampling methods
The SMOTE method leads to a more serious inter-class overlap for it does not discriminate between samples inside and outside the overlap area when choosing core samples to generate new samples. The ADASYN method generates new samples only based on the positive samples nearing the borderline and lacks the consideration of the overall distribution of the positive class, so it intensifies inter-class overlap, too. The RUS method effectively reduces negative samples but loses important samples in favor of constructing classification boundaries for its way of randomly choosing negative samples to delete. The SMOTEENN method relieves inter-class overlap to some extent through cleaning of samples being regarded as noise, but it is still not well for lacking consideration of the overall distribution of the dataset. The SMOTifed-GAN is limited by the quality of the samples generated by SMOTE and the training of the GAN model, therefore, it is greatly affected by the characteristics of the sample distribution, it has the same problem as SMOTE. The PNS method generates very few positive samples for it identifies pseudo-negative samples based on spatial Euclidean distance and may cease to be effective as the clustering centers of positive and negative samples are far apart. Additionally, the new samples generated by it are still trapped in the overlapping area for they are simply replacements of the pseudo-negative samples. In contrast, the MSHR can effectively screen out the pseudo-negative samples based on the Silhouette value calculated by Mahalanobis distance and generates new positive samples more agreed with the distribution of the positive class through linear interpolation, so making the borderline cleaner and is more in favor of classification. We conducted runtime statistics on MSHR with other resampling methods, and the results are shown in Table 4.
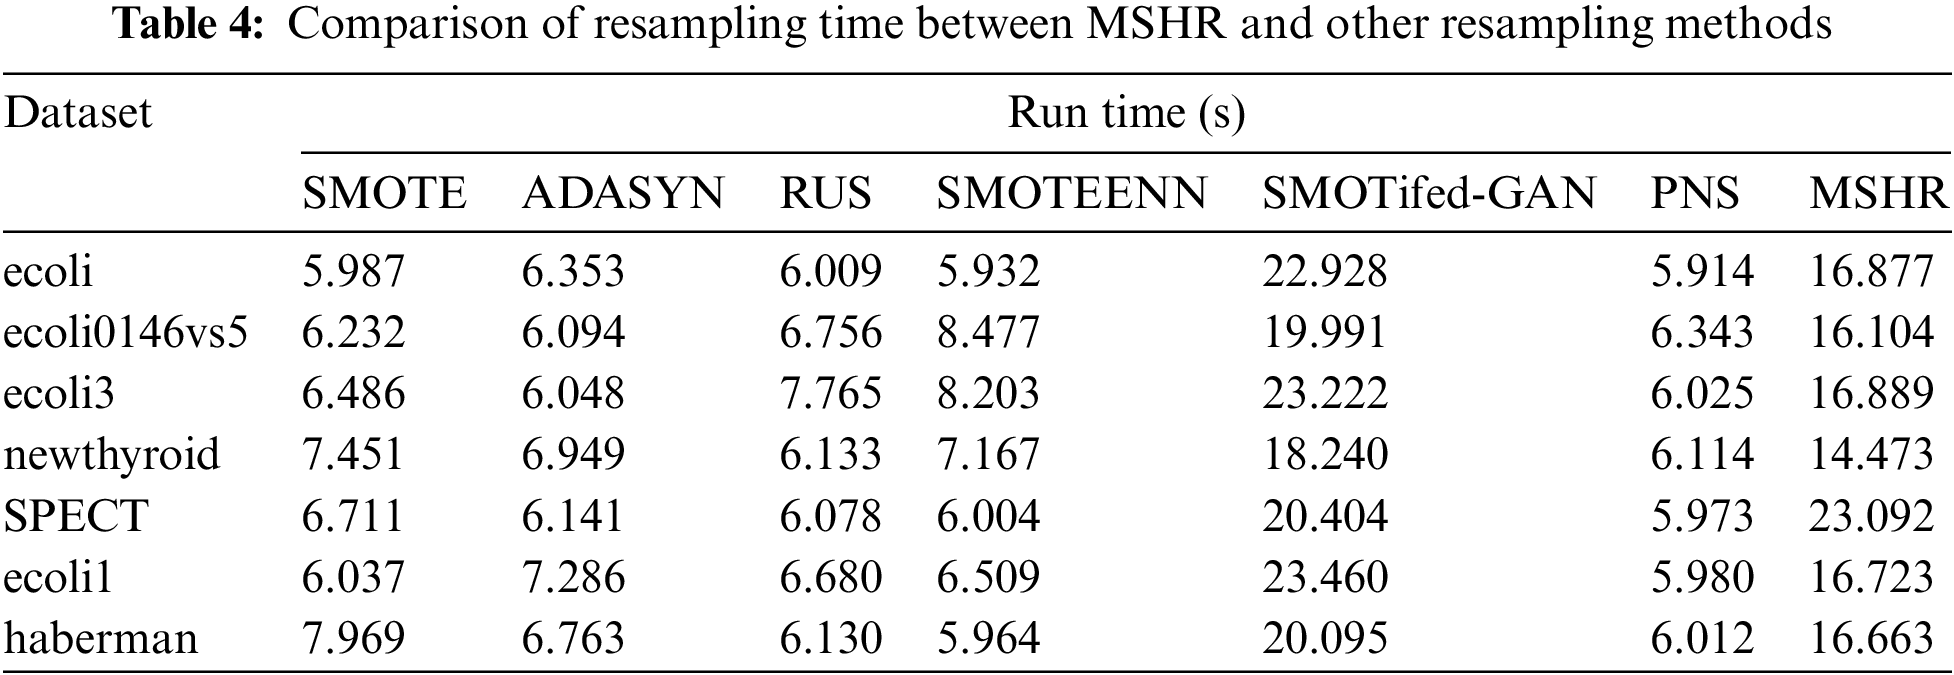
As can be seen from Table 4, compared with traditional resampling methods, MSHR has a longer runtime due to the optimization process. However, the training requirements of the GAN network result in its time consumption being longer than MSHR. According to the literature review, there are still many studies that have introduced intelligent optimization algorithms in the process of resampling. A method named Ant Colony Optimization Resampling (ACOR) was proposed in [39], and a genetic optimization resampling method was proposed in [40]. They all significantly improved the performance of imbalanced classification through parameter optimization at the cost of efficiency. Therefore, though our method has no advantages on account of time efficiency, given its better overall performance, it still can be regarded as valuable for classification applications that do not lay too much stress on efficiency.
4.3.3 Performance Experiment on the MSHR-FCSSVM
To verify the effectiveness of the proposed MSHR-FCSSVM method, comparative experiments were conducted with some other methods. In which, the Ada-cost, the Easy-Ensemble, and the XG-Boost are both ensemble learning methods reported to be effective, the CS-SVM is a commonly used cost-sensitive SVM whose class cost weights are set directly according to IR. In addition, the LR and the BPNN are introduced into our model framework to replace SVM for comparison, i.e., the MSHR-FCSLR and the MSHR-RCSBPNN. Five runs of the 5-fold cross-validation method are used to ensure the reliability of the experiment, and the average results for each dataset are shown in Table 5.
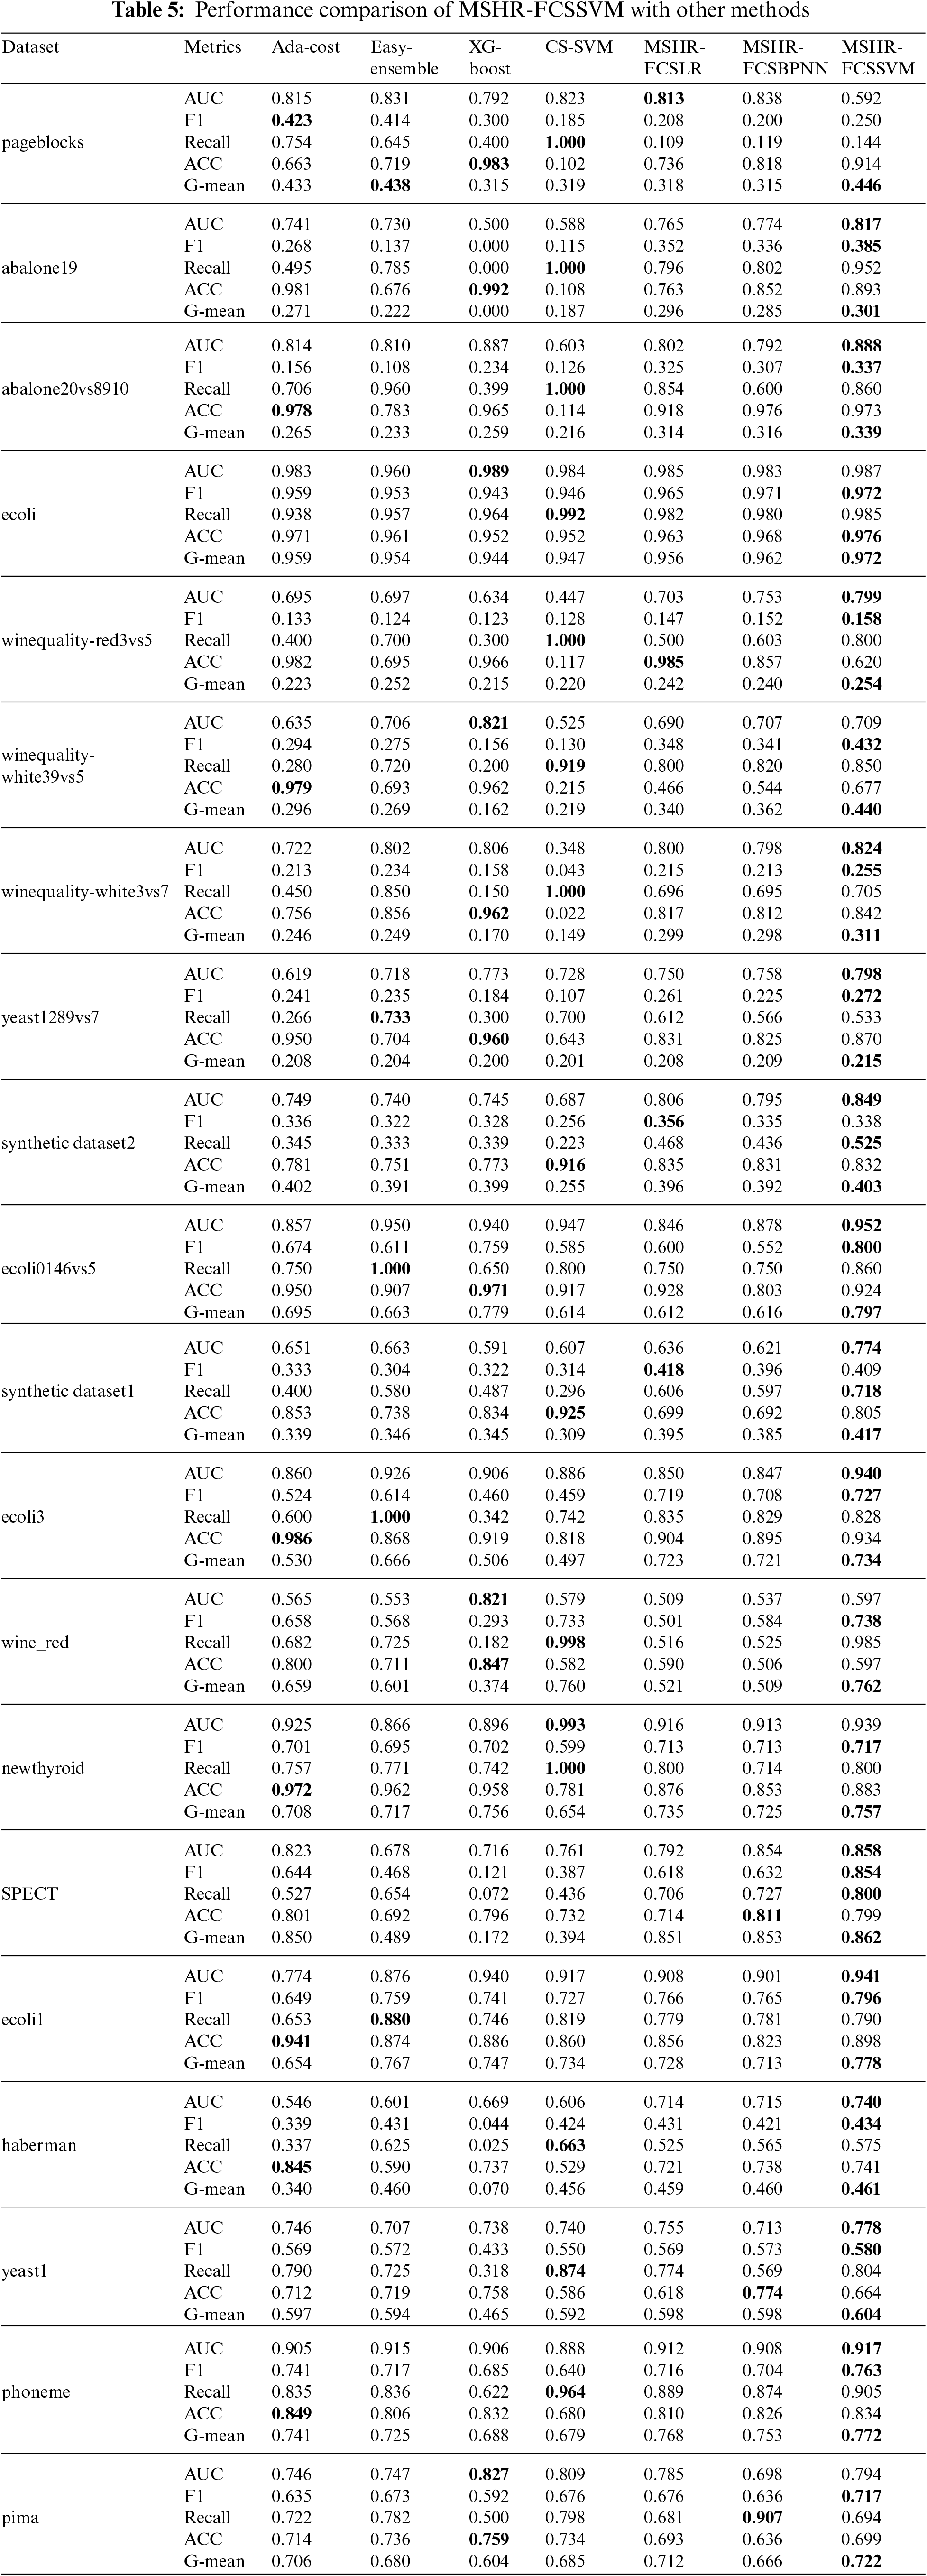
As can be seen from Table 5, the proposed MSHR-FCSSVM performs best from the look on the whole. It outperforms the others on two metrics in 4 datasets, on three metrics in 14 datasets, and on four metrics in 1 dataset. The Ada-cost, the Easy Ensemble, the XG-Boost, and the CS-SVM behave better on a certain metric of some datasets. The Ada-cost method updates the cost value of misclassified samples in each round of training based on the previous round of testing results. More negative samples have a chance to be increased cost values than the positive ones, leading the Acc metric to improve steadily. The Easy Ensemble method simply splits the negative samples into multiple subsets of equal size as that of the positive class to achieve balance in sample number, which may result in loss of distribution information of the data, so behave worst and only win on a metric for 5 datasets. The XG-Boost method sets class weight parameters according to the IR directly, so it improves the performance of the positive class to some extent but it may come at the cost of significant performance reduction of the negative class. The CS-SVM gets very high Recall values on most of the datasets. This is because it excessively enlarges the class weight of the positive class based on the IR, which makes the positive samples classified finely but impairs the accuracy of negative samples meanwhile, so they do not perform well on the comprehensive metrics. The MSHR-FCSLR is a maximum likelihood estimation algorithm that is easy to implement but often has poor classification performance when the feature space is large. A typical example includes SPECT. The MSHR-FCSBPNN is a local search optimization algorithm that is prone to getting stuck in local optima, and the network parameters are greatly affected by the characteristics of the samples.
Two reasons can be given for the advantage of our method. The first is the contribution of the MSHR on resampling datasets, and the second is that the FCSSVM seeks a fine cost-weight balance between the two classes to achieve good comprehensive performance.
4.3.4 Comparison of the RIME Algorithm and the Particle Swarm Optimization (PSO)
Taking the pageblocks dataset with the highest IR as an example, the optimization performances of the RIME and the PSO on the cost weights of the FCSSVM were explored. The (a) and (b) of Fig. 5 show the change processes of the fitness value, respectively, which is set as the arithmetic mean of the introduced five metric values given by the optimized FCSSVM on the validation dataset, and 50 iterations were recorded. To make the comparison fair, these two algorithms are all run 5 times.
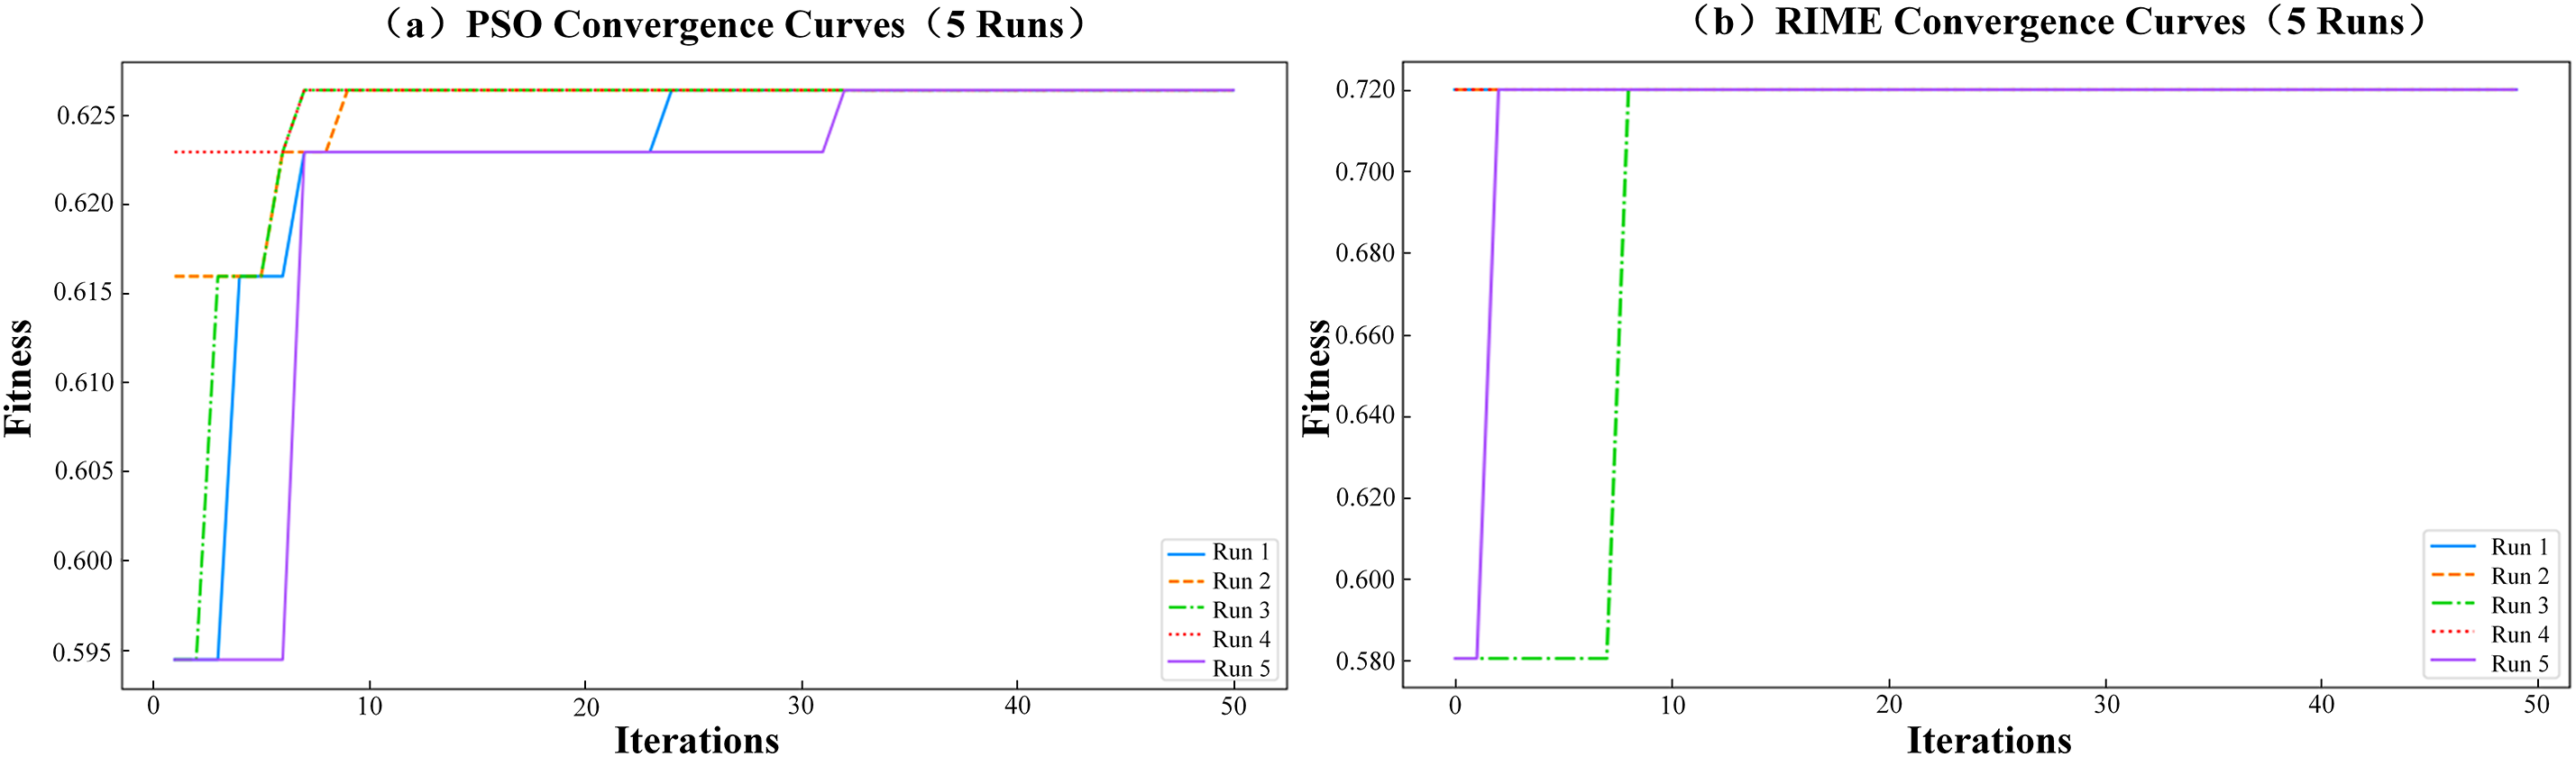
Figure 5: Comparison of the optimization process of RIME and PSO
Five runs of the RIME all achieved a higher fitness value (0.723) in no more than 10 iterations, while those of the PSO only got 0.627. In addition, the RIME only takes 48.17 s for 50 iterations as the PSO takes 192.34 s. That means the RIME takes an advantage over the PSO on both optimization results and efficiency.
This article proposes an imbalanced data classification method consisting of a new hybrid resampling method MSHR and a fine cost-sensitive SVM FCSSVM. Among them, the MSHR measures sample separability based on the sample Silhouette value calculated by Mahalanobis distance to identify pseudo-negative samples, and based on which to generate new positive samples (over-sampling), and finally removes the pseudo-negative samples (under-sampling). The MSHR not only alleviates the imbalance in the sample number of the two classes, but also to some extent suppresses the inter-class overlapping, making class boundaries cleaner, and thus improving classification performance. The FCSSVM is different from traditional cost-sensitive models which only consider sample number imbalance and directly obtain cost weights based on the IR value. It also considers the impact of class distribution on classification performance by finely optimizing the cost weight parameters based on a fitness value reflecting the validation accuracy, so it can improve the classification performance further. The experimental results show that the proposed method can achieve better classification performance on both mildly and extremely imbalanced datasets, and the application of the RIME optimization algorithm also plays an important role in it. Our future work will focus on how to better optimize the threshold of sample Silhouette value for discriminating pseudo-negative samples and the cost weight values of classifiers, especially improvement of the optimization efficiency.
Acknowledgement: We thank the editors and all anonymous reviewers for their helpful comments. In addition, we thank our friends for their contributions to this article.
Funding Statement: This study was financially supported by the Yunnan Major Scientific and Technological Projects (Grant No. 202302AD080001) and the National Natural Science Foundation, China (No. 52065033).
Author Contributions: The authors confirm contribution to the article as follows: Study conception and design: Bo Zhu, Xiaona Jing; data collection: Xiaona Jing, Lan Qiu; analysis and interpretation of results: Bo Zhu, Xiaona Jing; draft manuscript preparation: Xiaona Jing, Runbo Li. All authors reviewed the results and approved the final version of the manuscript.
Availability of Data and Materials: Readers can access the UCI database (https://archive.ics.uci.edu/datasets) and the Keel database (https://sci2s.ugr.es/keel/datasets.php) used in the article.
Conflicts of Interest: The authors declare that they have no conflicts of interest to report regarding the present study.
References
1. A. Somasundaram and S. Reddy, “Parallel and incremental credit card fraud detection model to handle concept drift and data imbalance,” Neural Comput. Appl., vol. 31, no. 1, pp. 3–14, Jan. 2019. doi: 10.1007/s00521-018-3633-8. [Google Scholar] [CrossRef]
2. M. Amini, J. Rezaeenour, and E. Hadavandi, “A cluster-based data balancing ensemble classifier for response modeling in bank direct marketing,” Int. J. Comput. Intell., vol. 14, no. 4, pp. 1550022, Dec. 2015. doi: 10.1142/S1469026815500224. [Google Scholar] [CrossRef]
3. M. Rezaei, H. Yang, and C. Meinel, “Recurrent generative adversarial network for learning imbalanced medical image semantic segmentation,” Multimed., vol. 79, no. 79, pp. 1–20, Feb. 2019. doi: 10.1007/s11042-019-7305-1. [Google Scholar] [CrossRef]
4. C. Huang et al., “Sample imbalance disease classification model based on association rule feature selection,” Pattern Recognit. Lett., vol. 133, no. 16, pp. 280–286, May 2020. doi: 10.1016/j.patrec.2020.03.016. [Google Scholar] [CrossRef]
5. H. Du, Z. Lin, and Z. Yan, “Network intrusion detection based on selective ensemble learning,” presented at the 2019 Int. Conf. Netw. Netw. Appl. (NaNA), Daegu, Korea (SouthOct. 10–13, 2019. doi: 10.1109/NaNA.2019.00038. [Google Scholar] [CrossRef]
6. S. S. Ranjan and B. B. Gupta, “Classification of spammer and nonspammer content in online social network using genetic algorithm-based feature selection,” Enterp. Inf. Syst., vol. 14, no. 5, pp. 710–736, May 2020. doi: 10.1080/17517575.2020.1712742. [Google Scholar] [CrossRef]
7. L. Taehyung, L. K. Bum, and K. C. Ouk, “Performance of machine learning algorithms for class-imbalanced process fault detection problems,” IEEE Trans. Semicond. Manuf., vol. 29, no. 4, pp. 436–445, Nov. 2016. doi: 10.1109/tsm.2016.2602226. [Google Scholar] [CrossRef]
8. R. Ferreira, J. Barroso, and V. Filipe, “Conformity assessment of informative labels in car engine compartment with deep learning models,” J. Phys.: Conf. Ser., vol. 2278, pp. 012033, Feb. 25, 2022. doi: 10.1088/1742-6596/2278/1/012033. [Google Scholar] [CrossRef]
9. A. Mahadevan and M. Arock, “A class imbalance-aware review rating prediction using hybrid sampling and ensemble learning,” Multimed., vol. 80, no. 5, pp. 1–28, Oct. 2020. doi: 10.1007/s11042-020-10024-2. [Google Scholar] [CrossRef]
10. N. V. Chawla, K. W. Bowyer, L. O. Hall, and W. P. Kegelmeyer, “SMOTE: Synthetic minority over-sampling technique,” J. Artif. Intell. Res., vol. 16, pp. 321–357, Jan. 2002. doi: 10.1613/jair.953. [Google Scholar] [CrossRef]
11. H. Han, W. Y. Wang, and B. H. Mao, “Borderline-SMOTE: A new over-sampling method in imbalanced data sets learning,” presented at the 2005 ICIC, Hefei, China, Aug. 23–26, 2005. doi: 10.1007/11538059_91. [Google Scholar] [CrossRef]
12. H. He, Y. Bai, E. A. Garcia, and L. Shutao, “ADASYN: Adaptive synthetic sampling approach for imbalanced learning,” in 2008 IEEE Int. Joint Conf. Neural Netw. (IEEE World Cong. Comput. Intell.), Hong Kong, China, Jun. 1–6, 2008, pp. 1322–1328. [Google Scholar]
13. G. Goel, L. Maguire, Y. Li, and S. McLoone, “Evaluation of sampling methods for learning from imbalanced data,” presented at the 9th ICIC, Nanning, China, Jul. 28–31, 2013. [Google Scholar]
14. A. Agrawal, H. L. Viktor, and E. Paquet, “SCUT: Multi-class imbalanced data classification using SMOTE and cluster-based undersampling,” presented at the 2015 7th Int. Joint Conf. Knowl. Discov., Knowl. Eng. Knowl. Manage. (IC3K), Lisbon, Portugal, Nov. 12–14, 2015. [Google Scholar]
15. G. E. Batista, A. L. C. Bazzan, and M. C. Monard, “Balancing training data for automated annotation of keywords: A case study,” Wob, vol. 3, pp. 10–18, 2003. [Google Scholar]
16. A. Sharma, P. K. Singh, and R. Chandra, “SMOTified-GAN for class imbalanced pattern classification problems,” IEEE Access, vol. 10, pp. 30655–30665, Mar. 2022. doi: 10.1109/ACCESS.2022.3158977. [Google Scholar] [CrossRef]
17. G. L. Alberto et al., “A sampling method of imbalanced data based on sample space,” (in ChineseActa Autom. Sinica, vol. 48, no. 10, pp. 2549–2563, Feb. 2023. [Google Scholar]
18. J. Wan, M. Yang, and Y. Chen, “Cost sensitive semi-supervised Laplacian support vector machine,” Acta Electonica Sinica, vol. 40, no. 7, pp. 1410, Jul. 2012. doi: 10.3969/j.issn.0372-2112.2012.07.020. [Google Scholar] [CrossRef]
19. A. Iranmehr, H. Masnadi-Shirazi, and N. Vasconcelos, “Cost-sensitive support vector machines,” Neurocomput., vol. 343, pp. 50–64, May 2019. doi: 10.1016/j.neucom.2018.11.099. [Google Scholar] [CrossRef]
20. T. Chen and C. Guestrin, “XGBoost: A scalable tree boosting system,” in Proc. 22nd Acm Sigkdd Int. Conf. Knowl. Discov. Data Min., San Francisco, California, USA, Aug. 13–17, 2016. doi: 10.1145/2939672.2939785. [Google Scholar] [CrossRef]
21. X. Tao et al., “Self-adaptive cost weights-based support vector machine cost-sensitive ensemble for imbalanced data classification,” Inf. Sci., vol. 487, pp. 31–56, Jun. 2019. doi: 10.1016/j.ins.2019.02.062. [Google Scholar] [CrossRef]
22. Z. Y. Wu, W. F. Lin, and Y. Ji, “An integrated ensemble learning model for imbalanced fault diagnostics and prognostics,” IEEE Access, vol. 6, pp. 8394–8402, Jan. 2018. doi: 10.1109/ACCESS.2018.2807121. [Google Scholar] [CrossRef]
23. H. Liu, “Spam web detection based on hybrid-sampling and genetic algorithm,” (in ChineseJ. Beijing Univ. Posts Telecommun., vol. 42, no. 6, pp. 111–117, Jun. 2020. [Google Scholar]
24. A. Khattak, P. W. Chan, F. Chen, H. R. Peng, and C. M. Matara, “Missed approach, a safety-critical go-around procedure in aviation: Prediction based on machine learning-ensemble imbalance learning,” Adv. Meteorol., vol. 2023, pp. 1–24, Jul. 2023. doi: 10.1155/2023/9119521. [Google Scholar] [CrossRef]
25. Z. X. Zhao, G. L. Wang, and X. D. Li, “An improved SVM based under-sampling method for classifying imbalanced data,” (in ChineseZhongshan Daxue Xuebao/Acta Scientiarum Natralium Universitatis Sunyatseni, vol. 51, no. 6, pp. 10–16, Feb. 2012. [Google Scholar]
26. H. Hussein, S. Anwar, and M. Ahmad, “Imbalanced data classification using SVM based on improved simulated annealing featuring synthetic data generation and reduction,” Comput. Mater. Contin., vol. 75, no. 1, pp. 547–564, Feb. 2023. doi: 10.32604/CMC.2023.036025. [Google Scholar] [CrossRef]
27. P. J. Rousseeuw, “Silhouettes: A graphical aid to the interpretation and validation of cluster analysis,” J. Comput. Appl. Math., vol. 20, pp. 53–65, 1987. doi: 10.1016/0377-0427(87)90125-7. [Google Scholar] [CrossRef]
28. P. C. Mahalanobis, “On the generalized distance in statistics,” in Proc. Nat. Inst. Sci., Apr. 1936, vol. 2, no. 1, pp. 49–55. [Google Scholar]
29. C. C. Chen, Y. H. Lin, J. M. Yih, and S. Y. Juan, “Construct concept structure for linear algebra based on cognition diagnosis and clustering with mahalanobis distances,” Adv. Mat. Res., vol. 1220, no. 211–212, pp. 756–760, Apr. 2011. doi: 10.4028/www.scientific.net/AMR.211-212.756. [Google Scholar] [CrossRef]
30. Y. Wang, Q. Miao, T. Duan, K. L. Tsui, and M. G. Pecht, “Online anomaly detection for hard disk drives based on mahalanobis distance,” IEEETR, vol. 62, no. 1, pp. 136–145, Jan. 2013. doi: 10.1109/TR.2013.2241204. [Google Scholar] [CrossRef]
31. X. J. Peng and D. Xu, “Twin mahalanobis distance-based support vector machines for pattern recognition,” Inf. Sci., vol. 200, no. 10–12, pp. 22–37, Jun. 2012. doi: 10.1016/j.ins.2012.02.047. [Google Scholar] [CrossRef]
32. L. Yao and T. B. Lin, “Evolutionary mahalanobis distance-based oversampling for multi-class imbalanced data classification,” Sens., vol. 21, no. 19, pp. 6616, Feb. 2022. doi: 10.3390/s21196616. [Google Scholar] [PubMed] [CrossRef]
33. N. G. Siddappa and T. Kampalappa, “Imbalance data classification using local mahalanobis distance learning based on nearest neighbor,” SN Comput. Sci., vol. 1, no. 9, pp. 168–183, Mar. 2020. doi: 10.1007/s42979-020-0085-x. [Google Scholar] [CrossRef]
34. N. Liu, J. Shen, M. Xu, D. Gan, Q. E. Shi and B. Gao, “Improved cost-sensitive support vector machine classifier for breast cancer diagnosis,” Math. Probl., vol. 2018, pp. 1–13, Dec. 2018. doi: 10.1155/2018/3518959. [Google Scholar] [CrossRef]
35. F. Xia, Y. W. Yang, L. Zhou, F. X. Li, M. Cai and D. D. Zeng, “A closed-form reduction of multi-class cost-sensitive learning to weighted multi-class learning,” Pattern Recognit., vol. 42, no. 7, pp. 1572–1581, Jun. 2008. doi: 10.1016/j.patcog.2008.12.011. [Google Scholar] [CrossRef]
36. H. Su et al., “RIME: A physics-based optimization,” Neurocomput., vol. 532, pp. 183–214, Mar. 2023. doi: 10.1016/j.neucom.2023.02.010. [Google Scholar] [CrossRef]
37. N. Noorhalim, A. Ali, and S. M. Shamsuddin, “Handling imbalanced ratio for class imbalance problem using SMOTE,” presented at the Proc. Third Int. Conf. Comput., Math. Stat. (iCMS2017), Langkawi, Malaysia, Nov. 2017. doi: 10.1007/978-981-13-7279-7_3. [Google Scholar] [CrossRef]
38. C. Wang, Y. F. Liu, X. C. Wang, and G. R. Yan, “Appraisal identification of classifier’s performance,” (in ChineseElectron. Design Eng., vol. 19, no. 8, pp. 13–15, Aug. 2011. doi: 10.3969/j.issn.1674-6236.2011.08.004. [Google Scholar] [CrossRef]
39. M. Li, A. Xiong, L. Wang, S. B. Deng, and J. Ye, “ACO resampling: Enhancing the performance of oversampling methods for class imbalance classification,” Knowl.-Based Syst., vol. 196, pp. 105818, May 2020. doi: 10.1016/j.knosys.2020.105818. [Google Scholar] [CrossRef]
40. N. Zhou, L. Lau, R. Bai, and T. Moore, “A genetic optimization resampling based particle filtering algorithm for indoor target tracking,” Remote Sens., vol. 13, no. 1, pp. 132, Jan. 2021. doi: 10.3390/rs13010132. [Google Scholar] [CrossRef]
Cite This Article
 Copyright © 2024 The Author(s). Published by Tech Science Press.
This work is licensed under a Creative Commons Attribution 4.0 International License , which permits unrestricted use, distribution, and reproduction in any medium, provided the original work is properly cited.
 Downloads
 Citation Tools