
 Submit a Paper
 Propose a Special lssue
 Open Access
ARTICLE
Hybrid Gene Selection Methods for High-Dimensional Lung Cancer Data Using Improved Arithmetic Optimization Algorithm
Department of Management Information Systems, College of Applied Studies and Community Service, Imam Abdulrahman Bin Faisal University, Dammam, Saudi Arabia
* Corresponding Author: Mutasem K. Alsmadi. Email:
(This article belongs to the Special Issue: Advanced Artificial Intelligence and Machine Learning Frameworks for Signal and Image Processing Applications)
Computers, Materials & Continua 2024, 79(3), 5175-5200. https://doi.org/10.32604/cmc.2024.044065
Received 20 July 2023; Accepted 24 October 2023; Issue published 20 June 2024
 View Full Text
 Download PDF
Abstract
Lung cancer is among the most frequent cancers in the world, with over one million deaths per year. Classification is required for lung cancer diagnosis and therapy to be effective, accurate, and reliable. Gene expression microarrays have made it possible to find genetic biomarkers for cancer diagnosis and prediction in a high-throughput manner. Machine Learning (ML) has been widely used to diagnose and classify lung cancer where the performance of ML methods is evaluated to identify the appropriate technique. Identifying and selecting the gene expression patterns can help in lung cancer diagnoses and classification. Normally, microarrays include several genes and may cause confusion or false prediction. Therefore, the Arithmetic Optimization Algorithm (AOA) is used to identify the optimal gene subset to reduce the number of selected genes. Which can allow the classifiers to yield the best performance for lung cancer classification. In addition, we proposed a modified version of AOA which can work effectively on the high dimensional dataset. In the modified AOA, the features are ranked by their weights and are used to initialize the AOA population. The exploitation process of AOA is then enhanced by developing a local search algorithm based on two neighborhood strategies. Finally, the efficiency of the proposed methods was evaluated on gene expression datasets related to Lung cancer using stratified 4-fold cross-validation. The method’s efficacy in selecting the optimal gene subset is underscored by its ability to maintain feature proportions between 10% to 25%. Moreover, the approach significantly enhances lung cancer prediction accuracy. For instance, Lung_Harvard1 achieved an accuracy of 97.5%, Lung_Harvard2 and Lung_Michigan datasets both achieved 100%, Lung_Adenocarcinoma obtained an accuracy of 88.2%, and Lung_Ontario achieved an accuracy of 87.5%. In conclusion, the results indicate the potential promise of the proposed modified AOA approach in classifying microarray cancer data.Keywords
Classification is one of the most active areas of ML [1]. It entails training a predictive model using a collection of samples containing a target output, such that, after training, the model could predict the output for data that has not yet been seen. The field of biomedicine has recently become quite prominent in ML due to the vast quantity of data that can be derived from genetic tissue [2–4]. Specifically, the rise of microarray datasets has led to the establishment of an active research area in the domains of bioinformatics and ML.
Lung cancer detection has seen significant advancements in recent years, thanks to the integration of machine learning and deep learning techniques. Recent meta-heuristic algorithms and methodologies have played a pivotal role in improving the accuracy and efficiency of image segmentation including the CT scans of lung cancer detection models. These algorithms include Hunger Games Search (HGS) [5], Slime Mould Algorithm (SMA) [6], Moth Search Algorithm (MSA) [7], Grey Wolf Optimization (GWO) [8], Runge Kutta Method (RUN) [9], Monarch Butterfly Optimization (MBO) [10], Weighted Mean of Vectors (INFO) [11], and Harris Hawks Optimization (HHO) [12]. By incorporating these innovative approaches, researchers have significantly enhanced the performance of machine learning and deep learning models in classification of lung cancer, ultimately contributing to more accurate diagnoses and better patient outcomes. This integration of cutting-edge techniques has brought about a paradigm shift in the field of lung cancer detection [13–18].
Lung cancer is among the most prevalent cancers in the world, causing over one million deaths each year. Cancer is the greatest cause of death globally, with 10 million deaths in 2020, the most prevalent in 2020 (new cancer cases) being the lung (2.21 million cases). Lung cancer (1.80 million deaths) was the leading cause of death for cancer patients in 2020 [19–21].
Successful cancer diagnosis and therapy depend on accurate and reliable classification. Therefore, attention has increased due to advancements in cancer classification [22]. Lung cancer classification depends on clinicopathological characteristics. Gene expression microarrays have provided a high-throughput platform for identifying genomic biomarkers for cancer diagnosis and prognosis [23,24].
The microarray data utilized by the classification algorithms may be shown as a matrix composed of samples (rows) and features (columns) that describe the microarray data. Classification algorithms need a sufficient number of samples since a limited number of samples might result in overfitting and decreased generalizability. For lung cancer classification, microarray data is considered structured data, described by the fact that it contains very few samples (often less than a hundred) yet comprises a large number of features (often numbering in the thousands). Dealing with such many features with few samples presents a machine learning research challenge, primarily due to the chances of “false positives” being elevated in feature-rich microarray data (during the construction of the predictive model or the gene selection process) [25]. Feature selection is an important and essential technique used in data filtering to improve machine learning models in large databases and for dimensionality reduction, where important features are chosen and unnecessary and redundant features are rejected [26]. A decrease in input dimensionality may boost performance by reducing either the learning speed and complexity of the model or increasing the generalization capacity and precision of the classification. Selecting suitable characteristics may also lower measurement costs and enhance comprehension of the problem.
The work presented by [27] showed that only a part of this significant number of genes or features present on the microarray is important for solving certain classification problems. Feature selection is required in this situation for two reasons. It removes extraneous and redundant functions and helps experts identify key associations between specific diseases and gene expression. Fig. 1 is an illustration of a common feature selection method used on microarray data.
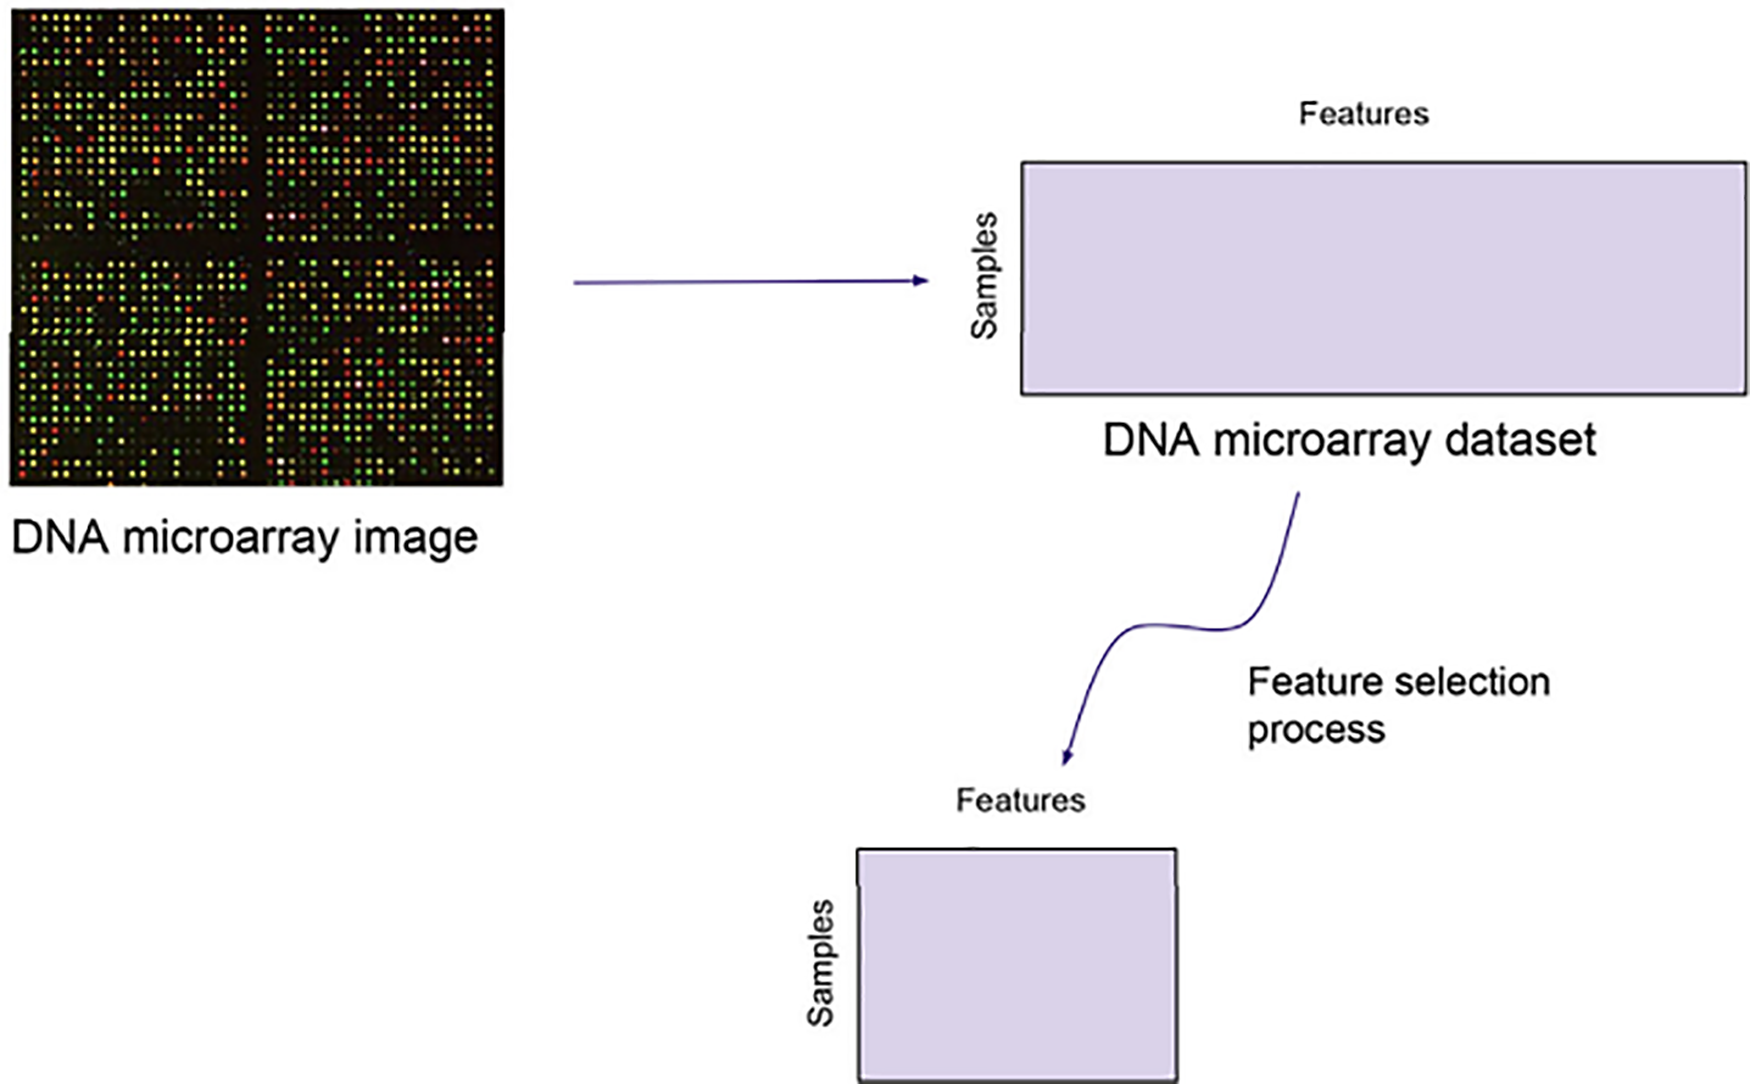
Figure 1: A typical feature selection process applied to microarray data. Reprinted with permission from [27]. Copyright © 2024 Elsevier Ltd.
Different feature selection models were developed in the literature, each using a feature score measure to extract feature subsets from the same databases [27]. Training classification models with all their high-dimensional features can lead to serious performance and scalability issues [28–30]. Selecting features that form a subset of the original features is useful where interpretability and knowledge retrieval are important, like in medicine, although this sometimes results in some loss of precision. Our approach focuses on feature selection since it is focused on medical issues. Feature selection techniques may use individual scoring (also recognized as feature ranking) or feature subset assessment, depending on the outcome. In the first case, the attributes are evaluated individually with a weight that exhibits their relevance. In the latter case, the subsets of candidate traits are assessed using some measures to choose the best trait.
Feature selection approaches are categorized into filters, embedded approaches, and wrappers based on their correlation to the learning approach [26,31]. Filters are not dependent on learning methods since they concentrate on the fundamental properties of the data. They are not computationally expensive and have strong generalization capability due to their independence from the induction technique. To choose features, wrappers and embedded methods need a learning technique. An induction approach assesses feature candidate subsets for wrappers. Although interacting with the classifier makes it more computationally complex than filters, this strategy frequently produces better results. Because the search for the ideal feature subset is done during classifier training, embedded approaches, which fall between filters and wrappers, are computationally more effective than wrappers [27]. There is also a trend to blend algorithms, as with hybrid approaches, which often integrate two or more selection algorithms of characteristics with a distinct conceptual background. A common example is to first use a less calculated filter to delete certain functions, then use a mathematically expensive wrapper for fine nailing.
In hybrid methods based on filters and optimization methods, the dataset is filtered, and the optimization algorithm iteratively chooses a subset of gene features from the chosen subset until optimum classification accuracy is achieved. Such different algorithms are the brainstorming optimization algorithm [31], Particle Swarm Optimization (PSO) [32], Whale Optimization [33], Genetic Algorithm (GA) [34], and Moth Flam Optimization [35]. AOA was recently suggested by [30] and uses arithmetic operators, including multiplication and division, for exploring the search space and addition and subtraction operators for exploiting the search space, to discover the best solution for a given problem. In summary, the gene selection method based on AOA and the feature importance ranking method is proposed for the gene selection problem to work effectively on the high-dimensional dataset. Our goal is to decrease the number of genes and improve classification accuracy based on microarray datasets related to lung cancer. The contributions of this paper can be summarized as follows:
• A novel gene selection method combining AOA and feature importance ranking for high-dimensional datasets is introduced.
• A modified AOA (MAOA) is presented to effectively navigate high-dimensional feature spaces, addressing the exponential complexity associated with dimensionality.
• MAOA incorporates an innovative initialization process and a local search strategy, improving the exploitation process of AOA and enhancing classification accuracy.
• Novel neighborhood strategies are proposed to enhance the effectiveness of feature subset selection, further extending the adaptability and efficiency of the proposed approach
The structure of the paper is as follows: Section 2 offers a detailed literature review. Section 3 covers the methods and materials, including a discussion of AOA and MAO. Section 4 delves into the results and facilitates a comprehensive discussion. In Section 5, conclusion and future works are given.
Lung cancer is a type of cancer that begins in the cells of the lungs. It is one of the most common and deadliest forms of cancer worldwide [36]. The incidence and mortality rates vary by region, with higher rates typically seen in developed countries and regions with a higher prevalence of smoking. Besides smoking, other risk factors include exposure to secondhand smoke, occupational exposure to carcinogens like asbestos and radon gas, air pollution, and a family history of lung cancer. In addition, genetic and molecular studies have revealed various mutations and alterations associated with the development of lung cancer.
According to Planchard et al. [37], symptoms of lung cancer can vary and may include persistent coughing up blood, shortness of breath, chest pain, hoarseness, weight loss, and recurrent respiratory infections. Diagnosing typically involves a combination of imaging tests such as X-rays, CT scans, and PET scans, along with a tissue biopsy to determine the type and stage of the cancer. Staging helps determine the extent of the cancer’s spread and guides treatment decisions. Treatment approaches depend on the type, stage, and overall health of the patient, including surgery, radiation therapy, chemotherapy, targeted therapy, immunotherapy, and palliative care. Newer treatment options, such as immunotherapy and targeted therapy, have shown promise for improving outcomes for some patients [38]. The prognosis varies widely depending on the stage of diagnosis, the type of lung cancer, and the patient’s overall health. Early-stage lung cancers that are localized have a better prognosis compared to advanced-stage cancers that have spread to other parts of the body.
There are several job selection methods described in the literature [31,39]. Community optimization problems, feature selection, and intelligent optimization algorithms were suggested as efficient solutions to the feature selection problem [40]. The authors in [40] proposed a GA-assisted feature selection approach, including the ability to define subsets of features for recognition, to solve problems in computer-aided diagnosis of learned tumors (in dermatology). The process improves classification performance.
A multitude of optimization methods has been developed over the years. These methods can be broadly categorized into different classes, including mathematical optimization, heuristic and metaheuristic methods, evolutionary algorithms, and more. Some widely recognized optimization techniques include linear programming, genetic algorithms, simulated annealing, particle swarm optimization, and many others. Each of these methods possesses its unique characteristics, advantages, and applications. For example, the study of Yu et al. [41] presented a hybrid model called bERIME_FKNN, which combines the enhanced rime algorithm (ERIME) and fuzzy K-Nearest Neighbor (FKNN) technique. The model uses a triangular game search strategy and a random follower search strategy to enhance global exploration. Compared to 11 state-of-the-art algorithms, the bERIME_FKNN model achieved an accuracy and specificity of over 99% in PH classification. This makes it a valuable computer-aided tool for diagnosing and evaluating pulmonary hypertension, preventing disease progression and reducing complications.
A GA was also used in [23] where a GA is integrated with the closet neighbor technique to distinguish seeds through computer vision. The ‘invalid nearest neighbor’ approach determined that the number be increased as the correct classification percent. The best findings were found at generation 400 with an initialization probability of 0.1, resulting in a misclassification of 3.00% between four types of seeds. Zhang et al. [42] represented a binary “feature selection algorithm based on barebones particle swarm optimization” that was effectively used to address feature selection issues. The quantitative findings exhibit that the suggested approach attains the best mean classification accuracy for seven of the eight data sets utilized in the assessment. Yang et al. [43] suggested a method to characterize selection with MA (“Memetic Algorithms”).
Yang et al. [43] stated that their suggested strategy can produce high grading accuracy with a limited number of characteristics and is superior to PSO and GA approaches in accuracy, especially for large problems. The given experimental findings demonstrate that this approach allows for greater search efficiency and can produce excellent classification accuracy while minimizing the number of features. Kabir et al. [44] represented a novel hybrid ant colony optimization algorithm for trait selection (ACOFS). It is argued that this method not only strikes an efficient balance between the exploitation and exploration of ants in research but also enhances the global research capabilities of optimizing ant colonies in realizing high-quality solutions to trait selection problems. The findings noted in the experimental tests demonstrate that ACOFS offers the notable capability to create subsets of smaller sizes of relevant features while providing substantial classification accuracy. Huang et al. [45] also addressed the feature selection problem with a nature-inspired solution. The suggested method uses a novel hybrid method based on PSO-SVM (“Particle Swarm Optimization and Support Vector Machines”) with feature selection as well as parameter optimization to address feature “subset selection” with kernel parameter tuning.
To reduce the computation time, a data mining system is used, which is implemented through a distributed design employing web services technology. The experimental findings demonstrate the suggested method’s ability to choose discriminating input characteristics accurately while obtaining high classification accuracy. Wang et al. [46] presented a new ACO (“Ant Colony Optimization”) approach to enable feature selection based on coarse sentences and PSO to categorize hand motion SEMG (“Surface Electromyography”) signals. The experimental findings imply that the recommended strategy may attain high classification levels in the SEMG motion classification job when compared to PCA (“Principal Component Analysis”).
An enhanced approach to IBPSO (“Binary Particle Swarm Optimization”) is suggested in [47] to execute trait selection, a KNN (“K-Nearest Neighbor”) that acts as an IBPSO evaluator for classification problems with data of gene expression. The experimental findings demonstrate that the approach efficiently simplified the selection of genes (traits) and decreased the total number of traits (genes) needed. Relevant research has shown that nature-inspired systems provide an efficient foundation upon which feature selection can be attained. In this study, we used our new extended SFLA [ISFLA] to select high-dimensional data of biomedical characteristics using a method that was inspired by nature.
Although optimization algorithms have been utilized in the feature selection process as filter or wrapper methods in the cancer classification task, it is still being investigated in recent studies. Furthermore, there is still a need to conduct more research to investigate different hybrid approaches and combinations of filter methods with optimization algorithms on different cancer datasets.
Several feature selection and machine learning methods were recently used on genetic datasets. For instance, Ali et al. [48] presented a hybrid filter-genetic feature selection approach to address high-dimensional microarray datasets. Elemam et al. [49] presented a highly discriminative hybrid feature selection algorithm for cancer diagnosis. In addition, Almazrua et al. [50] and Vahmiyan et al. [51] provided comprehensive reviews of feature selection and machine learning methods applied to cancer datasets, including lung cancer.
Accordingly, presented challenges or limitations in hybrid gene selection methods for high-dimensional lung cancer are the computational cost and complexity of hybrid methods; data imbalance and standardization; and of course, parameter tuning and overfitting control. However, related works discussed the concerns about some challenges of hybrid approaches when dealing with lung cancer, mainly handling (1) heterogeneity; (2) small sample size; and (3) noisy imbalanced data. To overcome these challenges, it is required to deeply understand lung cancer through gene selection methods. Hence, researchers need to customize hybrid approaches to specific characteristics of lung cancer data, and a comprehensive experimentation and clinical validation to validate the obtained results. Hybrid approaches must address the three main challenges.
Therefore, this study proposes a hybrid gene selection method with an arithmetic optimization algorithm (AOA). The AOA helps identify the optimal gene subset to reduce the number of selected genes. Which can allow the classifiers to yield the best performance for lung cancer classification. In this study, the AOA is chosen due to several advantages, which are presented in different related state-of-the-art applications and implementations, such as: (1) it can efficiently handle high-dimensional data using an exploration mechanism; (2) using an exploitation mechanism, it can identify the most relevant set of genes to class labels; and (3) it has few parameters to tune with a simple structure. Thus, the use of AOA will perform an effective feature selection that reduces the model’s overfitting and speeds up training.
3.1 Lung Cancer Microarray Dataset
In the current article, the lung cancer gene expression microarray dataset was chosen for the current study, We examined the known and publicly accessible microarray dataset, and Table 1 shows the data information used in this article.

The details of each dataset are as follows:
Lung_Adenocarcinoma: One is a pre-processed dataset of 7129 genes that includes 86 patients with primary lung adenocarcinoma, 62 of whom were still alive and 24 of whom had passed away [23,39].
Lung_Michigan: Ten non-neoplastic lung samples are also included along with 86 primary lung adenocarcinoma samples. 7129 genes characterize each sample [40].
Lung_Harvard1: A total of 203 snap-frozen lung cancers and healthy lungs were examined. The 203 specimens consist of 139 lung adenocarcinoma samples (labeled as ADEN), 17 samples of normal lung tissue (labeled as NORMAL), 6 small-cell lung carcinoma samples (labeled as SCLC), 20 pulmonary carcinoids samples (labeled as COID), and 21 squamous cell lung carcinoma samples (labeled as SQUA). 12600 genes are used to characterize each sample [23].
Lung_Harvard2: MPM (“Malignant Pleural Mesothelioma”) and lung ADCA (“Adenocarcinoma”) are separated into several categories. There are 181 samples of tissues (150 ADCA and 31 MPM). 32 of them, including 16 ADCA & and 16 MPM, are in the training set. For testing, the remaining 149 samples were utilized. 12533 genes are used to characterize each sample [52].
Lung_Ontario: Data on gene expression from 39 different NSCLC samples’ tumor samples. 24 of the patients in these samples showed distant metastasis (labeled as “relapse”) or local relapses of their tumor. According to radiological and clinical testing (labeled as “non-relapse”), the remaining 15 individuals are disease-free. 2880 genes are used to characterize the processed data [53].
Fig. 2 presents the class distribution of the previously explained, which clearly shows an imbalance in the data and the difference in varieties.
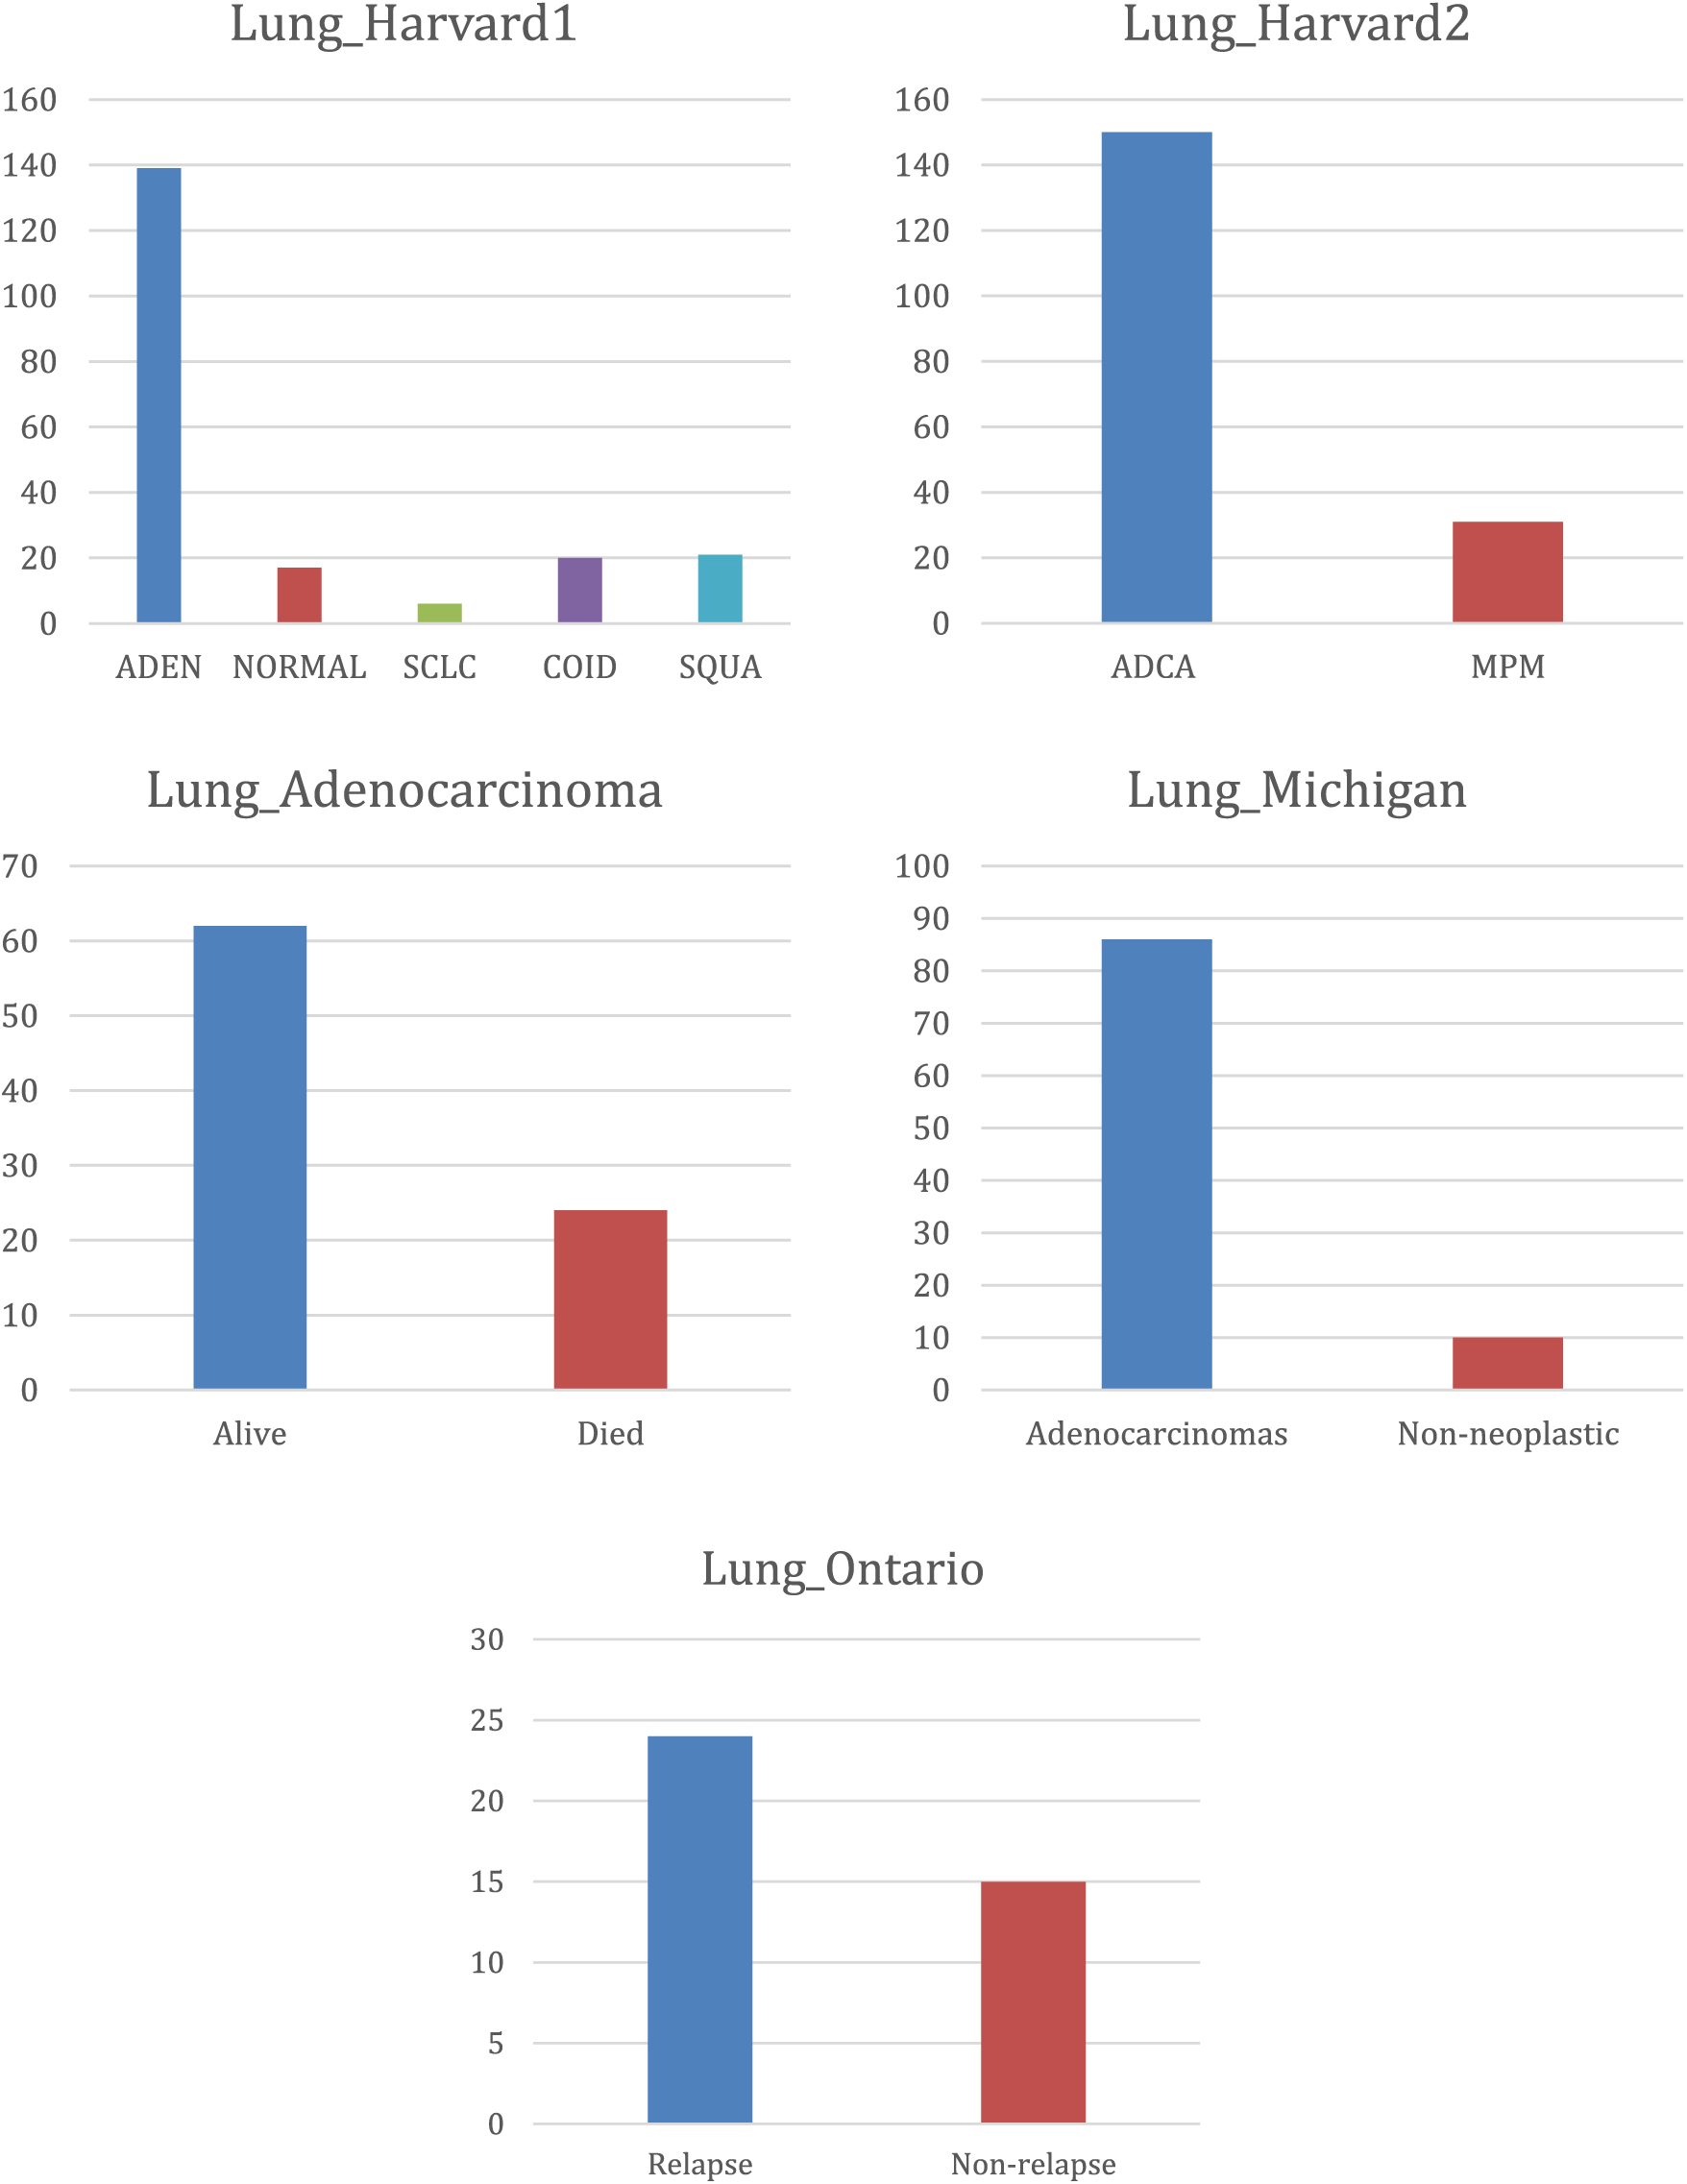
Figure 2: Class distribution for lung cancer datasets
Class distribution imbalance is a common issue in lung cancer datasets, impacting classification model performance. Medical datasets, including lung cancer data, often suffer from skewed class distributions where the number of instances belonging to different classes is significantly imbalanced. To address this issue, it is required to apply specialized techniques such as resampling, where the dataset is adjusted to balance class proportions. Methods like oversampling the minority class, undersampling the majority class, and synthetic data generation using, e.g., AOA can help balance the class distribution. Thus, it enhances the model’s ability to learn from both classes and improve its predictive accuracy.
3.2 Arithmetic Optimization Algorithm (AOA)
It is a newly proposed population-based algorithm, AOA utilizes the Arithmetic operators (Addition, Subtraction, Division, and Multiplication) for searching in search space to discover the best solution for a specific issue. One of the main advantages of AOA is the simplicity and considering both diversification (exploration) and intensification (exploitation) of the population [30].
AOA begins the search process with a random initial population with a specific number of solutions (population size). In the feature selection problem, the solution is represented as a vector of “binary values” (0 or 1) with length dataset diminution (total number of features in the dataset), where 0 denotes the not selected feature and 1 for the selected feature. Then the algorithm starts improving those solutions until the specified number of iterations is obtained. The improvement process contains two primary phases: The exploration phase aims to study the search space and determine the promising search regions, and the exploitation phase aims to deeply search in the explored search regions for the optimal solution. AOA determines whether to explore or exploit the search space by using the accelerated function, which is denoted as (AF); see Eq. (1) [30].
where AFCiter indicates the accelerated function calculated for the current iteration (Crnt_Iter), and Max_Iter signifies the total number of iterations, min and max are parameters to determine the value of AF that increased linearly from min to max to perform exploration and exploitation. where if a random number between 0 and 1 is greater than AF, then the exploration phase will be performed; otherwise, the exploitation phase will be performed. Algorithm 1 presents the AOA pseudo-code [30].
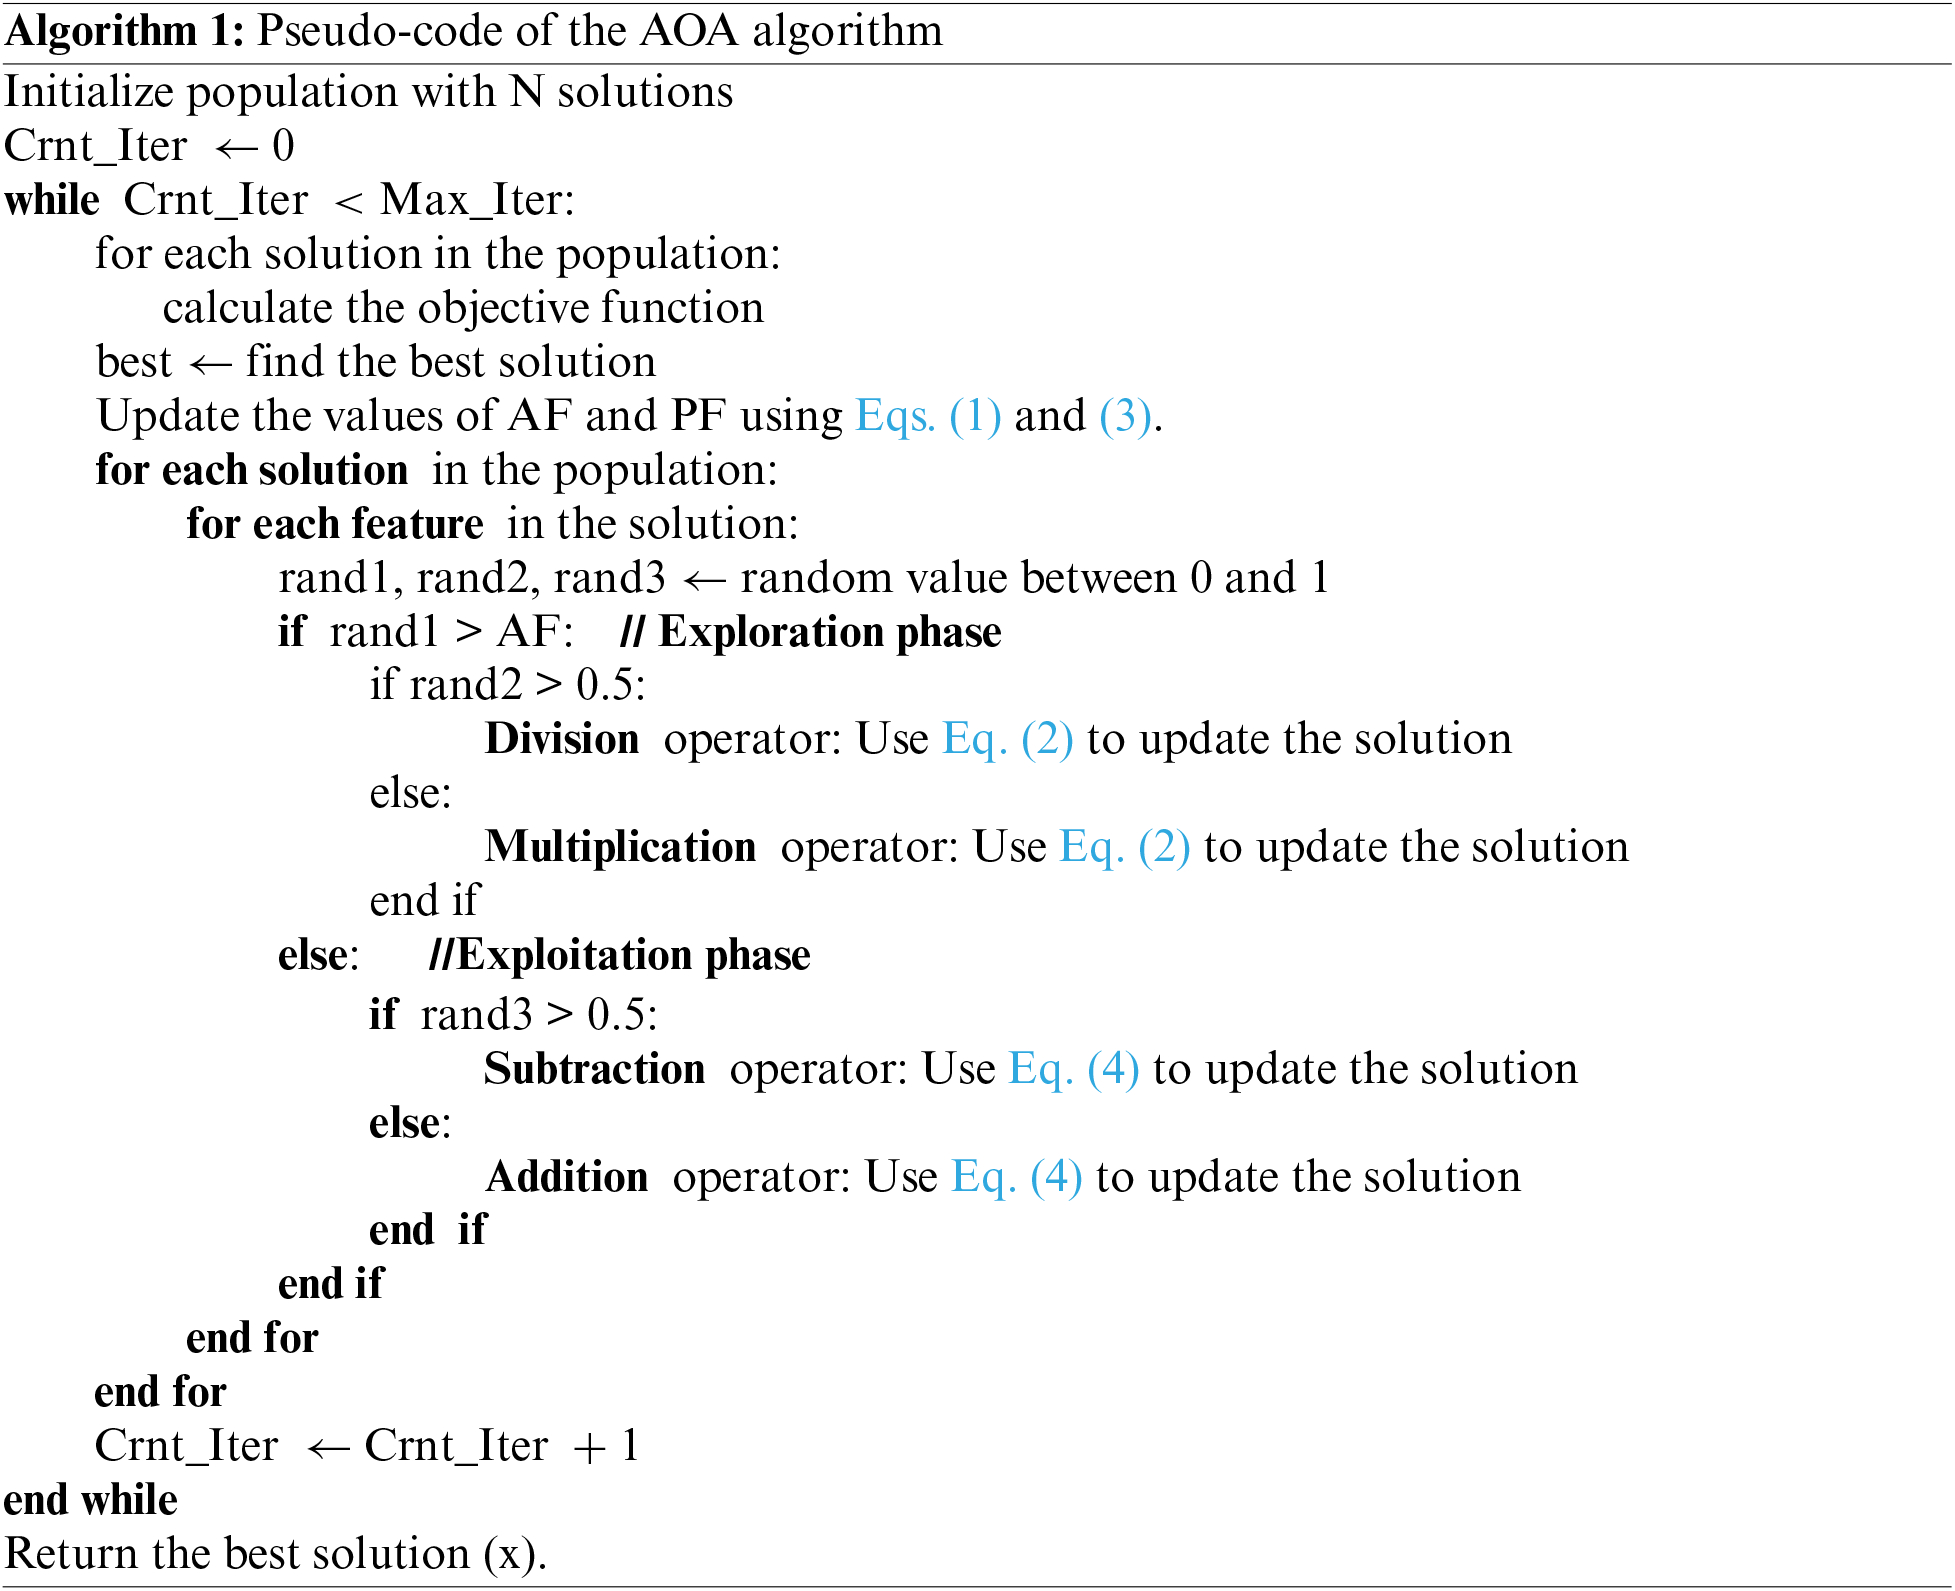
AOA exhibits exploratory activity throughout the exploration phase. As per arithmetic operators, the mathematical computations employing either the D (division) or even the M (multiplication) operator produced highly scattered decisions or values (refer to several reigns), which commit to the exploratory search process. Nevertheless, owing to their significant dispersion compared to other operators (A and S), these operators (M and D) find it difficult to approach the objective. The impact of the distribution values of the various operators is shown using a function built on the foundation of four mathematical operations. Therefore, the scout research discovers a near-optimal solution that could be derived after multiple iterations. Moreover, the exploration operators (M and D) were used in this optimization phase to help the other phase (exploitation) in the research process via better mutual communication.
AOA’s exploration operators randomly determine the search area in different areas and get closer to discovering a better solution based on two primary search strategies (Multiplication and Division search strategy), which are expressed in Eq. (2). This search phase (exploratory search by performing M or D) is determined by the “accelerated function” (AF) presented in Eq. (1) for the condition that any number is greater than AF. The first operator (D) is determined by a random number (r1) less than 0.5 and 2nd operator (M) is neglected until this operator ends its present task. Otherwise, the 2nd operator (M) is activated to conduct the present task rather than D. A stochastic scale coefficient for the element is considered to create additional diversification paths and investigate different areas of the space of research. AOA envisions the following position update equations being offered for exploration games:
where the solution within the next iteration is denoted by
where probability function (PF) represents a coefficient, PF (Crnt_Iter) indicates the function value at the tth iteration, Crnt_Iter signifies the current iteration, and (Max_Iter) signifies the highest number of iterations. α represents a sensitive parameter and describes the accuracy of the exploitation across iterations.
In the exploitation phase, mathematical computations that either used addition (A) or subtraction (S) obtained high-density findings related to the exploitation search process. Nevertheless, these traders (A and S) may quickly reach the target owing to their low spread, unlike other traders. Therefore, despite the low spread of these traders (A and S), they are adept at rapidly approaching the optimal solution, which may be derived after multiple iterations [30]. Moreover, the exploitation operators (A & S) were operated in this phase of research (exploitation research by performing S or A) conditioned by the value of the function AF for the condition that r1 is not higher than the current AFCrnt_Iter value, as shown in Eq. (1). In AOA, the exploitation operators (addition (A) and subtraction (S)) of AOA examine the search area in different dense areas and converge to discover the best solution based on two primary search strategies (search by addition (A) and subtraction (S) strategy) modeled in Eq. (4).
This phase utilizes the search space by executing a depth-first search. In this phase, modeled in Eq. (4), a random number (r3) conditions the 1st operator (S), less than 0.5, and the other operator (A) is neglected until this operator ends its current task. Otherwise, the 2nd operator (A) oversees performing the present task rather than S. These methods in this phase are like the partitions in the previous phase. Nevertheless, exploitative search operators (A and S) frequently try to avoid being stuck inside the local search perimeter. This approach supports exploration search methods to discover the best solution and keep the variety of candidate solutions. The parameter
A dataset consists of instances (rows), entities (columns), and classes. With datasets, the main problem is classifying the data or putting the invisible data into its proper class. The feature selection problem is the name provided for issues in this area. The main goal of the developed problem is the selection of the best dataset which will improve the classification precision or minimize the error rate. Some characteristics in the original dataset are unnecessary, irrelevant, or redundant, which has a detrimental impact on the classifier’s performance [54]. Therefore, feature selection issues are created to enhance the classifier’s performance and condense the size of the data collection.
The solutions to feature selection are only available as binary values since it is a binary optimization problem. A binary version of AOA must be created so that it may be utilized for feature selection problems. The number of features within the dataset is used to determine the length of the vector used to describe a solution in this work, which is a one-dimensional matrix. “1” or “0” stand in for each value in the matrix. If the value is “1,” it means that the associated property is chosen; otherwise, it is “0”.
In AOA after calculating the xij using Eqs. (2) and (4) and limiting the UB and LB to 0 and 1, respectively, the transfer function is used to obtain the binary solutions. AOA was suggested over continuous search space; Thus, we proposed a transfer function for binary AOA which is called S-shaped transfer function [55] to resolve the issues into binary search space as in Eq. (5).
where
The minimization of the number of chosen features while reducing the classification error rate may be thought of as a “multi-objective optimization” problem for feature selection. Each solution is assessed in accordance with the suggested fitness function, which relies on three classifiers to determine the solution’s classification error rate and several features that were specifically chosen for the solution. Both the AOA and modified AOA algorithms assess search performance using the objective function in Eq. (7).
where OF is the objective function to be minimized, γ ∈ [0, 1] represents the importance of classification quality
3.4 Modified AOA (MAOA) Algorithm for Feature Selection
Working with a high-dimensional dataset requires a high search capability of the algorithm, where the complexity of the algorithm may grow exponentially with the dimensionality of the feature space. We present a modification of AOA to search effectively in high-dimensional feature spaces. The modified version of AOA is called MAOA.
In the initialization phase of MAOA, the features are ordered according to their weights and are utilized to initialize the population. The initialization process starts with ranking the features using one of the classifiers presented in Section 4.1 and saving them in the ranked list. Then, the solutions in the population are initialized based on the ranked list, and the features in each solution are set to 1 (selected) from the random features of the top 50% of the ranked list, and the rest are set to random 0 or 1.
The exploitation phase in the MAOA algorithm is supported by local search to enhance the performance by adding significant features and eliminating redundant ones from the features based on their feature ranking. As can be noted in the AOA, exploitation, as in Eq. (4) is based on calculating the subtraction and addition operators of the best position, then a transfer function is applied. We assume that using a local search with a neighborhood strategy around the best position will enhance the findings. Therefore, the neighborhood operators that are proposed to replace the subtraction and addition operators.
Let’s consider the solution is x = [1, 0, 1, 0, 1, 0].
NB Change neighborhood method is used instead of the subtraction operator, which chooses a random feature and modifies its value by the “Not operator”, For instance, assuming that the third feature in Sol, which was chosen at random and has a value of 1, will now be changed to 0 by the not operator. Therefore, the updated solution would be as follows: x* = [1, 0, 0, 0, 1, 0],
NBMove neighborhood method is used instead of the addition operator, which chooses a random feature and moves its location to a new position, For instance, assuming that the randomly selected feature is positioned at the first position in vector x (which equals 1), then it is relocated to a new random position” (let’s suppose the 4th position) as illustrated in Fig. 3.
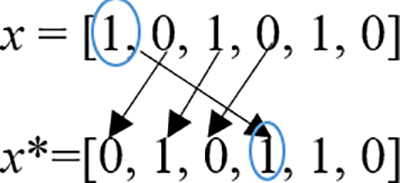
Figure 3: NBMove neighborhood
The updated solution would be as follows: x* = [0, 1, 0, 1, 1, 0].
These neighborhood strategies are applied during each iteration to a randomly selected set of RSN solutions, where RSN represents the number of solutions considered for the local search update. Then, these selected solutions are assessed using the classifier, and the best solution among the neighbors is chosen to progress to the next iteration.
4.1 The Performance of Different Classifiers on the Lung Cancer Dataset without Feature Selection
Since we intended to explore different types of machine learning models for microarray datasets, there are two significant processes for the prediction: The first step is to get the data ready for estimation, and the second is to compare the predicted models. The criteria used to compare the models include the average accuracy of 4-fold cross-validation, precision, recall, and F1_Score. The predictive classifying models used in this study are KNN (“K-Nearest Neighbor”). The machine learning models used for comparison are DT (“Decision Trees”), SVM (“Support Vector Machine”), RF (“Random Forest”), and Naive Bayes (NB) classifiers. These classifiers have been selected based on the time taken to train the model and the performance of the classifiers [57].
As shown in Table 2, the optimum findings were achieved with the K-NN and RF algorithms, and the NB algorithm shows comparable performance and has obtained good and best results in the Lung_Michigan dataset, while the worst results were found with the SVM and DT algorithms. For a clearer view, Fig. 4 shows the column chart for each classifier. The performance measure metrics are ordered from left to right as Average Precision, Recall, Accuracy, and F1_Score.

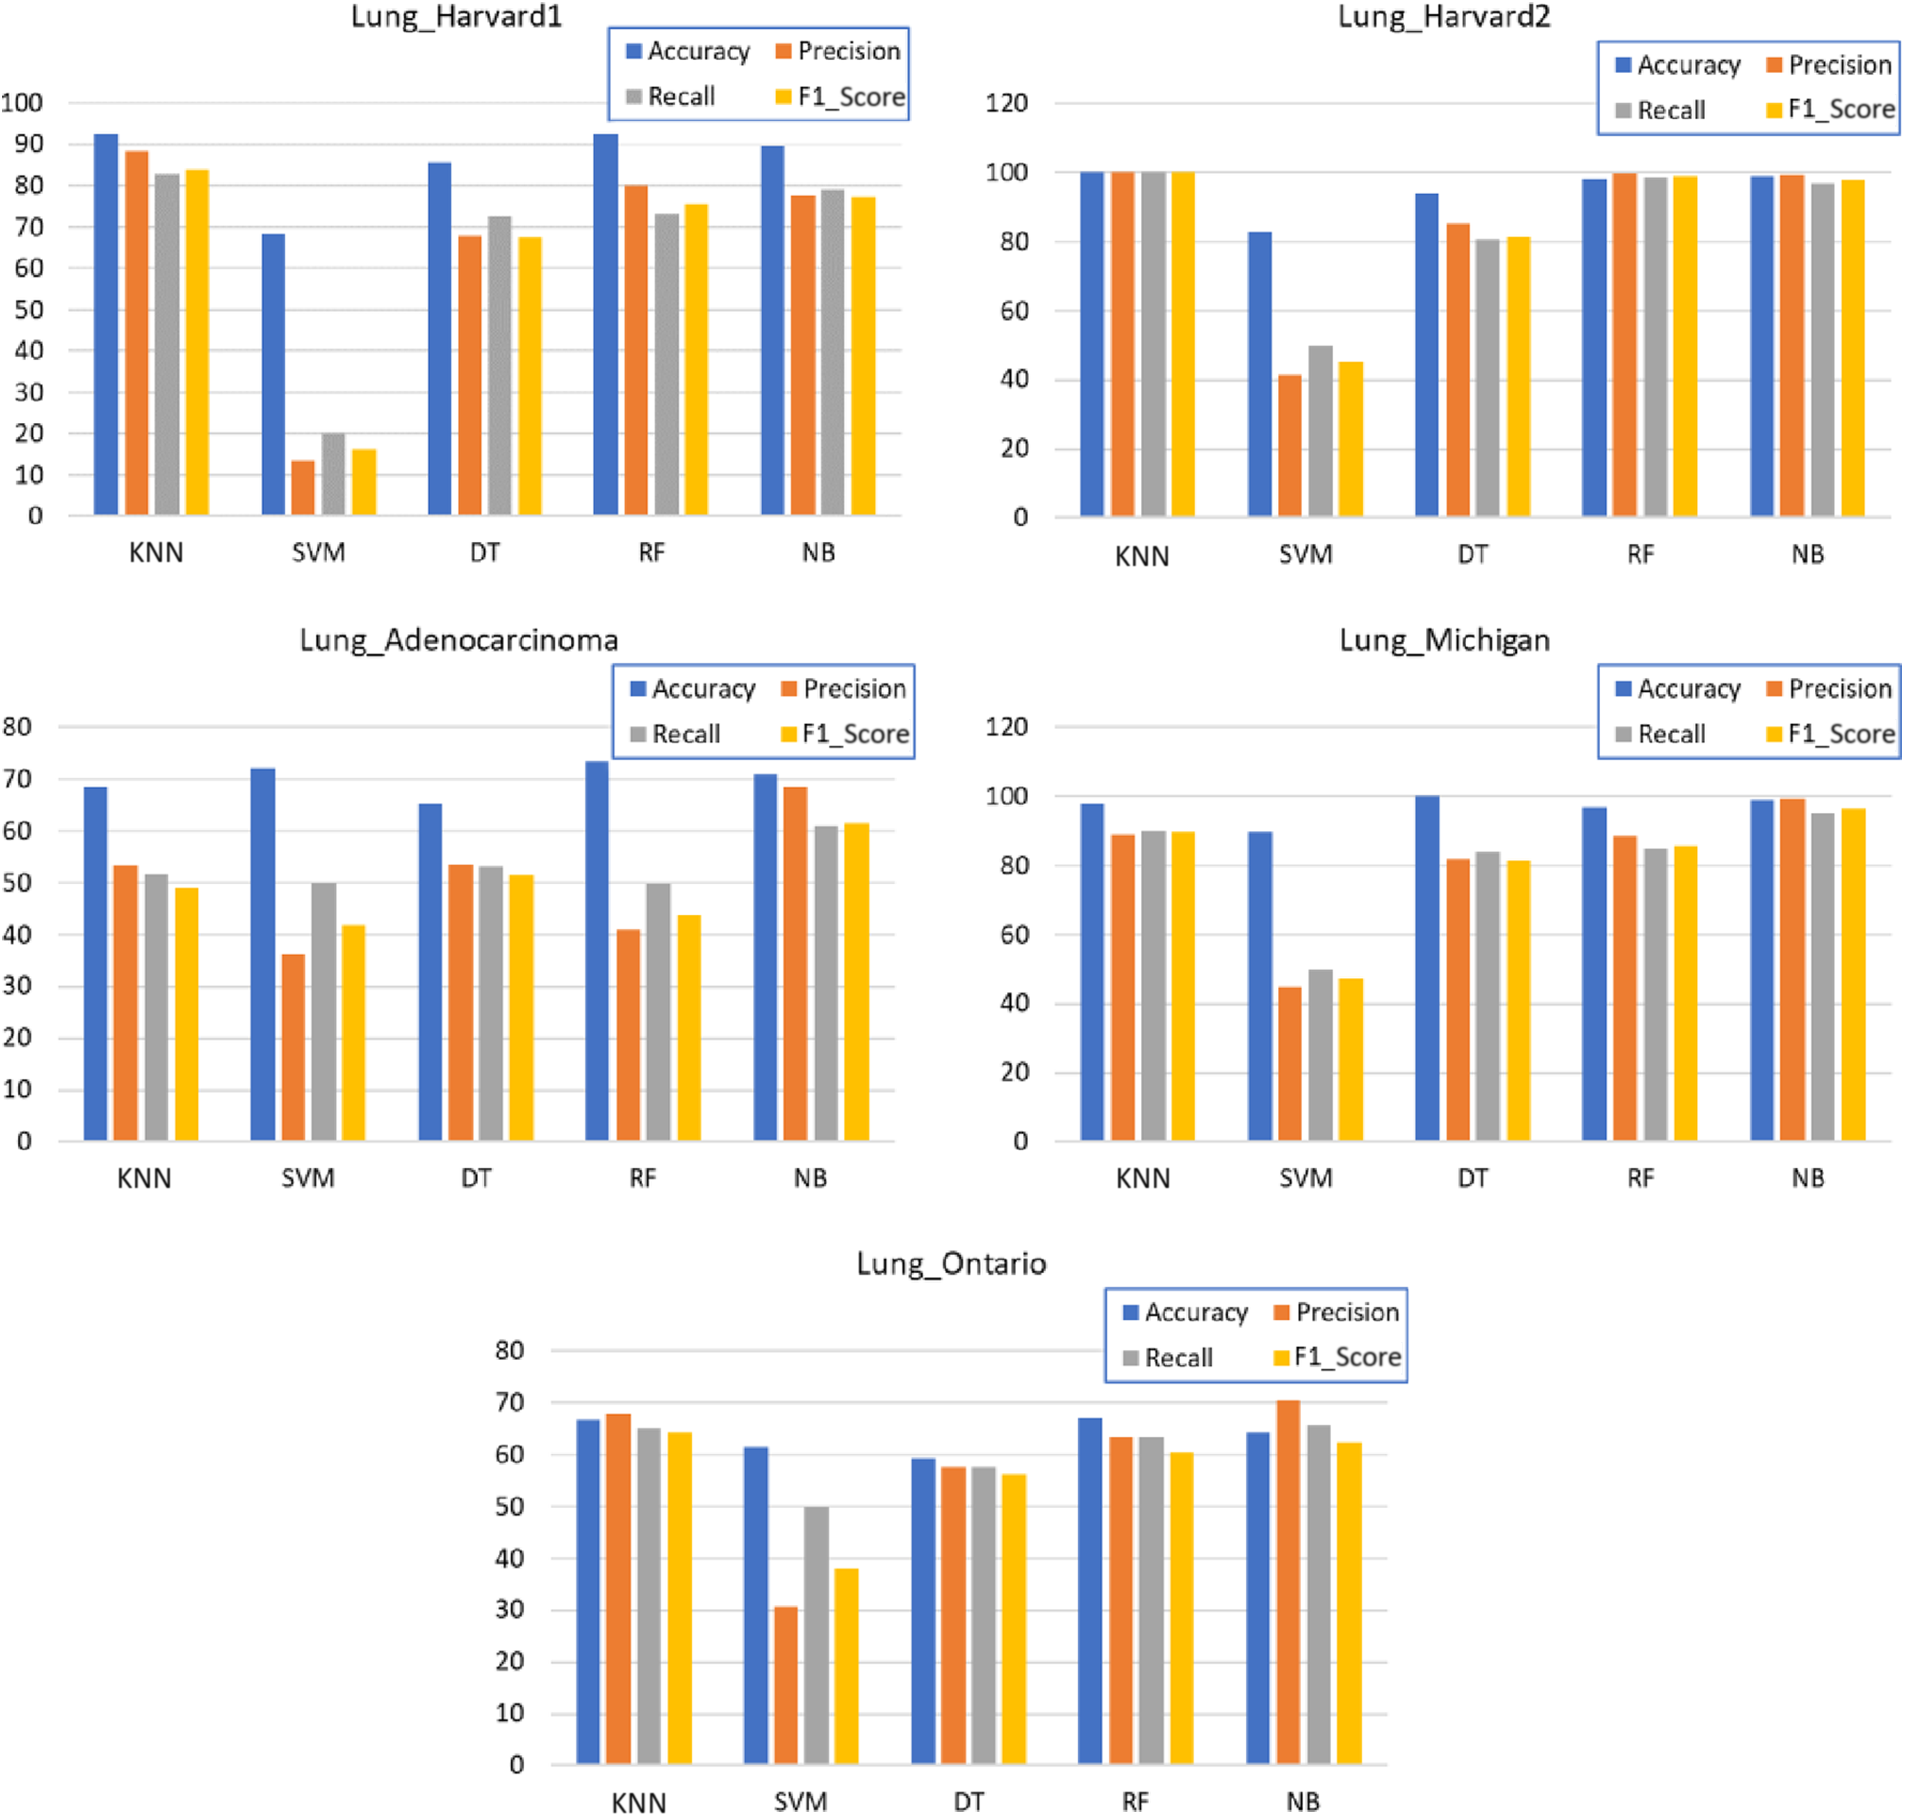
Figure 4: Average cross-validation Accuracy, Precision, Recall, and F1_Score using different classification algorithms
Overall, Fig. 4 shows that KNN has obtained the highest accuracy for 3 datasets out of 5, followed closely in 3 datasets, and outperformed by RF in 2 datasets. In some cases, NB and DT have obtained competitive accuracy scores, while the SVM has shown inferior performance. However, across all 5 datasets, the KNN has obtained higher metrics across all datasets, meaning that it has proven its suitability for the lung cancer classification task, mainly presented by F1_Score and precision. The rest of the classification algorithms have obtained inferior metric scores.
Since we are targeting to perform feature selection and classification simultaneously, we have chosen KNN as the evaluator to assess the selected subset of features and to produce the error rate used in Eq. (7).
4.2 Feature Selection Algorithms
FS-wrapper method and the KNN classifier were both used in several studies, and evaluated using k-fold cross-validation (4 folds used) [58,59]. K-fold cross-validation uses various random subsets of the data set each time. The other parts are likewise randomly chosen for training, while one component is randomly chosen for testing. Each experiment was performed in 10 independent runs for every dataset and the mean of these 10 runs was noted in terms of precision (accuracy), the value of the objective function, number of chosen features, boxplot, the convergence of time, and curves to execution.
The performance of the suggested algorithms and other optimization algorithms are tested on 5 lung cancer datasets. AOA (MAOA) algorithm was evaluated to the original AOA and five well-recognized optimization processes [60], such as PSO (“Particle Swarm Optimization”) [61], GWO (“Grey Wolf Optimizer”) [8], MFO (“Moth-Flame Optimization”) [62], FA (“Firefly Algorithm”) [63] and WOA (“Whale optimization algorithm”) [64].
The parameters settings of AOA and MOA used are:
• α (sensitivity of exploitation, Eq. (3)) = 5.
•
• min (range min of AF, Eq. (1)) = 0.2.
• max (range max of AF, Eq. (1)) = 0.9.
• RSN (the number of solutions to be considered for the update used for MAOA) = 10
To obtain a fair comparison, the algorithms under consideration have been applied with the same number of iterations along with population sizes of 100, and 20, respectively, with Accuracy where Max, Average Accuracy, and standard deviation are presented the Table 3 where the best-obtained results are bolded.

As shown in Table 3, MAOA performs well compared to other population-based algorithms; MAOA surpassed all other optimizers in terms of maximum classification precision across all 5 datasets. The outperformance of MAOA results from its capability to escape local optima with local search using the neighborhood strategy and improvements in initial solution diversity using the AOA solution initialization strategy.
To demonstrate the consistency of the outcomes produced by the suggested MAOA in terms of feature reduction, the boxplot is presented in Fig. 5. The datasets that show differences are plotted, including the Lung_Harvard2, Lung_Adenocarcinoma, and Lung_Ontario datasets. Notably, the Lung_Harvard2 and Lung_Michigan datasets are not included due to their similar results observed across various runs.
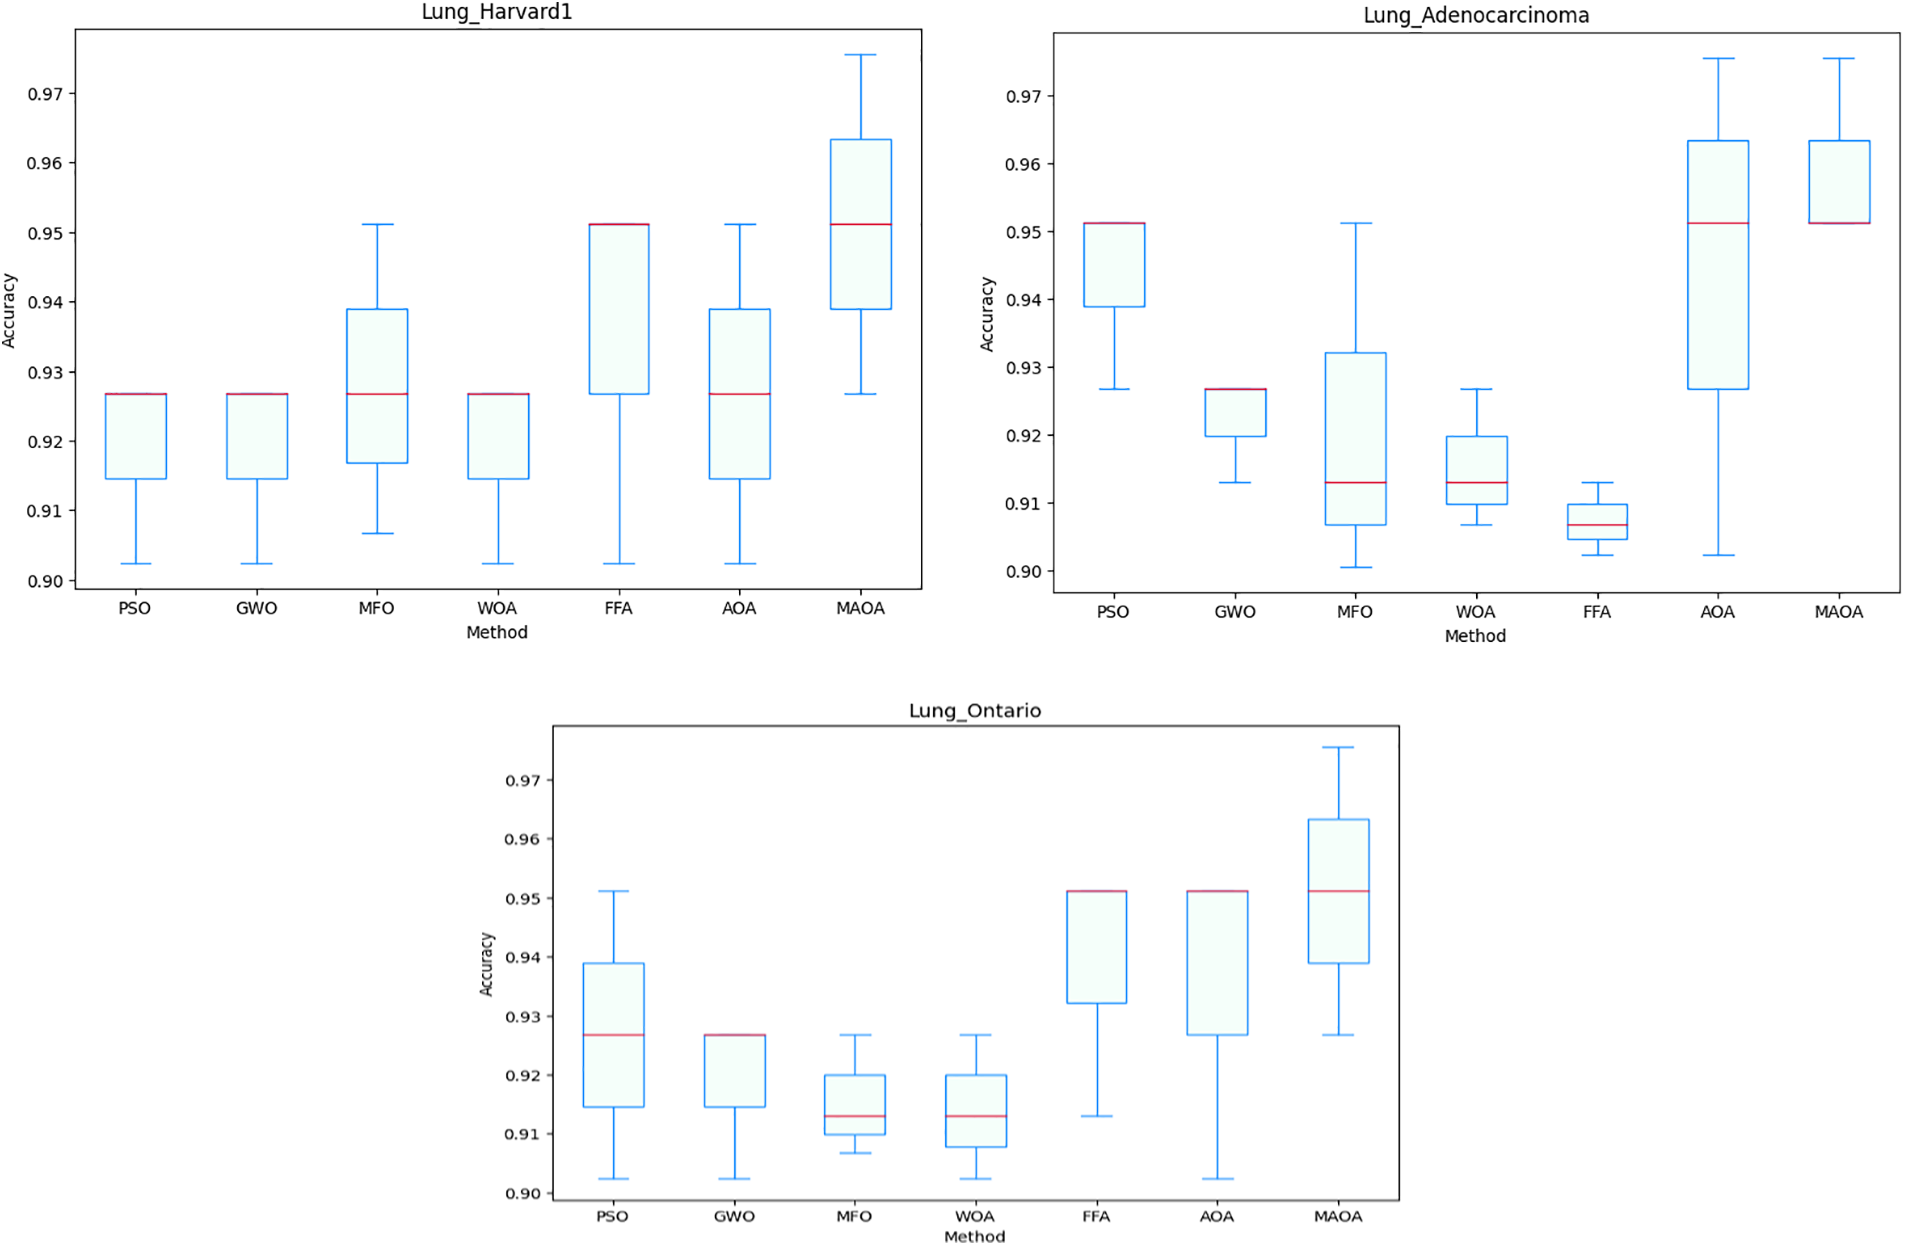
Figure 5: Boxplot of cross-validation accuracy
As shown in Fig. 5, MAOA is superior to the other algorithms, as can be seen in the line in the middle of the box, along with the upper and lower bounds for the three data sets used in the comparisons. The Wilcoxon statistical test was utilized to assess the importance of the reported findings. This test makes it possible to evaluate the importance and robustness of the MAOA compared to the original AOA and other optimization methods. The average classification accuracy across 10 runs was used to define the significance threshold for this test, which was set at 5%.
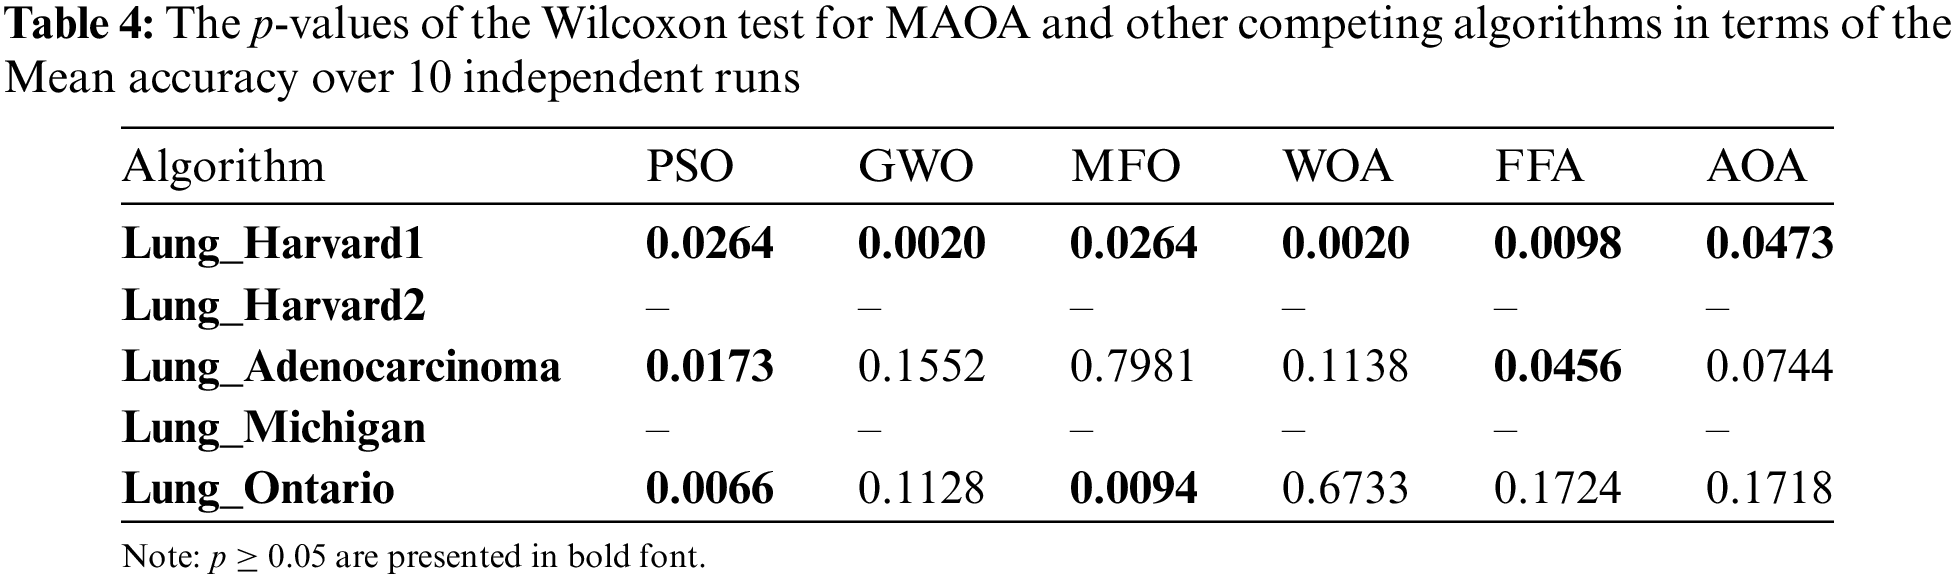
Table 4 shows the values of p achieved from the Wilcoxon trial of all competing methods. If the p-value in this test is below 5%, it means that MAOA shows significant enhancement over competing algorithms. Otherwise, there is no significant enhancement. The p-values for Lung_Harvard2 and Lung_Michigan are indicated as ‘-’ due to the uniform identity of outcomes across all comparators, where accuracy reached 100% (Table 3). This uniformity makes a t-test impractical. The findings in Table 5 show that MAOA shows an important enhancement over other algorithms in terms of average classification accuracy in most datasets. Table 5 shows the minimum, maximum, and mean number of features chosen.

As shown in Table 5, MAOA outperformed AOA and other algorithms in all datasets because it chose significantly fewer features. The superiority of MAOA is validated by a clear variation in all data sets. These results obtained by MAOA emphasize that it perfectly initializes the solutions by choosing the most informative features using the ranking method. Moreover, MAOA highlights its stability to perform very well against high-dimensional datasets. Moreover, with each iteration, the MAOA improves the solutions by selecting the relevant functionalities while removing the irrelevant ones. This increased classification precision. It should be noted that the changes made to the AOA have enhanced its mining and exploration abilities and given it more ability to search on high-dimension datasets.
Table 6 provides a detailed breakdown of the proportion of features preserved under each approach, addressing the aspect of feature complexity reduction.

In Table 6, each cell represents the percentage of features reserved for each algorithm. These percentages show how different algorithms performed in the dimensionality reduction processes for each dataset. MAOA significantly reduces the number of features compared to other algorithms for most datasets.
Furthermore, the training accuracy and the number of selected features in each iteration are utilized to produce the outcomes of the objective functions, as shown in Table 7.

Table 7 summarizes the minimum, mean, and standard deviation. All competing algorithms’ values for the objective function show that the MAOA outperforms them all in terms of generating the minimum values for the objective function. As revealed in Table 7, MAOA outperforms other methods (the best findings are shown in bold). These findings demonstrate the repeatability and stability of the MAOA method on datasets with various degrees of dimension.
To further evaluate and scale the MAOA, Fig. 6 exhibits the mean convergence curves of the competing algorithms across the five data sets, offering a visual representation of how the optimization process evolves over iterations. MAOA continues to exhibit the best objective function values, having the lowest values after 100 iterations. These findings demonstrate the appropriateness of the incorporated amendment to the AIC. Therefore, from the experiments, MAOA always surpasses the original AOA algorithm. This outperformance of the MAOA compared to the AOA derives from the use of a local search algorithm based on two neighborhood operators to enhance the exploitation capacity of the MAOA and prevent it from stagnating in the local optima.
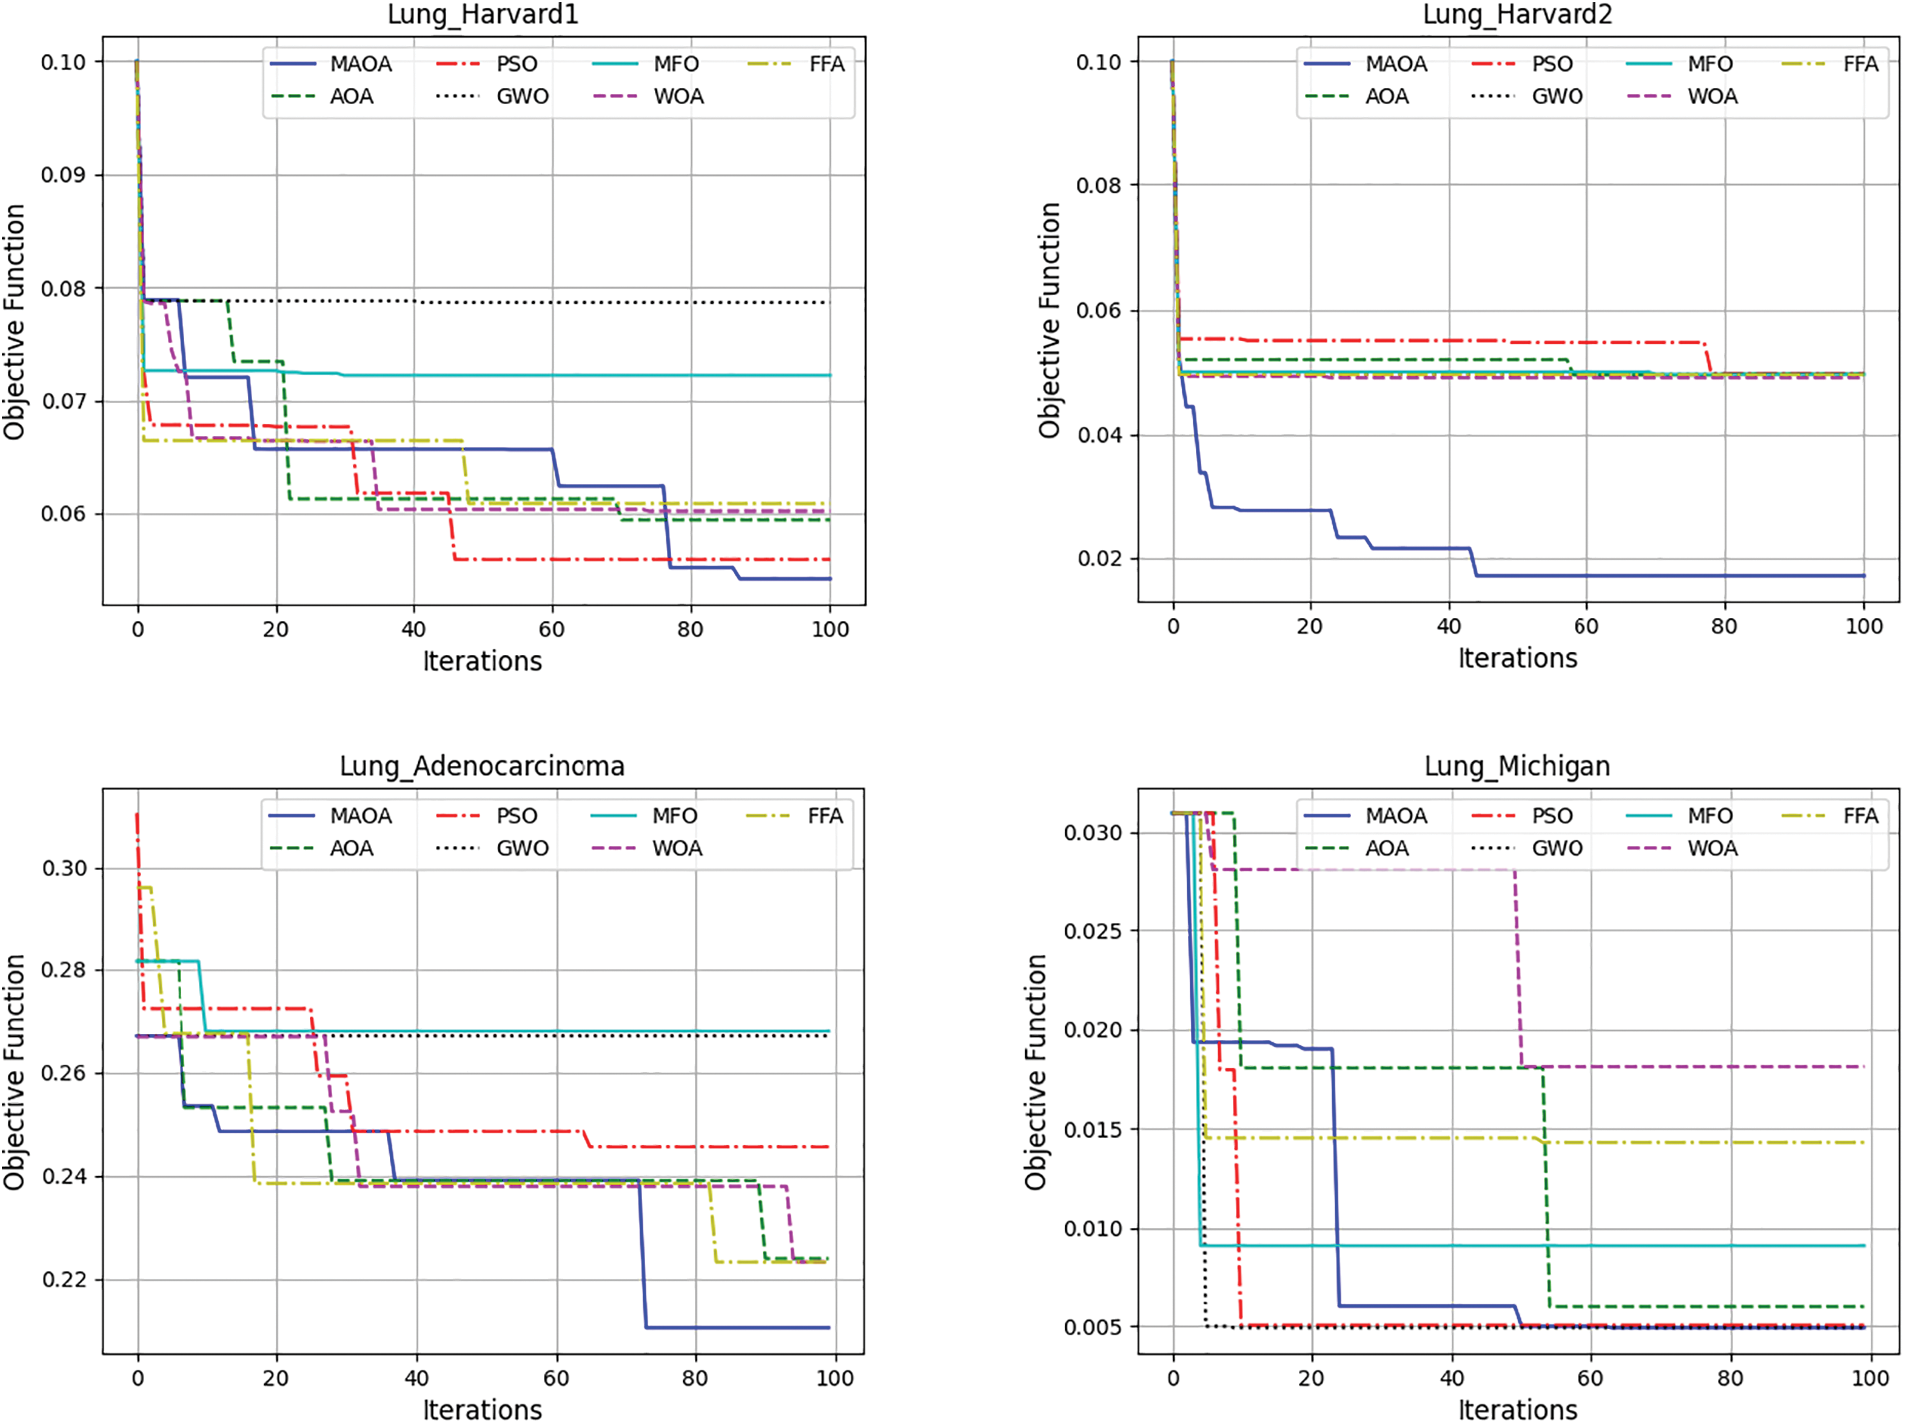
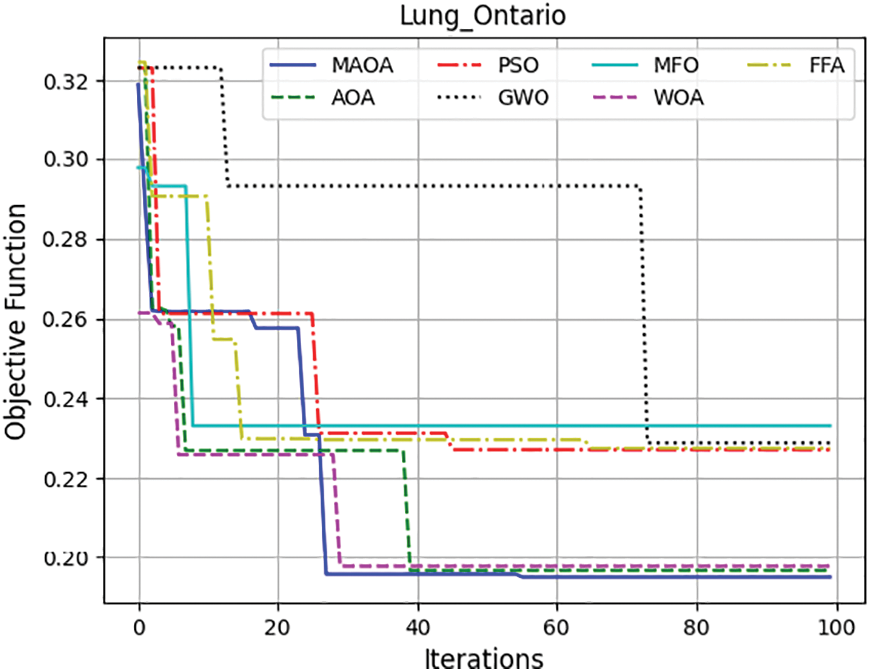
Figure 6: Demonstrates the average convergence curves of the completed algorithms over the 5 datasets
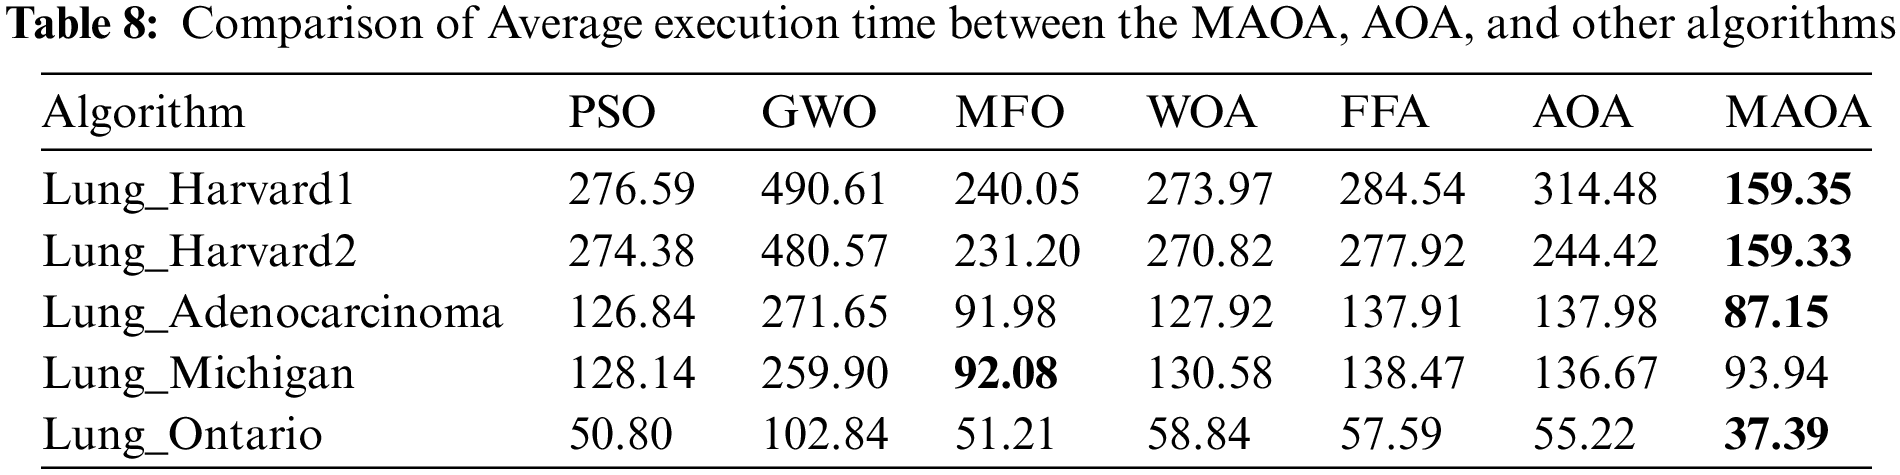
Table 8 displays the average execution times of all competing methods to validate the impact of the improvements on the MAOA’s execution time. It should be observed that the MAOA performed better than all other algorithms in 4 out of 5 datasets in terms of average “execution time”. The MAOA execution time proves to be lower than other algorithms, also, employing the local search algorithm to reduce the selected features, leads to a reduction in the training time of the classifier, which makes MAOA outperform other methods in terms of objective function values, feature reduction, accuracy, and the statistical findings mentioned earlier. This combination of factors highlights the advantageous balance achieved by MAOA.
Lastly, to highlight the significance of the feature selection phase by the MAOA, Table 9 presents a comparison between the MAOA accuracy with feature selection and the accuracy without utilizing the feature selection produced by the best classifier taken from Table 2, which uses the full set of features. The reported findings identify the significance of the feature selection phase, as it has led to improved classification accuracy by reducing the dimensionality of such datasets and eliminating redundant and irrelevant features. Considering all the above findings, MAOA has proven to be a competitor when used to solve feature selection problems on high-dimension datasets.

A modified AOA is suggested in this work for lung cancer gene expression datasets. Working with high-dimensional datasets is challenging due to the high training time of the classifiers. The datasets have been compared using different classification algorithms, such as KNN, SVM, DT, RF, and NB classifiers, to show the effectiveness of each classifier in predicting lung cancer outcomes. The new MAOA was coupled with the KNN classifier in wrapper mode for feature selection problems. The original AOA algorithm was enhanced in two stages. The first stage is the use of an initialization method for producing a good initial population to improve the population quality at an early stage. The second stage entails the expansion of a novel local search method based on two neighborhood operators used to improve original AOA exploitation, gain a suitable balance between exploitation and exploration, and avoid falling into “local optima”. The suggested MAOA was assessed on five datasets and compared to the original AOA and five other recognized optimization algorithms, such as PSO, GWO, MFO, WOA, and FFA. MAOA findings are superior to all methods in terms of convergence rate, classification accuracy, number of selected features, and objective feature values. Furthermore, based on the results of statistical significance, MAOA outperformed and exhibited a substantial enhancement over the other competing methods. The effectiveness of the initialization process in the proposed MAOA depends on the ranking method, which can limit the algorithm’s performance. Exploring different ranking methods will be our future direction. Additionally, we will use the proposed modifications with other population-based algorithms and apply the new MAOA to various types of problems.
Acknowledgement: Many thanks to the Deanship of Scientific Research at the Imam Abdulrahman Bin Faisal University for supporting this research.
Funding Statement: This work was supported by the Deanship of Scientific Research, at Imam Abdulrahman Bin Faisal University. Grant Number: 2019-416-ASCS.
Author Contributions: Mutasem K. Alsmadi designed and implemented the proposed model, carried out the experiments, and wrote the manuscript. The author read and approved the final manuscript.
Availability of Data and Materials: The data openly available in a public repository. The data that support the findings of this study are available for lung adenocarcinoma at https://pubmed.ncbi.nlm.nih.gov/12118244/, and the remaining datasets can be accessed from the DBCRepository at https://leo.ugr.es/elvira/DBCRepository/LungCancer/.
Conflicts of Interest: The author declares that they have no conflicts of interest to report regarding the present study.
References
1. A. I. Kadhim, “Survey on supervised machine learning techniques for automatic text classification,” Artif. Intell. Rev., vol. 52, no. 1, pp. 273–292, 2019. doi: 10.1007/s10462-018-09677-1. [Google Scholar] [CrossRef]
2. P. Mamoshina, A. Vieira, E. Putin, and A. Zhavoronkov, “Applications of deep learning in biomedicine,” Mol. Pharm., vol. 13, no. 5, pp. 1445–1454, 2016. doi: 10.1021/acs.molpharmaceut.5b00982. [Google Scholar] [PubMed] [CrossRef]
3. C. Cao et al., “Deep learning and its applications in biomedicine,” Genom. Proteo. & Bioinform., vol. 16, no. 1, pp. 17–32, 2018. doi: 10.1016/j.gpb.2017.07.003. [Google Scholar] [PubMed] [CrossRef]
4. S. M. D. A. C. Jayatilake and G. U. Ganegoda, “Involvement of machine learning tools in healthcare decision making,” J. Healthc. Eng., vol. 2021, pp. 6679512, 2021. doi: 10.1155/2021/6679512. [Google Scholar] [PubMed] [CrossRef]
5. Y. Yang, H. Chen, A. A. Heidari, and A. H. Gandomi, “Hunger games search: Visions, conception, implementation, deep analysis, perspectives, and towards performance shifts,” Expert. Syst. Appl., vol. 177, no. 8, pp. 114864, 2021. doi: 10.1016/j.eswa.2021.114864. [Google Scholar] [CrossRef]
6. S. Li, H. Chen, M. Wang, A. A. Heidari, and S. Mirjalili, “Slime mould algorithm: A new method for stochastic optimization,” Future Gener. Comput. Syst., vol. 111, pp. 300–323, 2020. doi: 10.1016/j.future.2020.03.055. [Google Scholar] [CrossRef]
7. G. G. Wang, “Moth search algorithm: A bio-inspired metaheuristic algorithm for global optimization problems,” Memetic Comput., vol. 10, no. 2, pp. 151–164, 2018. doi: 10.1007/s12293-016-0212-3. [Google Scholar] [CrossRef]
8. S. Mirjalili, S. M. Mirjalili, and A. Lewis, “Grey wolf optimizer,” Adv. Eng. Softw., vol. 69, pp. 46–61, 2014. doi: 10.1016/j.advengsoft.2013.12.007. [Google Scholar] [CrossRef]
9. I. Ahmadianfar, A. A. Heidari, A. H. Gandomi, X. Chu, and H. Chen, “RUN beyond the metaphor: An efficient optimization algorithm based on Runge Kutta method,” Expert. Syst. Appl., vol. 181, no. 21, pp. 115079, 2021. doi: 10.1016/j.eswa.2021.115079. [Google Scholar] [CrossRef]
10. G. G. Wang, S. Deb, and Z. Cui, “Monarch butterfly optimization,” Neural Comput. Appl., vol. 31, no. 7, pp. 1995–2014, 2019. doi: 10.1007/s00521-015-1923-y. [Google Scholar] [CrossRef]
11. I. Ahmadianfar, A. A. Heidari, S. Noshadian, H. Chen, and A. H. Gandomi, “INFO: An efficient optimization algorithm based on weighted mean of vectors,” Expert. Syst. Appl., vol. 195, no. 12, pp. 116516, 2022. doi: 10.1016/j.eswa.2022.116516. [Google Scholar] [CrossRef]
12. A. A. Heidari, S. Mirjalili, H. Faris, I. Aljarah, M. Mafarja and H. Chen, “Harris hawks optimization: Algorithm and applications,” Future Gener. Comput. Syst., vol. 97, pp. 849–872, 2019. doi: 10.1016/j.future.2019.02.028. [Google Scholar] [CrossRef]
13. X. Wang, L. Wang, and P. Zheng, “SC-dynamic R-CNN: A self-calibrated dynamic R-CNN model for lung cancer lesion detection,” Comput. Math. Methods Med., vol. 2022, pp. 1–9, 2022. doi: 10.1155/2022/9452157. [Google Scholar] [PubMed] [CrossRef]
14. T. Sathiya, R. Reenadevi, and B. Sathiyabhama, “Lung nodule classification in CT images using grey wolf optimization algorithm,” Ann. Romanian Soc. Cell Bio., vol. 25, no. 6, pp. 1495–1511, 2021. [Google Scholar]
15. E. H. Houssein, H. N. Hassan, N. A. Samee, and M. M. Jamjoom, “A novel hybrid runge kutta optimizer with support vector machine on gene expression data for cancer classification,” Diagnostics, vol. 13, no. 9, pp. 1621, 2023. doi: 10.3390/diagnostics13091621. [Google Scholar] [PubMed] [CrossRef]
16. S. Murthy and P. M. K. Prasad, “Adversarial transformer network for classification of lung cancer disease from CT scan images,” Biomed. Signal Process. Control, vol. 86, no. 1, pp. 105327, 2023. doi: 10.1016/j.bspc.2023.105327. [Google Scholar] [CrossRef]
17. E. H. Houssein, M. E. Hosney, W. M. Mohamed, A. A. Ali, and E. M. Younis, “Fuzzy-based hunger games search algorithm for global optimization and feature selection using medical data,” Neural Comput. Appl., vol. 35, no. 7, pp. 5251–5275, 2023. doi: 10.1007/s00521-022-07916-9. [Google Scholar] [PubMed] [CrossRef]
18. Z. Guo, L. Xu, Y. Si, and N. Razmjooy, “Novel computer-aided lung cancer detection based on convolutional neural network-based and feature-based classifiers using metaheuristics,” Int. J. Imaging Syst. Technol., vol. 31, no. 4, pp. 1954–1969, 2021. doi: 10.1002/ima.22608. [Google Scholar] [CrossRef]
19. J. Ferlay et al., Global Cancer Observatory: Cancer Today. Lyon, France: International Agency for Research on Cancer, 2022. Accessed: Jul. 27, 2022. [Online]. Available: https://gco.iarc.fr/today. [Google Scholar]
20. C. de Martel, D. Georges, F. Bray, J. Ferlay, and G. M. Clifford, “Global burden of cancer attributable to infections in 2018: A worldwide incidence analysis,” Lancet Glob. Health, vol. 8, no. 2, pp. e180–e190, 2020. doi: 10.1016/S2214-109X(19)30488-7. [Google Scholar] [PubMed] [CrossRef]
21. W. H. Organization, Assessing National Capacity for the Prevention and Control of Noncommunicable Diseases: Report of the 2019 Global Survey, 2019. Accessed: Feb. 14, 2023. [Online]. Available: https://www.who.int/publications/i/item/9789240002319 [Google Scholar]
22. P. Guan, D. Huang, M. He, and B. Zhou, “Lung cancer gene expression database analysis incorporating prior knowledge with support vector machine-based classification method,” J. Exp. Clin. Cancer Res., vol. 28, no. 1, pp. 1–7, 2009. doi: 10.1186/1756-9966-28-103. [Google Scholar] [PubMed] [CrossRef]
23. D. G. Beer et al., “Gene-expression profiles predict survival of patients with lung adenocarcinoma,” Nature Med., vol. 8, no. 8, pp. 816–824, 2002. doi: 10.1038/nm733. [Google Scholar] [PubMed] [CrossRef]
24. S. Ramaswamy, K. N. Ross, E. S. Lander, and T. R. Golub, “A molecular signature of metastasis in primary solid tumors,” Nat. Genet., vol. 33, no. 1, pp. 49–54, 2003. doi: 10.1038/ng1060. [Google Scholar] [PubMed] [CrossRef]
25. G. Piatetsky-Shapiro and P. Tamayo, “Microarray data mining: Facing the challenges,” ACM SIGKDD Explor. Newsl., vol. 5, no. 2, pp. 1–5, 2003. doi: 10.1145/980972.980974. [Google Scholar] [CrossRef]
26. I. Guyon, S. Gunn, M. Nikravesh, and L. A. Zadeh, Feature Extraction: Foundations and Applications, Cham, Switzerland: Springer, vol. 207, 2008. [Google Scholar]
27. B. Remeseiro and V. Bolon-Canedo, “A review of feature selection methods in medical applications,” Comput. Biol. Med., vol. 112, no. 4, pp. 103375, 2019. doi: 10.1016/j.compbiomed.2019.103375. [Google Scholar] [PubMed] [CrossRef]
28. G. L. Kumari and N. N. M. Rao, “An efficient PSO based ensemble classification model on high dimensional datasets,” Int. J. Soft Comput., vol. 8, no. 4, pp. 1–11, 2017. doi: 10.5121/ijsc.2017.8401. [Google Scholar] [CrossRef]
29. S. S. Shreem, S. Abdullah, M. Z. A. Nazri, and M. Alzaqebah, “Hybridizing ReliefF, MRMR filters and GA wrapper approaches for gene selection,” J. Theor. Appl. Inform. Technol., vol. 46, no. 2, pp. 1034–1039, 2012. [Google Scholar]
30. L. Abualigah, A. Diabat, S. Mirjalili, M. Abd Elaziz, and A. H. Gandomi, “The arithmetic optimization algorithm,” Comput. Methods Appl. Mech. Eng., vol. 376, no. 2, pp. 113609, 2021. doi: 10.1016/j.cma.2020.113609. [Google Scholar] [CrossRef]
31. M. Alwohaibi, M. Alzaqebah, N. M. Alotaibi, A. M. Alzahrani, and M. Zouch, “A hybrid multi-stage learning technique based on brain storming optimization algorithm for breast cancer recurrence prediction,” J. King Saud Univ.-Comput. Inf. Sci., vol. 34, no. 8, pp. 5192–5203, 2022. doi: 10.1016/j.jksuci.2021.05.004. [Google Scholar] [CrossRef]
32. M. Alzaqebah et al., “Hybrid feature selection method based on particle swarm optimization and adaptive local search method,” Int. J. Elect. Comput. Eng., vol. 11, no. 3, pp. 2414, 2021. doi: 10.11591/ijece.v11i3.pp2414-2422. [Google Scholar] [CrossRef]
33. S. Sazzed, “Feature selection in gene expression profile employing relevancy and redundancy measures and binary whale optimization algorithm (BWOA),” in Int. Conf. Adv. Data Min. Appl., Sydney, Australia, Springer, 2022, pp. 45–60. [Google Scholar]
34. C. Y. Lee, Y. J. Hsieh, and T. A. Le, “Induction motor fault classification based on combined genetic algorithm with symmetrical uncertainty method for feature selection task,” Mathematics, vol. 10, no. 2, pp. 230, 2022. doi: 10.3390/math10020230. [Google Scholar] [CrossRef]
35. M. Alzaqebah, N. Alrefai, E. A. Ahmed, S. Jawarneh, and M. K. Alsmadi, “Neighborhood search methods with moth optimization algorithm as a wrapper method for feature selection problems,” Int. J. Elect. & Comput. Eng., vol. 10, no. 4, pp. 3672, 2020. doi: 10.11591/ijece.v10i4.pp3672-3684. [Google Scholar] [CrossRef]
36. F. Bray, J. Ferlay, I. Soerjomataram, R. L. Siegel, L. A. Torre and A. Jemal, “Global cancer statistics 2018: GLOBOCAN estimates of incidence and mortality worldwide for 36 cancers in 185 countries,” CA: A Cancer J. Clinic., vol. 68, no. 6, pp. 394–424, 2018. doi: 10.3322/caac.21492. [Google Scholar] [PubMed] [CrossRef]
37. D. Planchard et al., “Metastatic non-small cell lung cancer: ESMO clinical practice guidelines for diagnosis, treatment and follow-up,” Ann. Oncol., vol. 29, pp. iv192–iv237, 2018. doi: 10.1093/annonc/mdy275. [Google Scholar] [PubMed] [CrossRef]
38. N. C. Institute, Non-Small Cell Lung Cancer Treatment (PDQ®)–Patient Version. USA: National Institutes of Health, 2021. Accessed: Feb. 10, 2023. [Online]. Available: https://www.cancer.gov/types/lung/patient/non-small-cell-lung-treatment-pdq [Google Scholar]
39. P. Shi, S. Ray, Q. Zhu, and M. A. Kon, “Top scoring pairs for feature selection in machine learning and applications to cancer outcome prediction,” BMC Bioinform., vol. 12, no. 1, pp. 1–15, 2011. doi: 10.1186/1471-2105-12-375. [Google Scholar] [PubMed] [CrossRef]
40. A. Bhattacharjee et al., “Classification of human lung carcinomas by mRNA expression profiling reveals distinct adenocarcinoma subclasses,” Proc. Nat. Acad. Sci. USA, vol. 98, no. 24, pp. 13790–13795, 2001. doi: 10.1073/pnas.191502998. [Google Scholar] [PubMed] [CrossRef]
41. X. Yu et al., “Synergizing the enhanced RIME with fuzzy K-nearest neighbor for diagnose of pulmonary hypertension,” Comput. Biol. Med., vol. 165, no. 2023, pp. 107408, 2023. doi: 10.1016/j.compbiomed.2023.107408. [Google Scholar] [PubMed] [CrossRef]
42. Y. Zhang, D. Gong, Y. Hu, and W. Zhang, “Feature selection algorithm based on bare bones particle swarm optimization,” Neurocomputing, vol. 148, no. 5, pp. 150–157, 2015. doi: 10.1016/j.neucom.2012.09.049. [Google Scholar] [CrossRef]
43. C. S. Yang, L. Y. Chuang, Y. J. Chen, and C. H. Yang, “Feature selection using memetic algorithms,” in 2008 Third Int. Conf. Converg. Hybrid Inform. Technol., Busan, Korea, IEEE, 2008, vol. 1, pp. 416–423. [Google Scholar]
44. M. M. Kabir, M. Shahjahan, and K. Murase, “A new hybrid ant colony optimization algorithm for feature selection,” Expert. Syst. Appl., vol. 39, no. 3, pp. 3747–3763, 2012. doi: 10.1016/j.eswa.2011.09.073. [Google Scholar] [CrossRef]
45. C. L. Huang and J. F. Dun, “A distributed PSO-SVM hybrid system with feature selection and parameter optimization,” Appl. Soft Comput., vol. 8, no. 4, pp. 1381–1391, 2008. doi: 10.1016/j.asoc.2007.10.007. [Google Scholar] [CrossRef]
46. X. Wang, J. Yang, X. Teng, W. Xia, and R. Jensen, “Feature selection based on rough sets and particle swarm optimization,” Pattern Recognit. Lett., vol. 28, no. 4, pp. 459–471, 2007. doi: 10.1016/j.patrec.2006.09.003. [Google Scholar] [CrossRef]
47. L. Y. Chuang, H. W. Chang, C. J. Tu, and C. H. Yang, “Improved binary PSO for feature selection using gene expression data,” Comput. Biol. Chem., vol. 32, no. 1, pp. 29–38, 2008. doi: 10.1016/j.compbiolchem.2007.09.005. [Google Scholar] [PubMed] [CrossRef]
48. W. Ali and F. Saeed, “Hybrid filter and genetic algorithm-based feature selection for improving cancer classification in high-dimensional microarray data,” Processes, vol. 11, no. 2, pp. 562, 2023. doi: 10.3390/pr11020562. [Google Scholar] [CrossRef]
49. T. Elemam and M. Elshrkawey, “A highly discriminative hybrid feature selection algorithm for cancer diagnosis,” The Scitif. World J., vol. 2022, no. 3, pp. 1–15, 2022. doi: 10.1155/2022/1056490. [Google Scholar] [PubMed] [CrossRef]
50. H. Almazrua and H. Alshamlan, “A comprehensive survey of recent hybrid feature selection methods in cancer microarray gene expression data,” IEEE Access, vol. 10, pp. 71427–71449, 2022. doi: 10.1109/ACCESS.2022.3185226. [Google Scholar] [CrossRef]
51. M. Vahmiyan, M. Kheirabadi, and E. Akbari, “Feature selection methods in microarray gene expression data: A systematic mapping study,” Neural Comput. Appl., vol. 34, no. 22, pp. 19675–19702, 2022. doi: 10.1007/s00521-022-07661-z. [Google Scholar] [CrossRef]
52. G. J. Gordon et al., “Translation of microarray data into clinically relevant cancer diagnostic tests using gene expression ratios in lung cancer and mesothelioma,” Cancer Res., vol. 62, no. 17, pp. 4963–4967, 2002. [Google Scholar] [PubMed]
53. D. A. Wigle et al., “Molecular profiling of non-small cell lung cancer and correlation with disease-free survival,” Cancer Res., vol. 62, no. 11, pp. 3005–3008, 2002. [Google Scholar] [PubMed]
54. H. Liu and H. Motoda, Feature Extraction, Construction and Selection: A Data Mining Perspective. Springer New York: Springer Science & Business Media, 1998. [Google Scholar]
55. A. W. Mohamed and H. Z. Sabry, “Constrained optimization based on modified differential evolution algorithm,” Inf. Sci., vol. 194, no. 6, pp. 171–208, 2012. doi: 10.1016/j.ins.2012.01.008. [Google Scholar] [CrossRef]
56. E. Emary, H. M. Zawbaa, and A. E. Hassanien, “Binary ant lion approaches for feature selection,” Neurocomputing, vol. 213, no. 6, pp. 54–65, 2016. doi: 10.1016/j.neucom.2016.03.101. [Google Scholar] [CrossRef]
57. P. Thanh Noi and M. Kappas, “Comparison of random forest, k-nearest neighbor, and support vector machine classifiers for land cover classification using sentinel-2 imagery,” Sensors, vol. 18, no. 1, pp. 18, 2017. doi: 10.3390/s18010018. [Google Scholar] [PubMed] [CrossRef]
58. M. Tubishat et al., “Dynamic salp swarm algorithm for feature selection,” Expert. Syst. Appl., vol. 164, no. 1, pp. 113873, 2021. doi: 10.1016/j.eswa.2020.113873. [Google Scholar] [CrossRef]
59. A. E. Hegazy, M. Makhlouf, and G. S. El-Tawel, “Feature selection using chaotic salp swarm algorithm for data classification,” Arab. J. Sci. Eng., vol. 44, no. 4, pp. 3801–3816, 2019. doi: 10.1007/s13369-018-3680-6. [Google Scholar] [CrossRef]
60. R. A. Khurma, I. Aljarah, A. Sharieh, and S. Mirjalili, “Evolopy-fs: An open-source nature-inspired optimization framework in python for feature selection,” in S. Mirjalili, H. Faris, and I. Aljarah (Eds.Evolutionary Machine Learning Techniques: Algorithms and Applications. Springer: Springer, 2022, pp. 131–173. [Google Scholar]
61. J. Kennedy and R. Eberhart, “Particle swarm optimization,” in Proc. ICNN’95-Int. Conf. Neural Netw., Perth, Australia, IEEE, 1995, vol. 4, pp. 1942–1948. [Google Scholar]
62. S. Mirjalili, “Moth-flame optimization algorithm: A novel nature-inspired heuristic paradigm,” Knowl.-Based Syst., vol. 89, pp. 228–249, 2015. doi: 10.1016/j.knosys.2015.07.006. [Google Scholar] [CrossRef]
63. A. H. Gandomi, X. S. Yang, and A. H. Alavi, “Mixed variable structural optimization using firefly algorithm,” Comput. & Struct., vol. 89, no. 23–24, pp. 2325–2336, 2011. doi: 10.1016/j.compstruc.2011.08.002. [Google Scholar] [CrossRef]
64. S. Mirjalili and A. Lewis, “The whale optimization algorithm,” Adv. Eng. Softw., vol. 95, no. 12, pp. 51–67, 2016. doi: 10.1016/j.advengsoft.2016.01.008. [Google Scholar] [CrossRef]
Cite This Article
 Copyright © 2024 The Author(s). Published by Tech Science Press.
This work is licensed under a Creative Commons Attribution 4.0 International License , which permits unrestricted use, distribution, and reproduction in any medium, provided the original work is properly cited.
 Downloads
 Citation Tools